

ScalpingX TG Channel
3.9k Posts

ScalpingX TG Channel
Report
Block User
1 scalper with unconventional mindset, loves big risks with big profits. Don't ask about the leverage I use, it's always maximum!
0 Following
10 Followers
9 Liked
Posts
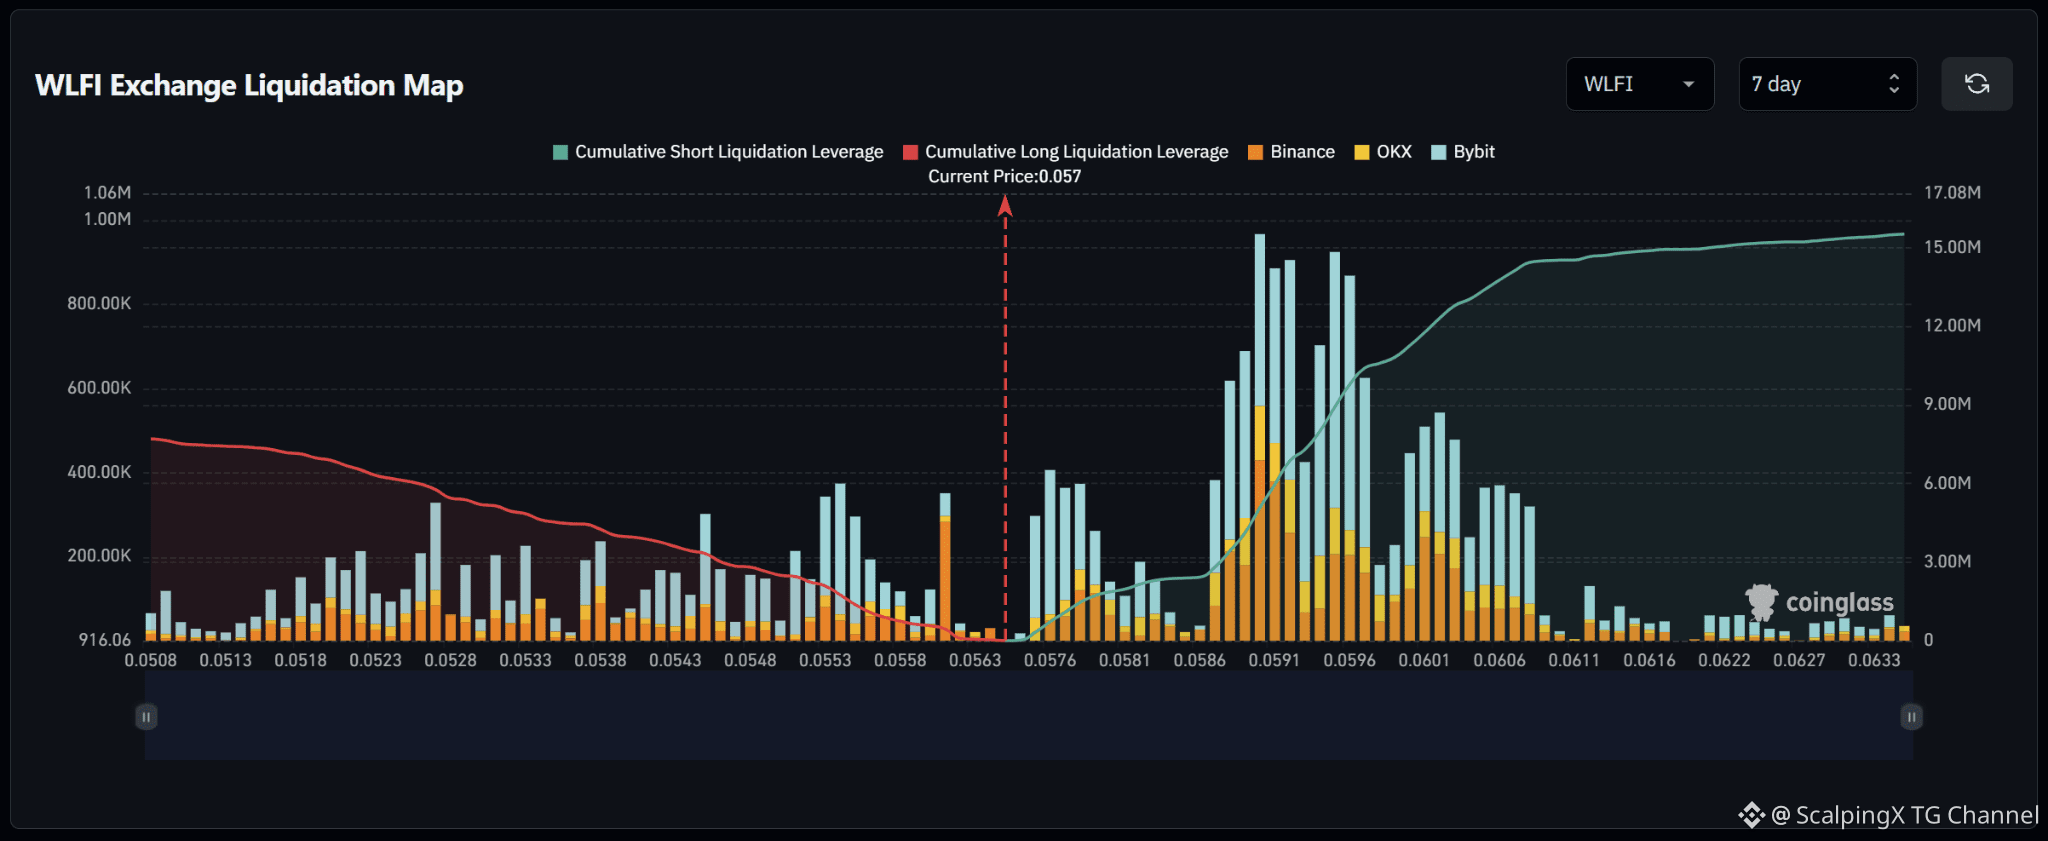
$WLFI – Liquidation Map (7 Days) – Current Price 0.057 🔎 The 7-day liquidation map shows roughly 15–16 million USD in short liquidations above the current price, significantly exceeding approximately 7–8 million USD in long liquidations below. The liquidity structure therefore clearly favors the upside, with around twice as much cumulative liquidity above the market. 📉 Below the market, long-liquidation liquidity is relatively dispersed. Notable clusters appear around 0.0552–0.0555 with a bar near 0.35–0.37 million USD, while the 0.0525–0.0545 area contains several smaller pockets around 0.15–0.30 million USD. Losing 0.0563 would shift attention toward 0.0555–0.0552 and then 0.0545–0.0538. 📈 Above the market, short-liquidation liquidity is heavily concentrated across 0.0586–0.0607. The strongest cluster sits around 0.0589–0.0596 with several bars near 0.7–0.95 million USD, while 0.0600–0.0604 also contains multiple bars around 0.45–0.55 million USD. This is currently the most prominent liquidity band on the map. 🧭 The broader setup clearly favors the upside because short-liquidation exposure above is roughly twice as large. Breaking above 0.0580 would expose 0.0589–0.0596; if momentum continues, 0.0600–0.0607 becomes the next major liquidity magnet. Losing 0.0563 would instead increase the probability of a sweep toward 0.0555–0.0552.
$WLFI – Liquidation Map (7 Days) – Current Price 0.057 🔎 The 7-day liquidation map shows roughly 15–16 million USD in short liquidations above the current price, significantly exceeding approximately 7–8 million USD in long liquidations below. The liquidity structure therefore clearly favors the upside, with around twice as much cumulative liquidity above the market. 📉 Below the market, long-liquidation liquidity is relatively dispersed. Notable clusters appear around 0.0552–0.0555 with a bar near 0.35–0.37 million USD, while the 0.0525–0.0545 area contains several smaller pockets around 0.15–0.30 million USD. Losing 0.0563 would shift attention toward 0.0555–0.0552 and then 0.0545–0.0538. 📈 Above the market, short-liquidation liquidity is heavily concentrated across 0.0586–0.0607. The strongest cluster sits around 0.0589–0.0596 with several bars near 0.7–0.95 million USD, while 0.0600–0.0604 also contains multiple bars around 0.45–0.55 million USD. This is currently the most prominent liquidity band on the map. 🧭 The broader setup clearly favors the upside because short-liquidation exposure above is roughly twice as large. Breaking above 0.0580 would expose 0.0589–0.0596; if momentum continues, 0.0600–0.0607 becomes the next major liquidity magnet. Losing 0.0563 would instead increase the probability of a sweep toward 0.0555–0.0552.
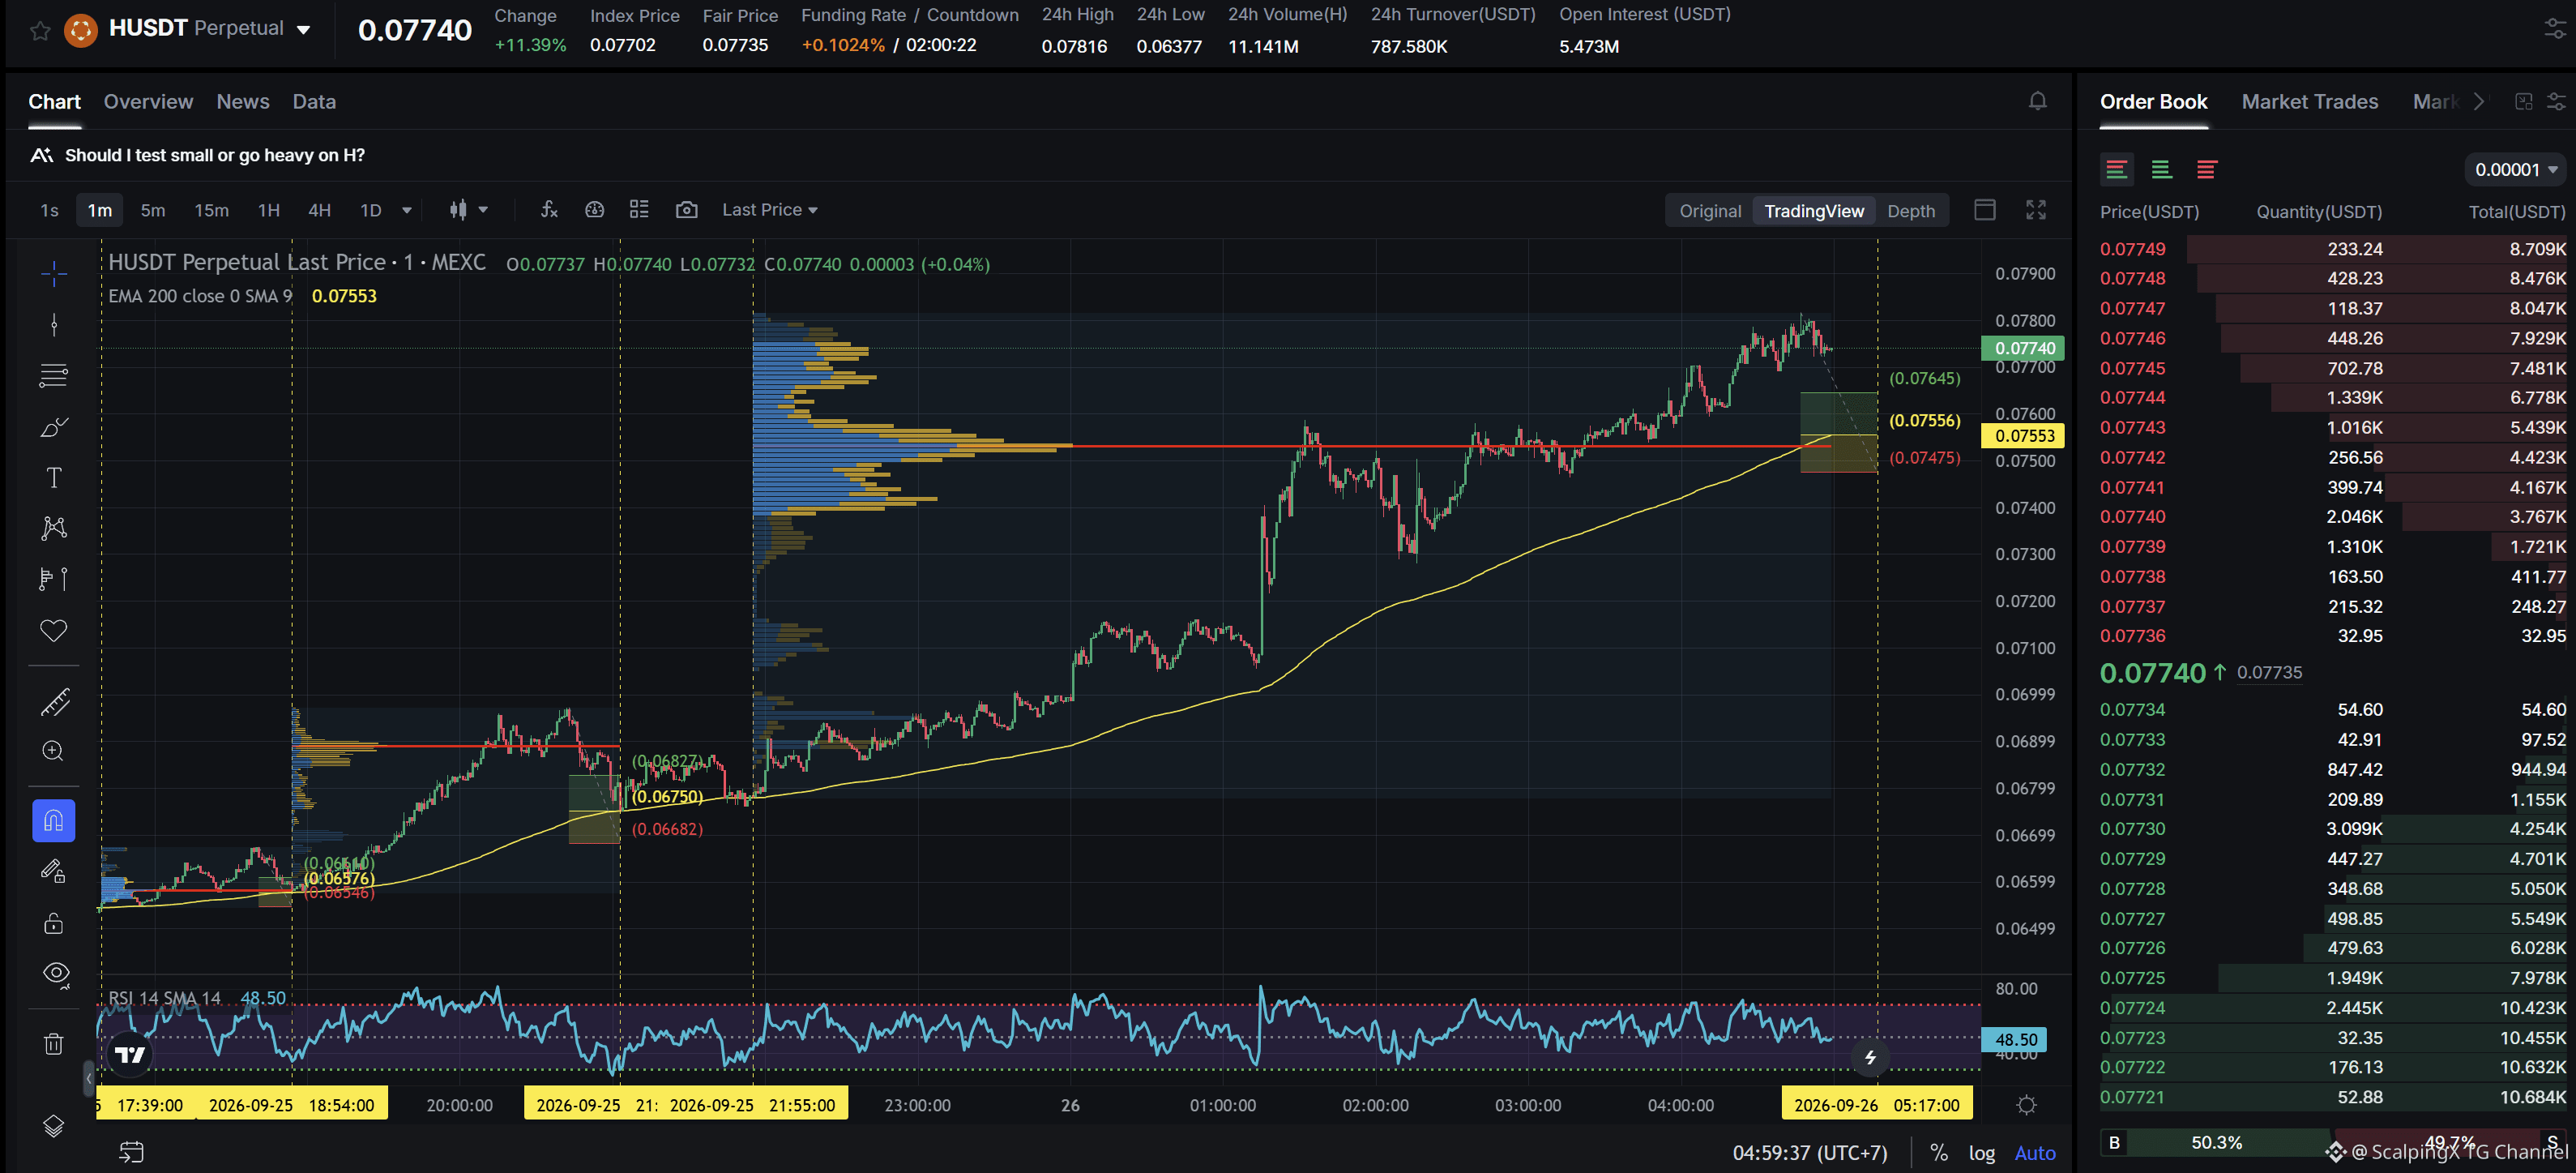
$H - Mcap 154.69M$ - 24h Sentiment +4.52 Bullish SC02 M1 - pending Long order. Entry contains POC + meets positive simplification with two consecutive previously highly profitable Long orders, the current support zone is approximately 1.09% wide. The uptrend has lasted 7 hours 7 minutes, with a maximum recorded price increase of 15.29%. If price loses this support zone, the trend is highly likely to reverse downward.
$H - Mcap 154.69M$ - 24h Sentiment +4.52 Bullish SC02 M1 - pending Long order. Entry contains POC + meets positive simplification with two consecutive previously highly profitable Long orders, the current support zone is approximately 1.09% wide. The uptrend has lasted 7 hours 7 minutes, with a maximum recorded price increase of 15.29%. If price loses this support zone, the trend is highly likely to reverse downward.
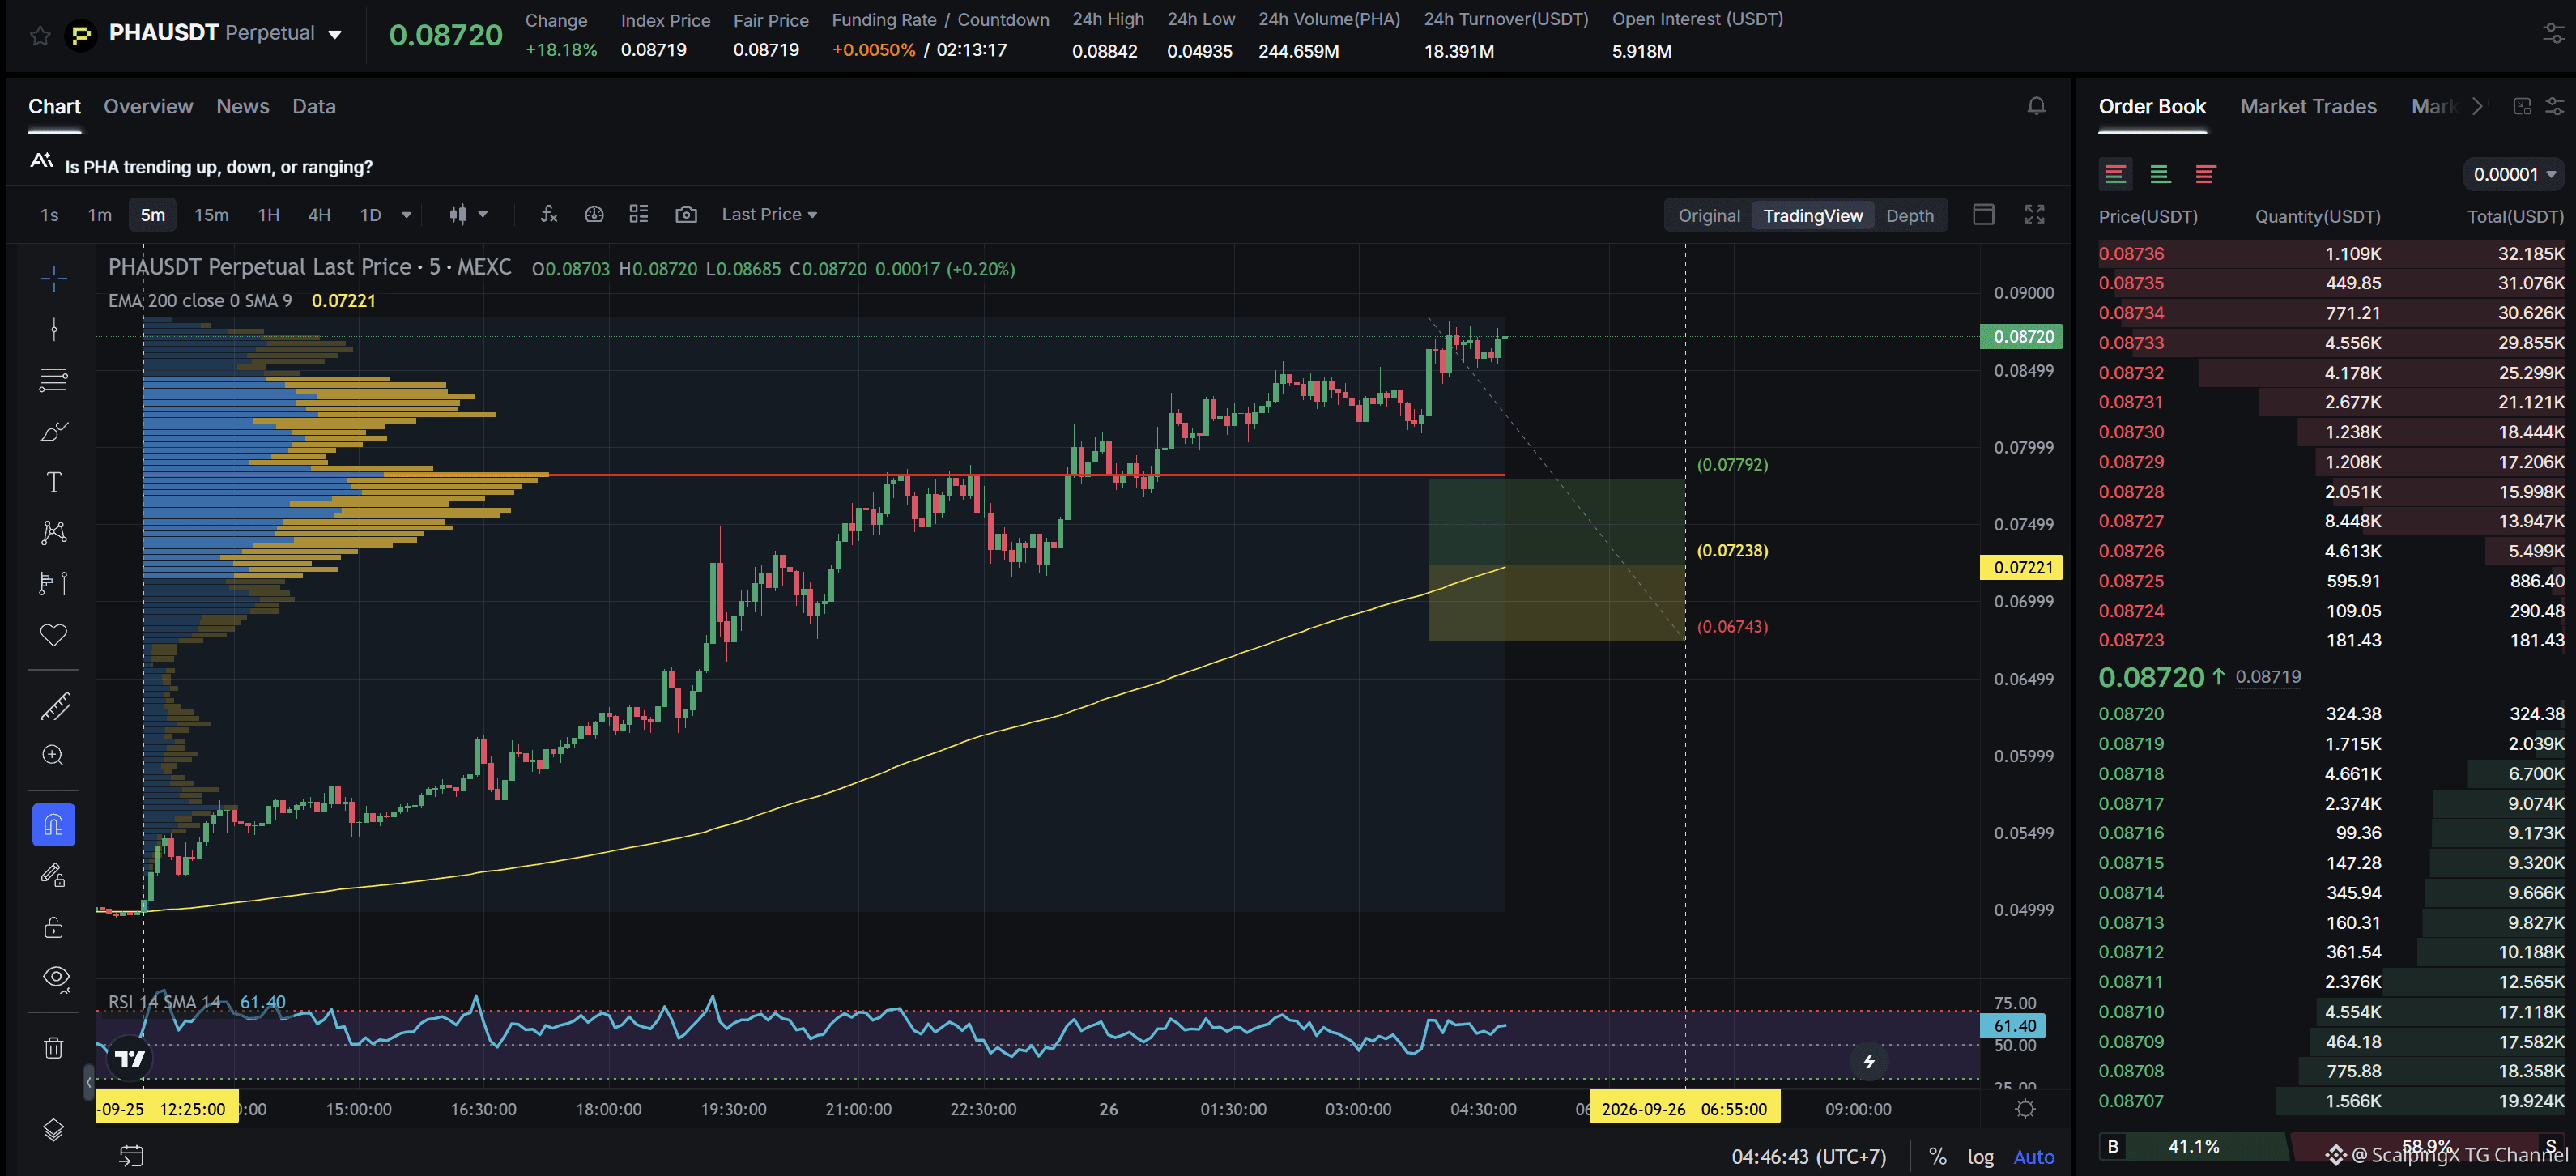
$PHA - Mcap 75.5M$ - 24h Sentiment +4.65 Bullish SC02 M5 - pending Long order. Entry lies within LVN + not affected by any weak zone, the current support zone is approximately 6.87% wide. The uptrend has lasted 16 hours 20 minutes, with a maximum recorded price increase of 79.55%. If price loses this support zone, the trend is highly likely to reverse downward.
$PHA - Mcap 75.5M$ - 24h Sentiment +4.65 Bullish SC02 M5 - pending Long order. Entry lies within LVN + not affected by any weak zone, the current support zone is approximately 6.87% wide. The uptrend has lasted 16 hours 20 minutes, with a maximum recorded price increase of 79.55%. If price loses this support zone, the trend is highly likely to reverse downward.
US consumer sentiment falls to a four-month low as inflation expectations remain elevated
📉 The University of Michigan’s final September consumer sentiment index came in at 48.1, slightly above the preliminary 47.8 and expectations around 47.5–47.6, but still down 7% from August.
🔎 Weakness was concentrated in the outlook, with the Expectations Index falling 10.1% to 46.3, while Current Conditions declined only 1.9%. This suggests consumers are more concerned about the months ahead than about current conditions.
🔥 One-year inflation expectations held at 4.6%, while the five-year measure rose to 3.4%. Higher fuel costs and trade-related pressures continue to weigh on sentiment, leaving growth concerns elevated alongside persistent price risks.
🏦 The final reading did not deliver a new negative shock, as most of the deterioration was already visible in the preliminary release. Still, weak sentiment combined with elevated inflation expectations keeps the outlook for Fed policy easing more complicated.
#USMacro
$ETH
US consumer sentiment falls to a four-month low as inflation expectations remain elevated
📉 The University of Michigan’s final September consumer sentiment index came in at 48.1, slightly above the preliminary 47.8 and expectations around 47.5–47.6, but still down 7% from August.
🔎 Weakness was concentrated in the outlook, with the Expectations Index falling 10.1% to 46.3, while Current Conditions declined only 1.9%. This suggests consumers are more concerned about the months ahead than about current conditions.
🔥 One-year inflation expectations held at 4.6%, while the five-year measure rose to 3.4%. Higher fuel costs and trade-related pressures continue to weigh on sentiment, leaving growth concerns elevated alongside persistent price risks.
🏦 The final reading did not deliver a new negative shock, as most of the deterioration was already visible in the preliminary release. Still, weak sentiment combined with elevated inflation expectations keeps the outlook for Fed policy easing more complicated.
#USMacro
$ETH
📉 The University of Michigan’s final September consumer sentiment index came in at 48.1, slightly above the preliminary 47.8 and expectations around 47.5–47.6, but still down 7% from August.
🔎 Weakness was concentrated in the outlook, with the Expectations Index falling 10.1% to 46.3, while Current Conditions declined only 1.9%. This suggests consumers are more concerned about the months ahead than about current conditions.
🔥 One-year inflation expectations held at 4.6%, while the five-year measure rose to 3.4%. Higher fuel costs and trade-related pressures continue to weigh on sentiment, leaving growth concerns elevated alongside persistent price risks.
🏦 The final reading did not deliver a new negative shock, as most of the deterioration was already visible in the preliminary release. Still, weak sentiment combined with elevated inflation expectations keeps the outlook for Fed policy easing more complicated.
#USMacro
$ETH

2
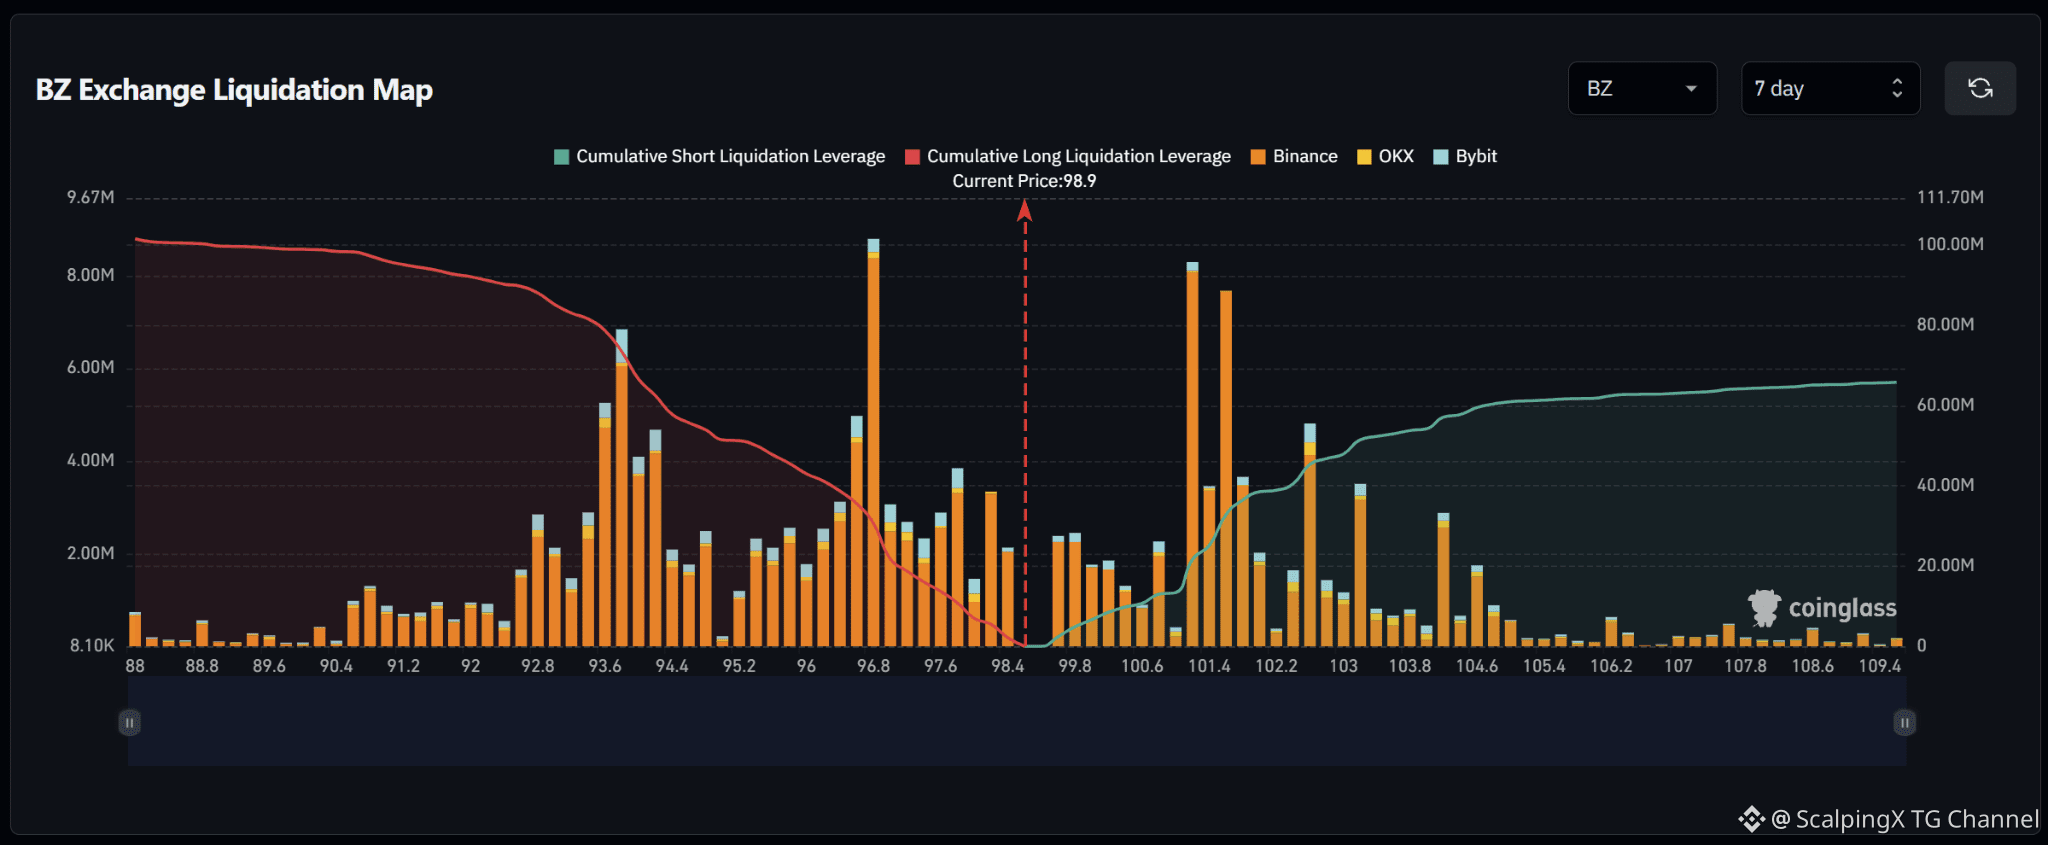
$BZ – Liquidation Map (7 Days) – Current Price 98.9 🔎 The 7-day liquidation map shows roughly 100 million USD in long liquidations below the current price, significantly exceeding approximately 65 million USD in short liquidations above. The liquidity structure therefore favors the downside, with around 1.5 times more cumulative liquidity below the market. 📉 Below the market, long-liquidation liquidity is concentrated heavily across 93.5–97.8. The strongest cluster sits around 96.7–96.9 with a bar close to 9 million USD; 93.5–94.2 also contains several bars around 4–7 million USD, while 97.5–97.8 holds another cluster near 4 million USD. Losing 98.4 would shift attention toward 97.8–96.7 and then 94.2–93.5. 📈 Above the market, short-liquidation liquidity is concentrated mainly across 101–103. The two strongest clusters sit around 101.2 and 101.6 with bars near 8 million USD, while 102.6–103.2 contains several pockets around 3–5 million USD. Further out, 104.2–104.6 still holds some notable liquidity. 🧭 The broader setup favors the downside because long-liquidation exposure below is larger. Losing 98.4 would increase the probability of a sweep toward 97.8–96.7, followed by 94.2–93.5. Breaking above 100.6 would instead expose 101.2–101.6 and then 102.6–103.2.
$BZ – Liquidation Map (7 Days) – Current Price 98.9 🔎 The 7-day liquidation map shows roughly 100 million USD in long liquidations below the current price, significantly exceeding approximately 65 million USD in short liquidations above. The liquidity structure therefore favors the downside, with around 1.5 times more cumulative liquidity below the market. 📉 Below the market, long-liquidation liquidity is concentrated heavily across 93.5–97.8. The strongest cluster sits around 96.7–96.9 with a bar close to 9 million USD; 93.5–94.2 also contains several bars around 4–7 million USD, while 97.5–97.8 holds another cluster near 4 million USD. Losing 98.4 would shift attention toward 97.8–96.7 and then 94.2–93.5. 📈 Above the market, short-liquidation liquidity is concentrated mainly across 101–103. The two strongest clusters sit around 101.2 and 101.6 with bars near 8 million USD, while 102.6–103.2 contains several pockets around 3–5 million USD. Further out, 104.2–104.6 still holds some notable liquidity. 🧭 The broader setup favors the downside because long-liquidation exposure below is larger. Losing 98.4 would increase the probability of a sweep toward 97.8–96.7, followed by 94.2–93.5. Breaking above 100.6 would instead expose 101.2–101.6 and then 102.6–103.2.
1
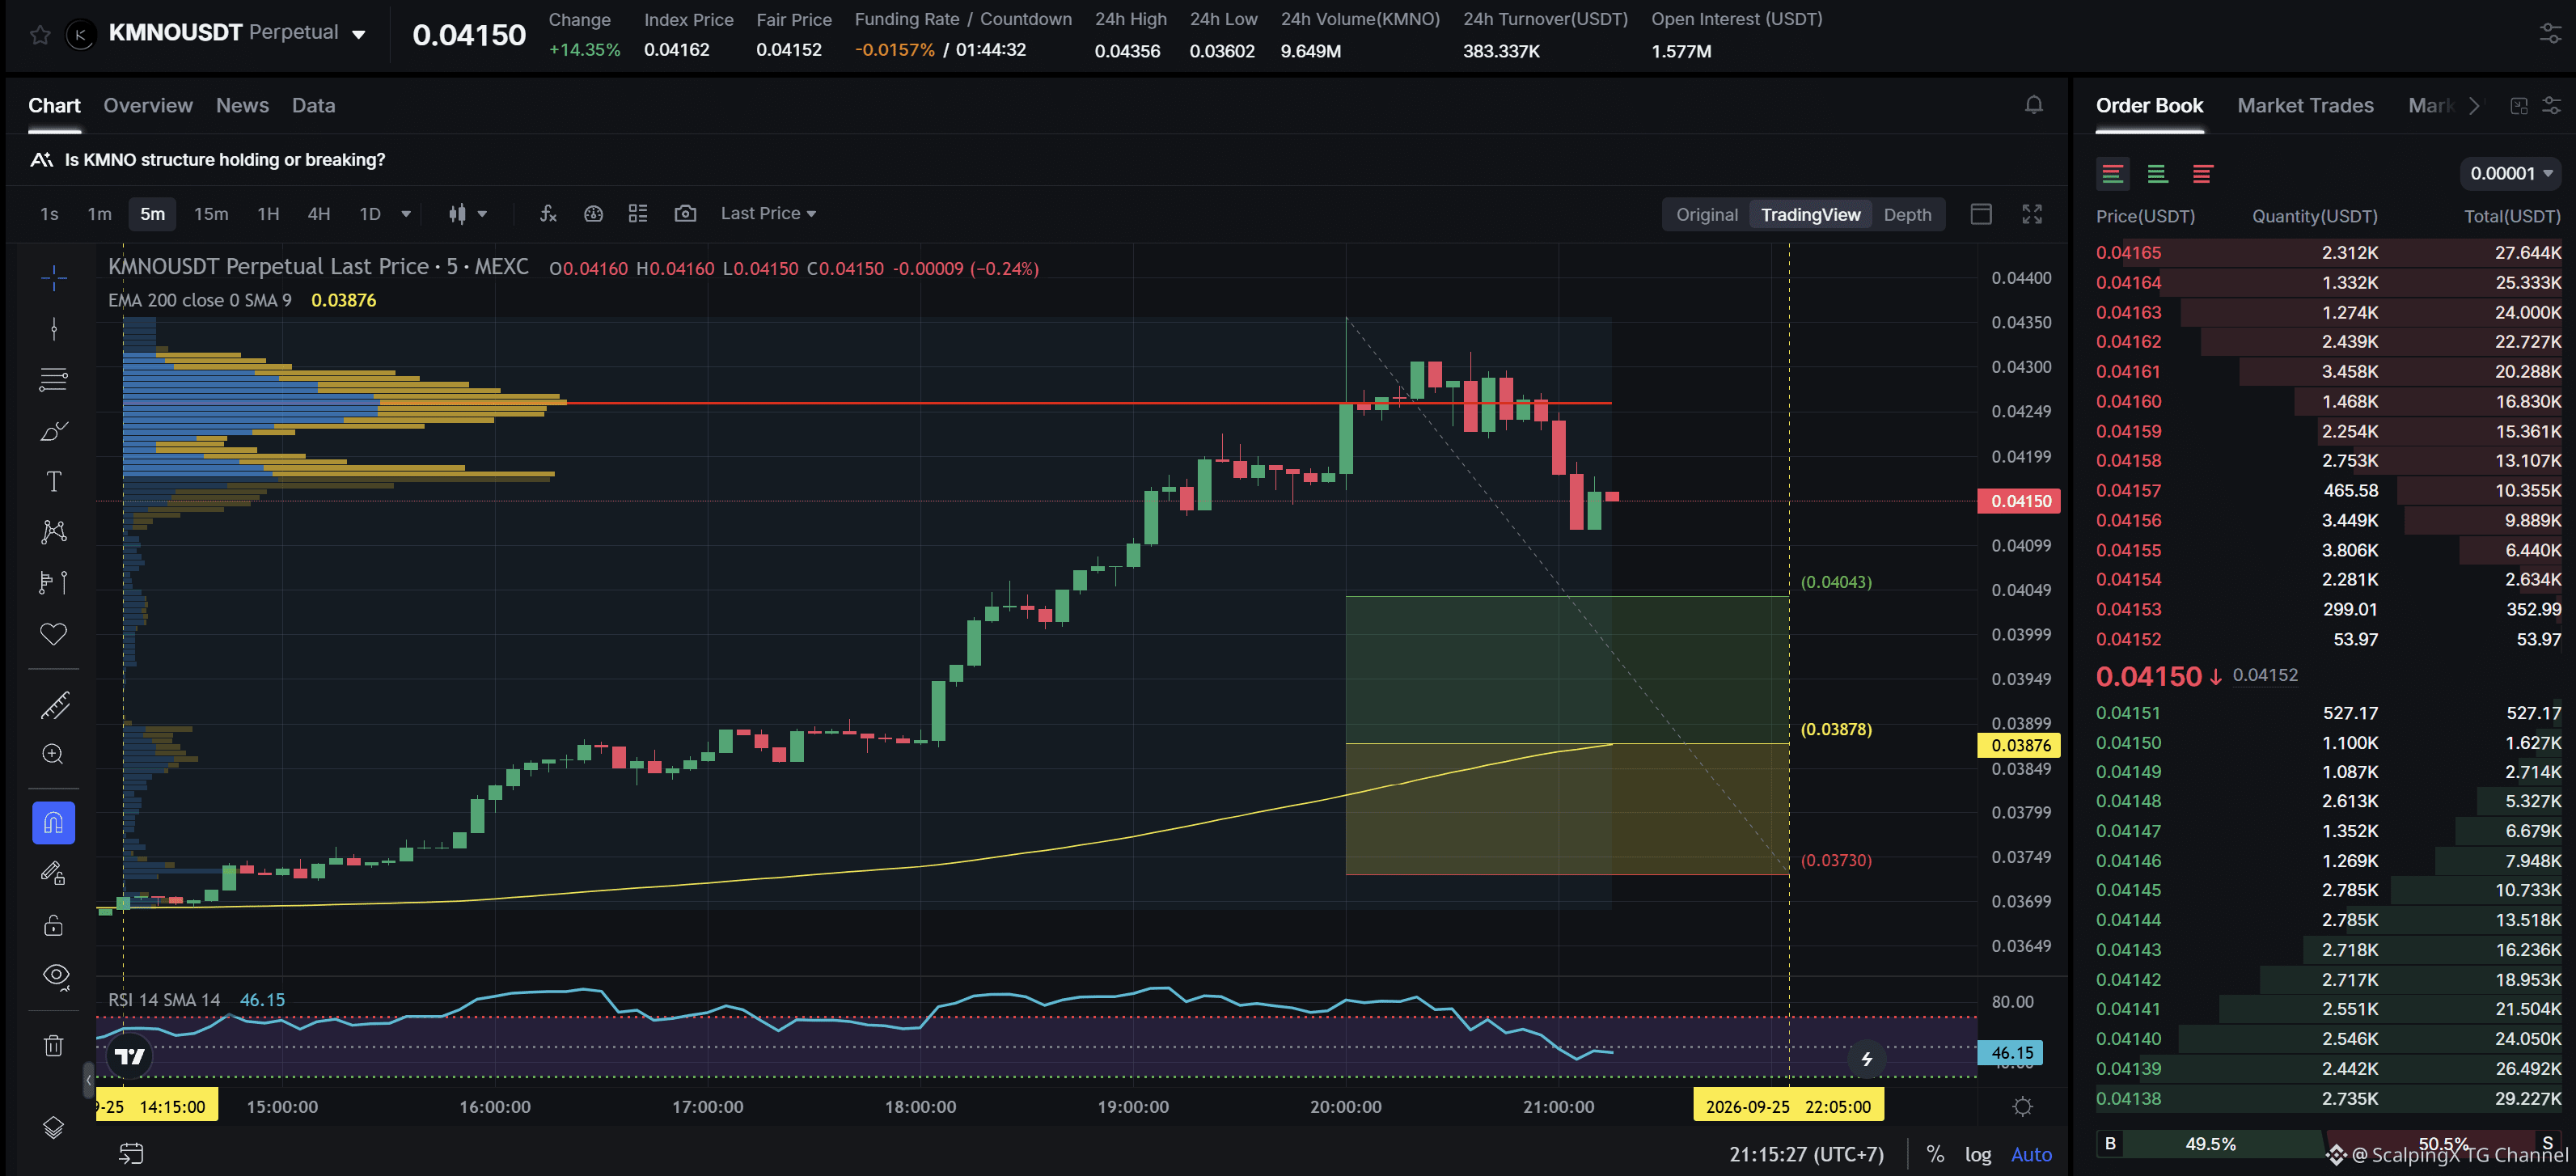
$KMNO - Mcap 235.4M$ - 24h Sentiment Neutral SC02 M5 - pending Long order. Entry lies within LVN + not affected by any weak zone, the current support zone is approximately 3.85% wide. The uptrend has lasted 7 hours, with a maximum recorded price increase of 17.91%. If price loses this support zone, the trend is highly likely to reverse downward.
$KMNO - Mcap 235.4M$ - 24h Sentiment Neutral SC02 M5 - pending Long order. Entry lies within LVN + not affected by any weak zone, the current support zone is approximately 3.85% wide. The uptrend has lasted 7 hours, with a maximum recorded price increase of 17.91%. If price loses this support zone, the trend is highly likely to reverse downward.
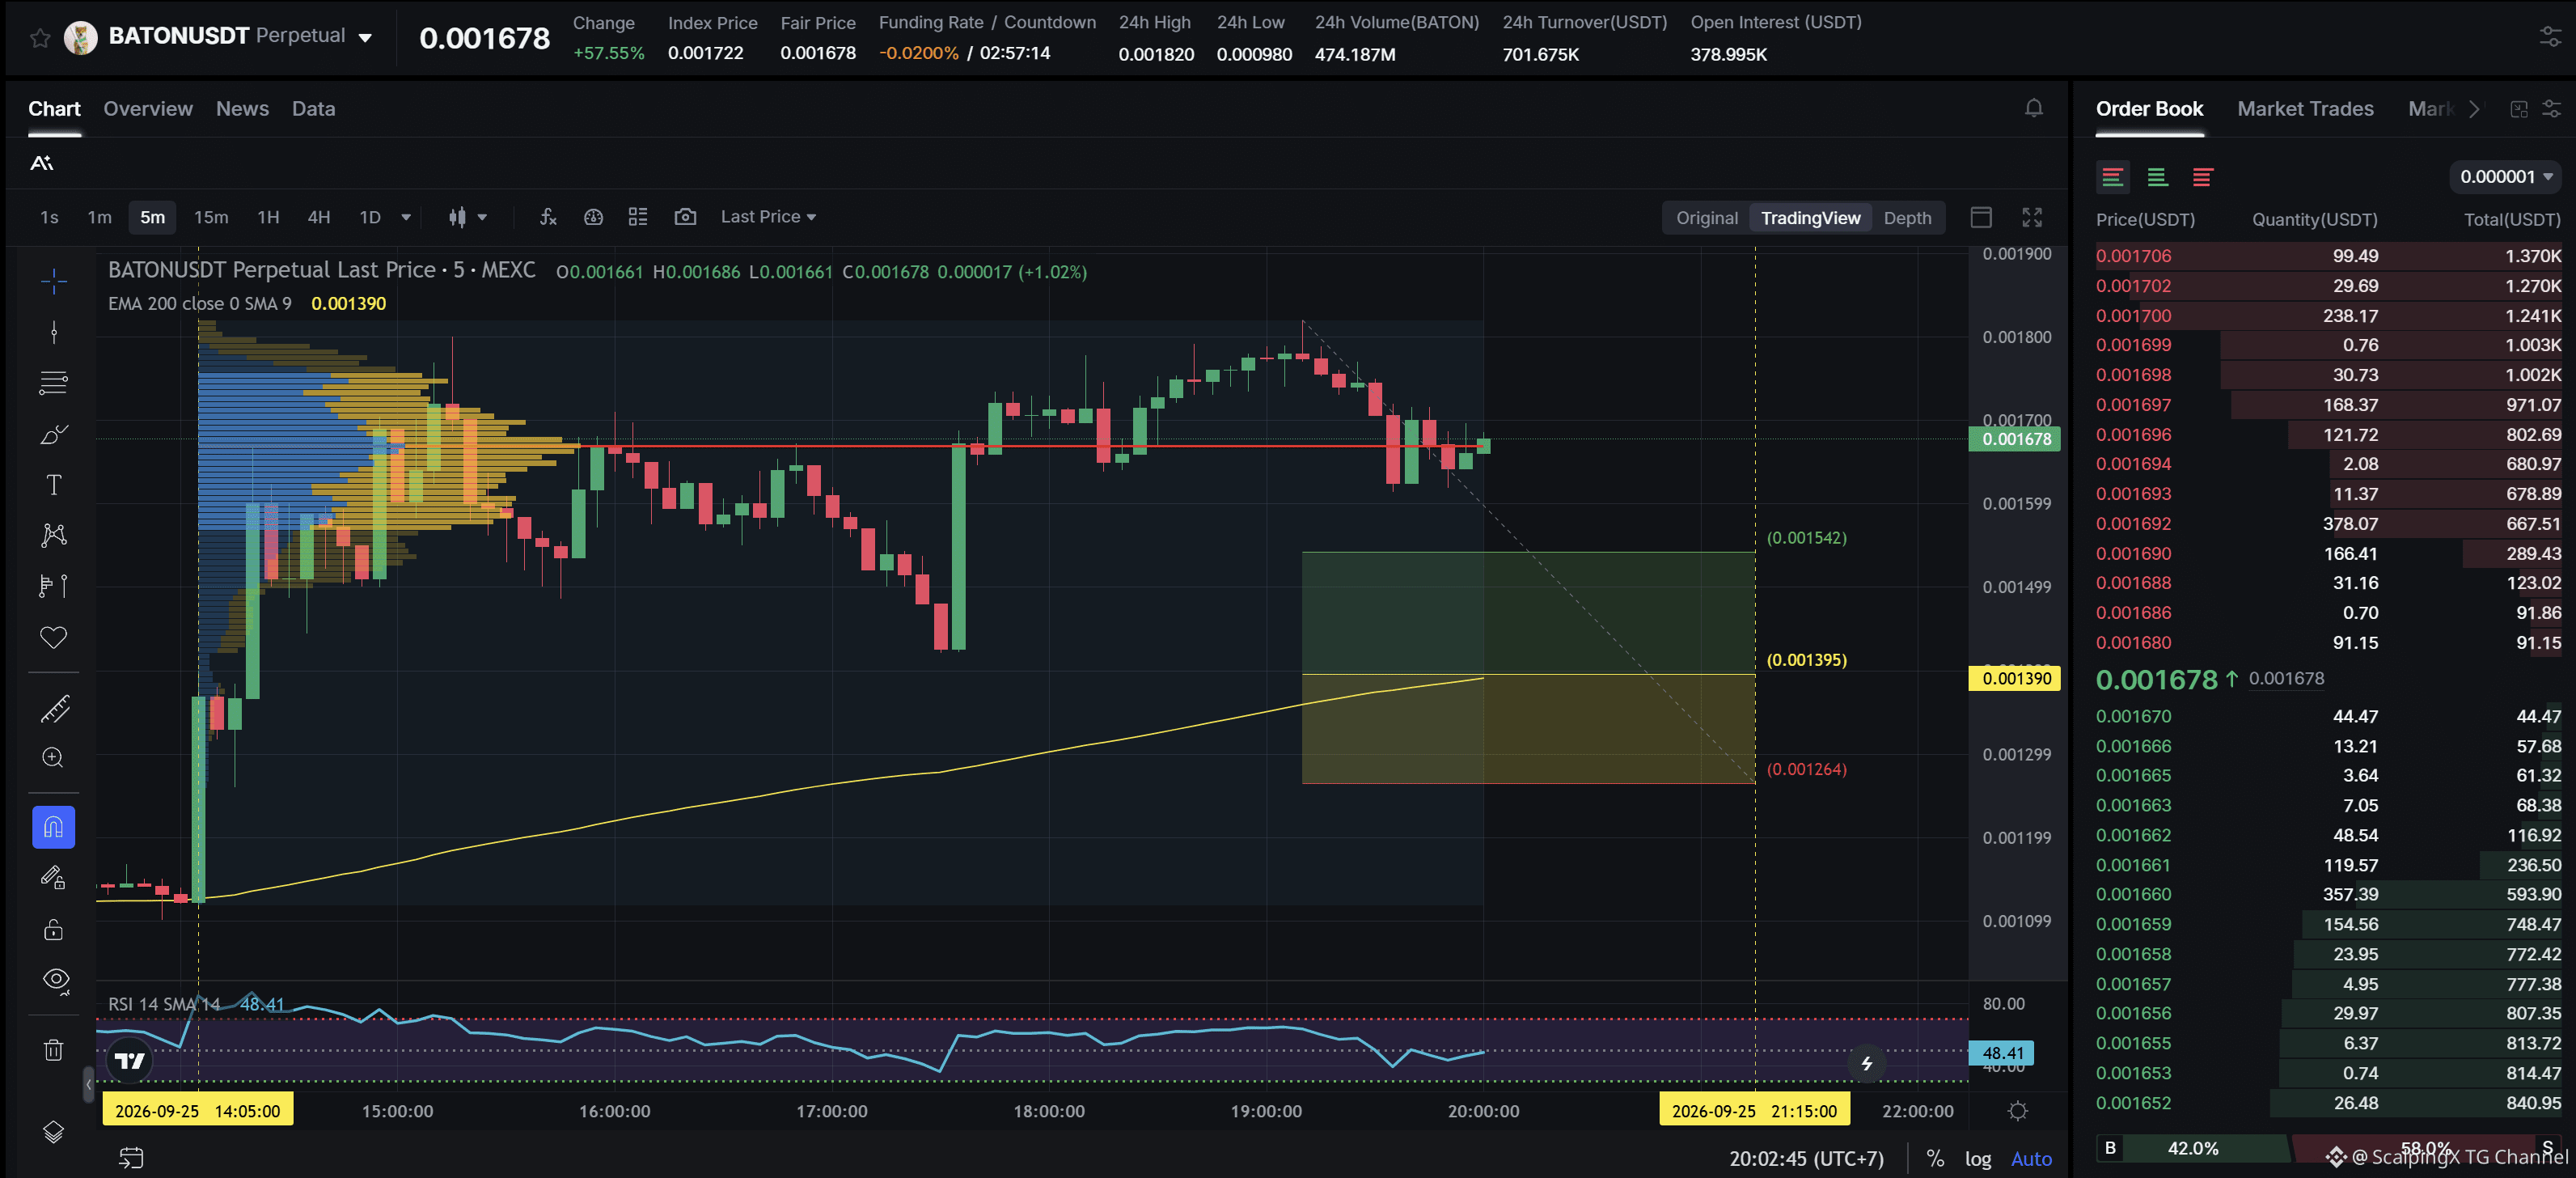
$BATON - FDV 1.7M$ SC02 M5 - pending Long order. Entry lies within LVN + not affected by any weak zone, the current support zone is approximately 9.14% wide. The uptrend has lasted 5 hours 55 minutes, with a maximum recorded price increase of 61.86%. If price loses this support zone, the trend is highly likely to reverse downward.
$BATON - FDV 1.7M$ SC02 M5 - pending Long order. Entry lies within LVN + not affected by any weak zone, the current support zone is approximately 9.14% wide. The uptrend has lasted 5 hours 55 minutes, with a maximum recorded price increase of 61.86%. If price loses this support zone, the trend is highly likely to reverse downward.
1
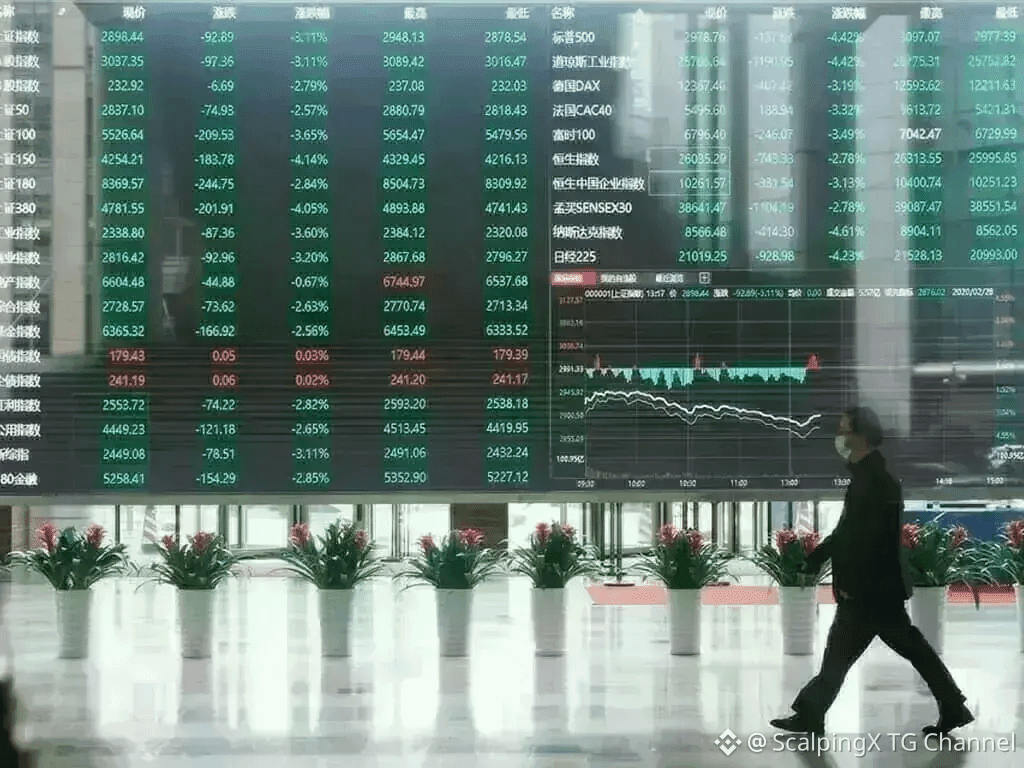
Hang Seng falls for a third consecutive session, closes near a two-month low
📉 The Hang Seng Index closed on September 25 at 24,510.09, down 1.01%, marking its third straight session of losses. The Hang Seng Tech Index fell 1.13% to 4,311.78, with technology and insurance stocks continuing to weigh on the market.
📊 The HSI dropped nearly 2% intraday to 24,275.56 before recovering part of its losses in the afternoon. The rebound suggests that early selling pressure eased, although the index still finished around its lowest level in roughly two months.
💧 Market turnover was only around HKD 102.2 billion as Stock Connect was closed and mainland Chinese markets were shut for the holiday. The mainland reopening on September 28 will be the next key test for whether current selling pressure persists.
#MarketInsights
$BNB
Hang Seng falls for a third consecutive session, closes near a two-month low
📉 The Hang Seng Index closed on September 25 at 24,510.09, down 1.01%, marking its third straight session of losses. The Hang Seng Tech Index fell 1.13% to 4,311.78, with technology and insurance stocks continuing to weigh on the market.
📊 The HSI dropped nearly 2% intraday to 24,275.56 before recovering part of its losses in the afternoon. The rebound suggests that early selling pressure eased, although the index still finished around its lowest level in roughly two months.
💧 Market turnover was only around HKD 102.2 billion as Stock Connect was closed and mainland Chinese markets were shut for the holiday. The mainland reopening on September 28 will be the next key test for whether current selling pressure persists.
#MarketInsights
$BNB
📉 The Hang Seng Index closed on September 25 at 24,510.09, down 1.01%, marking its third straight session of losses. The Hang Seng Tech Index fell 1.13% to 4,311.78, with technology and insurance stocks continuing to weigh on the market.
📊 The HSI dropped nearly 2% intraday to 24,275.56 before recovering part of its losses in the afternoon. The rebound suggests that early selling pressure eased, although the index still finished around its lowest level in roughly two months.
💧 Market turnover was only around HKD 102.2 billion as Stock Connect was closed and mainland Chinese markets were shut for the holiday. The mainland reopening on September 28 will be the next key test for whether current selling pressure persists.
#MarketInsights
$BNB
2
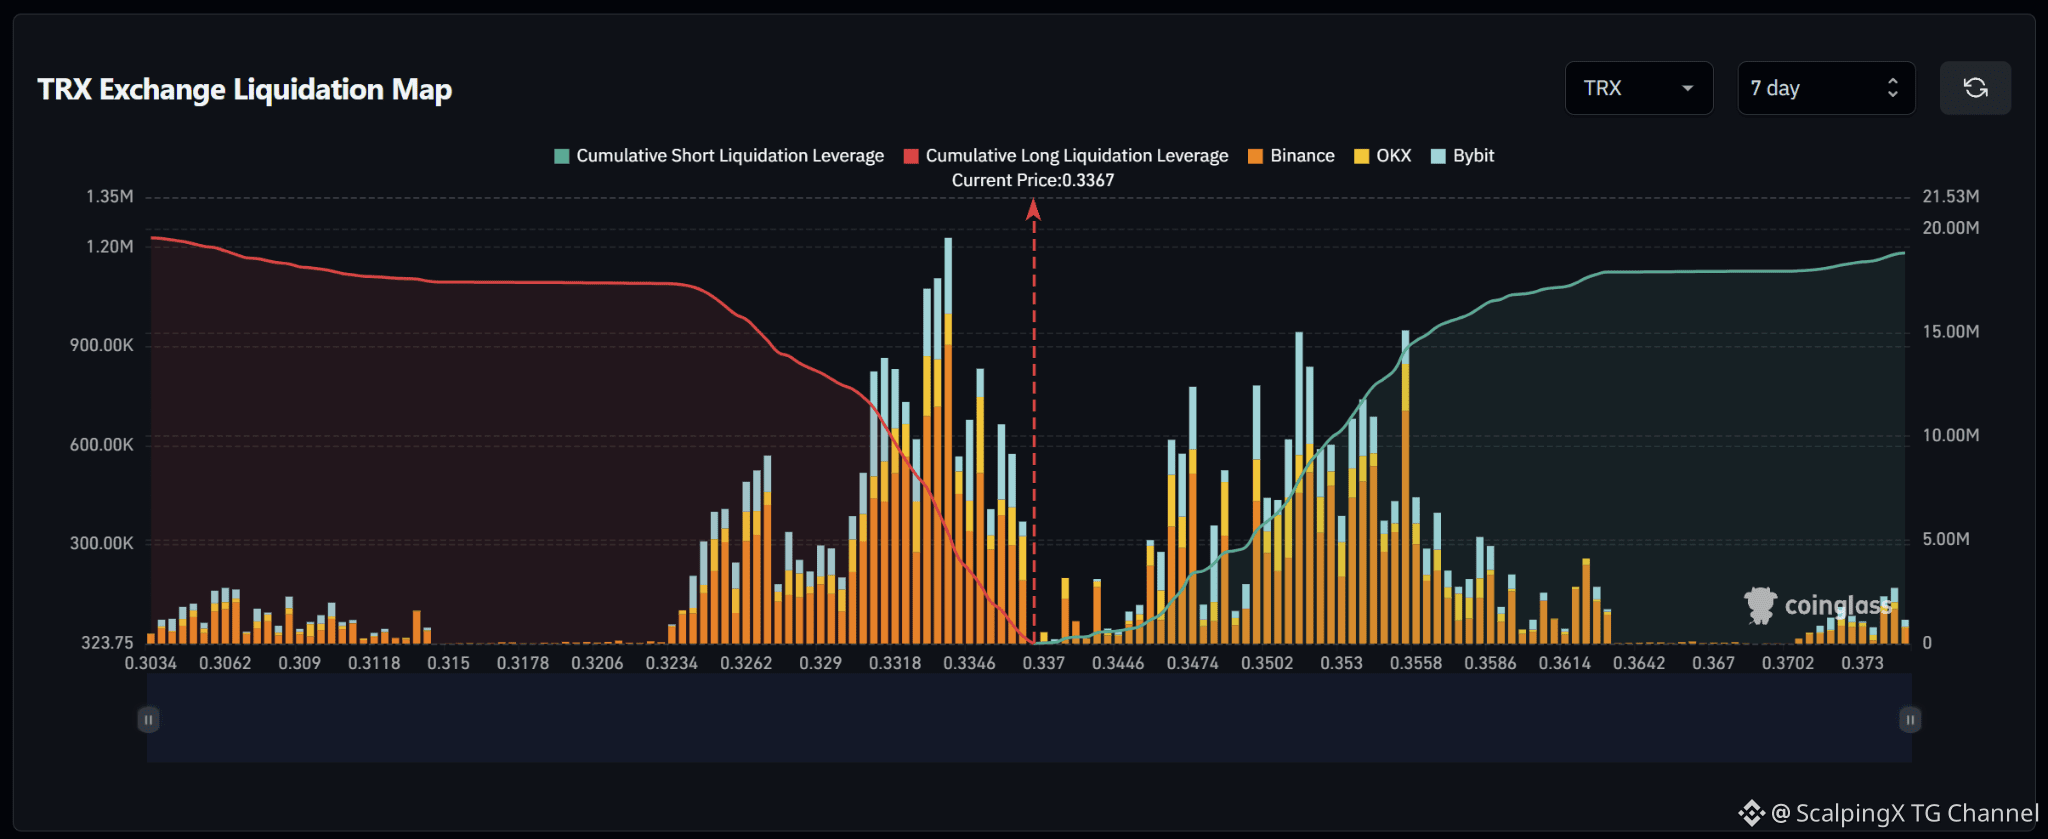
$TRX – Liquidation Map (7 Days) – Current Price 0.3367 🔎 The 7-day liquidation map shows a relatively balanced structure, with both long liquidations below and short liquidations above sitting around 19–20 million USD. Long-liquidation exposure is only slightly larger, giving the map a very mild downside tilt rather than a strong directional imbalance. 📉 Below the market, long-liquidation liquidity is concentrated heavily across 0.326–0.335. The strongest cluster sits around 0.333–0.334 with a bar above 1.2 million USD, while 0.331–0.333 also contains several bars around 0.8–1.1 million USD. Losing 0.331 would shift attention toward 0.329–0.326. 📈 Above the market, short-liquidation liquidity is concentrated mainly across 0.347–0.356. Notable clusters appear around 0.351–0.353 and 0.355–0.356, with several bars near 0.7–0.95 million USD. Liquidity becomes noticeably thinner above 0.359. 🧭 The overall structure is close to balanced. Losing 0.331 would increase the probability of a sweep toward 0.329–0.326. Breaking above 0.347 would instead expose 0.351–0.356 before price enters a thinner liquidity zone.
$TRX – Liquidation Map (7 Days) – Current Price 0.3367 🔎 The 7-day liquidation map shows a relatively balanced structure, with both long liquidations below and short liquidations above sitting around 19–20 million USD. Long-liquidation exposure is only slightly larger, giving the map a very mild downside tilt rather than a strong directional imbalance. 📉 Below the market, long-liquidation liquidity is concentrated heavily across 0.326–0.335. The strongest cluster sits around 0.333–0.334 with a bar above 1.2 million USD, while 0.331–0.333 also contains several bars around 0.8–1.1 million USD. Losing 0.331 would shift attention toward 0.329–0.326. 📈 Above the market, short-liquidation liquidity is concentrated mainly across 0.347–0.356. Notable clusters appear around 0.351–0.353 and 0.355–0.356, with several bars near 0.7–0.95 million USD. Liquidity becomes noticeably thinner above 0.359. 🧭 The overall structure is close to balanced. Losing 0.331 would increase the probability of a sweep toward 0.329–0.326. Breaking above 0.347 would instead expose 0.351–0.356 before price enters a thinner liquidity zone.
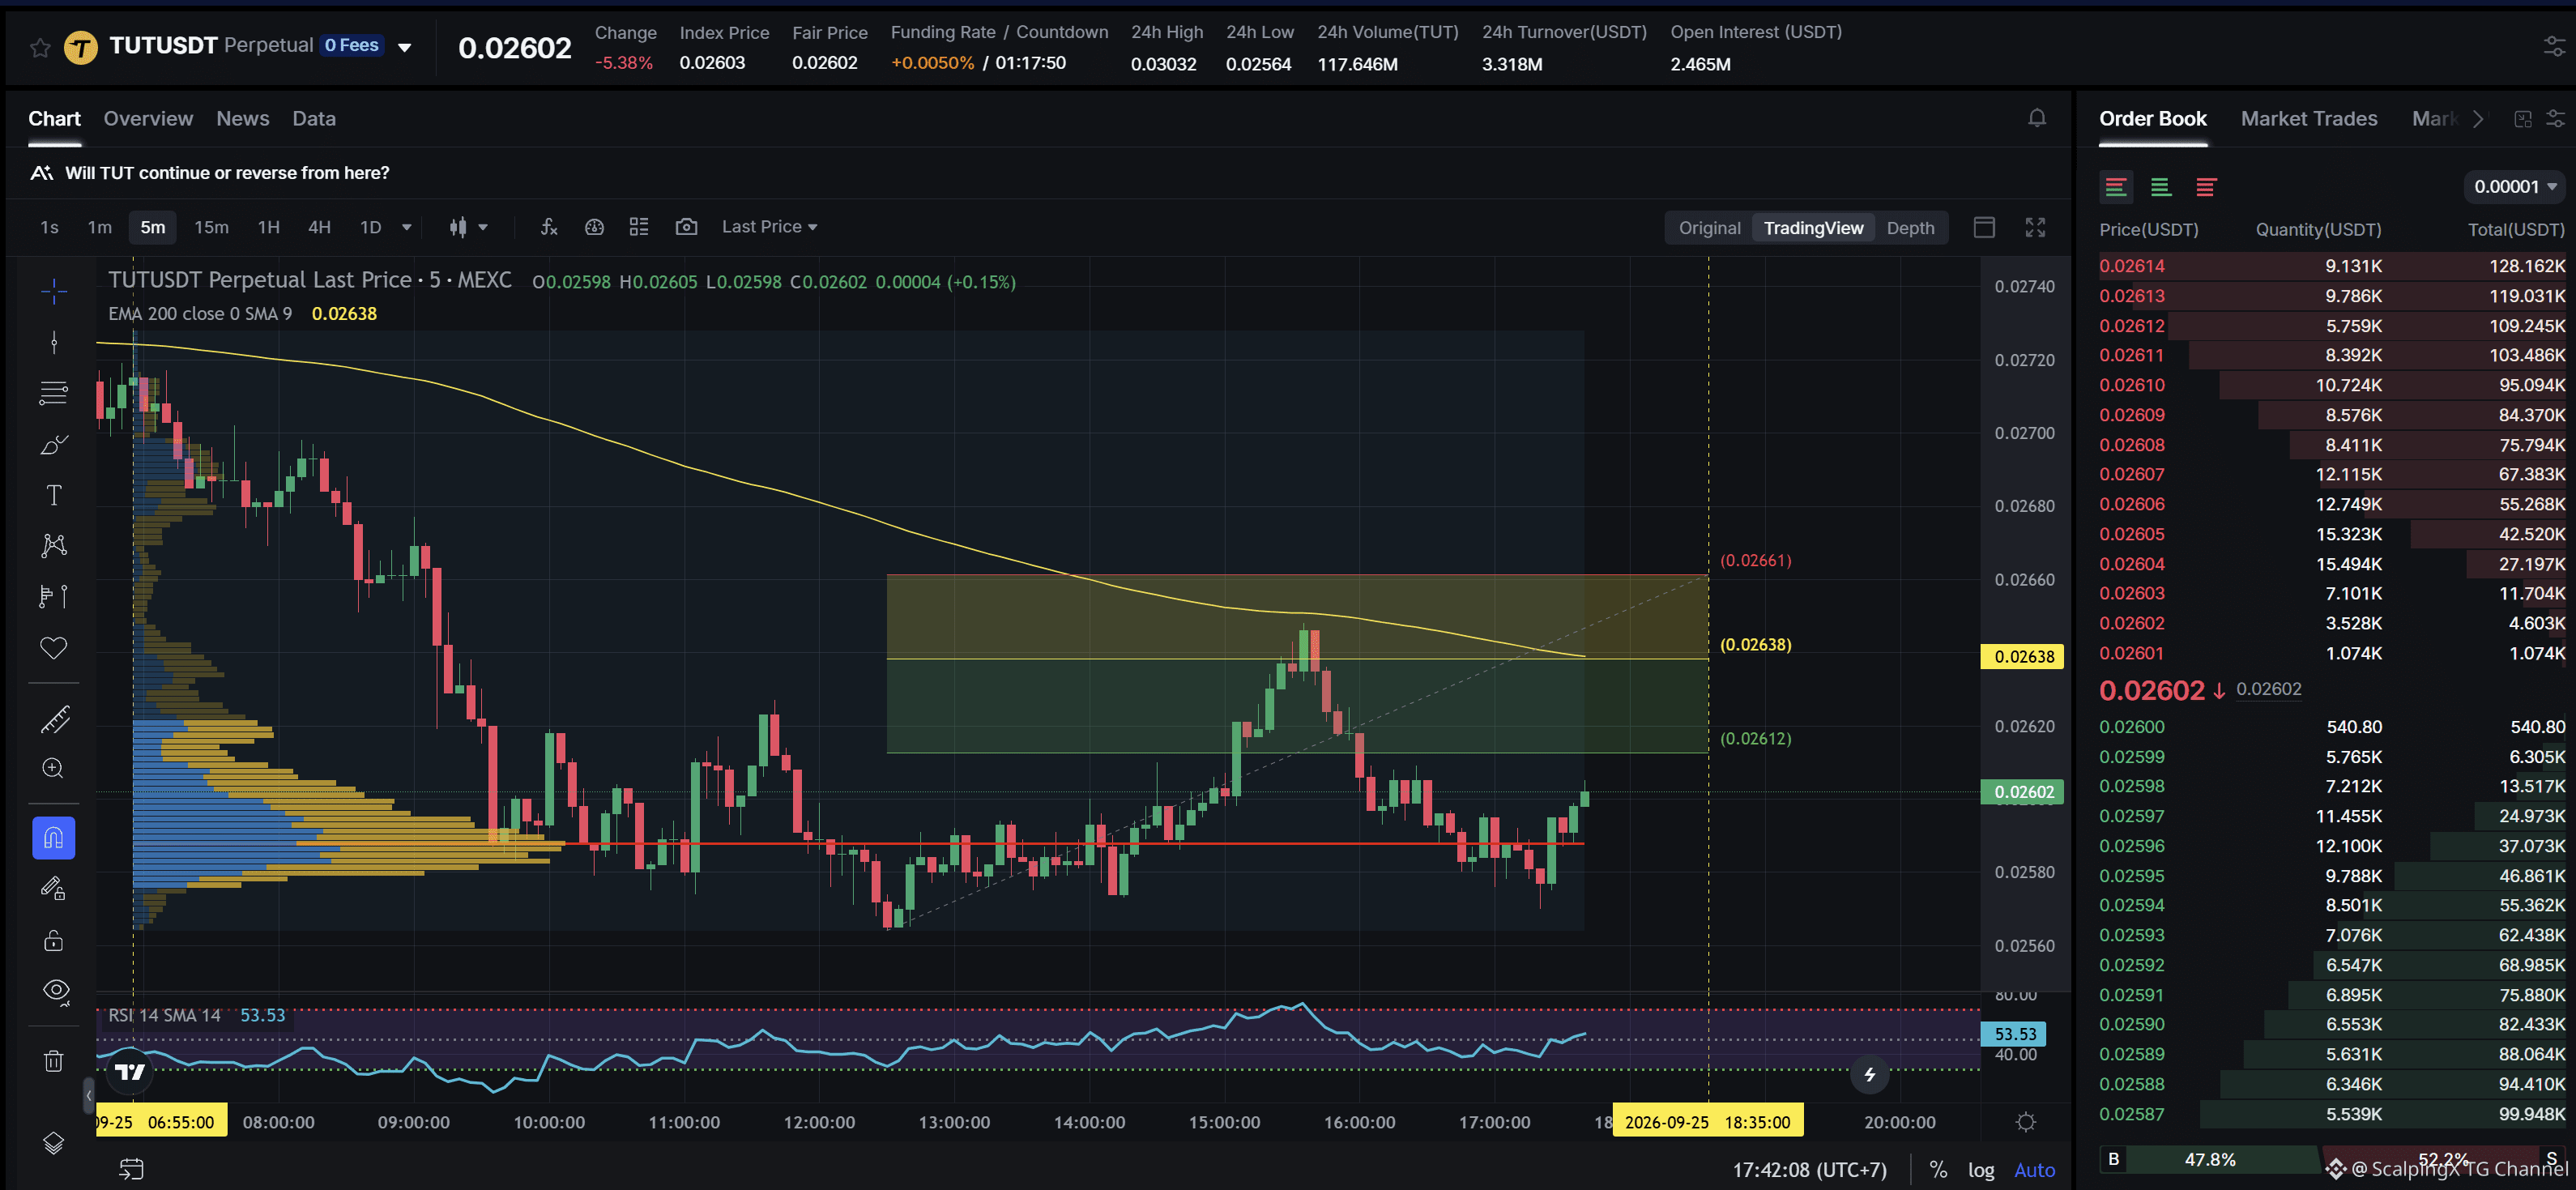
$TUT - Mcap 21.52M$ - 24h Sentiment +4.01 Bullish SC02 M5 - pending Short order. Entry lies within LVN + not affected by any weak zone, the current resistance zone is approximately 0.88% wide. The downtrend has lasted 10 hours 50 minutes, with a maximum recorded price decline of 5.93%. If price breaks above this resistance zone, the trend is highly likely to reverse upward.
$TUT - Mcap 21.52M$ - 24h Sentiment +4.01 Bullish SC02 M5 - pending Short order. Entry lies within LVN + not affected by any weak zone, the current resistance zone is approximately 0.88% wide. The downtrend has lasted 10 hours 50 minutes, with a maximum recorded price decline of 5.93%. If price breaks above this resistance zone, the trend is highly likely to reverse upward.
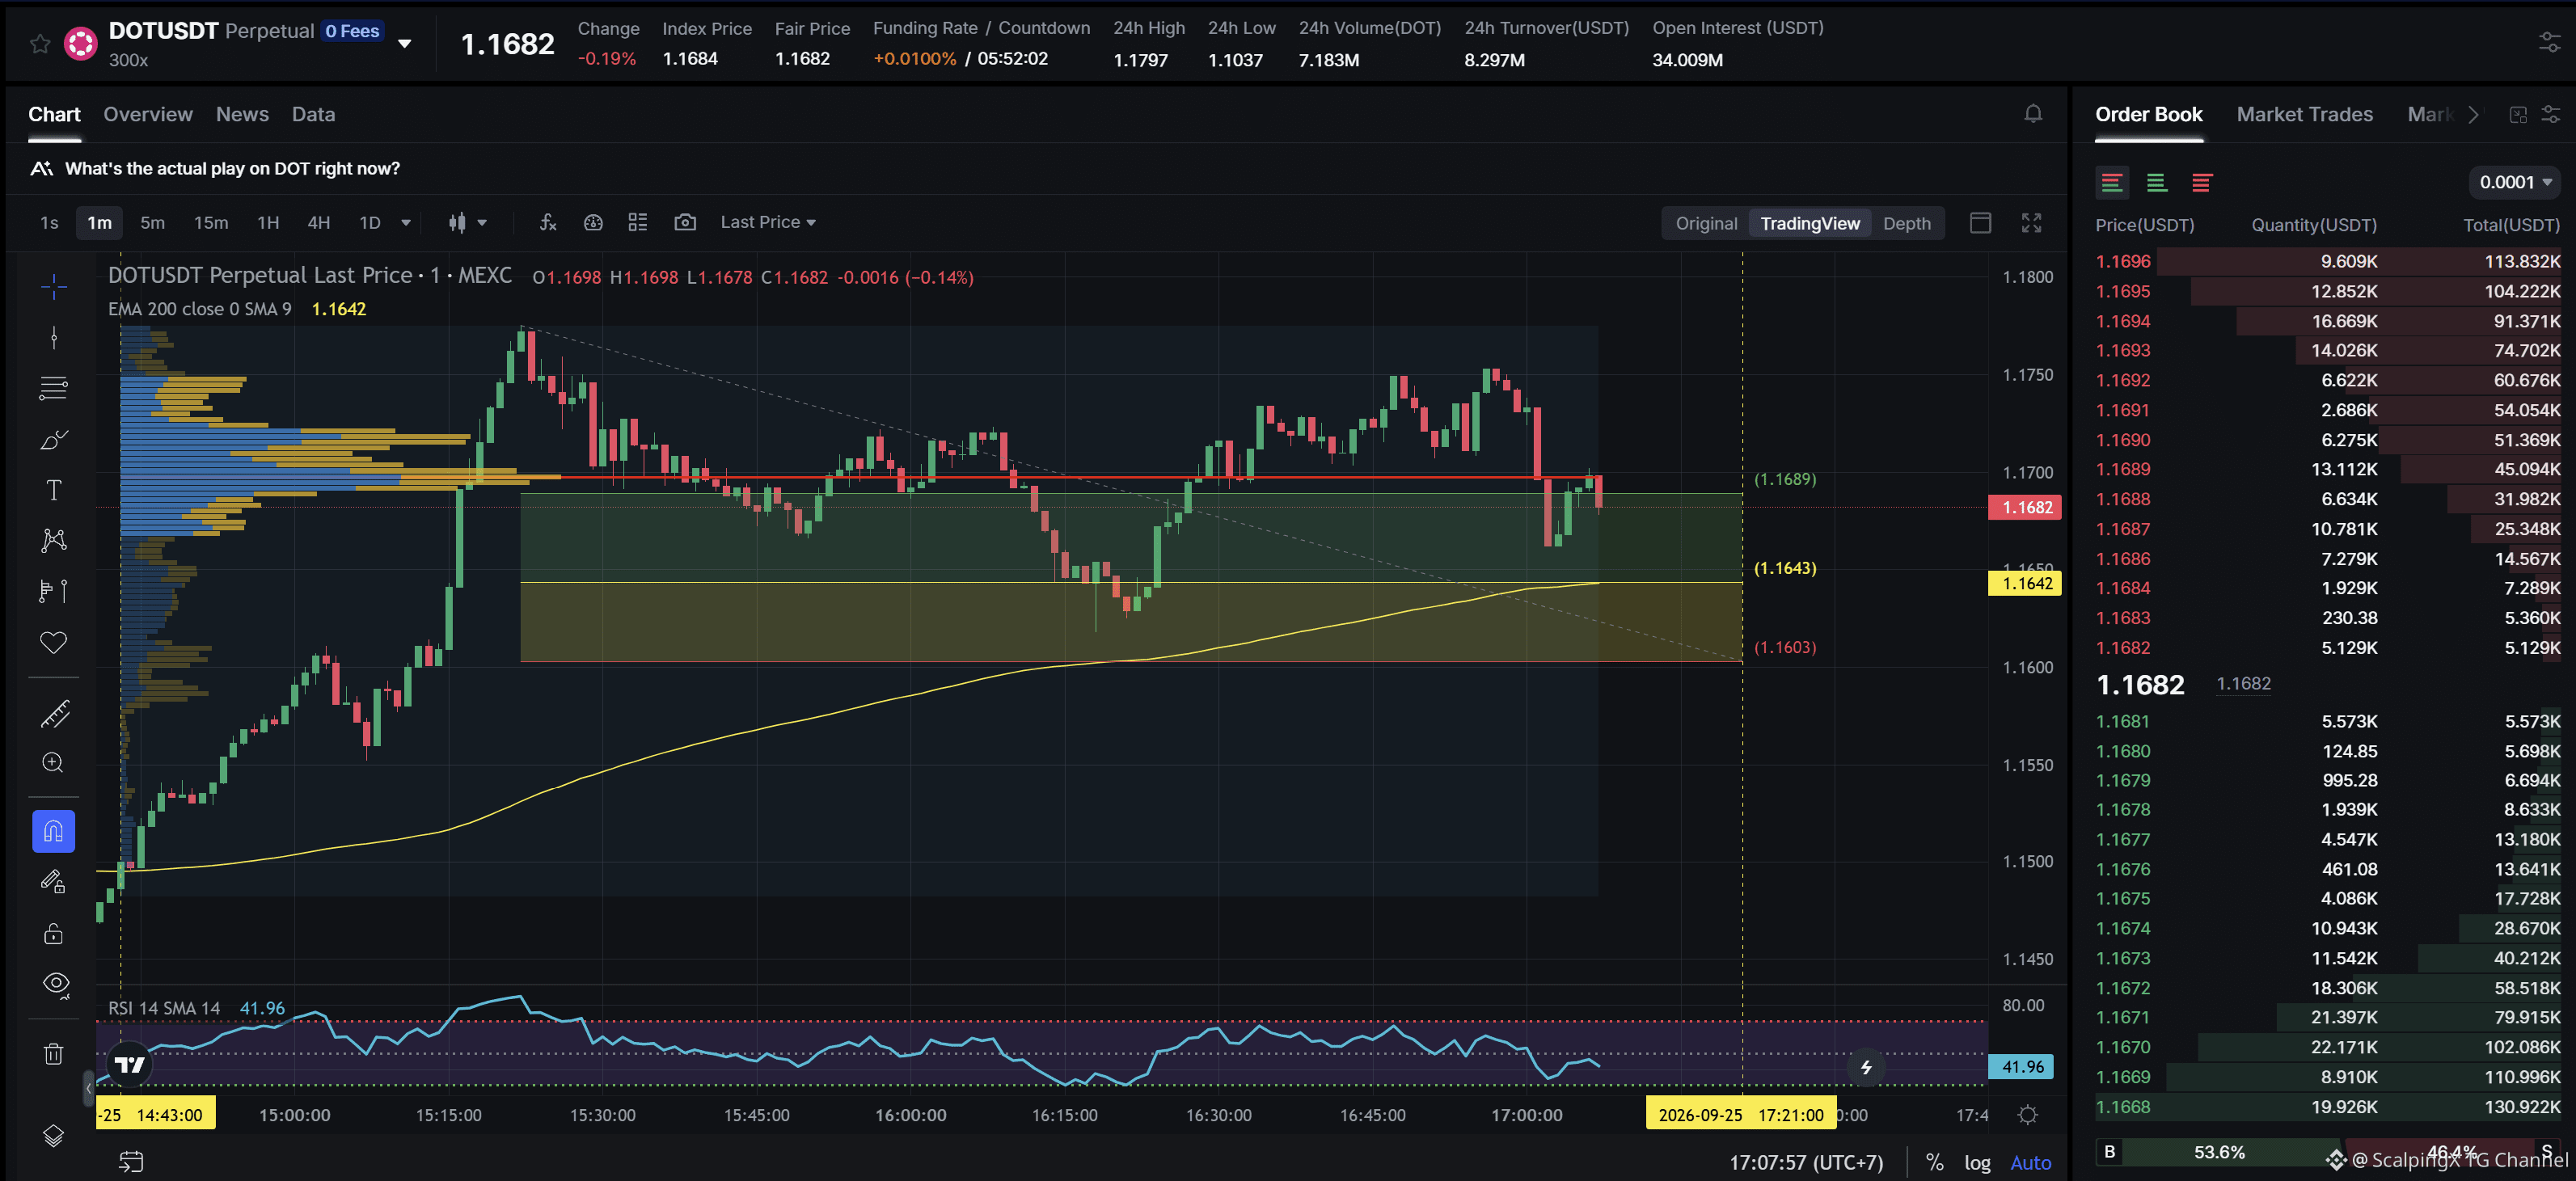
$DOT - Mcap 1.99B$ - 24h Sentiment +2.57 Bullish SC02 M1 - pending Long order. Entry lies within LVN + not affected by any weak zone, the current support zone is approximately 0.35% wide. The uptrend has lasted 2 hours 26 minutes, with a maximum recorded price increase of 2.42%. If price loses this support zone, the trend is highly likely to reverse downward.
$DOT - Mcap 1.99B$ - 24h Sentiment +2.57 Bullish SC02 M1 - pending Long order. Entry lies within LVN + not affected by any weak zone, the current support zone is approximately 0.35% wide. The uptrend has lasted 2 hours 26 minutes, with a maximum recorded price increase of 2.42%. If price loses this support zone, the trend is highly likely to reverse downward.
US yields ease slightly, but Asian markets remain divided
📉 US Treasury yields stabilized after the recent selloff, with the 10-year yield around 5.19% and the 30-year near 5.48%. Pressure is no longer accelerating as sharply as in the previous two sessions, but long-term yields remain elevated.
🛢 Brent slipped about 0.8% to around $105.7 after two strong sessions. The pullback in oil helps ease near-term inflation pressure, although prices above $100 still support the higher-for-longer rate narrative.
📊 Asian equities showed no broad risk-on move. The Nikkei gained around 1%, while Hong Kong and Australian stocks declined, and MSCI Asia ex-Japan was little changed.
⚖️ The current setup looks more like a stabilization after the selloff than a clear shift back into risk-on sentiment.
#MarketInsight
$USDT
US yields ease slightly, but Asian markets remain divided
📉 US Treasury yields stabilized after the recent selloff, with the 10-year yield around 5.19% and the 30-year near 5.48%. Pressure is no longer accelerating as sharply as in the previous two sessions, but long-term yields remain elevated.
🛢 Brent slipped about 0.8% to around $105.7 after two strong sessions. The pullback in oil helps ease near-term inflation pressure, although prices above $100 still support the higher-for-longer rate narrative.
📊 Asian equities showed no broad risk-on move. The Nikkei gained around 1%, while Hong Kong and Australian stocks declined, and MSCI Asia ex-Japan was little changed.
⚖️ The current setup looks more like a stabilization after the selloff than a clear shift back into risk-on sentiment.
#MarketInsight
$USDT
📉 US Treasury yields stabilized after the recent selloff, with the 10-year yield around 5.19% and the 30-year near 5.48%. Pressure is no longer accelerating as sharply as in the previous two sessions, but long-term yields remain elevated.
🛢 Brent slipped about 0.8% to around $105.7 after two strong sessions. The pullback in oil helps ease near-term inflation pressure, although prices above $100 still support the higher-for-longer rate narrative.
📊 Asian equities showed no broad risk-on move. The Nikkei gained around 1%, while Hong Kong and Australian stocks declined, and MSCI Asia ex-Japan was little changed.
⚖️ The current setup looks more like a stabilization after the selloff than a clear shift back into risk-on sentiment.
#MarketInsight
$USDT

1
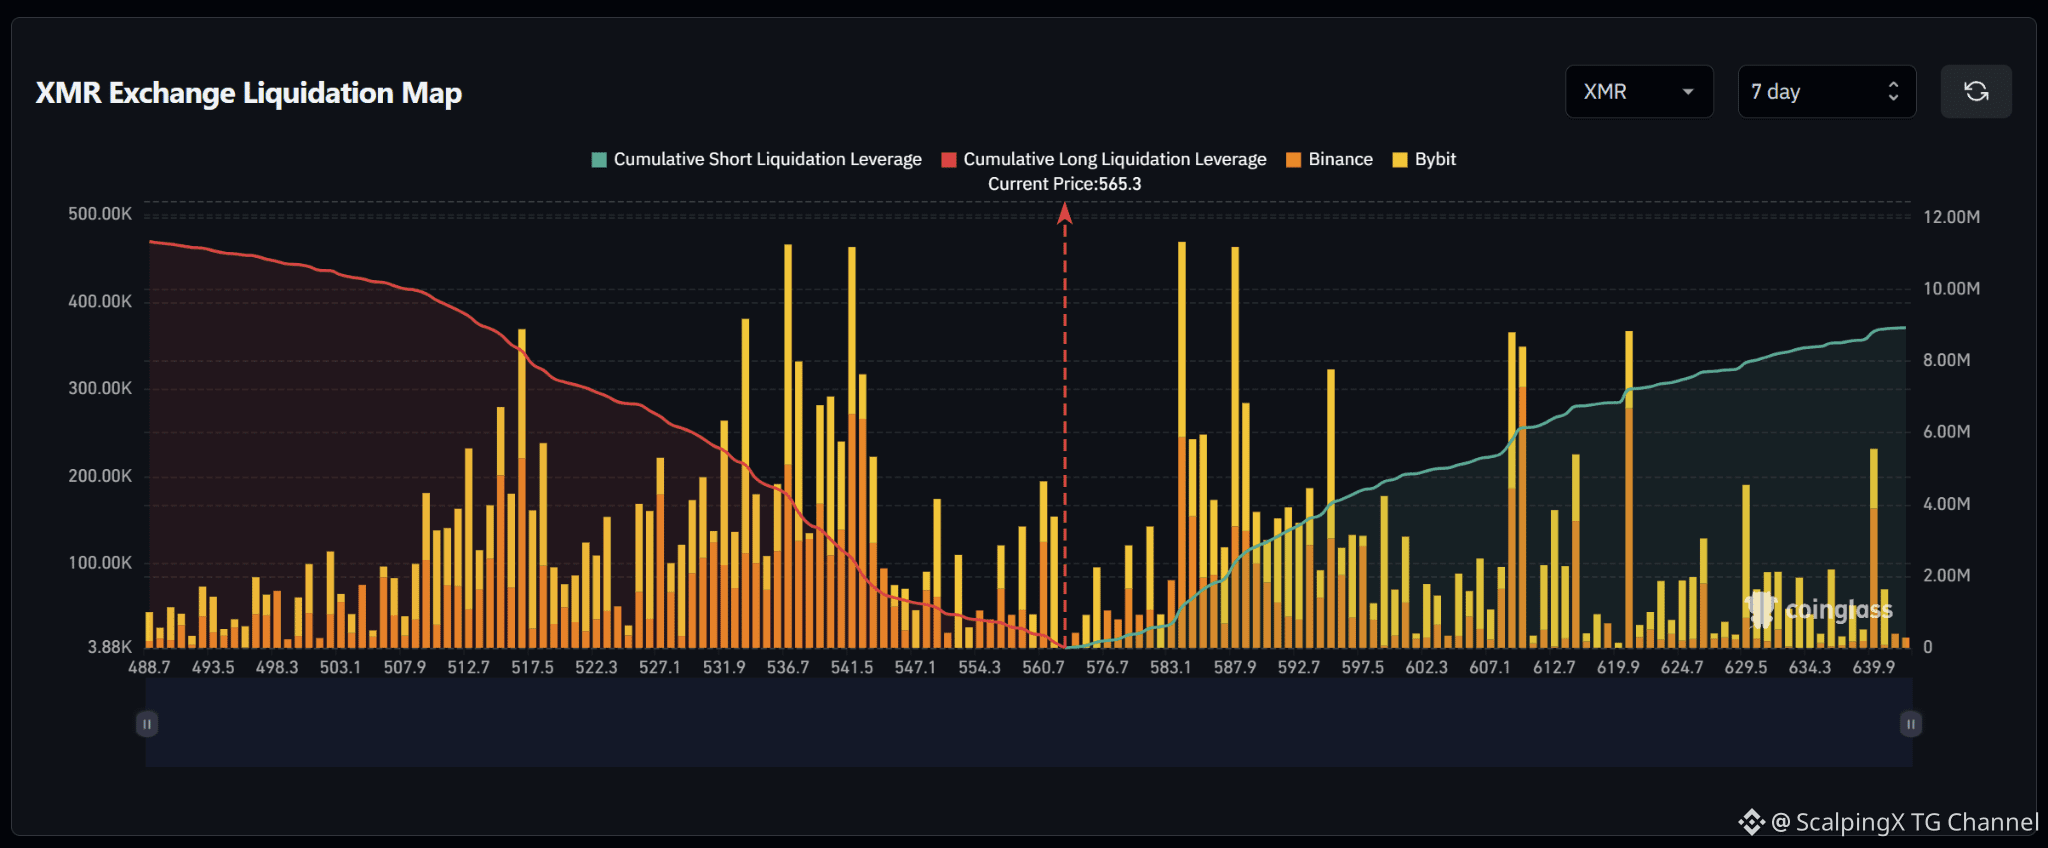
$XMR – Liquidation Map (7 Days) – Current Price 565.3 🔎 The 7-day liquidation map shows roughly 11–11.5 million USD in long liquidations below the current price, exceeding approximately 8.5–9 million USD in short liquidations above. The liquidity structure therefore has a mild downside tilt, with around 1.3 times more cumulative liquidity below the market. 📉 Below the market, long-liquidation liquidity is concentrated mainly across 512–542. The strongest clusters sit around 536–537 and 541–542 with bars near 0.46 million USD, while 516–518 and 531–533 also hold several relatively large pockets. Losing 560 would shift attention toward 547–542 and then 537–532. 📈 Above the market, short-liquidation liquidity is concentrated heavily across 582–589. The two strongest clusters sit around 583–584 and 587–588 with bars near 0.46–0.47 million USD. Further out, 608–610 and 619–620 also contain notable pockets around 0.35–0.37 million USD. 🧭 The broader setup has a mild downside tilt because long-liquidation exposure below remains larger. Losing 560 would increase the probability of a sweep toward 547–542, followed by 537–532. Breaking above 576 would instead expose 583–588 before attention shifts toward 608–620.
$XMR – Liquidation Map (7 Days) – Current Price 565.3 🔎 The 7-day liquidation map shows roughly 11–11.5 million USD in long liquidations below the current price, exceeding approximately 8.5–9 million USD in short liquidations above. The liquidity structure therefore has a mild downside tilt, with around 1.3 times more cumulative liquidity below the market. 📉 Below the market, long-liquidation liquidity is concentrated mainly across 512–542. The strongest clusters sit around 536–537 and 541–542 with bars near 0.46 million USD, while 516–518 and 531–533 also hold several relatively large pockets. Losing 560 would shift attention toward 547–542 and then 537–532. 📈 Above the market, short-liquidation liquidity is concentrated heavily across 582–589. The two strongest clusters sit around 583–584 and 587–588 with bars near 0.46–0.47 million USD. Further out, 608–610 and 619–620 also contain notable pockets around 0.35–0.37 million USD. 🧭 The broader setup has a mild downside tilt because long-liquidation exposure below remains larger. Losing 560 would increase the probability of a sweep toward 547–542, followed by 537–532. Breaking above 576 would instead expose 583–588 before attention shifts toward 608–620.
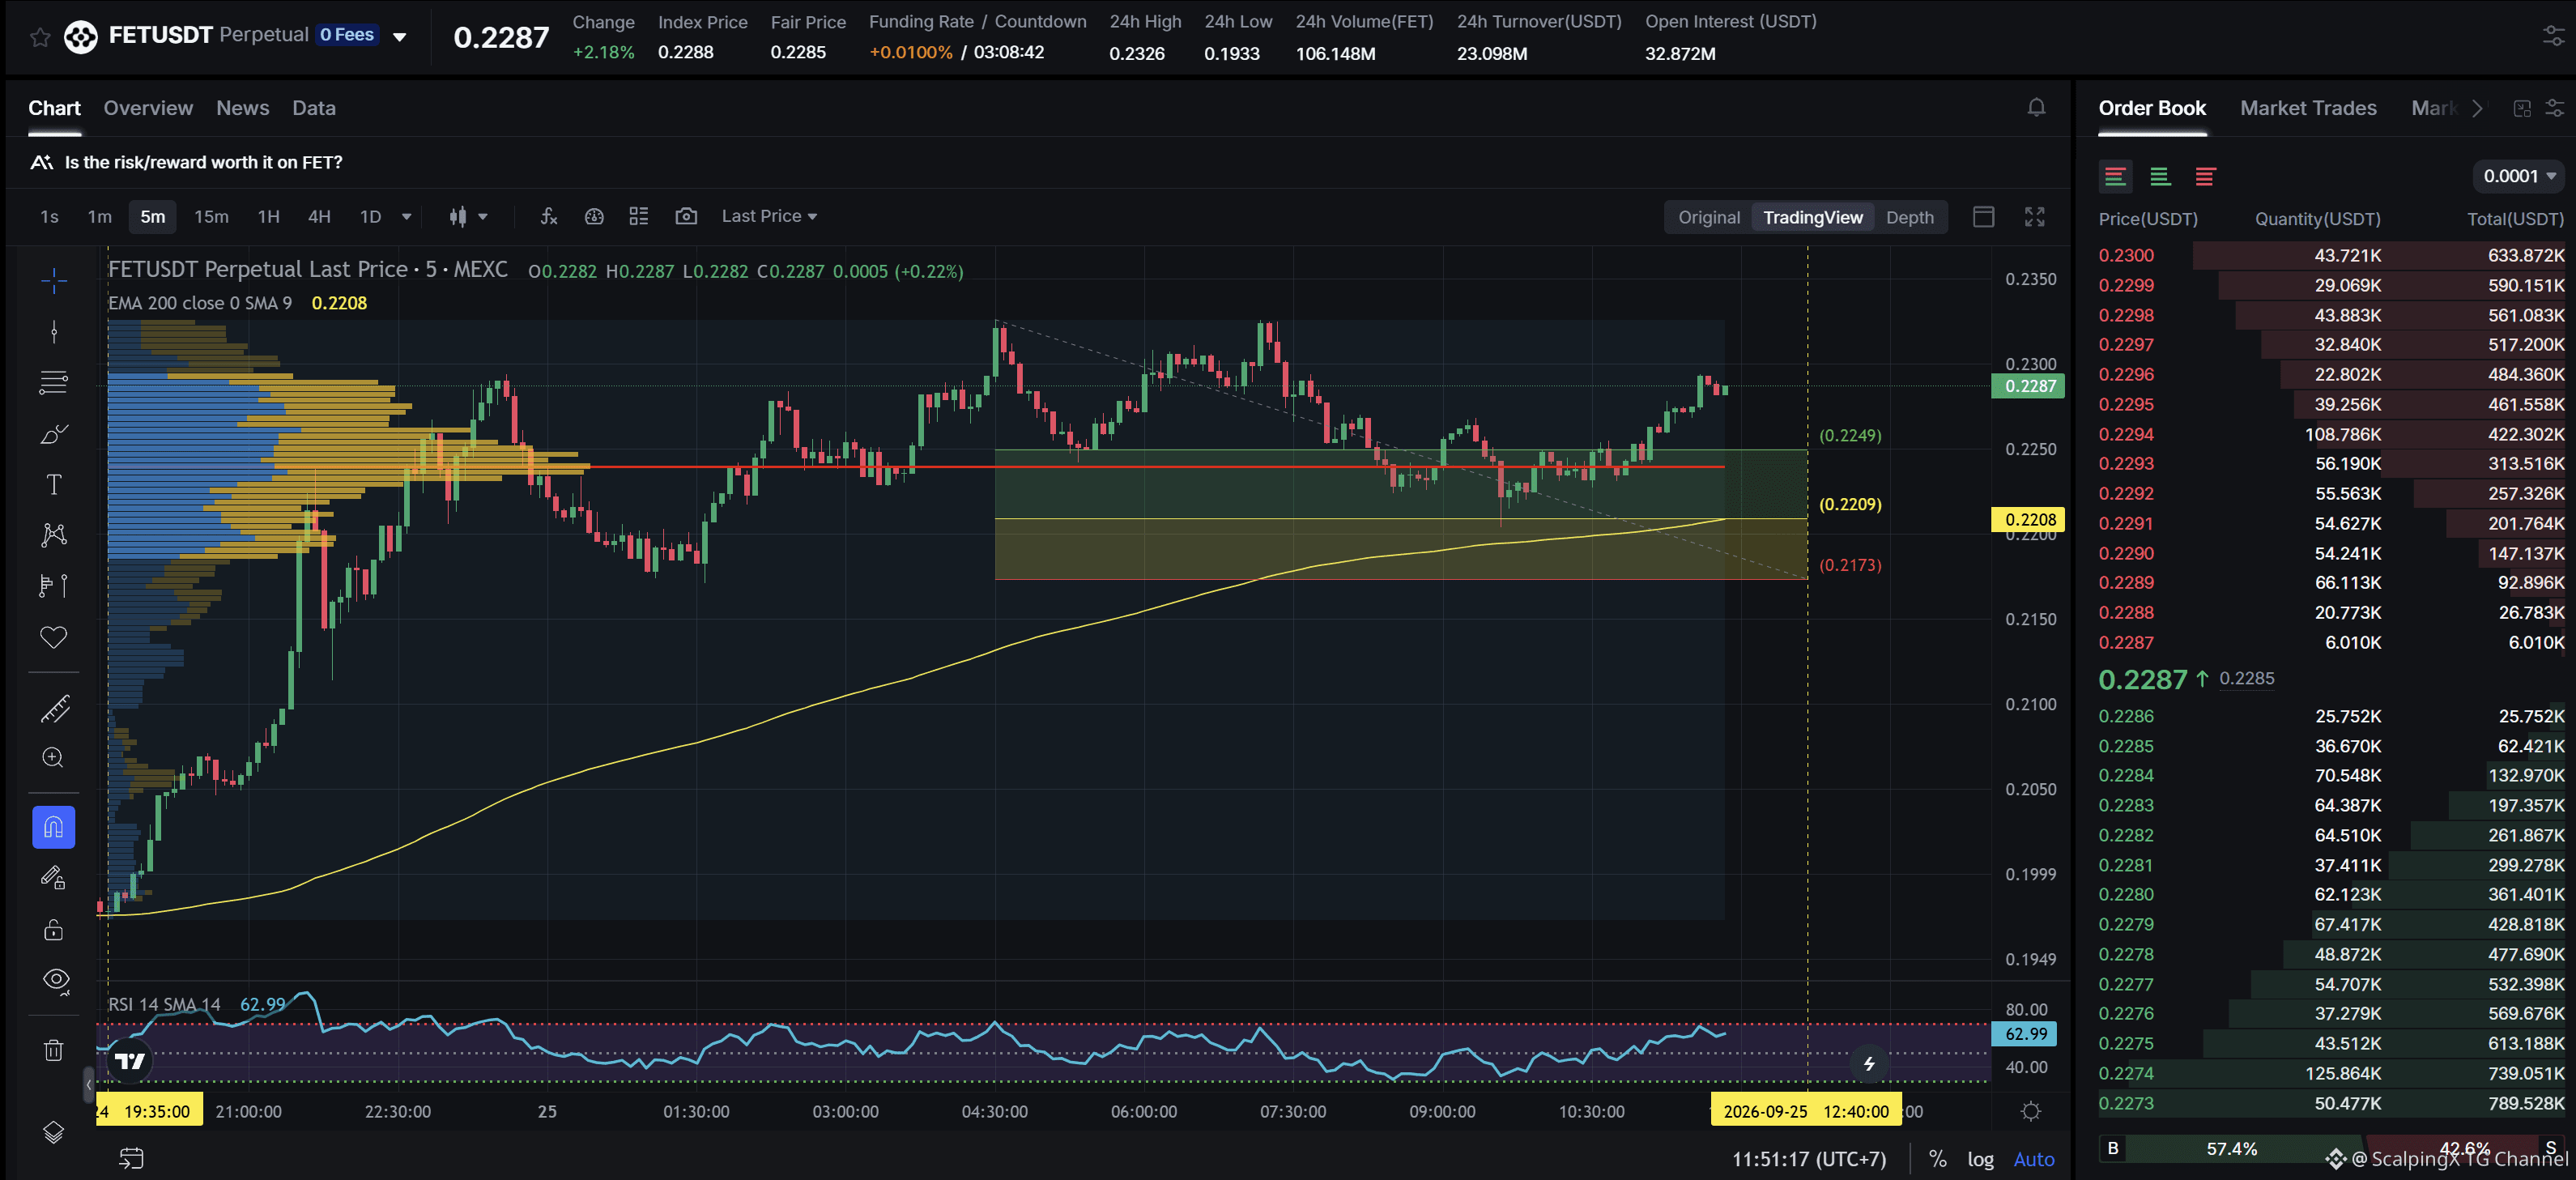
$FET - Mcap 528.3M$ - 24h Sentiment +4.01 Bullish SC02 M5 - pending Long order. Entry lies within HVN + not affected by any weak zone, the current support zone is approximately 1.62% wide. The uptrend has lasted 16 hours 15 minutes, with a maximum recorded price increase of 17.75%. If price loses this support zone, the trend is highly likely to reverse downward.
$FET - Mcap 528.3M$ - 24h Sentiment +4.01 Bullish SC02 M5 - pending Long order. Entry lies within HVN + not affected by any weak zone, the current support zone is approximately 1.62% wide. The uptrend has lasted 16 hours 15 minutes, with a maximum recorded price increase of 17.75%. If price loses this support zone, the trend is highly likely to reverse downward.
1
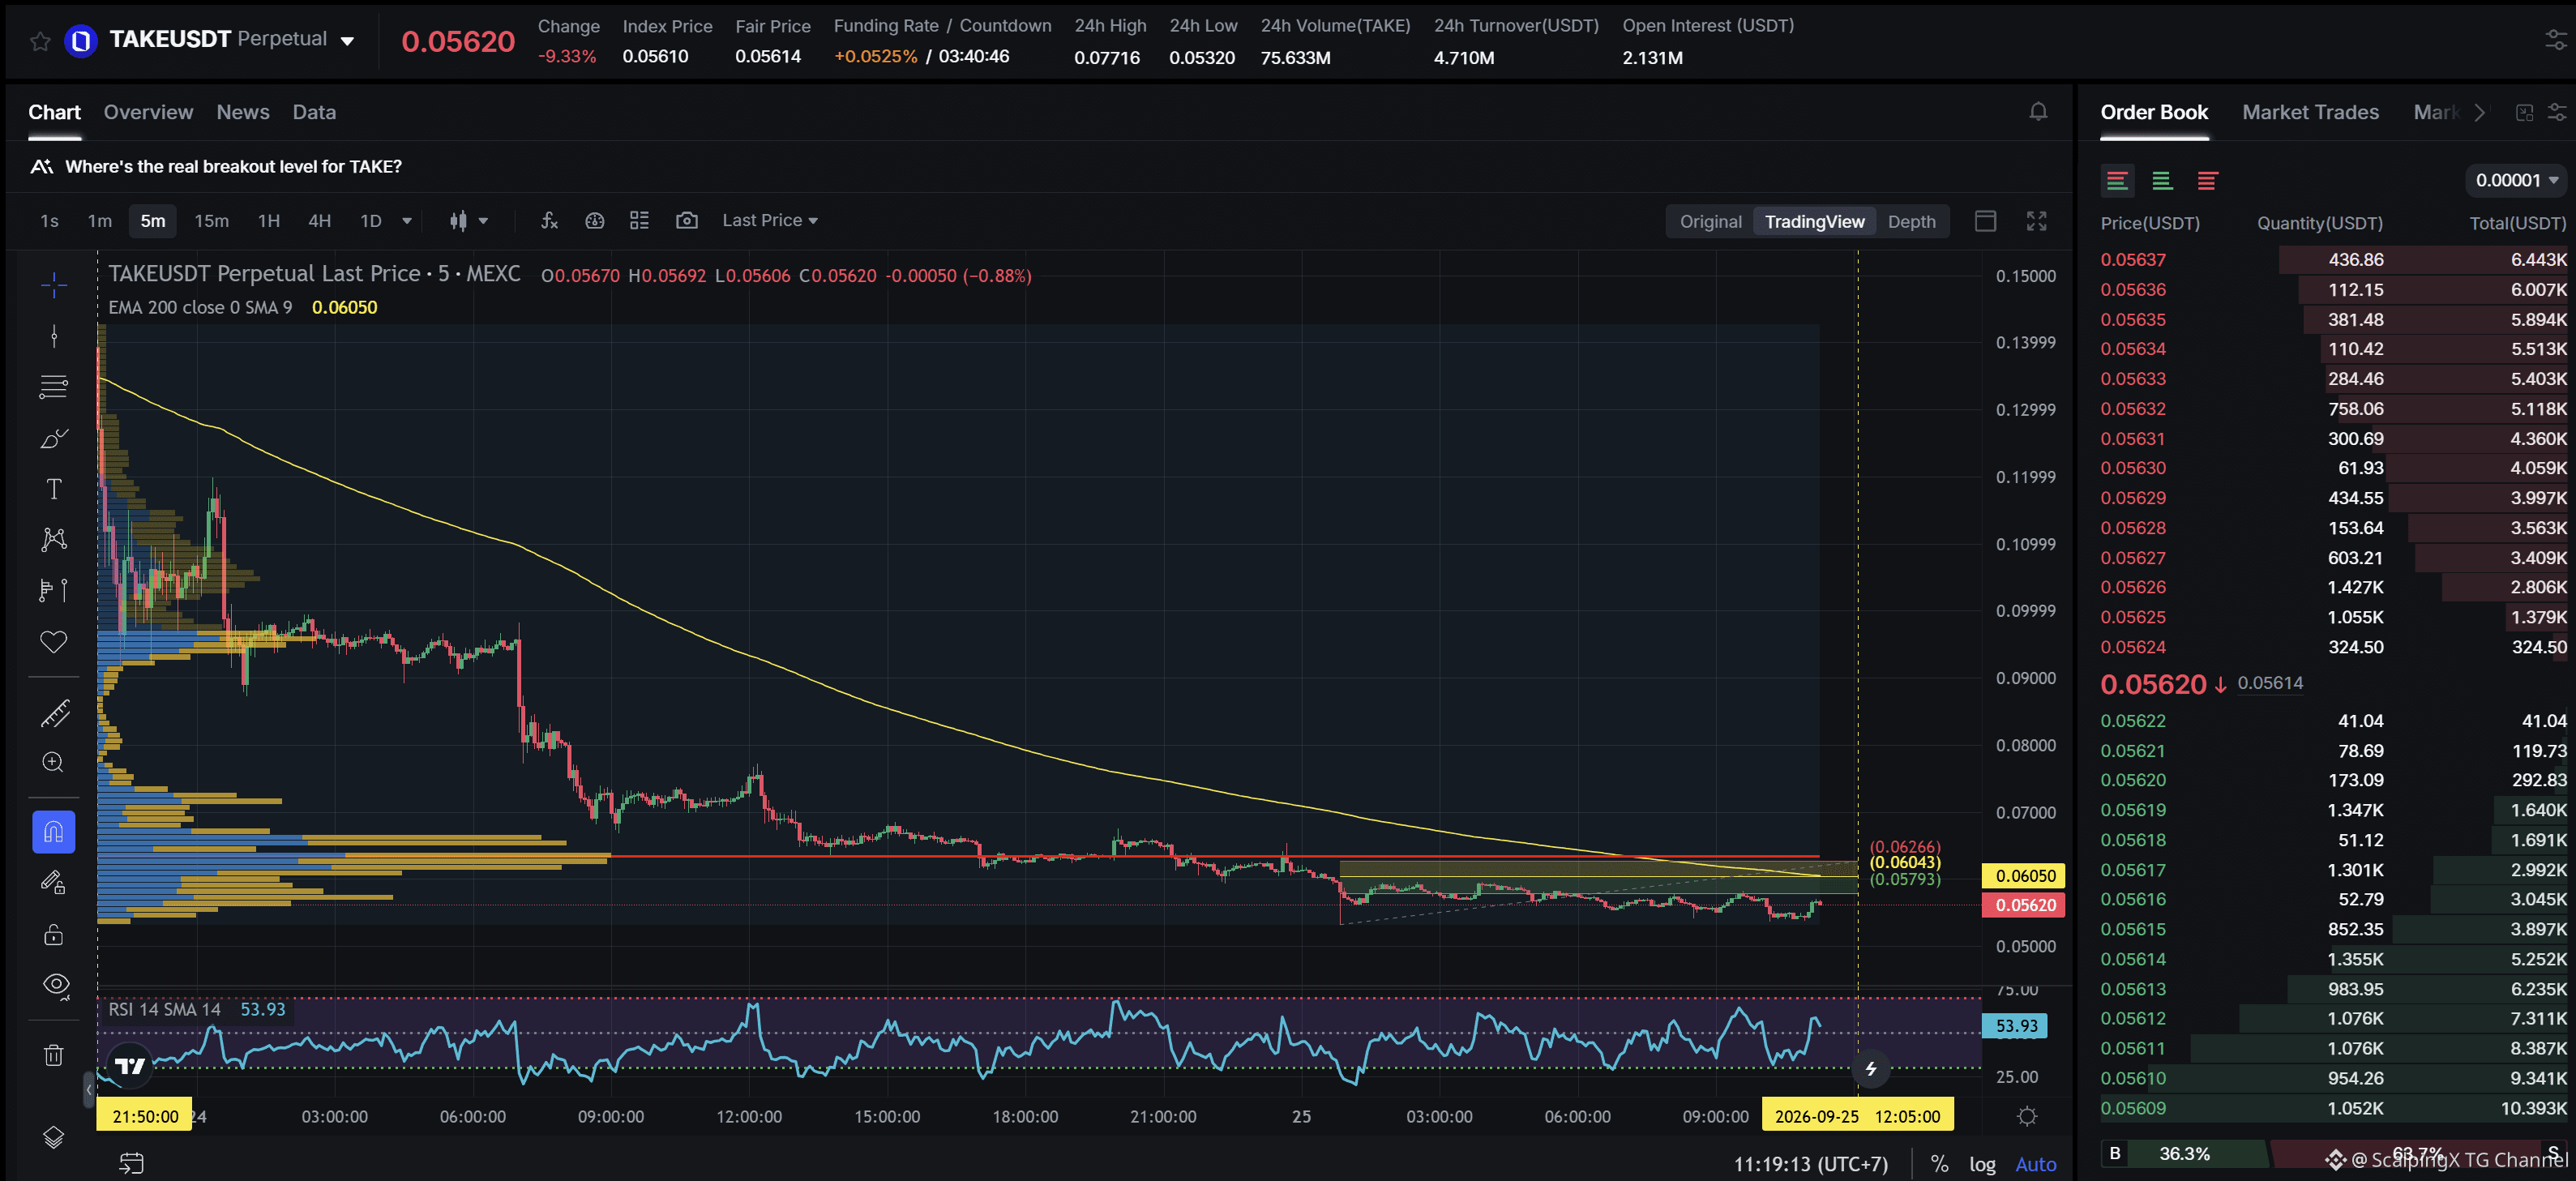
$TAKE - Mcap 21M$ - 24h Sentiment -3.06 Bearish SC02 M5 - pending Short order. Entry lies within HVN + not affected by any weak zone, the current resistance zone is approximately 3.75% wide. The downtrend has lasted 1 day 13 hours 30 minutes, with a maximum recorded price decline of 60.59%. If price breaks above this resistance zone, the trend is highly likely to reverse upward.
$TAKE - Mcap 21M$ - 24h Sentiment -3.06 Bearish SC02 M5 - pending Short order. Entry lies within HVN + not affected by any weak zone, the current resistance zone is approximately 3.75% wide. The downtrend has lasted 1 day 13 hours 30 minutes, with a maximum recorded price decline of 60.59%. If price breaks above this resistance zone, the trend is highly likely to reverse upward.
2
Akamai signs $11.6 billion cloud deal with Anthropic, expanding its role in AI infrastructure
☁️ Anthropic has committed about $11.6 billion over seven years to use Akamai’s cloud and managed services, with an option to expand the agreement by up to another $9 billion. The deal focuses on CPU workloads and distributed core-to-edge infrastructure rather than GPU clusters used for model training.
🏗️ To support the contract, Akamai expects to invest around $5.5 billion in capex over the life of the project, including roughly $1.7 billion brought forward into 2026 for component purchases, particularly memory. The company said the agreement does not change its 2026 revenue guidance.
📈 AKAM shares rose more than 20% in after-hours trading following the announcement. The reaction reflects expectations that Akamai could expand beyond CDN and cybersecurity into AI infrastructure, although the economic value of the deal will depend on execution, capex requirements, and customer concentration around Anthropic.
#AIInfrastructure
$AKAM
Akamai signs $11.6 billion cloud deal with Anthropic, expanding its role in AI infrastructure
☁️ Anthropic has committed about $11.6 billion over seven years to use Akamai’s cloud and managed services, with an option to expand the agreement by up to another $9 billion. The deal focuses on CPU workloads and distributed core-to-edge infrastructure rather than GPU clusters used for model training.
🏗️ To support the contract, Akamai expects to invest around $5.5 billion in capex over the life of the project, including roughly $1.7 billion brought forward into 2026 for component purchases, particularly memory. The company said the agreement does not change its 2026 revenue guidance.
📈 AKAM shares rose more than 20% in after-hours trading following the announcement. The reaction reflects expectations that Akamai could expand beyond CDN and cybersecurity into AI infrastructure, although the economic value of the deal will depend on execution, capex requirements, and customer concentration around Anthropic.
#AIInfrastructure
$AKAM
☁️ Anthropic has committed about $11.6 billion over seven years to use Akamai’s cloud and managed services, with an option to expand the agreement by up to another $9 billion. The deal focuses on CPU workloads and distributed core-to-edge infrastructure rather than GPU clusters used for model training.
🏗️ To support the contract, Akamai expects to invest around $5.5 billion in capex over the life of the project, including roughly $1.7 billion brought forward into 2026 for component purchases, particularly memory. The company said the agreement does not change its 2026 revenue guidance.
📈 AKAM shares rose more than 20% in after-hours trading following the announcement. The reaction reflects expectations that Akamai could expand beyond CDN and cybersecurity into AI infrastructure, although the economic value of the deal will depend on execution, capex requirements, and customer concentration around Anthropic.
#AIInfrastructure
$AKAM
2
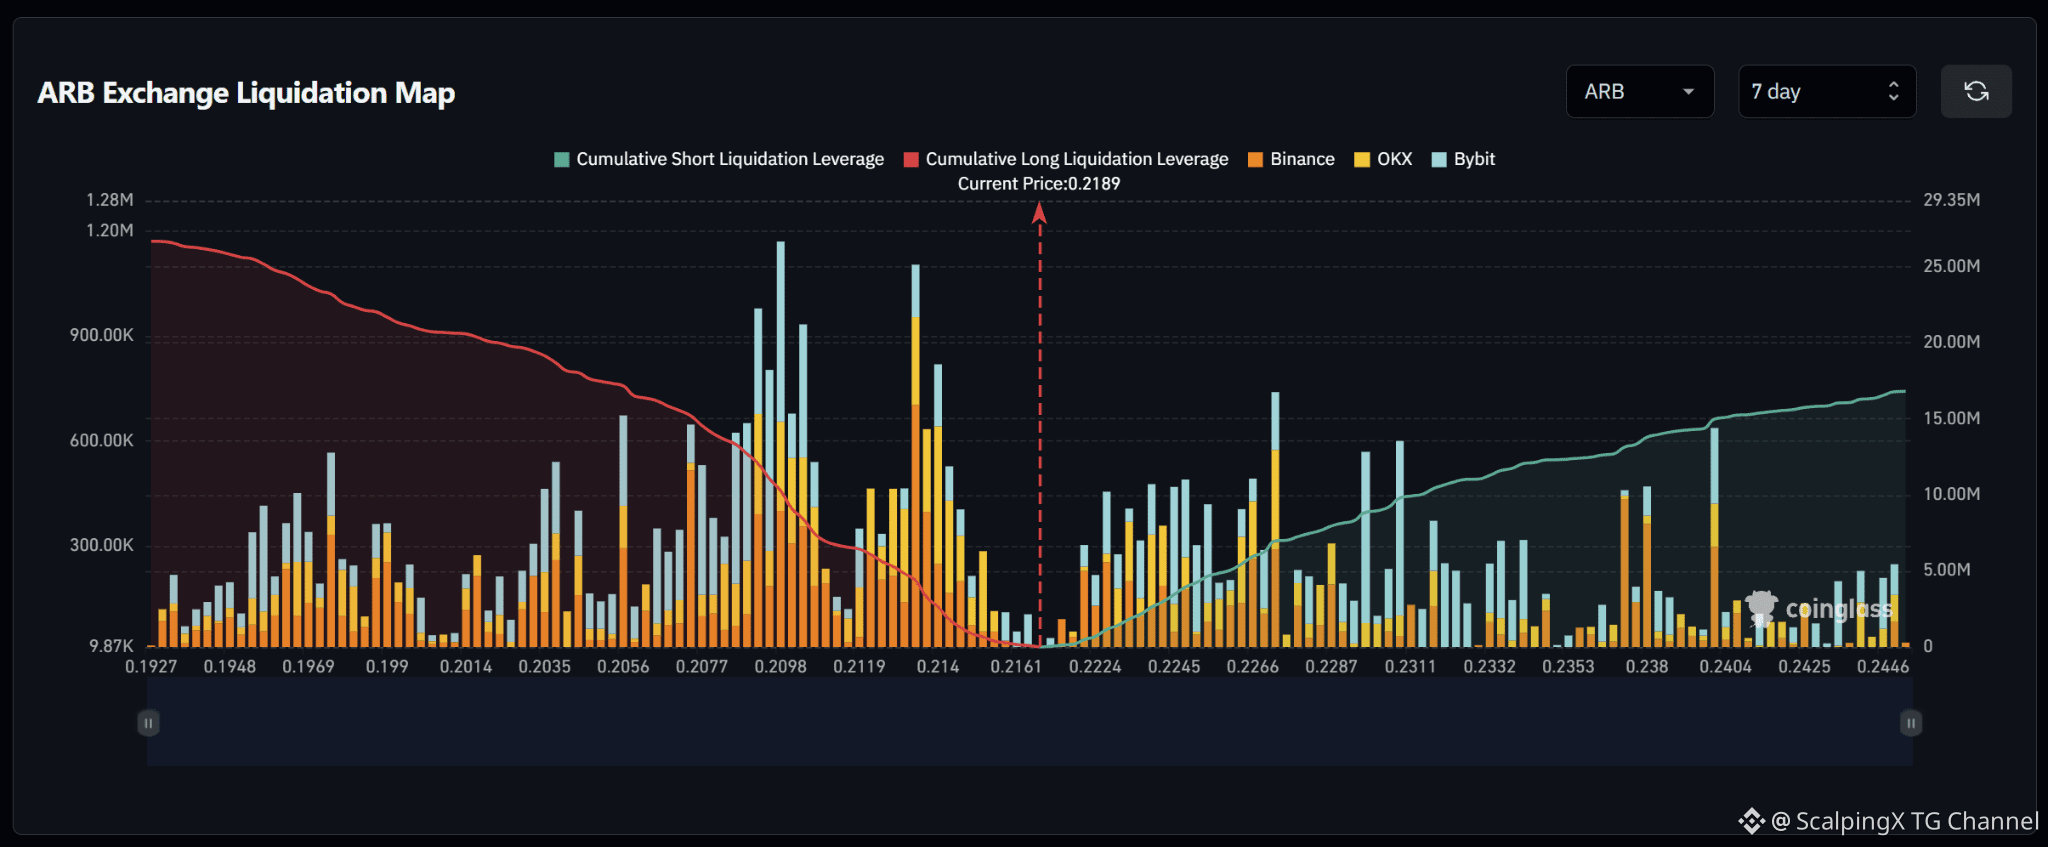
$ARB – Liquidation Map (7 Days) – Current Price 0.2189 🔎 The 7-day liquidation map shows roughly $26–27 million in long liquidations below the current price, exceeding approximately $16–17 million in short liquidations above. The liquidity structure therefore has a downside tilt, with around 1.6 times more cumulative liquidity below the market. 📉 Below the market, long-liquidation liquidity is concentrated heavily across 0.207–0.214. The strongest cluster sits around 0.209–0.210 with a bar close to $1.2 million, while 0.213–0.214 also contains a bar above $1 million. Losing 0.216 would shift attention toward 0.214–0.212 and then 0.210–0.208. 📈 Above the market, short-liquidation liquidity is distributed heavily across 0.222–0.233. A notable cluster sits around 0.226–0.227 with a bar near $0.7 million, while 0.230–0.231 reaches roughly $0.6 million. Further out, 0.237–0.240 contains additional pockets around $0.4–0.6 million. 🧭 The broader setup still favors the downside because long-liquidation exposure below is larger. Losing 0.216 would increase the probability of a sweep toward 0.214–0.212, followed by 0.210–0.208. Breaking above 0.222 would instead expose 0.226–0.231 before attention shifts toward 0.237–0.240.
$ARB – Liquidation Map (7 Days) – Current Price 0.2189 🔎 The 7-day liquidation map shows roughly $26–27 million in long liquidations below the current price, exceeding approximately $16–17 million in short liquidations above. The liquidity structure therefore has a downside tilt, with around 1.6 times more cumulative liquidity below the market. 📉 Below the market, long-liquidation liquidity is concentrated heavily across 0.207–0.214. The strongest cluster sits around 0.209–0.210 with a bar close to $1.2 million, while 0.213–0.214 also contains a bar above $1 million. Losing 0.216 would shift attention toward 0.214–0.212 and then 0.210–0.208. 📈 Above the market, short-liquidation liquidity is distributed heavily across 0.222–0.233. A notable cluster sits around 0.226–0.227 with a bar near $0.7 million, while 0.230–0.231 reaches roughly $0.6 million. Further out, 0.237–0.240 contains additional pockets around $0.4–0.6 million. 🧭 The broader setup still favors the downside because long-liquidation exposure below is larger. Losing 0.216 would increase the probability of a sweep toward 0.214–0.212, followed by 0.210–0.208. Breaking above 0.222 would instead expose 0.226–0.231 before attention shifts toward 0.237–0.240.
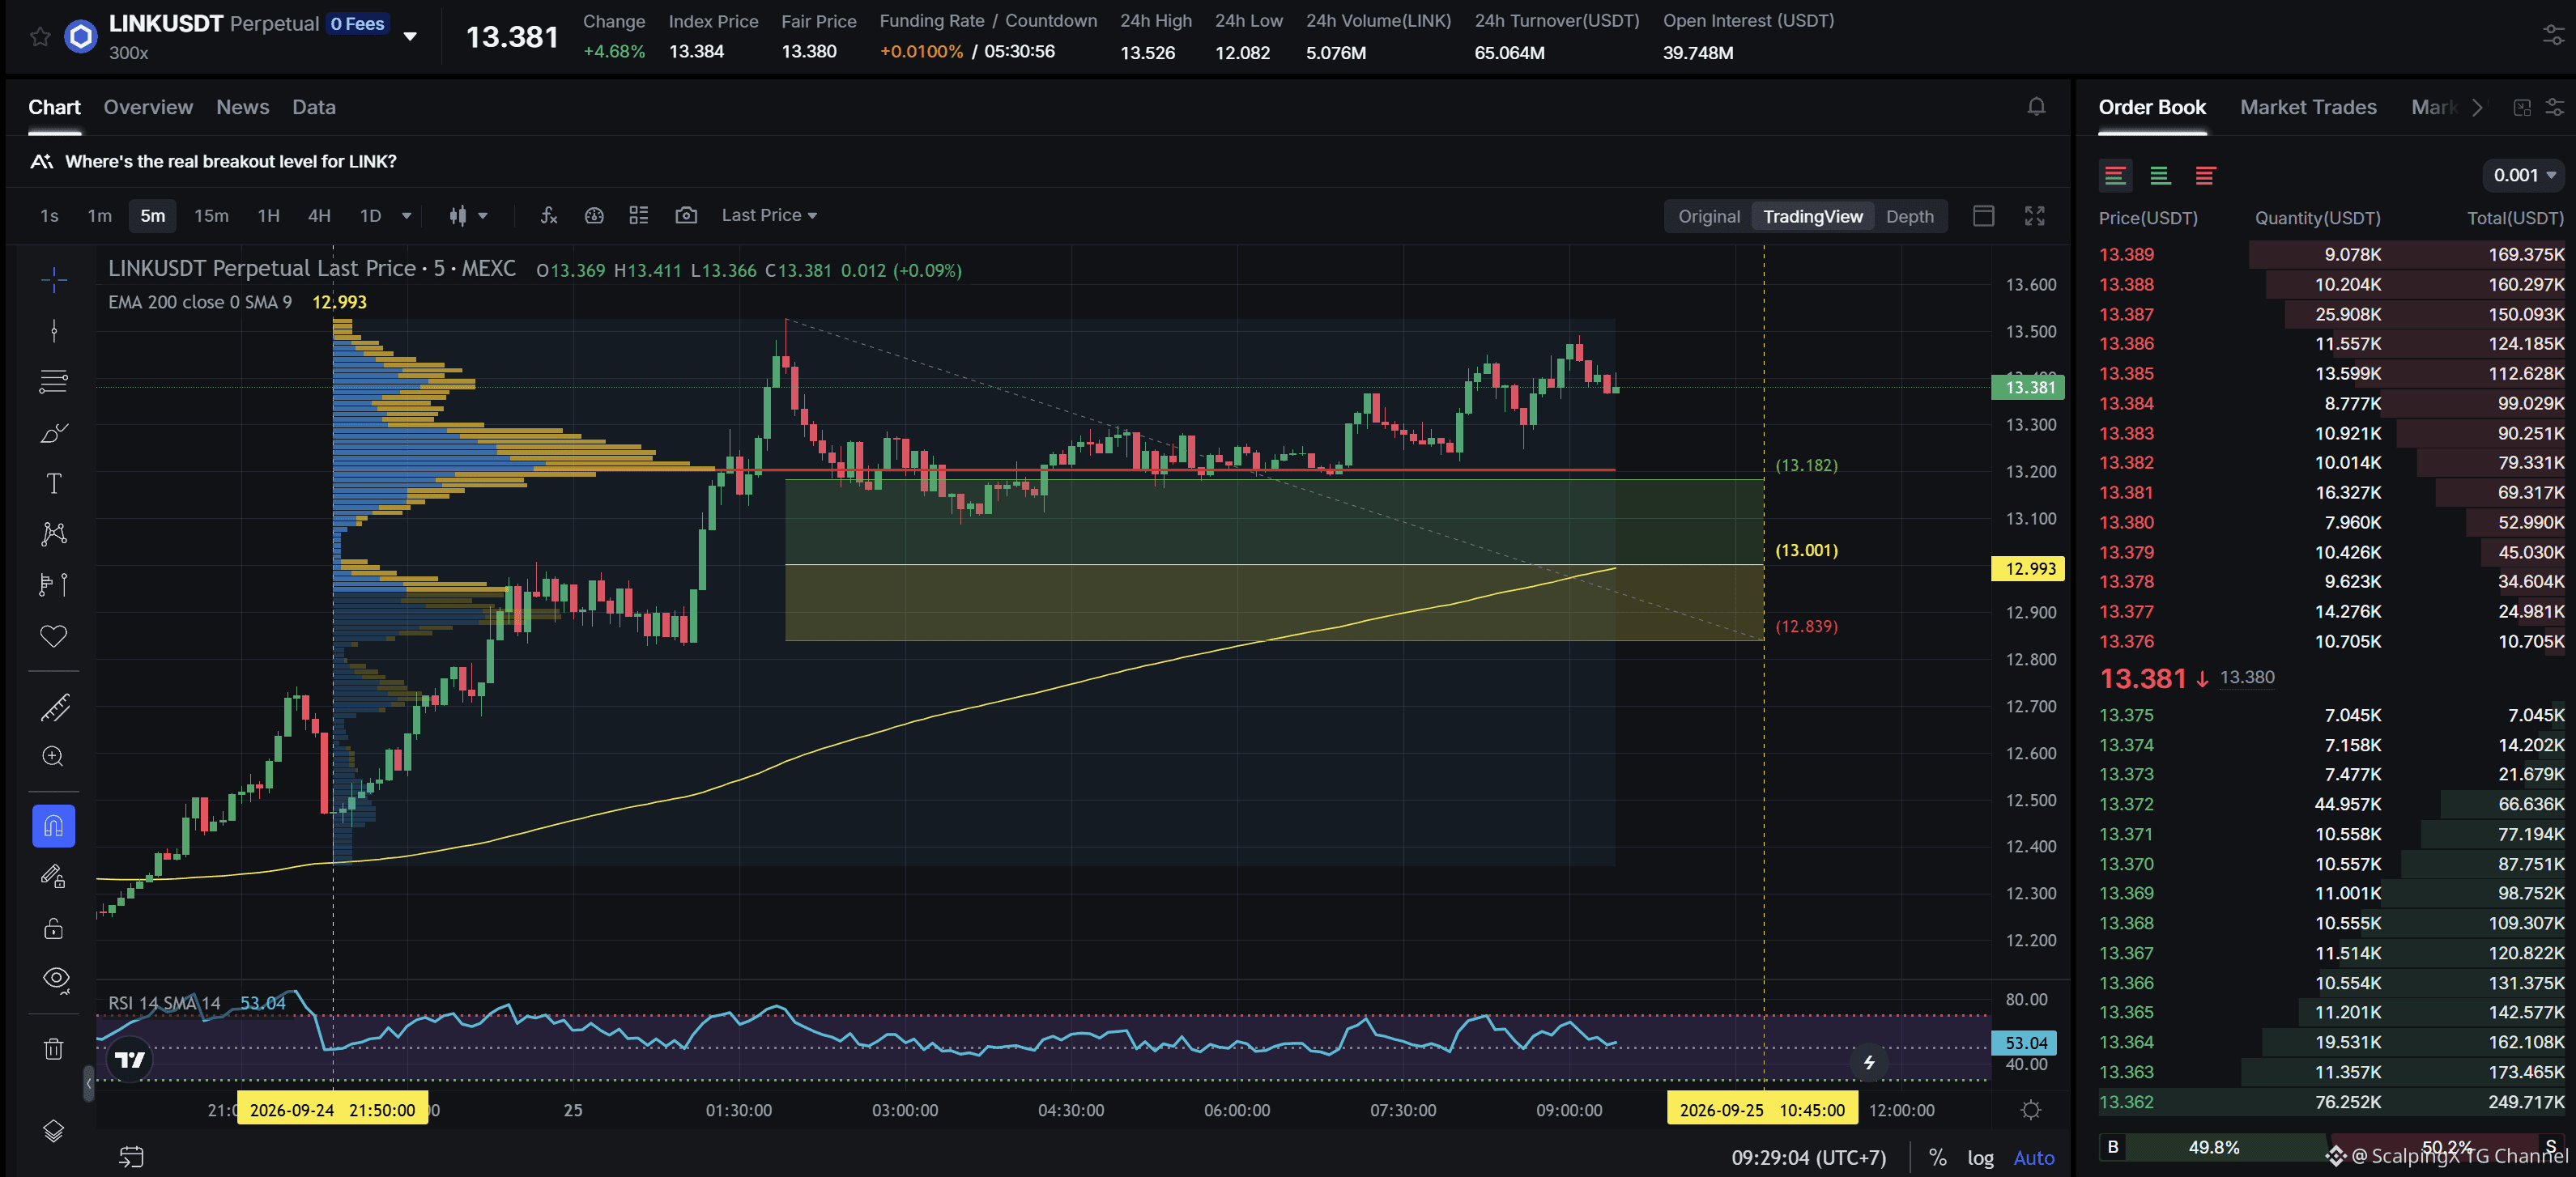
$LINK - Mcap 10.03B$ - 24h Sentiment +4.39 Bullish SC02 M5 - pending Long order. Entry lies within LVN + not affected by any weak zone, the current support zone is approximately 1.19% wide. The uptrend has lasted 11 hours 40 minutes, with a maximum recorded price increase of 9.36%. If price loses this support zone, the trend is highly likely to reverse downward.
$LINK - Mcap 10.03B$ - 24h Sentiment +4.39 Bullish SC02 M5 - pending Long order. Entry lies within LVN + not affected by any weak zone, the current support zone is approximately 1.19% wide. The uptrend has lasted 11 hours 40 minutes, with a maximum recorded price increase of 9.36%. If price loses this support zone, the trend is highly likely to reverse downward.
26
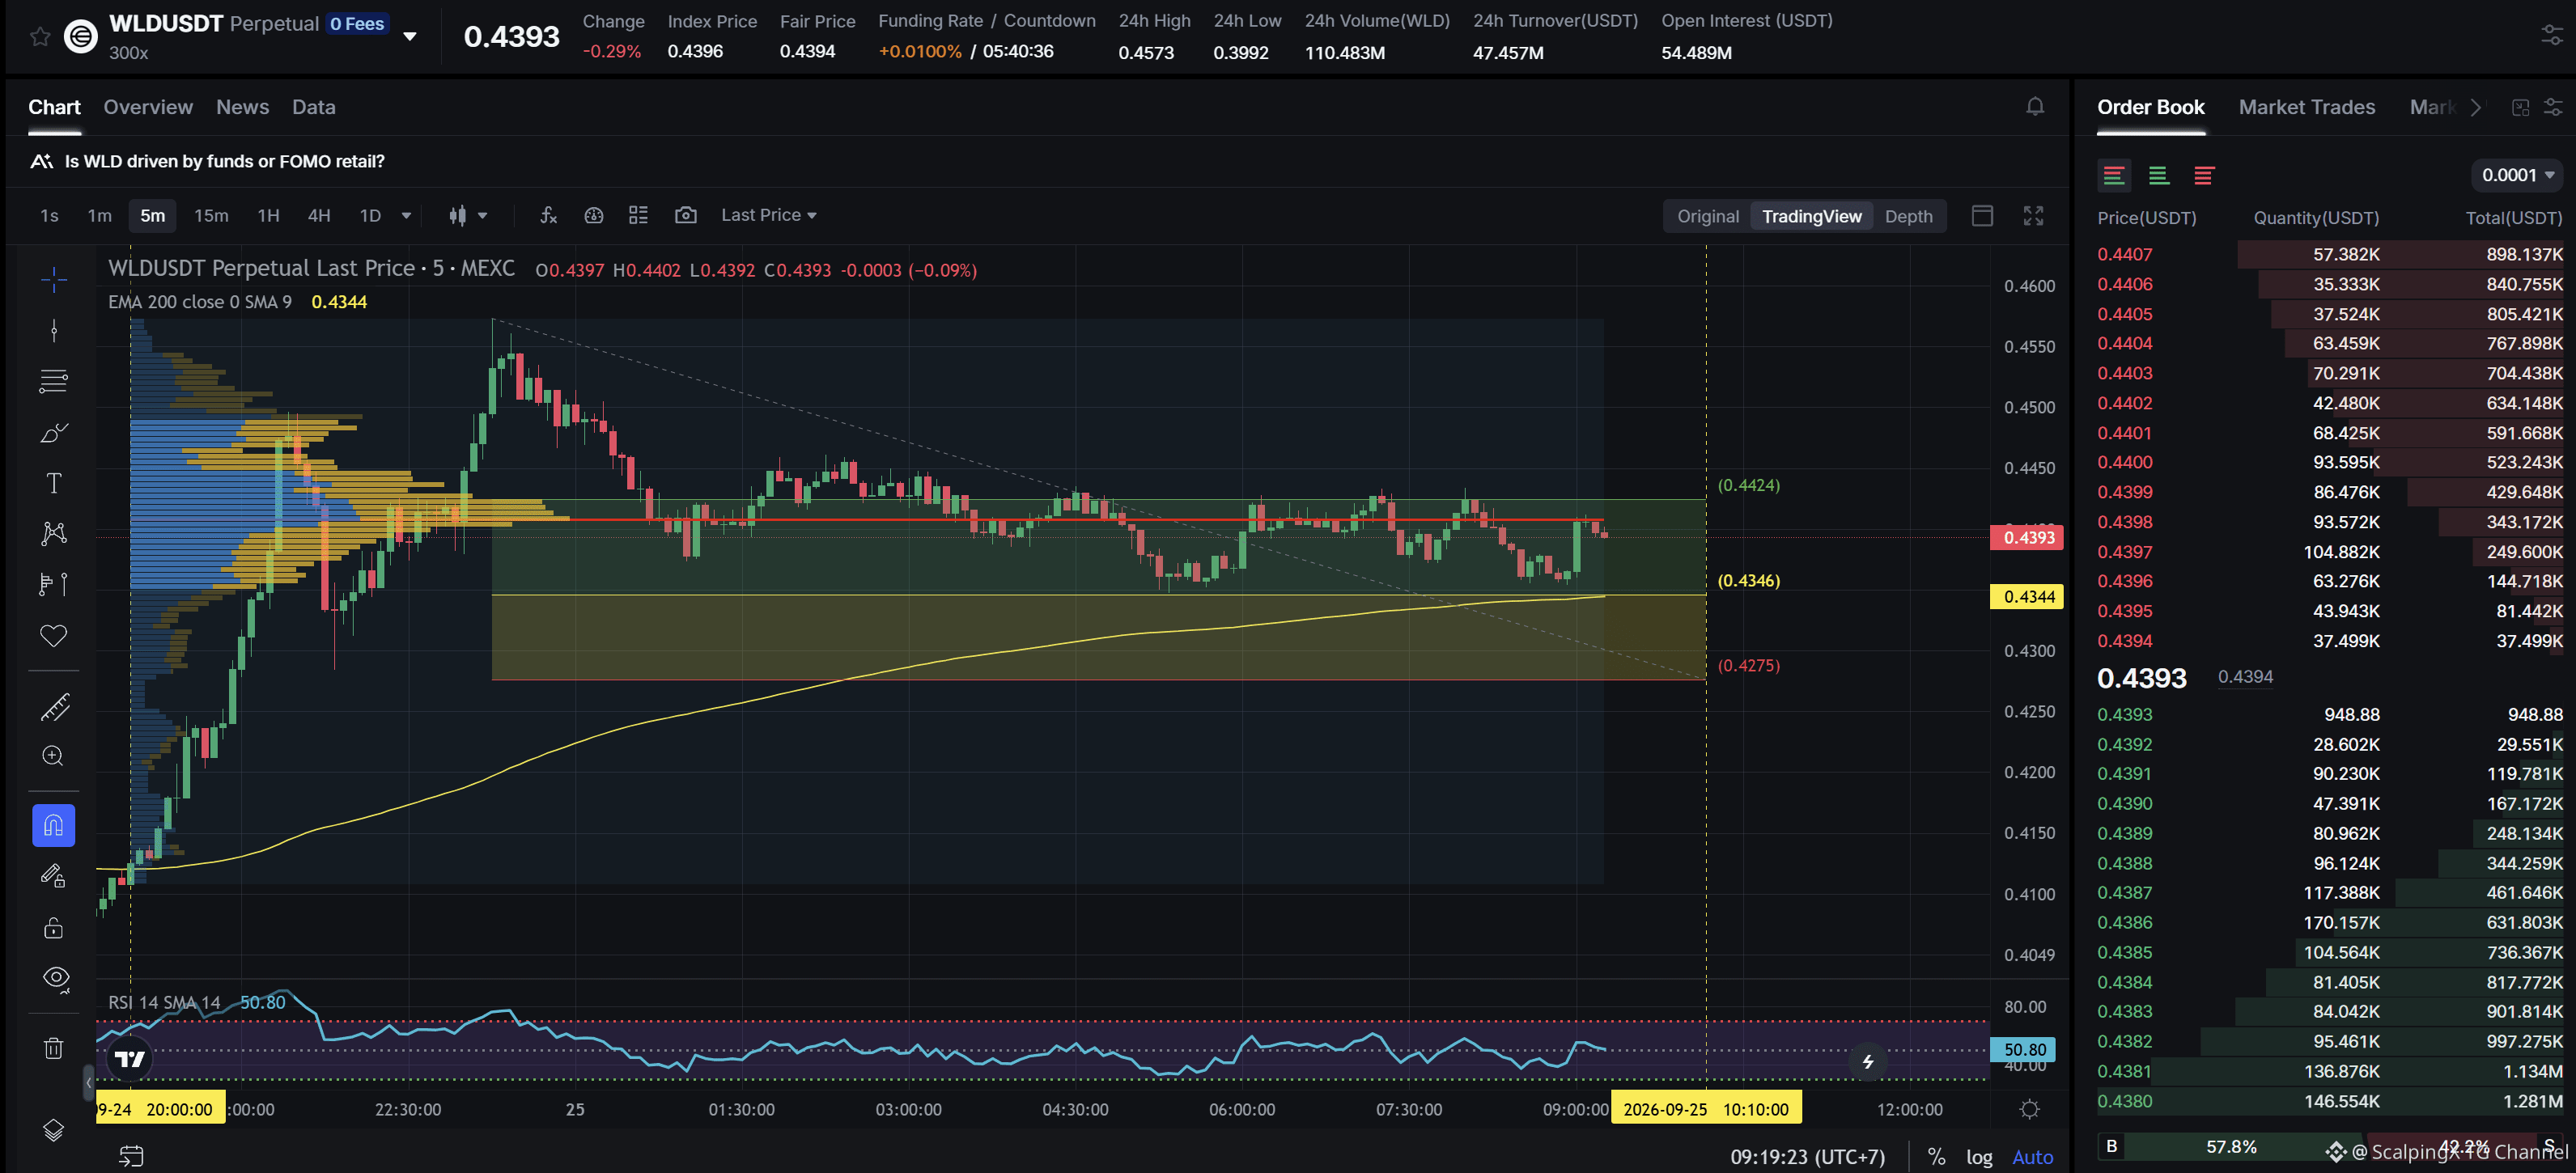
$WLD - Mcap 1.6B$ - 24h Sentiment Neutral SC02 M5 - pending Long order. Entry lies within LVN + not affected by any weak zone, the current support zone is approximately 1.63% wide. The uptrend has lasted 13 hours 20 minutes, with a maximum recorded price increase of 10.90%. If price loses this support zone, the trend is highly likely to reverse downward.
$WLD - Mcap 1.6B$ - 24h Sentiment Neutral SC02 M5 - pending Long order. Entry lies within LVN + not affected by any weak zone, the current support zone is approximately 1.63% wide. The uptrend has lasted 13 hours 20 minutes, with a maximum recorded price increase of 10.90%. If price loses this support zone, the trend is highly likely to reverse downward.
26
Oracle invokes force majeure at Project Jupiter as timeline risks increase
⚠️ Oracle has issued a force majeure notice related to Project Jupiter in New Mexico, seeking contractual protection if the data center does not come online as planned. The move does not mean Oracle is withdrawing from the project.
⚡ The main bottleneck is energy infrastructure. The gas pipeline serving the roughly 2.45 GW AI campus has faced delays, while some permits tied to the power system are still pending.
🏗 Reuters cited a source saying the project could be running about one year behind schedule. Oracle, however, maintains that Jupiter remains on its planned timeline, while Blue Owl says its financial commitment to the project is unchanged.
📉 Markets reacted cautiously, with ORCL and OWL both falling more than 3% in the session. Investors are increasingly focused on power availability and execution risks across the AI data-center buildout.
#AIInfrastructure
$ORCL
Oracle invokes force majeure at Project Jupiter as timeline risks increase
⚠️ Oracle has issued a force majeure notice related to Project Jupiter in New Mexico, seeking contractual protection if the data center does not come online as planned. The move does not mean Oracle is withdrawing from the project.
⚡ The main bottleneck is energy infrastructure. The gas pipeline serving the roughly 2.45 GW AI campus has faced delays, while some permits tied to the power system are still pending.
🏗 Reuters cited a source saying the project could be running about one year behind schedule. Oracle, however, maintains that Jupiter remains on its planned timeline, while Blue Owl says its financial commitment to the project is unchanged.
📉 Markets reacted cautiously, with ORCL and OWL both falling more than 3% in the session. Investors are increasingly focused on power availability and execution risks across the AI data-center buildout.
#AIInfrastructure
$ORCL
⚠️ Oracle has issued a force majeure notice related to Project Jupiter in New Mexico, seeking contractual protection if the data center does not come online as planned. The move does not mean Oracle is withdrawing from the project.
⚡ The main bottleneck is energy infrastructure. The gas pipeline serving the roughly 2.45 GW AI campus has faced delays, while some permits tied to the power system are still pending.
🏗 Reuters cited a source saying the project could be running about one year behind schedule. Oracle, however, maintains that Jupiter remains on its planned timeline, while Blue Owl says its financial commitment to the project is unchanged.
📉 Markets reacted cautiously, with ORCL and OWL both falling more than 3% in the session. Investors are increasingly focused on power availability and execution risks across the AI data-center buildout.
#AIInfrastructure
$ORCL

57
Log in to explore more content
Join global crypto users on Binance Square
⚡️ Get latest and useful information about crypto.
💬 Trusted by the world’s largest crypto exchange.
👍 Discover real insights from verified creators.
Email / Phone number
Trending Topics
QNTRises39%
36,898 views
1,091 Discussing
🚨 QNT IS SURGING! 📈
$QNT is making a huge move today, climbing nearly 40% as buying pressure accelerates.
The rally has put Quant firmly back in the spotlight, with traders watching to see whether this momentum can continue or if a pullback comes next.
🔥 Key things to watch:
• Strong trading volume
• Momentum above recent highs
• The $100 psychological level
• Whether buyers can maintain control
Big moves bring big volatility. Stay alert and manage risk.
Are you watching $QNT? 👀
#QNT #altcoins #CryptoNews
#qntrises39% $QNT
The07
·4 Likes
·4k views
EthereumBreaksAbove$2700
3,427 views
108 Discussing
BitgetBreachForgedRequestsNotStolenKeys
34,912 views
862 Discussing