Binance Square
Bit_Guru
42.3k Posts

Bit_Guru

Square Verified+
Only Live Trader on Binance Square 💛 // Binance, CMC & X kols handle @bitgu_ru // PnL is always Live
Live Trader
Live Trader
Creator Awards 2024
Creator Awards 2024
Open Trade
Frequent Trader
2.6 Years
63 Following
156.6K+ Followers
300.4K+ Liked
3 Badges
Posts
Portfolio
PINNED
·
--
Article
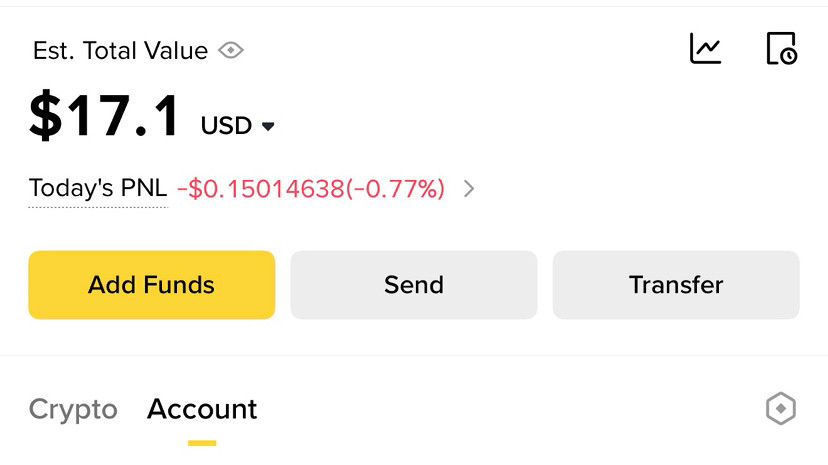
Is it possible to make $100 with only $17Many people think you need a big account to make real money in trading. That’s not true. The truth is simple it’s not about how much you start with, it’s about how you manage what you have. Yes, it is absolutely possible to turn $17 into $100. But not by luck, not by gambling, and definitely not by chasing every pump you see. It requires discipline, patience, and a clear plan. First, you need to understand one thing: small capital requires smart execution. You can’t afford big mistakes. One bad trade with high risk can wipe out your account. That’s why risk management becomes your strongest weapon. Set a daily target. It doesn’t need to be huge. Even 3%–5% per day is enough. It may sound small, but consistency compounds faster than you think. If you stay disciplined, those small wins start building into something big. Second, patience is everything. You don’t need to trade every day or every setup. Wait for clear opportunities strong support and resistance, clean breakouts, or obvious rejection zones. The market always gives chances, but only patient traders take the right ones. Third, control your emotions. With a small account, people often overtrade because they want fast results. That’s where most fail. They increase leverage, take random entries, and ignore their plan. You have to do the opposite stay calm, follow your setup, and accept slow growth. Another important point is consistency over hype. You don’t need one big win. You need many small correct decisions. That’s what builds your account. Even if you grow your account from $17 to $20, then $25, then $35 you are already winning. Also, protect your capital at all costs. If you lose your account, the journey ends. If you protect it, you always have another chance. In simple terms: You don’t grow a small account by rushing You grow it by repeating a disciplined process again and again So yes, turning $17 into $100 is possible. But only for those who are willing to stay patient, follow a plan, and trade with control instead of emotion. The market rewards consistency, not desperation Start small Stay focused And let your discipline do the work Trade Only coins Like $ETH , $BNB & $SOL #cryptotradingpro #RiskManagementMastery {future}(ETHUSDT) {future}(BNBUSDT) {future}(SOLUSDT)

Is it possible to make $100 with only $17

Many people think you need a big account to make real money in trading. That’s not true. The truth is simple it’s not about how much you start with, it’s about how you manage what you have.
Yes, it is absolutely possible to turn $17 into $100. But not by luck, not by gambling, and definitely not by chasing every pump you see. It requires discipline, patience, and a clear plan.
First, you need to understand one thing: small capital requires smart execution. You can’t afford big mistakes. One bad trade with high risk can wipe out your account. That’s why risk management becomes your strongest weapon.
Set a daily target. It doesn’t need to be huge. Even 3%–5% per day is enough. It may sound small, but consistency compounds faster than you think. If you stay disciplined, those small wins start building into something big.
Second, patience is everything. You don’t need to trade every day or every setup. Wait for clear opportunities strong support and resistance, clean breakouts, or obvious rejection zones. The market always gives chances, but only patient traders take the right ones.
Third, control your emotions. With a small account, people often overtrade because they want fast results. That’s where most fail. They increase leverage, take random entries, and ignore their plan. You have to do the opposite stay calm, follow your setup, and accept slow growth.
Another important point is consistency over hype. You don’t need one big win. You need many small correct decisions. That’s what builds your account. Even if you grow your account from $17 to $20, then $25, then $35 you are already winning.
Also, protect your capital at all costs. If you lose your account, the journey ends. If you protect it, you always have another chance.
In simple terms:
You don’t grow a small account by rushing
You grow it by repeating a disciplined process again and again
So yes, turning $17 into $100 is possible. But only for those who are willing to stay patient, follow a plan, and trade with control instead of emotion.
The market rewards consistency, not desperation
Start small
Stay focused
And let your discipline do the work
Trade Only coins Like $ETH , $BNB & $SOL
#cryptotradingpro #RiskManagementMastery

PINNED
·
--
Bullish
It took me 4 years in the crypto market to realize these things & you only need 2 minutes to read: 🤏 1. No matter the market condition, one thing stays the same: 8% of people will own 21 million Bitcoin. 2. Financial, capital, and risk management skills are 100 times more important than technical analysis or crypto research. 3. Earning while you sleep: There are many ways to make money in the crypto market without actively trading. On average, #Bitcoin has increased more than 100% per year over the past 15 years. Yet, why do so few people make money? Because getting rich quickly is a common mentality. If you can't dedicate at least 4 hours a day to crypto, stick to Bitcoin and ETH—70% in BTC and 30% in ETH. Trust no one: Trust leads to hope, disappointment, and errors. Learn independently and take responsibility for your actions. This is how to gain automatic minting experience! The ultimate goal of investing: Make life more meaningful. If crypto investing can achieve that, do it. If not, reconsider. Crypto is now a financial market: Originally born from technology, it's now influenced by macroeconomics and connected to mainstream financial markets. People may discourage you from buying Bitcoin, but remember, once something is widely accepted, the opportunity might be gone. Seize your chance now! Invest wisely, make meaningful choices, and let crypto pave the way to a better future. #CryptoInvesting #ethbeta #Write2Earn! #BinanceTurns7 $BTC $ETH $SOL {spot}(SOLUSDT) {spot}(ETHUSDT) {spot}(BTCUSDT)
It took me 4 years in the crypto market to realize these things & you only need 2 minutes to read: 🤏

1. No matter the market condition, one thing stays the same: 8% of people will own 21 million Bitcoin.
2. Financial, capital, and risk management skills are 100 times more important than technical analysis or crypto research.
3. Earning while you sleep: There are many ways to make money in the crypto market without actively trading.

On average, #Bitcoin has increased more than 100% per year over the past 15 years. Yet, why do so few people make money? Because getting rich quickly is a common mentality. If you can't dedicate at least 4 hours a day to crypto, stick to Bitcoin and ETH—70% in BTC and 30% in ETH.

Trust no one: Trust leads to hope, disappointment, and errors. Learn independently and take responsibility for your actions. This is how to gain automatic minting experience!

The ultimate goal of investing: Make life more meaningful. If crypto investing can achieve that, do it. If not, reconsider.

Crypto is now a financial market: Originally born from technology, it's now influenced by macroeconomics and connected to mainstream financial markets.

People may discourage you from buying Bitcoin, but remember, once something is widely accepted, the opportunity might be gone. Seize your chance now!

Invest wisely, make meaningful choices, and let crypto pave the way to a better future.

#CryptoInvesting #ethbeta #Write2Earn! #BinanceTurns7 $BTC $ETH $SOL

This $PHAROS setup just caught my attention! $PHAROS is holding under an important area and sellers are starting to show pressure. The 15m structure is still developing, so I would rather watch confirmation than chase a candle. 0.46922 is the first level I’m watching, followed by 0.46816. Would you take the first confirmation or wait for a retest? Entry: 0.47134 - 0.47181 TP1: 0.46922 | TP2: 0.46816 | TP3: 0.4671 SL: 0.4729
This $PHAROS setup just caught my attention!

$PHAROS is holding under an important area and sellers are starting to show pressure. The 15m structure is still developing, so I would rather watch confirmation than chase a candle. 0.46922 is the first level I’m watching, followed by 0.46816. Would you take the first confirmation or wait for a retest?

Entry: 0.47134 - 0.47181
TP1: 0.46922 | TP2: 0.46816 | TP3: 0.4671
SL: 0.4729
My community, this $HEMI level is worth watching! The interesting part of this $HEMI setup is the structure. Price is sitting near the decision area while the 15m candles are leaning buyers. Volume is still building, so the next candle matters. I’m watching 0.00735179 and 0.00740400. This is the level I would not ignore. Entry: 0.00724012 - 0.00724737 TP1: 0.00735179 | TP2: 0.00740400 | TP3: 0.00745620 SL: 0.00719299
My community, this $HEMI level is worth watching!

The interesting part of this $HEMI setup is the structure. Price is sitting near the decision area while the 15m candles are leaning buyers. Volume is still building, so the next candle matters. I’m watching 0.00735179 and 0.00740400. This is the level I would not ignore.

Entry: 0.00724012 - 0.00724737
TP1: 0.00735179 | TP2: 0.00740400 | TP3: 0.00745620
SL: 0.00719299
This $RVN setup just caught my attention! The interesting part of this $RVN setup is the structure. Price is sitting near the decision area while the 15m candles are leaning sellers. Volume is supporting the move, so the next candle matters. I’m watching 0.00221996 and 0.00221238. I’m watching the next candle closely here. Entry: 0.00223512 - 0.00223735 TP1: 0.00221996 | TP2: 0.00221238 | TP3: 0.00220480 SL: 0.00224471
This $RVN setup just caught my attention!

The interesting part of this $RVN setup is the structure. Price is sitting near the decision area while the 15m candles are leaning sellers. Volume is supporting the move, so the next candle matters. I’m watching 0.00221996 and 0.00221238. I’m watching the next candle closely here.

Entry: 0.00223512 - 0.00223735
TP1: 0.00221996 | TP2: 0.00221238 | TP3: 0.00220480
SL: 0.00224471
DEXEUSDT: A Strong Rebound, but Not Yet a Confirmed Trend Reversal𝗔 𝘀𝗵𝗮𝗿𝗽 𝗿𝗲𝗯𝗼𝘂𝗻𝗱, 𝗯𝘂𝘁 𝗻𝗼𝘁 𝗮 𝗰𝗹𝗲𝗮𝗻 𝘁𝗿𝗲𝗻𝗱 𝘆𝗲𝘁 DEXEUSDT has appeared on the RR Trader scanner as a LONG setup with an 88.84 confidence score. That makes the pair worth watching, particularly after a forceful recovery from a sharp recent sell-off. Still, the chart is more complicated than a simple rising-price story. DEXE has posted short-term gains and increased trading activity, while the broader trend remains damaged and Bitcoin is lower over the same measured period. The scanner snapshot placed DEXEUSDT near 1.923, with support around 1.9201 and resistance near 1.9586. The market snapshot recorded a last price of 1.882, while CoinGecko showed approximately 1.89. These are different time-sensitive data snapshots rather than one simultaneous quote. The central question is whether DEXE can reclaim the 1.95–1.98 area and hold above it, or whether the current move remains a relief bounce within a larger downtrend. 𝗪𝗵𝗮𝘁 𝗗𝗲𝗫𝗲 𝗶𝘀 𝗱𝗲𝘀𝗶𝗴𝗻𝗲𝗱 𝘁𝗼 𝗱𝗼 DeXe is classified in the supplied research as a decentralized finance project connected with the Ethereum and BNB Chain ecosystems. Its stated model combines social trading activity, trader compensation, governance, treasury management, farming rewards and token-based participation. The project description indicates that users can participate in or follow trading strategies, while token holders can vote on selected protocol decisions. The DEXE token has several stated functions. It can be used in programmed redemption and burning connected to a percentage of traders’ compensation. It is also associated with treasury control and farming rewards derived from social trading activity on DeXe.network. Holders can vote on matters including the timing and percentage of token burns, the share of rewards allocated to farming, the date of a burn and the reward level for farming. The supplied description also refers to a system intended to insure user deposits through staking tokens on DEX. That describes an intended function, not a current measurement of protection. The research does not provide coverage ratios, claims history, reserve details, active user numbers or independently verified evidence showing how much protection is presently available. The function is part of the project’s stated utility, but its practical scale cannot be confirmed from this dataset. 𝗩𝗲𝗿𝗶𝗳𝗶𝗲𝗱 𝗯𝗮𝗰𝗸𝗴𝗿𝗼𝘂𝗻𝗱 𝗮𝗻𝗱 𝗸𝗲𝘆 𝗴𝗮𝗽𝘀 The supplied material identifies the project as DeXe and places it in the decentralized finance, BNB Chain and Ethereum categories. It also identifies token contracts on Ethereum and BNB Chain and lists a project code repository. The research does not provide a verified founding date, founder biographies, funding history, launch details or a confirmed timeline of major product releases. The ecosystem concept is clear enough: DeXe connects social trading activity with incentives, governance and token-based participation. A trader or strategy provider may be connected to compensation, while token holders can influence burn and reward parameters. However, the data does not show current platform volume, active traders, strategy performance, fees generated, treasury size or the amount of DEXE locked in staking. That distinction matters. A token can have defined functions without the available data proving that those functions are currently being used at meaningful scale. Without updated adoption and treasury information, it is difficult to connect DEXE’s market valuation directly to operating metrics. At present, the strongest evidence in the research comes from price, volume and market structure rather than from confirmed changes in protocol usage. 𝗦𝘂𝗽𝗽𝗹𝘆, 𝗺𝗮𝗿𝗸𝗲𝘁 𝗰𝗮𝗽 𝗮𝗻𝗱 𝗱𝗶𝗹𝘂𝘁𝗶𝗼𝗻 The supplied token data lists total supply at approximately 96.50 million DEXE and circulating supply at approximately 35.26 million. A maximum supply is not listed. CoinGecko reports market capitalization near 66.45 million dollars, fully diluted valuation near 181.85 million dollars and a market-cap-to-FDV ratio of 0.37. The difference between circulating supply and total supply means that only part of the stated total is currently represented in circulation, making future supply entering the market an important consideration. The data does not provide a verified unlock calendar, distribution breakdown, treasury allocation, investor allocation or vesting schedule. The absence of a listed maximum supply does not prove unlimited issuance, but it does limit what can be concluded about future dilution. The supplied CoinGecko snapshot places DEXE at market-cap rank 369. Reported 24-hour trading volume is approximately 15.09 million dollars, while the Binance market snapshot shows DEXEUSDT quote volume of about 12.33 million dollars over its own measurement period. These figures are not identical because the sources can use different venues, timestamps and market coverage. Both nevertheless show substantial recent turnover compared with a token whose market capitalization is measured in the tens of millions. 𝗧𝗵𝗲 𝗰𝘂𝗿𝗿𝗲𝗻𝘁 𝗺𝗮𝗿𝗸𝗲𝘁 𝘀𝘁𝗿𝘂𝗰𝘁𝘂𝗿𝗲 The market snapshot shows DEXE rising about 5.20% over 24 hours, from an opening reference near 1.789 to a last recorded price of 1.882. The reported 24-hour range was approximately 1.763 to 1.938. CoinGecko’s corresponding snapshot showed a price near 1.89, a 24-hour gain of 5.14%, a seven-day decline of 4.55%, a 30-day decline of 2.44% and a one-year decline of 73.13%. The mixed time frames are important. DEXE has been strong over the latest measured day but remains negative over the seven-day, 30-day and one-year periods. The four-hour candles show why. DEXE traded near 1.93 before a sharp breakdown reached a low around 1.602. That candle carried more than 3.20 million tokens of volume, higher than many surrounding four-hour periods. Price later stabilized around the 1.75–1.80 region before recovering through 1.85 and 1.90, briefly approaching 1.94. This is a high-volatility recovery structure, but it has not established that the larger downtrend has reversed. Recent hourly candles also show heavier participation during the move through 1.90, with several recording more than 500,000 DEXE in volume. The latest reported hourly candle was around 1.882 after a pullback from the 1.93–1.94 zone. That retreat shows that buyers have not yet secured firm control above the recent local high. It also leaves a nearby decision area where failed breakouts and rapid reversals remain possible. 𝗪𝗵𝘆 𝘁𝗵𝗲 𝘀𝗰𝗮𝗻𝗻𝗲𝗿 𝘀𝗲𝘁𝘂𝗽 𝗺𝗮𝘁𝘁𝗲𝗿𝘀 The RR Trader scanner selected DEXEUSDT as a LONG candidate with an 88.84 confidence score, a selection score of 167.58, a hot priority of 10.749 and a top-gainer category rank of 11. It reported a 15-minute move of approximately 2.18% and a volume ratio of 1.62. In practical terms, the scanner detected upward short-term momentum alongside volume running above its reference level. The scanner’s entry band was 1.9201 to 1.9220, close to its stated support level of 1.9201. Its resistance level was 1.9586. The projected upside checkpoints were 1.9497, 1.9636 and 1.9774, while the stop-loss reference was 1.9076. The scanner calculated a risk-reward figure near 1.92. Those figures are outputs from a market scanner, not evidence of future price behavior. The setup is notable because it combines a recovery from a deep four-hour decline with higher volume and a clearly defined nearby structure. It is also fragile for the same reason. DEXE remains close to recent resistance, and the latest market snapshot shows that price has already pulled back from the 1.93–1.94 region. A high scanner score can identify a favorable short-term arrangement, but it cannot confirm that demand will continue after profit-taking or that the broader trend has changed. 𝗕𝗶𝘁𝗰𝗼𝗶𝗻 𝗮𝗻𝗱 𝘁𝗵𝗲 𝘄𝗶𝗱𝗲𝗿 𝗺𝗮𝗿𝗸𝗲𝘁 Bitcoin is not providing a strong tailwind in the supplied snapshot. BTC was recorded near 76,910.40 dollars, down 1.80% over the measured 24-hour period from an opening reference near 78,319.90. Its reported range was approximately 76,402.90 to 78,542. DEXE’s gain therefore occurred while Bitcoin was losing ground. That may reflect token-specific buying or a rebound that is temporarily stronger than the wider market. It does not, by itself, establish a durable decoupling. Smaller digital assets can rise while Bitcoin is weak and then reverse if broader market pressure increases. DEXE’s own longer-period performance reinforces that caution. The supplied data shows declines over seven days, 30 days, 60 days, 200 days and one year. The token’s latest recovery is therefore occurring inside a market history that remains substantially negative. A more constructive interpretation would require DEXE to hold reclaimed levels while Bitcoin stabilizes rather than simply posting one strong day against a falling BTC market. 𝗡𝗼 𝗳𝗿𝗲𝘀𝗵 𝘃𝗲𝗿𝗶𝗳𝗶𝗲𝗱 𝗻𝗲𝘄𝘀 𝗰𝗮𝘁𝗮𝗹𝘆𝘀𝘁 The supplied news field is empty. There is no verified announcement in the research covering a new DeXe product, partnership, exchange listing, governance vote, token burn, treasury action, integration or funding event. Any explanation linking the current price move to a specific announcement would therefore be unsupported. The identifiable near-term driver is market structure itself. DEXE recovered from approximately 1.602, reclaimed the 1.80 and 1.90 areas and attracted heavier volume during the rebound. If the project later confirms a burn, governance decision, product release or measurable increase in social trading activity, that could add a fundamental narrative. No such catalyst is verified in the available material. For now, price acceptance is the more reliable evidence in this dataset. A sustained move above the recent 1.938 high would improve the short-term chart, while a move through scanner resistance near 1.9586 would place the 1.9636 and 1.9774 areas in focus. Rejection near those levels would instead show that sellers remain active. 𝗞𝗲𝘆 𝗹𝗲𝘃𝗲𝗹𝘀 𝗮𝗻𝗱 𝗿𝗶𝘀𝗸𝘀 The scanner identifies immediate support at 1.9201, with an entry band between 1.9201 and 1.9220. Resistance is listed near 1.9586. The projected levels are 1.9497, 1.9636 and 1.9774, while 1.9076 is the stated invalidation or stop reference for that specific setup. These are short-term market-data markers rather than fixed boundaries. The wider chart adds 1.938 as a recent high, 1.88–1.90 as a reaction zone, and approximately 1.80, 1.76 and 1.602 as notable areas from the recent decline. The principal technical risk is a failed recovery. DEXE has already moved from roughly 1.93 to 1.602 within a four-hour structure, showing that volatility can be substantial. A move below 1.9076 would weaken the scanner thesis, while a deeper break below 1.88 could shift attention toward the 1.80–1.76 region. A return toward 1.602 would represent a much more serious deterioration of the rebound structure. Fundamental risks are concentrated in incomplete information and dilution uncertainty. The research does not verify current adoption, active users, treasury holdings, staking participation, insurance reserves, unlock timing or the exact economic impact of token burns. The token is also reported at roughly 96% below its all-time high of 48.91 dollars, although the supplied historical records contain date inconsistencies and should not be treated as a complete price history. 𝗪𝗵𝗮𝘁 𝘁𝗼 𝘄𝗮𝘁𝗰𝗵 𝗻𝗲𝘅𝘁 The first technical test is whether DEXE can hold the 1.90–1.92 area after the latest pullback. Holding that zone while volume remains elevated would show that buyers are defending the scanner’s structure. The next tests are the 1.938 recent high and the 1.9586 resistance level. A move beyond them would improve the short-term chart, but the market would still need to hold those levels rather than produce only a brief intraday move. The opposing signal would be a move below 1.9076 followed by weakening volume or a slide beneath 1.88. That would undermine the scanner’s long setup and bring 1.80 and 1.76 back into view. Bitcoin should be considered alongside these levels because DEXE’s rebound is occurring while BTC is lower over the measured period. On the project side, the most useful future information would be verifiable data on DeXe usage, trading activity, staking, treasury decisions, token burns, governance participation and supply unlocks. Those details would help distinguish an improvement in network utility from a purely technical rebound. Until such information is available, price and volume remain the clearest evidence in the supplied research. 𝗕𝗮𝗹𝗮𝗻𝗰𝗲𝗱 𝗰𝗼𝗻𝗰𝗹𝘂𝘀𝗶𝗼𝗻 DEXEUSDT stands out because the scanner has identified a high-confidence short-term long structure while the token is showing relative strength against a weaker Bitcoin market. The recovery from 1.602, the return toward 1.90 and the increase in volume all show that buyers have been active. The scanner levels around 1.9201 support, 1.9586 resistance and 1.9076 invalidation provide a defined framework for evaluating the move. The evidence does not yet confirm a lasting trend reversal. DEXE remains down over the longer periods reported by CoinGecko, the four-hour chart still reflects a major breakdown, and the latest market snapshot shows a pullback from 1.938. Current adoption, treasury activity and supply details are incomplete, while no fresh verified news catalyst is present. The balanced reading is that DEXE has produced a strong recovery attempt, not a confirmed fundamental comeback. Holding nearby support, reclaiming recent highs, maintaining meaningful volume and trading through a more stable Bitcoin backdrop would strengthen the bullish interpretation. Losing the scanner’s invalidation area would weaken it quickly. For now, DEXE deserves attention because of its momentum and structure, while confirmation must come from sustained price acceptance and clearer evidence of active DeXe utility.

DEXEUSDT: A Strong Rebound, but Not Yet a Confirmed Trend Reversal

𝗔 𝘀𝗵𝗮𝗿𝗽 𝗿𝗲𝗯𝗼𝘂𝗻𝗱, 𝗯𝘂𝘁 𝗻𝗼𝘁 𝗮 𝗰𝗹𝗲𝗮𝗻 𝘁𝗿𝗲𝗻𝗱 𝘆𝗲𝘁
DEXEUSDT has appeared on the RR Trader scanner as a LONG setup with an 88.84 confidence score. That makes the pair worth watching, particularly after a forceful recovery from a sharp recent sell-off. Still, the chart is more complicated than a simple rising-price story. DEXE has posted short-term gains and increased trading activity, while the broader trend remains damaged and Bitcoin is lower over the same measured period.
The scanner snapshot placed DEXEUSDT near 1.923, with support around 1.9201 and resistance near 1.9586. The market snapshot recorded a last price of 1.882, while CoinGecko showed approximately 1.89. These are different time-sensitive data snapshots rather than one simultaneous quote. The central question is whether DEXE can reclaim the 1.95–1.98 area and hold above it, or whether the current move remains a relief bounce within a larger downtrend.
𝗪𝗵𝗮𝘁 𝗗𝗲𝗫𝗲 𝗶𝘀 𝗱𝗲𝘀𝗶𝗴𝗻𝗲𝗱 𝘁𝗼 𝗱𝗼
DeXe is classified in the supplied research as a decentralized finance project connected with the Ethereum and BNB Chain ecosystems. Its stated model combines social trading activity, trader compensation, governance, treasury management, farming rewards and token-based participation. The project description indicates that users can participate in or follow trading strategies, while token holders can vote on selected protocol decisions.
The DEXE token has several stated functions. It can be used in programmed redemption and burning connected to a percentage of traders’ compensation. It is also associated with treasury control and farming rewards derived from social trading activity on DeXe.network. Holders can vote on matters including the timing and percentage of token burns, the share of rewards allocated to farming, the date of a burn and the reward level for farming.
The supplied description also refers to a system intended to insure user deposits through staking tokens on DEX. That describes an intended function, not a current measurement of protection. The research does not provide coverage ratios, claims history, reserve details, active user numbers or independently verified evidence showing how much protection is presently available. The function is part of the project’s stated utility, but its practical scale cannot be confirmed from this dataset.
𝗩𝗲𝗿𝗶𝗳𝗶𝗲𝗱 𝗯𝗮𝗰𝗸𝗴𝗿𝗼𝘂𝗻𝗱 𝗮𝗻𝗱 𝗸𝗲𝘆 𝗴𝗮𝗽𝘀
The supplied material identifies the project as DeXe and places it in the decentralized finance, BNB Chain and Ethereum categories. It also identifies token contracts on Ethereum and BNB Chain and lists a project code repository. The research does not provide a verified founding date, founder biographies, funding history, launch details or a confirmed timeline of major product releases.
The ecosystem concept is clear enough: DeXe connects social trading activity with incentives, governance and token-based participation. A trader or strategy provider may be connected to compensation, while token holders can influence burn and reward parameters. However, the data does not show current platform volume, active traders, strategy performance, fees generated, treasury size or the amount of DEXE locked in staking.
That distinction matters. A token can have defined functions without the available data proving that those functions are currently being used at meaningful scale. Without updated adoption and treasury information, it is difficult to connect DEXE’s market valuation directly to operating metrics. At present, the strongest evidence in the research comes from price, volume and market structure rather than from confirmed changes in protocol usage.
𝗦𝘂𝗽𝗽𝗹𝘆, 𝗺𝗮𝗿𝗸𝗲𝘁 𝗰𝗮𝗽 𝗮𝗻𝗱 𝗱𝗶𝗹𝘂𝘁𝗶𝗼𝗻
The supplied token data lists total supply at approximately 96.50 million DEXE and circulating supply at approximately 35.26 million. A maximum supply is not listed. CoinGecko reports market capitalization near 66.45 million dollars, fully diluted valuation near 181.85 million dollars and a market-cap-to-FDV ratio of 0.37.
The difference between circulating supply and total supply means that only part of the stated total is currently represented in circulation, making future supply entering the market an important consideration. The data does not provide a verified unlock calendar, distribution breakdown, treasury allocation, investor allocation or vesting schedule. The absence of a listed maximum supply does not prove unlimited issuance, but it does limit what can be concluded about future dilution.
The supplied CoinGecko snapshot places DEXE at market-cap rank 369. Reported 24-hour trading volume is approximately 15.09 million dollars, while the Binance market snapshot shows DEXEUSDT quote volume of about 12.33 million dollars over its own measurement period. These figures are not identical because the sources can use different venues, timestamps and market coverage. Both nevertheless show substantial recent turnover compared with a token whose market capitalization is measured in the tens of millions.
𝗧𝗵𝗲 𝗰𝘂𝗿𝗿𝗲𝗻𝘁 𝗺𝗮𝗿𝗸𝗲𝘁 𝘀𝘁𝗿𝘂𝗰𝘁𝘂𝗿𝗲
The market snapshot shows DEXE rising about 5.20% over 24 hours, from an opening reference near 1.789 to a last recorded price of 1.882. The reported 24-hour range was approximately 1.763 to 1.938. CoinGecko’s corresponding snapshot showed a price near 1.89, a 24-hour gain of 5.14%, a seven-day decline of 4.55%, a 30-day decline of 2.44% and a one-year decline of 73.13%.
The mixed time frames are important. DEXE has been strong over the latest measured day but remains negative over the seven-day, 30-day and one-year periods. The four-hour candles show why. DEXE traded near 1.93 before a sharp breakdown reached a low around 1.602. That candle carried more than 3.20 million tokens of volume, higher than many surrounding four-hour periods.
Price later stabilized around the 1.75–1.80 region before recovering through 1.85 and 1.90, briefly approaching 1.94. This is a high-volatility recovery structure, but it has not established that the larger downtrend has reversed. Recent hourly candles also show heavier participation during the move through 1.90, with several recording more than 500,000 DEXE in volume.
The latest reported hourly candle was around 1.882 after a pullback from the 1.93–1.94 zone. That retreat shows that buyers have not yet secured firm control above the recent local high. It also leaves a nearby decision area where failed breakouts and rapid reversals remain possible.
𝗪𝗵𝘆 𝘁𝗵𝗲 𝘀𝗰𝗮𝗻𝗻𝗲𝗿 𝘀𝗲𝘁𝘂𝗽 𝗺𝗮𝘁𝘁𝗲𝗿𝘀
The RR Trader scanner selected DEXEUSDT as a LONG candidate with an 88.84 confidence score, a selection score of 167.58, a hot priority of 10.749 and a top-gainer category rank of 11. It reported a 15-minute move of approximately 2.18% and a volume ratio of 1.62. In practical terms, the scanner detected upward short-term momentum alongside volume running above its reference level.
The scanner’s entry band was 1.9201 to 1.9220, close to its stated support level of 1.9201. Its resistance level was 1.9586. The projected upside checkpoints were 1.9497, 1.9636 and 1.9774, while the stop-loss reference was 1.9076. The scanner calculated a risk-reward figure near 1.92.
Those figures are outputs from a market scanner, not evidence of future price behavior. The setup is notable because it combines a recovery from a deep four-hour decline with higher volume and a clearly defined nearby structure. It is also fragile for the same reason. DEXE remains close to recent resistance, and the latest market snapshot shows that price has already pulled back from the 1.93–1.94 region.
A high scanner score can identify a favorable short-term arrangement, but it cannot confirm that demand will continue after profit-taking or that the broader trend has changed.
𝗕𝗶𝘁𝗰𝗼𝗶𝗻 𝗮𝗻𝗱 𝘁𝗵𝗲 𝘄𝗶𝗱𝗲𝗿 𝗺𝗮𝗿𝗸𝗲𝘁
Bitcoin is not providing a strong tailwind in the supplied snapshot. BTC was recorded near 76,910.40 dollars, down 1.80% over the measured 24-hour period from an opening reference near 78,319.90. Its reported range was approximately 76,402.90 to 78,542.
DEXE’s gain therefore occurred while Bitcoin was losing ground. That may reflect token-specific buying or a rebound that is temporarily stronger than the wider market. It does not, by itself, establish a durable decoupling. Smaller digital assets can rise while Bitcoin is weak and then reverse if broader market pressure increases.
DEXE’s own longer-period performance reinforces that caution. The supplied data shows declines over seven days, 30 days, 60 days, 200 days and one year. The token’s latest recovery is therefore occurring inside a market history that remains substantially negative. A more constructive interpretation would require DEXE to hold reclaimed levels while Bitcoin stabilizes rather than simply posting one strong day against a falling BTC market.
𝗡𝗼 𝗳𝗿𝗲𝘀𝗵 𝘃𝗲𝗿𝗶𝗳𝗶𝗲𝗱 𝗻𝗲𝘄𝘀 𝗰𝗮𝘁𝗮𝗹𝘆𝘀𝘁
The supplied news field is empty. There is no verified announcement in the research covering a new DeXe product, partnership, exchange listing, governance vote, token burn, treasury action, integration or funding event. Any explanation linking the current price move to a specific announcement would therefore be unsupported.
The identifiable near-term driver is market structure itself. DEXE recovered from approximately 1.602, reclaimed the 1.80 and 1.90 areas and attracted heavier volume during the rebound. If the project later confirms a burn, governance decision, product release or measurable increase in social trading activity, that could add a fundamental narrative. No such catalyst is verified in the available material.
For now, price acceptance is the more reliable evidence in this dataset. A sustained move above the recent 1.938 high would improve the short-term chart, while a move through scanner resistance near 1.9586 would place the 1.9636 and 1.9774 areas in focus. Rejection near those levels would instead show that sellers remain active.
𝗞𝗲𝘆 𝗹𝗲𝘃𝗲𝗹𝘀 𝗮𝗻𝗱 𝗿𝗶𝘀𝗸𝘀
The scanner identifies immediate support at 1.9201, with an entry band between 1.9201 and 1.9220. Resistance is listed near 1.9586. The projected levels are 1.9497, 1.9636 and 1.9774, while 1.9076 is the stated invalidation or stop reference for that specific setup. These are short-term market-data markers rather than fixed boundaries.
The wider chart adds 1.938 as a recent high, 1.88–1.90 as a reaction zone, and approximately 1.80, 1.76 and 1.602 as notable areas from the recent decline. The principal technical risk is a failed recovery. DEXE has already moved from roughly 1.93 to 1.602 within a four-hour structure, showing that volatility can be substantial.
A move below 1.9076 would weaken the scanner thesis, while a deeper break below 1.88 could shift attention toward the 1.80–1.76 region. A return toward 1.602 would represent a much more serious deterioration of the rebound structure.
Fundamental risks are concentrated in incomplete information and dilution uncertainty. The research does not verify current adoption, active users, treasury holdings, staking participation, insurance reserves, unlock timing or the exact economic impact of token burns. The token is also reported at roughly 96% below its all-time high of 48.91 dollars, although the supplied historical records contain date inconsistencies and should not be treated as a complete price history.
𝗪𝗵𝗮𝘁 𝘁𝗼 𝘄𝗮𝘁𝗰𝗵 𝗻𝗲𝘅𝘁
The first technical test is whether DEXE can hold the 1.90–1.92 area after the latest pullback. Holding that zone while volume remains elevated would show that buyers are defending the scanner’s structure. The next tests are the 1.938 recent high and the 1.9586 resistance level. A move beyond them would improve the short-term chart, but the market would still need to hold those levels rather than produce only a brief intraday move.
The opposing signal would be a move below 1.9076 followed by weakening volume or a slide beneath 1.88. That would undermine the scanner’s long setup and bring 1.80 and 1.76 back into view. Bitcoin should be considered alongside these levels because DEXE’s rebound is occurring while BTC is lower over the measured period.
On the project side, the most useful future information would be verifiable data on DeXe usage, trading activity, staking, treasury decisions, token burns, governance participation and supply unlocks. Those details would help distinguish an improvement in network utility from a purely technical rebound. Until such information is available, price and volume remain the clearest evidence in the supplied research.
𝗕𝗮𝗹𝗮𝗻𝗰𝗲𝗱 𝗰𝗼𝗻𝗰𝗹𝘂𝘀𝗶𝗼𝗻
DEXEUSDT stands out because the scanner has identified a high-confidence short-term long structure while the token is showing relative strength against a weaker Bitcoin market. The recovery from 1.602, the return toward 1.90 and the increase in volume all show that buyers have been active. The scanner levels around 1.9201 support, 1.9586 resistance and 1.9076 invalidation provide a defined framework for evaluating the move.
The evidence does not yet confirm a lasting trend reversal. DEXE remains down over the longer periods reported by CoinGecko, the four-hour chart still reflects a major breakdown, and the latest market snapshot shows a pullback from 1.938. Current adoption, treasury activity and supply details are incomplete, while no fresh verified news catalyst is present.
The balanced reading is that DEXE has produced a strong recovery attempt, not a confirmed fundamental comeback. Holding nearby support, reclaiming recent highs, maintaining meaningful volume and trading through a more stable Bitcoin backdrop would strengthen the bullish interpretation. Losing the scanner’s invalidation area would weaken it quickly. For now, DEXE deserves attention because of its momentum and structure, while confirmation must come from sustained price acceptance and clearer evidence of active DeXe utility.
Guys, don’t miss what $ETHFI is doing here! The interesting part of this $ETHFI setup is the structure. Price is sitting near the decision area while the 15m candles are leaning sellers. Volume is supporting the move, so the next candle matters. I’m watching 0.65733 and 0.65262. Would you take the first confirmation or wait for a retest? Entry: 0.66673 - 0.6674 TP1: 0.65733 | TP2: 0.65262 | TP3: 0.64792 SL: 0.67206
Guys, don’t miss what $ETHFI is doing here!

The interesting part of this $ETHFI setup is the structure. Price is sitting near the decision area while the 15m candles are leaning sellers. Volume is supporting the move, so the next candle matters. I’m watching 0.65733 and 0.65262. Would you take the first confirmation or wait for a retest?

Entry: 0.66673 - 0.6674
TP1: 0.65733 | TP2: 0.65262 | TP3: 0.64792
SL: 0.67206
Wait, wait — $VTHO is getting interesting! The interesting part of this $VTHO setup is the structure. Price is sitting near the decision area while the 15m candles are leaning buyers. Volume is still building, so the next candle matters. I’m watching 0.000490979 and 0.000487394. This is the level I would not ignore. Entry: 0.000498149 - 0.000498647 TP1: 0.000490979 | TP2: 0.000487394 | TP3: 0.000483809 SL: 0.000501883
Wait, wait — $VTHO is getting interesting!

The interesting part of this $VTHO setup is the structure. Price is sitting near the decision area while the 15m candles are leaning buyers. Volume is still building, so the next candle matters. I’m watching 0.000490979 and 0.000487394. This is the level I would not ignore.

Entry: 0.000498149 - 0.000498647
TP1: 0.000490979 | TP2: 0.000487394 | TP3: 0.000483809
SL: 0.000501883
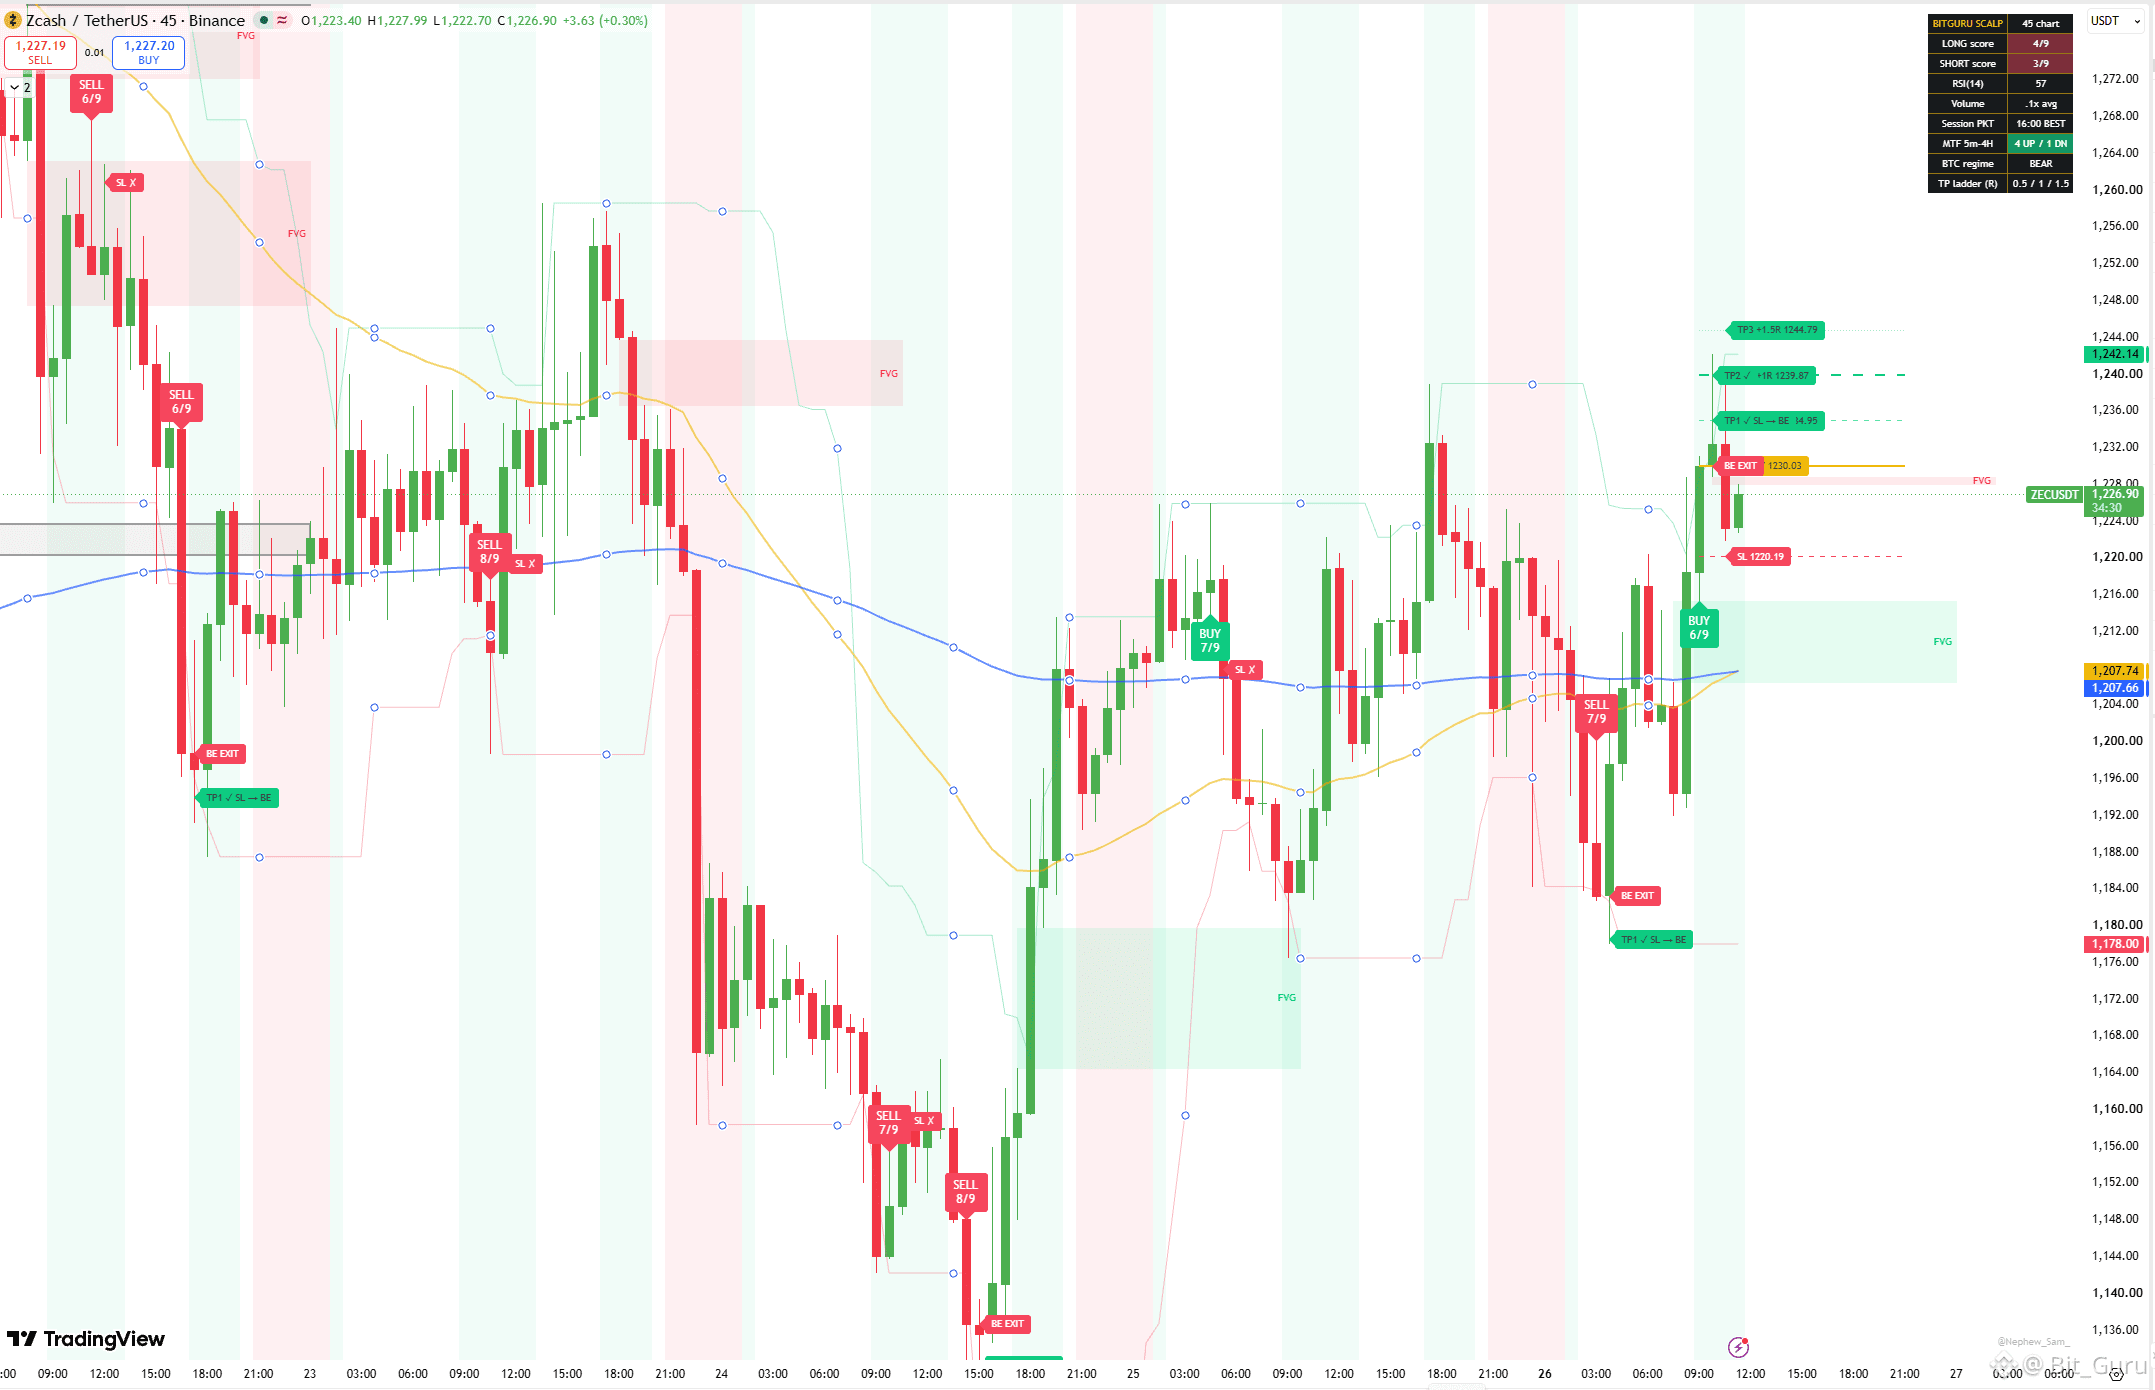
$ZEC Go back to 700$
My community, could this be the start of something bigger on $GRASS?... Here is what matters on $GRASS: buyers need to keep the recent structure intact. The 15m chart is giving the cleaner view right now, and activity is supportive. I’m watching 0.34531 first and 0.3465 next. I’m watching the next candle closely here. Entry: 0.34259 - 0.34293 TP1: 0.34531 | TP2: 0.3465 | TP3: 0.3477 SL: 0.3417
My community, could this be the start of something bigger on $GRASS ?...

Here is what matters on $GRASS : buyers need to keep the recent structure intact. The 15m chart is giving the cleaner view right now, and activity is supportive. I’m watching 0.34531 first and 0.3465 next. I’m watching the next candle closely here.

Entry: 0.34259 - 0.34293
TP1: 0.34531 | TP2: 0.3465 | TP3: 0.3477
SL: 0.3417
This $FOLKS move could become much bigger!... $FOLKS is holding under an important area and sellers are starting to show pressure. The structure is still developing, so I would rather watch confirmation than chase a candle. The 15m chart is the key here, with 2.1527 first and 2.1369 next if the weakness continues. The reaction at this level matters more than the headline. Entry: 2.1841 - 2.1863 TP1: 2.1527 | TP2: 2.1369 | TP3: 2.1212 SL: 2.2005
This $FOLKS move could become much bigger!...

$FOLKS is holding under an important area and sellers are starting to show pressure. The structure is still developing, so I would rather watch confirmation than chase a candle. The 15m chart is the key here, with 2.1527 first and 2.1369 next if the weakness continues. The reaction at this level matters more than the headline.

Entry: 2.1841 - 2.1863
TP1: 2.1527 | TP2: 2.1369 | TP3: 2.1212
SL: 2.2005
UK Lords Back Proposed Mandatory Digital Asset Strategy as Bitcoin Trades Lower𝗣𝗮𝗿𝗹𝗶𝗮𝗺𝗲𝗻𝘁𝗮𝗿𝘆 𝗱𝗲𝘃𝗲𝗹𝗼𝗽𝗺𝗲𝗻𝘁 The UK House of Lords has backed an amendment that would require the Treasury to develop a national digital asset strategy, according to reporting from Cointelegraph. The proposed strategy would cover cryptoassets, stablecoins, tokenized securities and digital financial infrastructure. The amendment represents a broader approach than a policy focused only on cryptocurrencies. It places several parts of the digital asset economy within one proposed framework and connects them to wider questions about financial markets, payments, capital formation and technology. The report describes the amendment as standing against the position associated with the Labour government. However, the available information does not establish that the amendment has become law, provide its final legal wording or set a timetable for implementation. House of Lords backing is therefore a significant political development, but it is not the same as a completed regulatory regime. That distinction is important when assessing what the announcement means for companies, financial institutions and digital asset markets. The proposal could lead to a more coordinated policy discussion, but its practical effects would depend on the remaining legislative process and the content of any strategy eventually produced by the Treasury. 𝗪𝗵𝗮𝘁 𝘁𝗵𝗲 𝗽𝗿𝗼𝗽𝗼𝘀𝗲𝗱 𝘀𝘁𝗿𝗮𝘁𝗲𝗴𝘆 𝘄𝗼𝘂𝗹𝗱 𝗰𝗼𝘃𝗲𝗿 The amendment’s scope is notable because it groups four related but distinct areas: cryptoassets, stablecoins, tokenized securities and digital financial infrastructure. Cryptoassets raise questions about market conduct, consumer protection and the activities of firms that issue, trade or provide services connected with digital assets. Stablecoins involve additional questions about their reserves, redemption arrangements, governance, technology and risk controls. Tokenized securities connect blockchain-based systems with established capital markets, while digital financial infrastructure includes the systems and operational arrangements that support financial activity. Considering these areas together could give policymakers a shared reference point for issues that might otherwise be handled separately. A national strategy could set out priorities, clarify responsibilities between government bodies and explain how the different parts of the sector relate to one another. The proposal does not, based on the supplied research, endorse every digital asset or business model. A strategy could encourage the development of certain forms of financial infrastructure while imposing strict conditions on assets, intermediaries or products considered risky. It could also distinguish between potential applications in financial markets and highly speculative tokens. The final details would therefore matter more than the headline. The amendment creates the possibility of a coordinated approach, but it does not determine what the UK’s eventual rules will permit, restrict or require. 𝗪𝗵𝘆 𝗽𝗼𝗹𝗶𝗰𝘆 𝗰𝗼𝗼𝗿𝗱𝗶𝗻𝗮𝘁𝗶𝗼𝗻 𝗺𝗮𝘁𝘁𝗲𝗿𝘀 A formal strategy could provide greater visibility into how the UK intends to approach digital assets over time. Companies and institutions generally need to understand how activities are defined, which permissions may be required and what standards will apply before making longer-term decisions. For cryptoassets, the relevant policy questions may include market conduct and consumer protection. For stablecoins, attention may focus on reserves, redemption and operational resilience. Tokenized securities require consideration of ownership, legal enforceability, disclosure and settlement. Digital financial infrastructure raises questions about custody, identity, settlement, technology and operational standards. These areas are connected, but they do not carry identical risks. A strategy that recognizes their differences while setting out a common direction could make the policy environment easier to understand. It could also identify where existing financial rules need clarification or where new measures may be required. Greater clarity would not necessarily mean lighter oversight. A national framework could create opportunities for firms that meet higher standards while increasing compliance requirements for businesses that do not. Depending on the eventual approach, companies could face more demanding expectations concerning transparency, reserves, custody, governance, reporting, cybersecurity and operational controls. The policy question is therefore not simply whether the UK supports digital assets. It is how the country would define responsible development, which activities it would support and how it would manage risks to users and the wider financial system. 𝗧𝗵𝗲 𝗯𝗿𝗼𝗮𝗱𝗲𝗿 𝗱𝗶𝗴𝗶𝘁𝗮𝗹 𝗮𝘀𝘀𝗲𝘁 𝗱𝗲𝗯𝗮𝘁𝗲 The amendment reflects a broader policy debate about how digital assets fit within existing financial systems. Governments are examining more than whether cryptocurrencies should be permitted. They are also considering the role of stable-value digital instruments in payments, the representation and settlement of securities on blockchain networks, and the way traditional financial institutions manage custody, technology and operational risks. The inclusion of tokenized securities suggests that the proposed strategy would extend beyond assets commonly associated with cryptocurrency markets. Tokenization can represent an asset or financial claim digitally, but the technology does not remove the need to address ownership, legal enforceability, settlement finality, disclosure or investor protection. A tokenized security would still depend on a legal and market framework that defines the rights attached to it and the obligations of the parties involved. Stablecoins present a different set of considerations. Their operation may depend on the quality of reserves, the terms governing redemption, the structure of their governance and the effectiveness of their technology and risk controls. A strategy covering stablecoins would therefore need to consider both potential financial uses and the consequences of operational failure or loss of confidence. Digital financial infrastructure brings another layer to the discussion. Questions about custody, identity, resilience, settlement and operational standards may affect how digital systems interact with established financial markets. The supplied research does not specify how the Treasury would address these issues, so the amendment should be viewed as the starting point for a policy process rather than an answer to those questions. 𝗕𝗶𝘁𝗰𝗼𝗶𝗻 𝗺𝗮𝗿𝗸𝗲𝘁 𝗰𝗼𝗻𝘁𝗲𝘅𝘁 The supplied BTCUSDT market snapshot shows Bitcoin trading at 76,838.68 USDT at the end of the measured period. That was 1,519.19 USDT below the previous close of 78,357.87, representing a daily decline of 1.939%. During the period, Bitcoin reached a high of 78,564.39 and a low of 76,464.00. The difference between those levels was 2,100.39 USDT. The weighted average price was 77,428.72, while reported volume was 15,038.45127 BTC. Quoted trading volume was approximately 1.164 billion USDT for the measured period. The hourly data shows that Bitcoin initially traded near 78,400 and briefly moved to the session high. It then weakened, with the decline becoming more pronounced as the price moved from the upper 77,000s toward the 76,000s. Bitcoin later recovered from the session low and traded back above 76,900, but it remained below the previous close at the end of the snapshot. These figures describe the market’s movement, but they do not establish why it occurred. The data does not identify which participants drove the decline or show that the UK parliamentary development caused it. The political announcement and the price movement occurred within the same measured period, but timing alone is not evidence of a causal relationship. 𝗣𝗼𝗹𝗶𝗰𝘆 𝘀𝗶𝗴𝗻𝗮𝗹 𝗼𝗿 𝗽𝗿𝗶𝗰𝗲 𝗰𝗮𝘁𝗮𝗹𝘆𝘀𝘁? The most cautious interpretation is that the amendment is a potentially meaningful policy signal rather than an immediate price catalyst. If the proposal progresses and leads to a detailed strategy, it could provide greater visibility for businesses working with cryptoassets, stablecoins, tokenized securities and digital financial infrastructure. The direct connection to Bitcoin is less certain. The supplied research does not indicate that the amendment creates a Bitcoin product, changes Bitcoin’s supply, authorizes a specific trading venue or establishes a direct channel for capital to flow into BTC. It also does not show that the future UK strategy will be permissive toward every part of the digital asset economy. A coordinated policy approach could reduce uncertainty for legitimate firms and help them plan around clearer requirements. At the same time, the eventual strategy could recommend tighter oversight, higher compliance costs or restrictions on activities viewed as risky. Both outcomes are consistent with the limited information currently available. Bitcoin’s decline reinforces the need to separate policy significance from short-term price direction. The asset fell 1.939% during the reported period even as the UK story drew attention. That does not show that traders interpreted the amendment as negative, nor does it show that the announcement was irrelevant. Short-term prices can move for many reasons, and the supplied data does not identify the specific cause of this session’s decline. 𝗨𝗻𝗰𝗲𝗿𝘁𝗮𝗶𝗻𝘁𝗶𝗲𝘀 𝗮𝗻𝗱 𝗽𝗼𝘁𝗲𝗻𝘁𝗶𝗮𝗹 𝘁𝗿𝗮𝗱𝗲-𝗼𝗳𝗳𝘀 The first uncertainty is procedural. The report confirms House of Lords backing for an amendment, but it does not confirm final enactment, the final text or an implementation timetable. Until those details are known, the amendment remains part of an ongoing parliamentary and governmental process. The second uncertainty concerns scope. A single strategy covering cryptoassets, stablecoins, tokenized securities and digital financial infrastructure could offer a unified framework, but these areas involve different technologies, commercial models and risks. Policymakers may need to balance innovation, consumer protection, financial stability and market integrity. Execution is another important question. A strategy may establish broad priorities without immediately changing licensing rules, tax treatment, supervisory practices or market access. Its practical value would depend on whether those priorities are later translated into clear and enforceable measures. The potential effects on businesses could also be mixed. Greater clarity may help firms understand their obligations and plan for the future. However, stronger expectations around governance, reporting, reserves, custody, cybersecurity and operational resilience could increase costs. The same policy process may create opportunities for some businesses while imposing additional burdens on others. There is also a risk that political backing will be interpreted as proof of imminent institutional adoption or a guaranteed improvement in asset prices. The supplied information does not support either conclusion. Regulatory progress can take time, and a favorable policy signal does not remove Bitcoin’s volatility or exposure to wider market conditions. 𝗪𝗵𝗮𝘁 𝘁𝗼 𝘄𝗮𝘁𝗰𝗵 The next important question is whether the amendment advances through the remaining parliamentary stages and whether the final text retains the requirement for a Treasury-led digital asset strategy. The distinction between political support and enacted law should remain central to future coverage. The substance of any eventual strategy will be equally important. Relevant details would include its policy objectives, the government bodies responsible for implementation, proposed timelines, consultation plans and the way it connects cryptoassets, stablecoins, tokenized securities and digital financial infrastructure. Market observers may also examine how the UK approaches stablecoin supervision, tokenized financial instruments, custody and trading activity. The supplied research does not establish what the final policy will contain, so these remain open questions rather than confirmed outcomes. For Bitcoin, the key levels in the supplied snapshot are the previous close at 78,357.87, the session high at 78,564.39 and the session low at 76,464.00. Movement around those levels would describe short-term trading behavior, but it would not by itself explain the reason for a move. Volume, liquidity and the persistence of any change would provide additional context. 𝗔 𝘀𝗶𝗴𝗻𝗮𝗹 𝘄𝗶𝘁𝗵𝗼𝘂𝘁 𝗮 𝗳𝗶𝗻𝗮𝗹 𝗿𝗲𝗴𝗶𝗺𝗲 The House of Lords’ backing for a mandatory UK digital asset strategy is significant because it broadens the policy discussion beyond individual cryptocurrencies. By including cryptoassets, stablecoins, tokenized securities and digital financial infrastructure, the amendment points toward a coordinated examination of how digital technology could interact with the financial system. The confirmed information does not, however, establish a completed regulatory regime. It does not show that the amendment has become law, reveal the final legal text or specify when a Treasury strategy would be published. It is therefore too early to treat the development as a guaranteed turning point for businesses or asset prices. Bitcoin’s market performance offers a separate data point. The asset traded between 76,464.00 and 78,564.39, ended the supplied snapshot at 76,838.68 and declined 1.939% from the previous close. The data confirms the movement but not its cause. The most balanced conclusion is that the amendment could lead to a clearer UK policy discussion while also preparing the ground for stronger oversight. Its long-term importance will depend on the amendment’s final path, the Treasury’s eventual strategy and the rules that follow. Until those details are available, the development is best understood as an influential policy signal rather than a finished policy or a definitive market catalyst.

UK Lords Back Proposed Mandatory Digital Asset Strategy as Bitcoin Trades Lower

𝗣𝗮𝗿𝗹𝗶𝗮𝗺𝗲𝗻𝘁𝗮𝗿𝘆 𝗱𝗲𝘃𝗲𝗹𝗼𝗽𝗺𝗲𝗻𝘁
The UK House of Lords has backed an amendment that would require the Treasury to develop a national digital asset strategy, according to reporting from Cointelegraph. The proposed strategy would cover cryptoassets, stablecoins, tokenized securities and digital financial infrastructure.
The amendment represents a broader approach than a policy focused only on cryptocurrencies. It places several parts of the digital asset economy within one proposed framework and connects them to wider questions about financial markets, payments, capital formation and technology.
The report describes the amendment as standing against the position associated with the Labour government. However, the available information does not establish that the amendment has become law, provide its final legal wording or set a timetable for implementation. House of Lords backing is therefore a significant political development, but it is not the same as a completed regulatory regime.
That distinction is important when assessing what the announcement means for companies, financial institutions and digital asset markets. The proposal could lead to a more coordinated policy discussion, but its practical effects would depend on the remaining legislative process and the content of any strategy eventually produced by the Treasury.
𝗪𝗵𝗮𝘁 𝘁𝗵𝗲 𝗽𝗿𝗼𝗽𝗼𝘀𝗲𝗱 𝘀𝘁𝗿𝗮𝘁𝗲𝗴𝘆 𝘄𝗼𝘂𝗹𝗱 𝗰𝗼𝘃𝗲𝗿
The amendment’s scope is notable because it groups four related but distinct areas: cryptoassets, stablecoins, tokenized securities and digital financial infrastructure.
Cryptoassets raise questions about market conduct, consumer protection and the activities of firms that issue, trade or provide services connected with digital assets. Stablecoins involve additional questions about their reserves, redemption arrangements, governance, technology and risk controls. Tokenized securities connect blockchain-based systems with established capital markets, while digital financial infrastructure includes the systems and operational arrangements that support financial activity.
Considering these areas together could give policymakers a shared reference point for issues that might otherwise be handled separately. A national strategy could set out priorities, clarify responsibilities between government bodies and explain how the different parts of the sector relate to one another.
The proposal does not, based on the supplied research, endorse every digital asset or business model. A strategy could encourage the development of certain forms of financial infrastructure while imposing strict conditions on assets, intermediaries or products considered risky. It could also distinguish between potential applications in financial markets and highly speculative tokens.
The final details would therefore matter more than the headline. The amendment creates the possibility of a coordinated approach, but it does not determine what the UK’s eventual rules will permit, restrict or require.
𝗪𝗵𝘆 𝗽𝗼𝗹𝗶𝗰𝘆 𝗰𝗼𝗼𝗿𝗱𝗶𝗻𝗮𝘁𝗶𝗼𝗻 𝗺𝗮𝘁𝘁𝗲𝗿𝘀
A formal strategy could provide greater visibility into how the UK intends to approach digital assets over time. Companies and institutions generally need to understand how activities are defined, which permissions may be required and what standards will apply before making longer-term decisions.
For cryptoassets, the relevant policy questions may include market conduct and consumer protection. For stablecoins, attention may focus on reserves, redemption and operational resilience. Tokenized securities require consideration of ownership, legal enforceability, disclosure and settlement. Digital financial infrastructure raises questions about custody, identity, settlement, technology and operational standards.
These areas are connected, but they do not carry identical risks. A strategy that recognizes their differences while setting out a common direction could make the policy environment easier to understand. It could also identify where existing financial rules need clarification or where new measures may be required.
Greater clarity would not necessarily mean lighter oversight. A national framework could create opportunities for firms that meet higher standards while increasing compliance requirements for businesses that do not. Depending on the eventual approach, companies could face more demanding expectations concerning transparency, reserves, custody, governance, reporting, cybersecurity and operational controls.
The policy question is therefore not simply whether the UK supports digital assets. It is how the country would define responsible development, which activities it would support and how it would manage risks to users and the wider financial system.
𝗧𝗵𝗲 𝗯𝗿𝗼𝗮𝗱𝗲𝗿 𝗱𝗶𝗴𝗶𝘁𝗮𝗹 𝗮𝘀𝘀𝗲𝘁 𝗱𝗲𝗯𝗮𝘁𝗲
The amendment reflects a broader policy debate about how digital assets fit within existing financial systems. Governments are examining more than whether cryptocurrencies should be permitted. They are also considering the role of stable-value digital instruments in payments, the representation and settlement of securities on blockchain networks, and the way traditional financial institutions manage custody, technology and operational risks.
The inclusion of tokenized securities suggests that the proposed strategy would extend beyond assets commonly associated with cryptocurrency markets. Tokenization can represent an asset or financial claim digitally, but the technology does not remove the need to address ownership, legal enforceability, settlement finality, disclosure or investor protection. A tokenized security would still depend on a legal and market framework that defines the rights attached to it and the obligations of the parties involved.
Stablecoins present a different set of considerations. Their operation may depend on the quality of reserves, the terms governing redemption, the structure of their governance and the effectiveness of their technology and risk controls. A strategy covering stablecoins would therefore need to consider both potential financial uses and the consequences of operational failure or loss of confidence.
Digital financial infrastructure brings another layer to the discussion. Questions about custody, identity, resilience, settlement and operational standards may affect how digital systems interact with established financial markets. The supplied research does not specify how the Treasury would address these issues, so the amendment should be viewed as the starting point for a policy process rather than an answer to those questions.
𝗕𝗶𝘁𝗰𝗼𝗶𝗻 𝗺𝗮𝗿𝗸𝗲𝘁 𝗰𝗼𝗻𝘁𝗲𝘅𝘁
The supplied BTCUSDT market snapshot shows Bitcoin trading at 76,838.68 USDT at the end of the measured period. That was 1,519.19 USDT below the previous close of 78,357.87, representing a daily decline of 1.939%.
During the period, Bitcoin reached a high of 78,564.39 and a low of 76,464.00. The difference between those levels was 2,100.39 USDT. The weighted average price was 77,428.72, while reported volume was 15,038.45127 BTC. Quoted trading volume was approximately 1.164 billion USDT for the measured period.
The hourly data shows that Bitcoin initially traded near 78,400 and briefly moved to the session high. It then weakened, with the decline becoming more pronounced as the price moved from the upper 77,000s toward the 76,000s. Bitcoin later recovered from the session low and traded back above 76,900, but it remained below the previous close at the end of the snapshot.
These figures describe the market’s movement, but they do not establish why it occurred. The data does not identify which participants drove the decline or show that the UK parliamentary development caused it. The political announcement and the price movement occurred within the same measured period, but timing alone is not evidence of a causal relationship.
𝗣𝗼𝗹𝗶𝗰𝘆 𝘀𝗶𝗴𝗻𝗮𝗹 𝗼𝗿 𝗽𝗿𝗶𝗰𝗲 𝗰𝗮𝘁𝗮𝗹𝘆𝘀𝘁?
The most cautious interpretation is that the amendment is a potentially meaningful policy signal rather than an immediate price catalyst. If the proposal progresses and leads to a detailed strategy, it could provide greater visibility for businesses working with cryptoassets, stablecoins, tokenized securities and digital financial infrastructure.
The direct connection to Bitcoin is less certain. The supplied research does not indicate that the amendment creates a Bitcoin product, changes Bitcoin’s supply, authorizes a specific trading venue or establishes a direct channel for capital to flow into BTC. It also does not show that the future UK strategy will be permissive toward every part of the digital asset economy.
A coordinated policy approach could reduce uncertainty for legitimate firms and help them plan around clearer requirements. At the same time, the eventual strategy could recommend tighter oversight, higher compliance costs or restrictions on activities viewed as risky. Both outcomes are consistent with the limited information currently available.
Bitcoin’s decline reinforces the need to separate policy significance from short-term price direction. The asset fell 1.939% during the reported period even as the UK story drew attention. That does not show that traders interpreted the amendment as negative, nor does it show that the announcement was irrelevant. Short-term prices can move for many reasons, and the supplied data does not identify the specific cause of this session’s decline.
𝗨𝗻𝗰𝗲𝗿𝘁𝗮𝗶𝗻𝘁𝗶𝗲𝘀 𝗮𝗻𝗱 𝗽𝗼𝘁𝗲𝗻𝘁𝗶𝗮𝗹 𝘁𝗿𝗮𝗱𝗲-𝗼𝗳𝗳𝘀
The first uncertainty is procedural. The report confirms House of Lords backing for an amendment, but it does not confirm final enactment, the final text or an implementation timetable. Until those details are known, the amendment remains part of an ongoing parliamentary and governmental process.
The second uncertainty concerns scope. A single strategy covering cryptoassets, stablecoins, tokenized securities and digital financial infrastructure could offer a unified framework, but these areas involve different technologies, commercial models and risks. Policymakers may need to balance innovation, consumer protection, financial stability and market integrity.
Execution is another important question. A strategy may establish broad priorities without immediately changing licensing rules, tax treatment, supervisory practices or market access. Its practical value would depend on whether those priorities are later translated into clear and enforceable measures.
The potential effects on businesses could also be mixed. Greater clarity may help firms understand their obligations and plan for the future. However, stronger expectations around governance, reporting, reserves, custody, cybersecurity and operational resilience could increase costs. The same policy process may create opportunities for some businesses while imposing additional burdens on others.
There is also a risk that political backing will be interpreted as proof of imminent institutional adoption or a guaranteed improvement in asset prices. The supplied information does not support either conclusion. Regulatory progress can take time, and a favorable policy signal does not remove Bitcoin’s volatility or exposure to wider market conditions.
𝗪𝗵𝗮𝘁 𝘁𝗼 𝘄𝗮𝘁𝗰𝗵
The next important question is whether the amendment advances through the remaining parliamentary stages and whether the final text retains the requirement for a Treasury-led digital asset strategy. The distinction between political support and enacted law should remain central to future coverage.
The substance of any eventual strategy will be equally important. Relevant details would include its policy objectives, the government bodies responsible for implementation, proposed timelines, consultation plans and the way it connects cryptoassets, stablecoins, tokenized securities and digital financial infrastructure.
Market observers may also examine how the UK approaches stablecoin supervision, tokenized financial instruments, custody and trading activity. The supplied research does not establish what the final policy will contain, so these remain open questions rather than confirmed outcomes.
For Bitcoin, the key levels in the supplied snapshot are the previous close at 78,357.87, the session high at 78,564.39 and the session low at 76,464.00. Movement around those levels would describe short-term trading behavior, but it would not by itself explain the reason for a move. Volume, liquidity and the persistence of any change would provide additional context.
𝗔 𝘀𝗶𝗴𝗻𝗮𝗹 𝘄𝗶𝘁𝗵𝗼𝘂𝘁 𝗮 𝗳𝗶𝗻𝗮𝗹 𝗿𝗲𝗴𝗶𝗺𝗲
The House of Lords’ backing for a mandatory UK digital asset strategy is significant because it broadens the policy discussion beyond individual cryptocurrencies. By including cryptoassets, stablecoins, tokenized securities and digital financial infrastructure, the amendment points toward a coordinated examination of how digital technology could interact with the financial system.
The confirmed information does not, however, establish a completed regulatory regime. It does not show that the amendment has become law, reveal the final legal text or specify when a Treasury strategy would be published. It is therefore too early to treat the development as a guaranteed turning point for businesses or asset prices.
Bitcoin’s market performance offers a separate data point. The asset traded between 76,464.00 and 78,564.39, ended the supplied snapshot at 76,838.68 and declined 1.939% from the previous close. The data confirms the movement but not its cause.
The most balanced conclusion is that the amendment could lead to a clearer UK policy discussion while also preparing the ground for stronger oversight. Its long-term importance will depend on the amendment’s final path, the Treasury’s eventual strategy and the rules that follow. Until those details are available, the development is best understood as an influential policy signal rather than a finished policy or a definitive market catalyst.
My community, this $BTW setup could get interesting fast!... $BTW has moved onto my radar because the current structure is becoming easier to read. The 15m candles are showing buyers, while activity is accelerating. The next reaction around the decision area should tell us a lot. I’m watching the next candle closely here. Entry: 0.49853 - 0.49903 TP1: 0.50622 | TP2: 0.50981 | TP3: 0.51341 SL: 0.49529
My community, this $BTW setup could get interesting fast!...

$BTW has moved onto my radar because the current structure is becoming easier to read. The 15m candles are showing buyers, while activity is accelerating. The next reaction around the decision area should tell us a lot. I’m watching the next candle closely here.

Entry: 0.49853 - 0.49903
TP1: 0.50622 | TP2: 0.50981 | TP3: 0.51341
SL: 0.49529
My community, $BLUR is moving into a very interesting area!... $BLUR is holding an important area and buyers are starting to show interest. The structure is still developing, so I would rather watch confirmation than chase a candle. The 15m chart is the key here, with 0.017601 first and 0.017726 next if the move stays strong. Would you take the first confirmation or wait for a retest? Entry: 0.017334 - 0.017351 TP1: 0.017601 | TP2: 0.017726 | TP3: 0.017851 SL: 0.017221
My community, $BLUR is moving into a very interesting area!...

$BLUR is holding an important area and buyers are starting to show interest. The structure is still developing, so I would rather watch confirmation than chase a candle. The 15m chart is the key here, with 0.017601 first and 0.017726 next if the move stays strong. Would you take the first confirmation or wait for a retest?

Entry: 0.017334 - 0.017351
TP1: 0.017601 | TP2: 0.017726 | TP3: 0.017851
SL: 0.017221
Look what is happening on $DEXE right now!... $DEXE is approaching a decision point on the 15m chart. The current structure sits between 1.9072 and 1.961. A clean reaction from this area can open the next move, while a failed reaction would weaken the setup. For now, this level is the one to watch. I’m watching the next candle closely here. Entry: 1.9131 - 1.915 TP1: 1.9426 | TP2: 1.9564 | TP3: 1.9702 SL: 1.9007
Look what is happening on $DEXE right now!...

$DEXE is approaching a decision point on the 15m chart. The current structure sits between 1.9072 and 1.961. A clean reaction from this area can open the next move, while a failed reaction would weaken the setup. For now, this level is the one to watch. I’m watching the next candle closely here.

Entry: 1.9131 - 1.915
TP1: 1.9426 | TP2: 1.9564 | TP3: 1.9702
SL: 1.9007
My community, look at this $PROVE setup!... The interesting part of this $PROVE setup is the structure. Price is sitting near the decision area while the 1h candles are leaning buyers. Volume is still building, so the next candle matters. I’m watching 0.18687 and 0.1855 as the next areas. Would you take the first confirmation or wait for a retest? Entry: 0.18959 - 0.18978 TP1: 0.18687 | TP2: 0.1855 | TP3: 0.18414 SL: 0.19117
My community, look at this $PROVE setup!...

The interesting part of this $PROVE setup is the structure. Price is sitting near the decision area while the 1h candles are leaning buyers. Volume is still building, so the next candle matters. I’m watching 0.18687 and 0.1855 as the next areas. Would you take the first confirmation or wait for a retest?

Entry: 0.18959 - 0.18978
TP1: 0.18687 | TP2: 0.1855 | TP3: 0.18414
SL: 0.19117
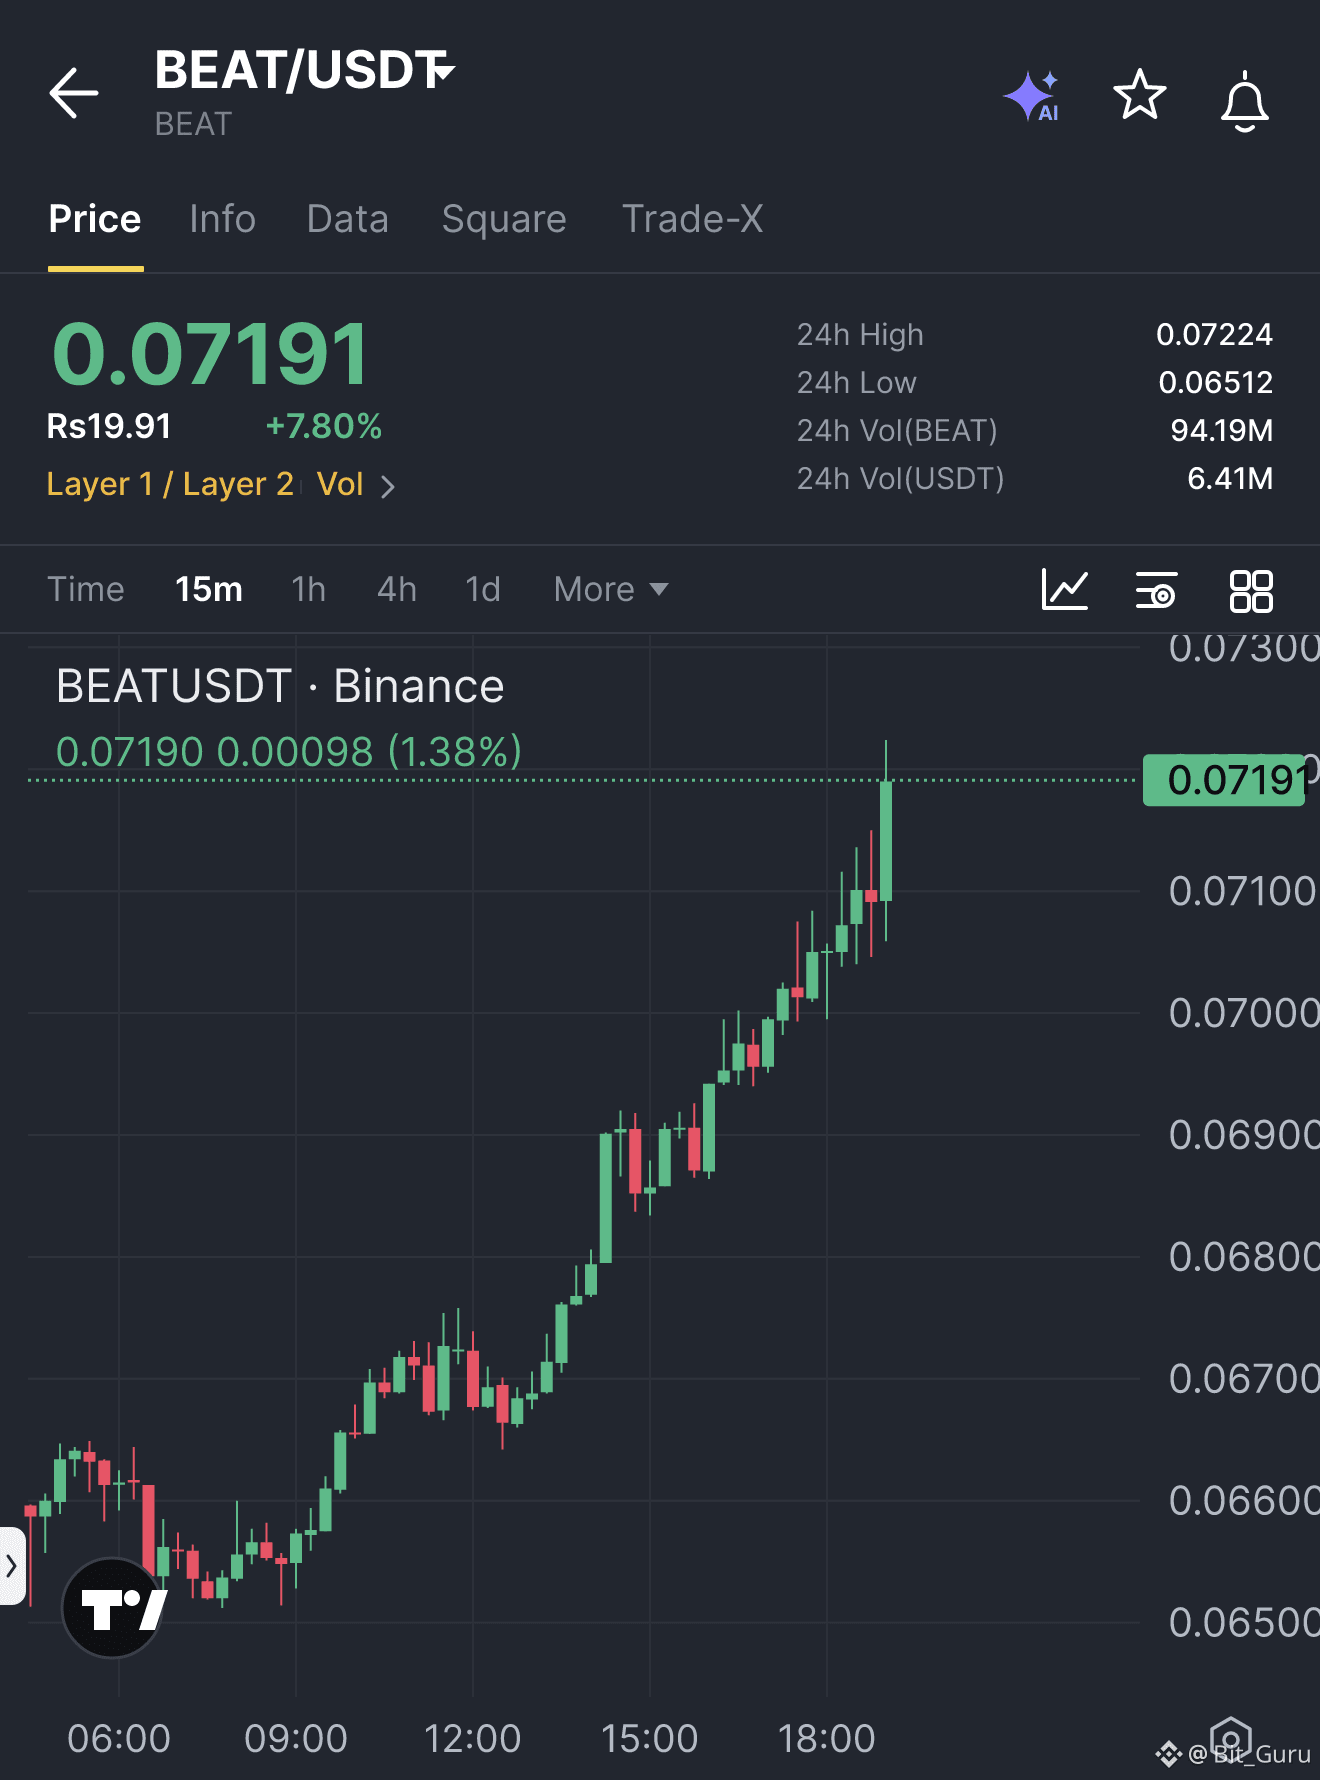
Guys, keep $BEAT on your radar!... Here is what matters on $BEAT: sellers need to keep the recent structure intact. The 15m chart is giving the cleaner view right now, and activity is not explosive yet. I’m watching 0.07622 first and 0.075711 next. Would you wait for confirmation or the retest? Entry: 0.077239 - 0.077316 TP1: 0.07622 | TP2: 0.075711 | TP3: 0.075202 SL: 0.077766
Guys, keep $BEAT on your radar!...

Here is what matters on $BEAT : sellers need to keep the recent structure intact. The 15m chart is giving the cleaner view right now, and activity is not explosive yet. I’m watching 0.07622 first and 0.075711 next. Would you wait for confirmation or the retest?

Entry: 0.077239 - 0.077316
TP1: 0.07622 | TP2: 0.075711 | TP3: 0.075202
SL: 0.077766
Guys, $1000RATS just gave us a reason to pay attention!... $1000RATS is approaching a decision point on the 15m chart. The current structure sits between 0.0399 and 0.04039. A clean reaction from this area can open the next move, while a failed reaction would weaken the setup. For now, this level is the one to watch. The reaction at this level matters more than the headline. Entry: 0.03999 - 0.04003 TP1: 0.040607 | TP2: 0.040895 | TP3: 0.041183 SL: 0.03973
Guys, $1000RATS just gave us a reason to pay attention!...

$1000RATS is approaching a decision point on the 15m chart. The current structure sits between 0.0399 and 0.04039. A clean reaction from this area can open the next move, while a failed reaction would weaken the setup. For now, this level is the one to watch. The reaction at this level matters more than the headline.

Entry: 0.03999 - 0.04003
TP1: 0.040607 | TP2: 0.040895 | TP3: 0.041183
SL: 0.03973
Wait, wait, wait — $IOST could be waking up!... Here is what matters on $IOST: sellers need to keep the recent structure intact. The 15m chart is giving the cleaner view right now, and activity is not explosive yet. I’m watching 0.000969336 first and 0.000962259 next. The reaction at this level matters more than the headline. Entry: 0.000983491 - 0.000984474 TP1: 0.000969336 | TP2: 0.000962259 | TP3: 0.000955181 SL: 0.000990864
Wait, wait, wait — $IOST could be waking up!...

Here is what matters on $IOST : sellers need to keep the recent structure intact. The 15m chart is giving the cleaner view right now, and activity is not explosive yet. I’m watching 0.000969336 first and 0.000962259 next. The reaction at this level matters more than the headline.

Entry: 0.000983491 - 0.000984474
TP1: 0.000969336 | TP2: 0.000962259 | TP3: 0.000955181
SL: 0.000990864
Guys, this $VVV structure is worth watching!... $VVV has moved onto my radar because the current structure is becoming easier to read. The 15m candles are showing buyers, while activity is accelerating. The next reaction around the decision area should tell us a lot. I’m watching the next candle closely here. Entry: 24.4742 - 24.4987 TP1: 24.7466 | TP2: 24.8705 | TP3: 24.9945 SL: 24.3733
Guys, this $VVV structure is worth watching!...

$VVV has moved onto my radar because the current structure is becoming easier to read. The 15m candles are showing buyers, while activity is accelerating. The next reaction around the decision area should tell us a lot. I’m watching the next candle closely here.

Entry: 24.4742 - 24.4987
TP1: 24.7466 | TP2: 24.8705 | TP3: 24.9945
SL: 24.3733
Log in to explore more content
Join global crypto users on Binance Square
⚡️ Get latest and useful information about crypto.
💬 Trusted by the world’s largest crypto exchange.
👍 Discover real insights from verified creators.
Email / Phone number
Sitemap
Cookie Preferences
Platform T&Cs