

Triple Effect
23.5k Posts

Triple Effect
Report
Block User
🤩
9 Following
11.3K+ Followers
8.2K+ Liked
Posts
All
Quotes
Videos
Live
PINNED

Article
You entered the crypto market to build a fortune, only to find your portfolio vanishing in days?The reason isn't bad luck, but rather that you're likely falling into the trap that 90% of beginners fall into: confusing investment with day trading.
1️⃣ The Long-Term Investor
(The Patient One 🧘♂️):
An investor doesn't monitor screens every minute.
They study a project, see its true value and future potential (like strong blockchain projects), then invest and rest for years.
The goal: to reap substantial profits based on the project's real growth.
Their impact on crypto:
They are the true fuel of the market.
Investors are the ones who provide projects with long-term stability and liquidity, and support genuine innovation.
InvestorSlogan: "I'm buying a piece of the future."
2️⃣ The Day Trader/Speculator
(The Quick Opportunity Hunter ⚡):
A day trader isn't as concerned with the cryptocurrency project itself as they are with its immediate price movement.
They enter and exit trades on the same day, exploiting instantaneous price fluctuations.
The goal:
To capture quick, small profits that accumulate over time.
The dark side:
This path is fraught with significant risks.
Without a rigorous strategy and risk management, trading quickly transforms from smart investing into a reckless gamble that devours your capital in the blink of an eye.
Trader's_Motto: "I'm riding the wave, and I don't care where the ship lands."
💡 Why is this distinction the secret to survival in the crypto market?
The cryptocurrency market is characterized by insane volatility unlike any other market.
If you enter with an investor mindset and start day trading, you'll panic and sell at a loss at the first dip.
And if you enter with a trader mindset and get stuck on a losing trade hoping it will rise after years, your capital may be frozen in a dead project.
Success begins with defining your identity before opening any trade.
💬 Now, share your thoughts in the comments:
Now that you know the difference, do you see yourself as an investor building wealth calmly, or a trader who loves the thrill of rapid movement?
👇 (If you found this content helpful, don't forget to follow 🔔 and share so everyone can benefit.
In the next post, I'll reveal the top 3 tools I personally use to identify cryptocurrencies suitable for long-term investment.)
Join my chatroom for more updates..
@Bastoman
[Click & Win 🛩️](https://www.binance.com/activity/pick-and-win/2026-football-challenge?ref=806584556&utm_medium=app_share_link_telegram)
#Binance
#Write2Earn
$BTC
{spot}(BTCUSDT)
You entered the crypto market to build a fortune, only to find your portfolio vanishing in days?
The reason isn't bad luck, but rather that you're likely falling into the trap that 90% of beginners fall into: confusing investment with day trading.
1️⃣ The Long-Term Investor
(The Patient One 🧘♂️):
An investor doesn't monitor screens every minute.
They study a project, see its true value and future potential (like strong blockchain projects), then invest and rest for years.
The goal: to reap substantial profits based on the project's real growth.
Their impact on crypto:
They are the true fuel of the market.
Investors are the ones who provide projects with long-term stability and liquidity, and support genuine innovation.
InvestorSlogan: "I'm buying a piece of the future."
2️⃣ The Day Trader/Speculator
(The Quick Opportunity Hunter ⚡):
A day trader isn't as concerned with the cryptocurrency project itself as they are with its immediate price movement.
They enter and exit trades on the same day, exploiting instantaneous price fluctuations.
The goal:
To capture quick, small profits that accumulate over time.
The dark side:
This path is fraught with significant risks.
Without a rigorous strategy and risk management, trading quickly transforms from smart investing into a reckless gamble that devours your capital in the blink of an eye.
Trader's_Motto: "I'm riding the wave, and I don't care where the ship lands."
💡 Why is this distinction the secret to survival in the crypto market?
The cryptocurrency market is characterized by insane volatility unlike any other market.
If you enter with an investor mindset and start day trading, you'll panic and sell at a loss at the first dip.
And if you enter with a trader mindset and get stuck on a losing trade hoping it will rise after years, your capital may be frozen in a dead project.
Success begins with defining your identity before opening any trade.
💬 Now, share your thoughts in the comments:
Now that you know the difference, do you see yourself as an investor building wealth calmly, or a trader who loves the thrill of rapid movement?
👇 (If you found this content helpful, don't forget to follow 🔔 and share so everyone can benefit.
In the next post, I'll reveal the top 3 tools I personally use to identify cryptocurrencies suitable for long-term investment.)
Join my chatroom for more updates..
@Triple Effect
Click & Win 🛩️
#Binance
#Write2Earn
$BTC
1️⃣ The Long-Term Investor
(The Patient One 🧘♂️):
An investor doesn't monitor screens every minute.
They study a project, see its true value and future potential (like strong blockchain projects), then invest and rest for years.
The goal: to reap substantial profits based on the project's real growth.
Their impact on crypto:
They are the true fuel of the market.
Investors are the ones who provide projects with long-term stability and liquidity, and support genuine innovation.
InvestorSlogan: "I'm buying a piece of the future."
2️⃣ The Day Trader/Speculator
(The Quick Opportunity Hunter ⚡):
A day trader isn't as concerned with the cryptocurrency project itself as they are with its immediate price movement.
They enter and exit trades on the same day, exploiting instantaneous price fluctuations.
The goal:
To capture quick, small profits that accumulate over time.
The dark side:
This path is fraught with significant risks.
Without a rigorous strategy and risk management, trading quickly transforms from smart investing into a reckless gamble that devours your capital in the blink of an eye.
Trader's_Motto: "I'm riding the wave, and I don't care where the ship lands."
💡 Why is this distinction the secret to survival in the crypto market?
The cryptocurrency market is characterized by insane volatility unlike any other market.
If you enter with an investor mindset and start day trading, you'll panic and sell at a loss at the first dip.
And if you enter with a trader mindset and get stuck on a losing trade hoping it will rise after years, your capital may be frozen in a dead project.
Success begins with defining your identity before opening any trade.
💬 Now, share your thoughts in the comments:
Now that you know the difference, do you see yourself as an investor building wealth calmly, or a trader who loves the thrill of rapid movement?
👇 (If you found this content helpful, don't forget to follow 🔔 and share so everyone can benefit.
In the next post, I'll reveal the top 3 tools I personally use to identify cryptocurrencies suitable for long-term investment.)
Join my chatroom for more updates..
@Triple Effect
Click & Win 🛩️
#Binance
#Write2Earn
$BTC
3.7k
7
200
3.7k
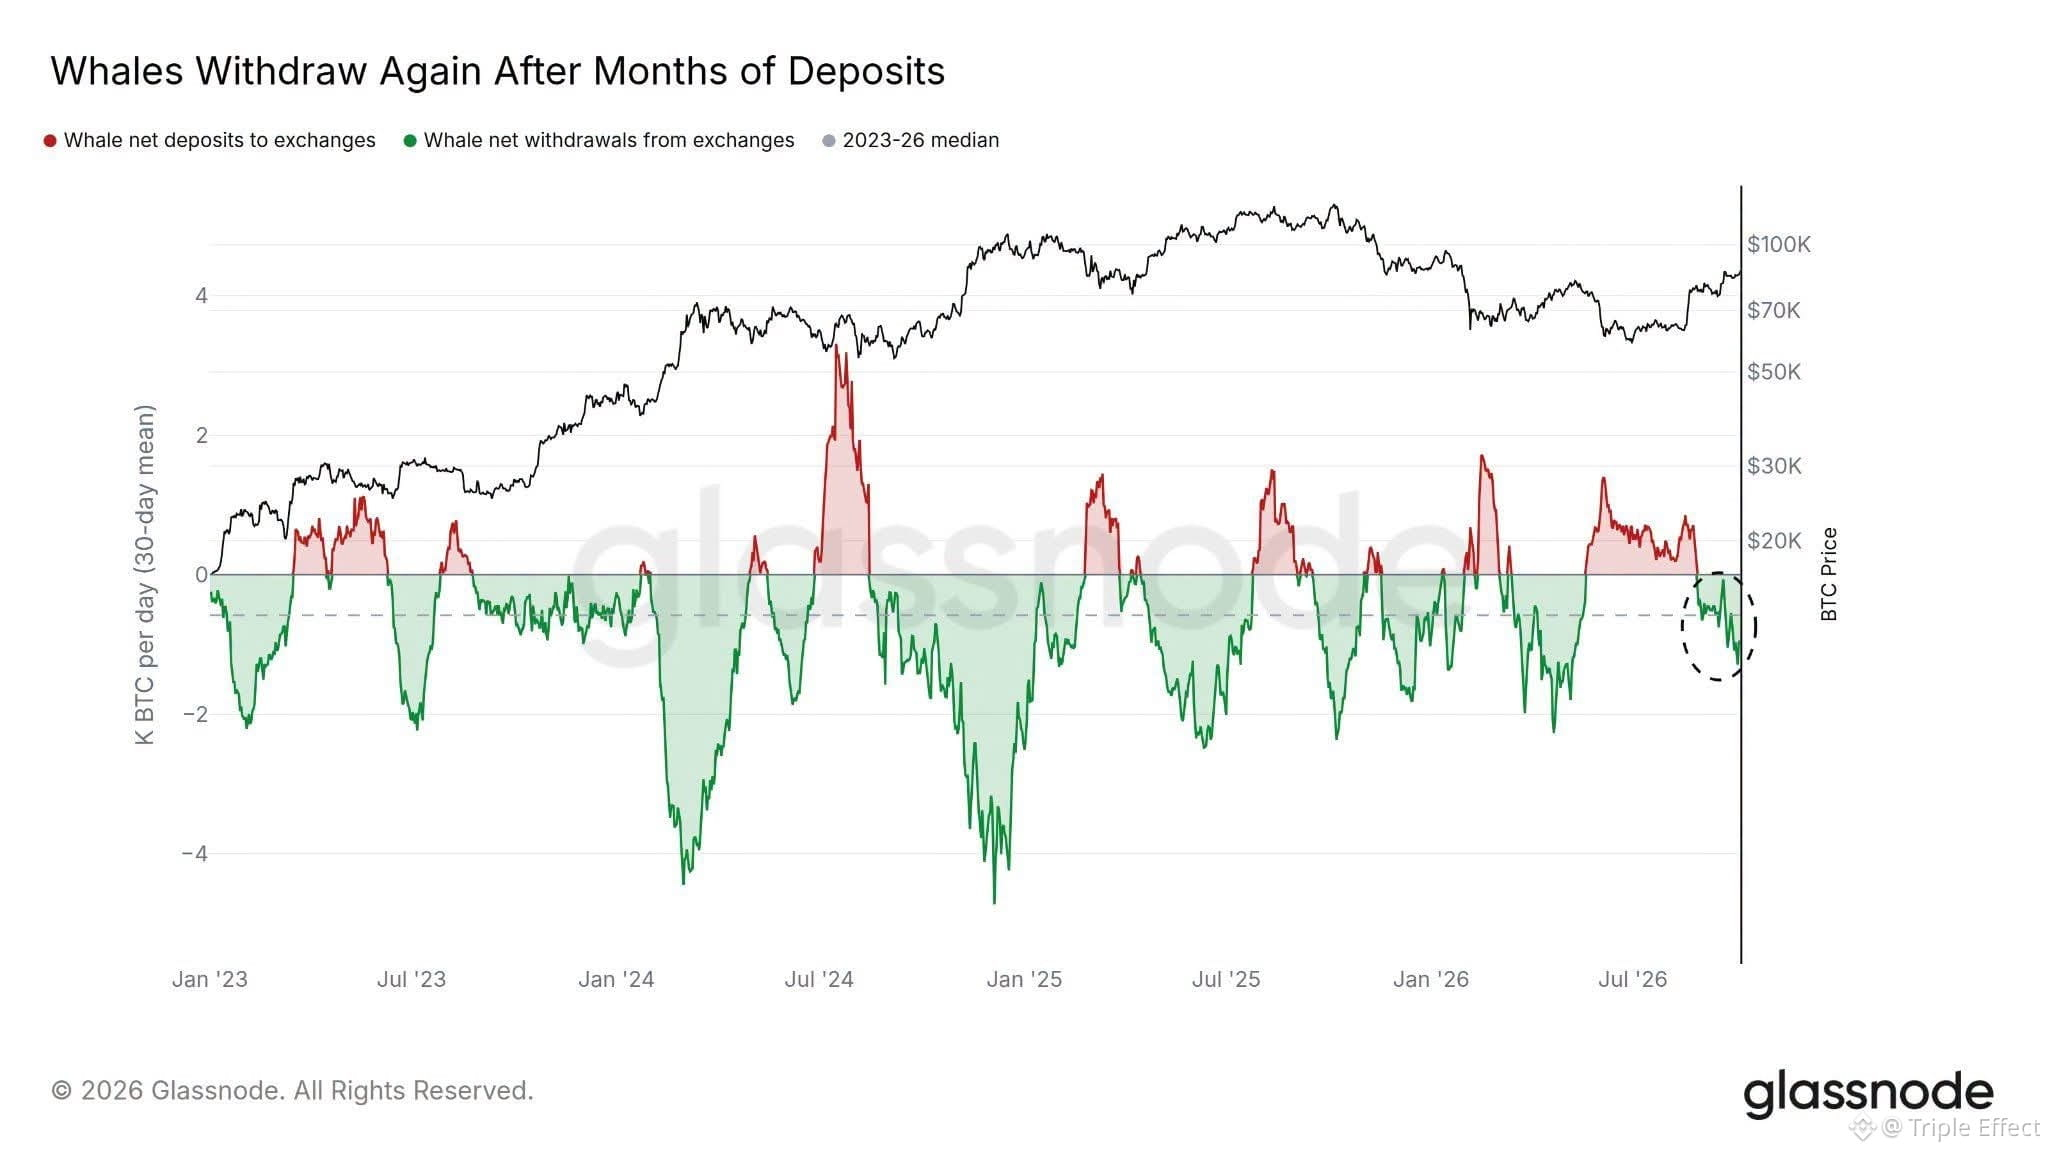
Whales have stopped sending Bitcoin to trading platforms.
Their summer net deposit surge lasted for over three months, twice as long as any similar surge since 2023.
This surge ended in late August, and the flow has remained negative since then.
$BTC
#BTC
{spot}(BTCUSDT)
Whales have stopped sending Bitcoin to trading platforms.
Their summer net deposit surge lasted for over three months, twice as long as any similar surge since 2023.
This surge ended in late August, and the flow has remained negative since then.
$BTC
#BTC
Their summer net deposit surge lasted for over three months, twice as long as any similar surge since 2023.
This surge ended in late August, and the flow has remained negative since then.
$BTC
#BTC
106
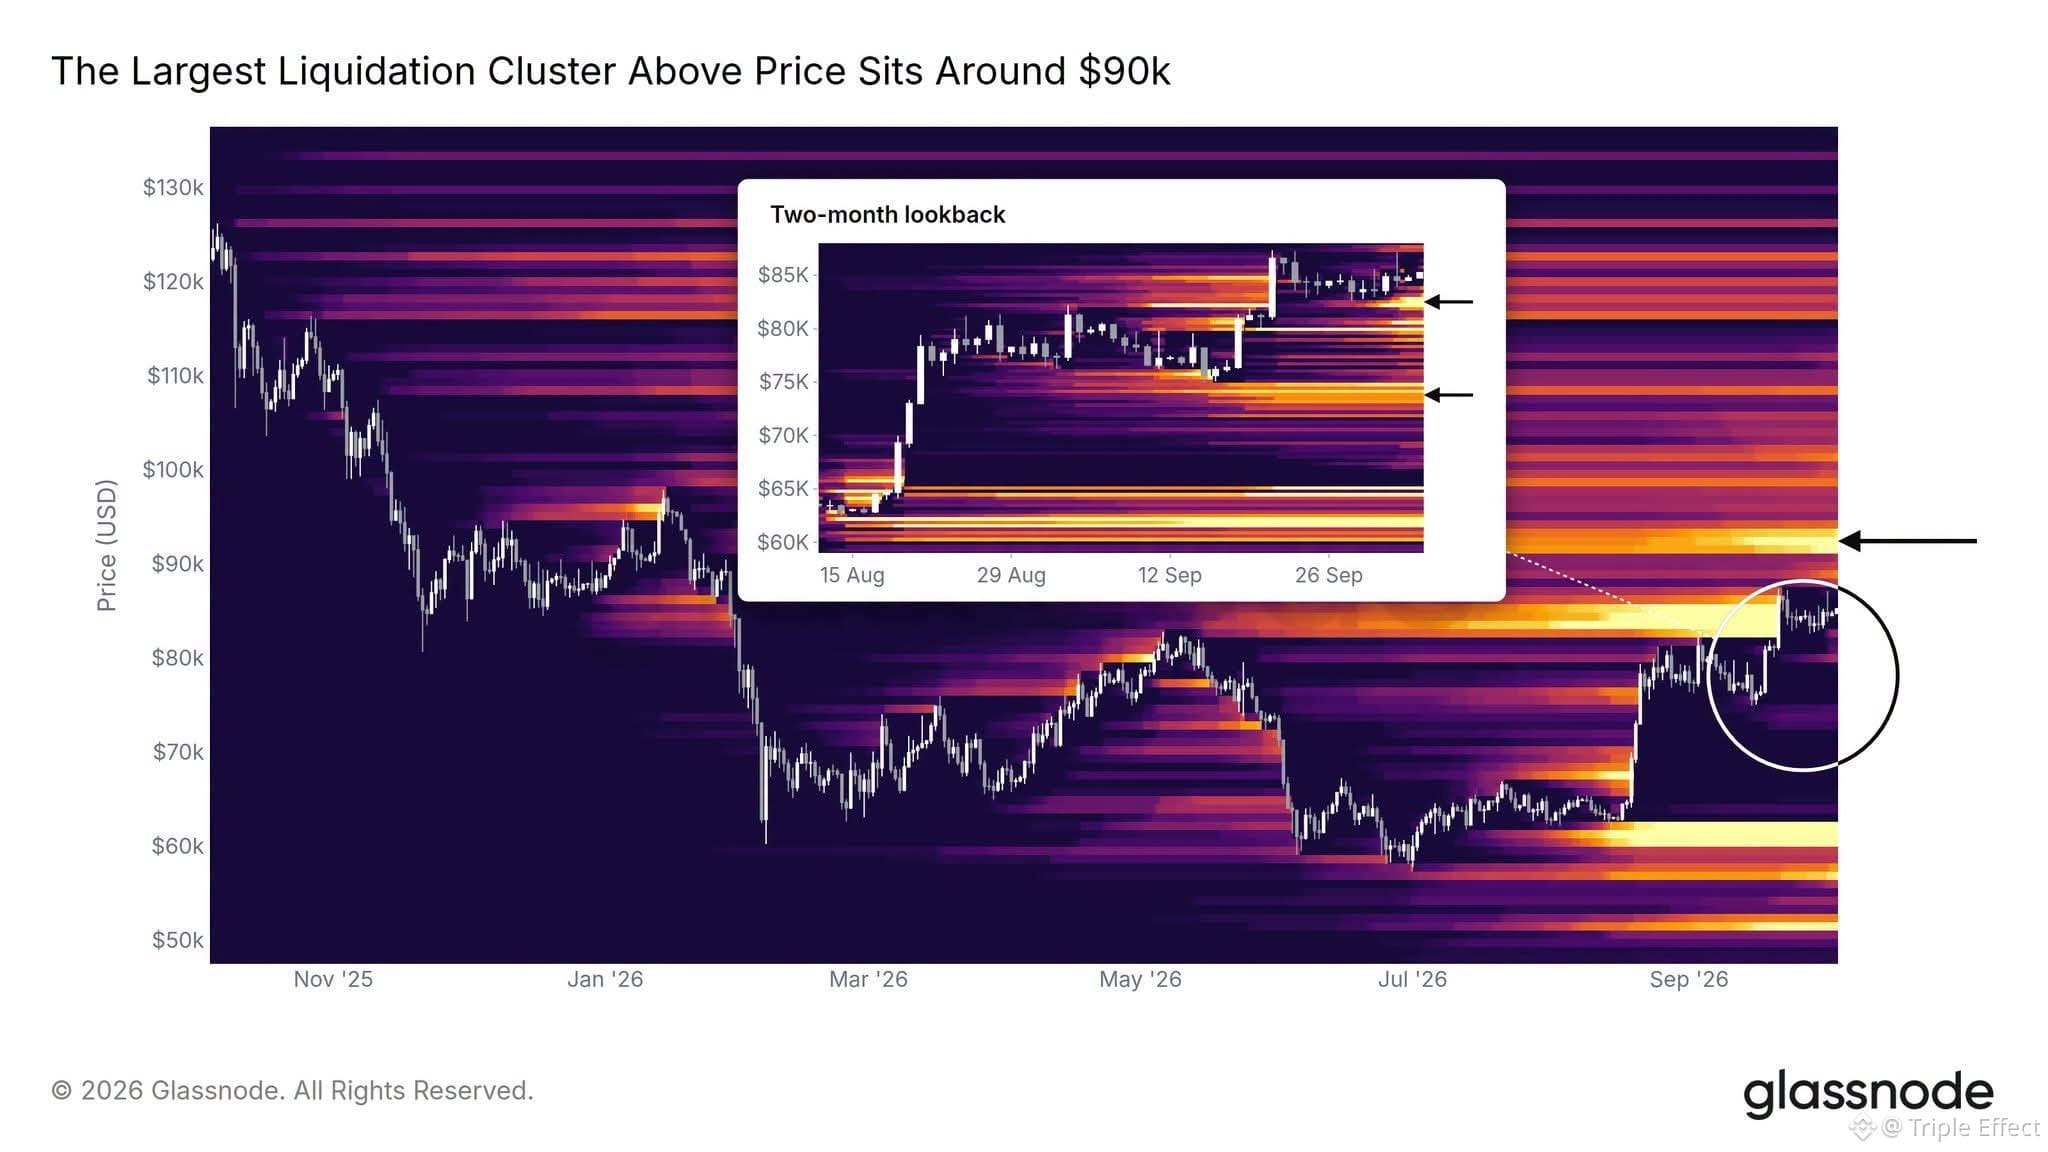
The largest Bitcoin liquidation zone is concentrated near $90,000.
If the price touches this level, speculators using leverage will be forced to close their positions.
Looking at the past two months, smaller liquidation zones can be observed around $83,000 and $75,000.
Either of these levels could accelerate the next move.
$BTC
#BTC
The largest Bitcoin liquidation zone is concentrated near $90,000.
If the price touches this level, speculators using leverage will be forced to close their positions.
Looking at the past two months, smaller liquidation zones can be observed around $83,000 and $75,000.
Either of these levels could accelerate the next move.
$BTC
#BTC
If the price touches this level, speculators using leverage will be forced to close their positions.
Looking at the past two months, smaller liquidation zones can be observed around $83,000 and $75,000.
Either of these levels could accelerate the next move.
$BTC
#BTC
538
Did you know:
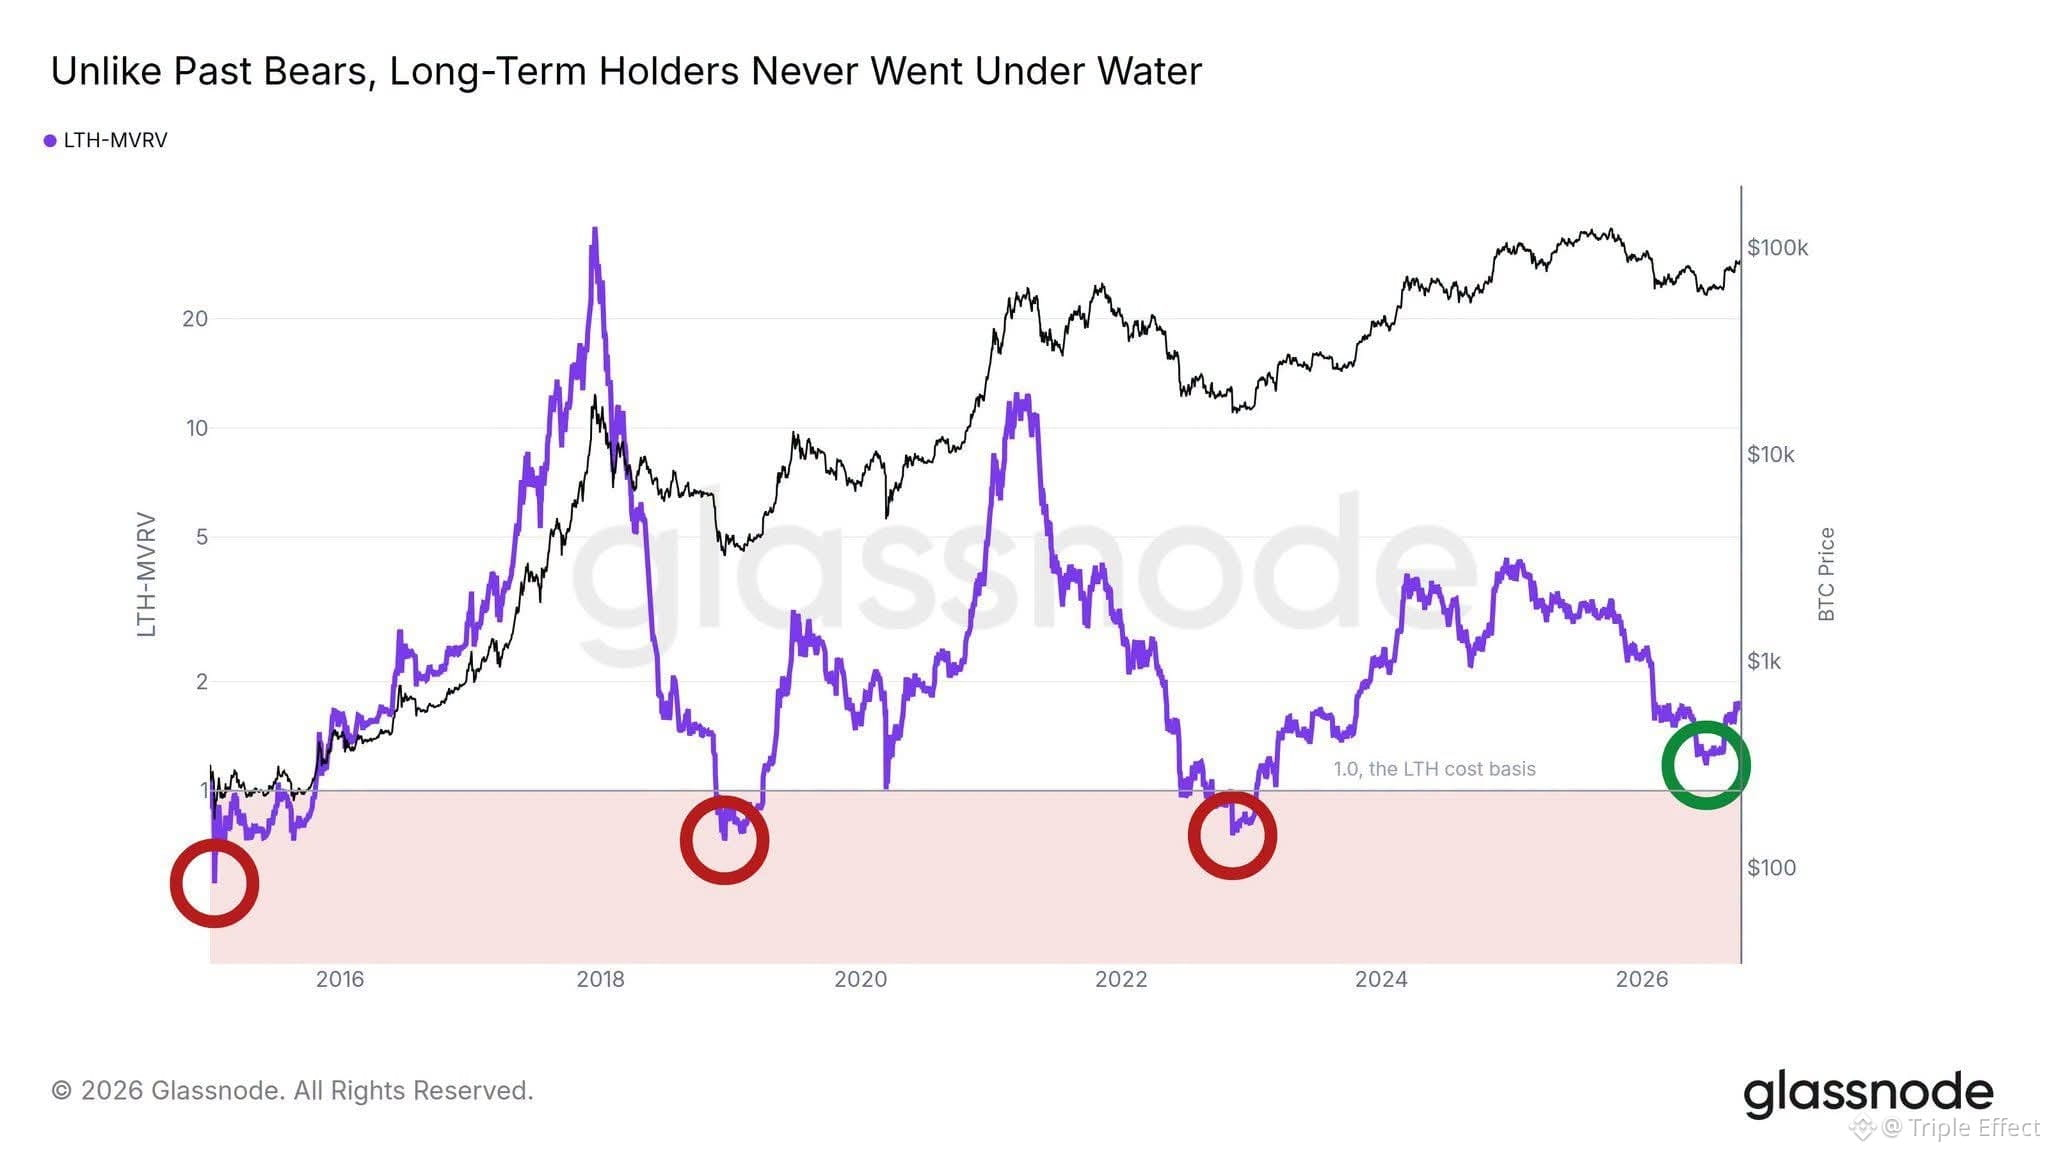
Long-term Bitcoin holders have maintained their profits throughout this cycle.
No bear market has seen this since at least 2015.
In every previous bear market, the LTH-MVRV index fell below 1 at the cycle low, resulting in significant losses for investors.
This time, however, the index has surpassed 1 and is now rising again.
$BTC
#BTC
Did you know:
Long-term Bitcoin holders have maintained their profits throughout this cycle.
No bear market has seen this since at least 2015.
In every previous bear market, the LTH-MVRV index fell below 1 at the cycle low, resulting in significant losses for investors.
This time, however, the index has surpassed 1 and is now rising again.
$BTC
#BTC
Long-term Bitcoin holders have maintained their profits throughout this cycle.
No bear market has seen this since at least 2015.
In every previous bear market, the LTH-MVRV index fell below 1 at the cycle low, resulting in significant losses for investors.
This time, however, the index has surpassed 1 and is now rising again.
$BTC
#BTC
113
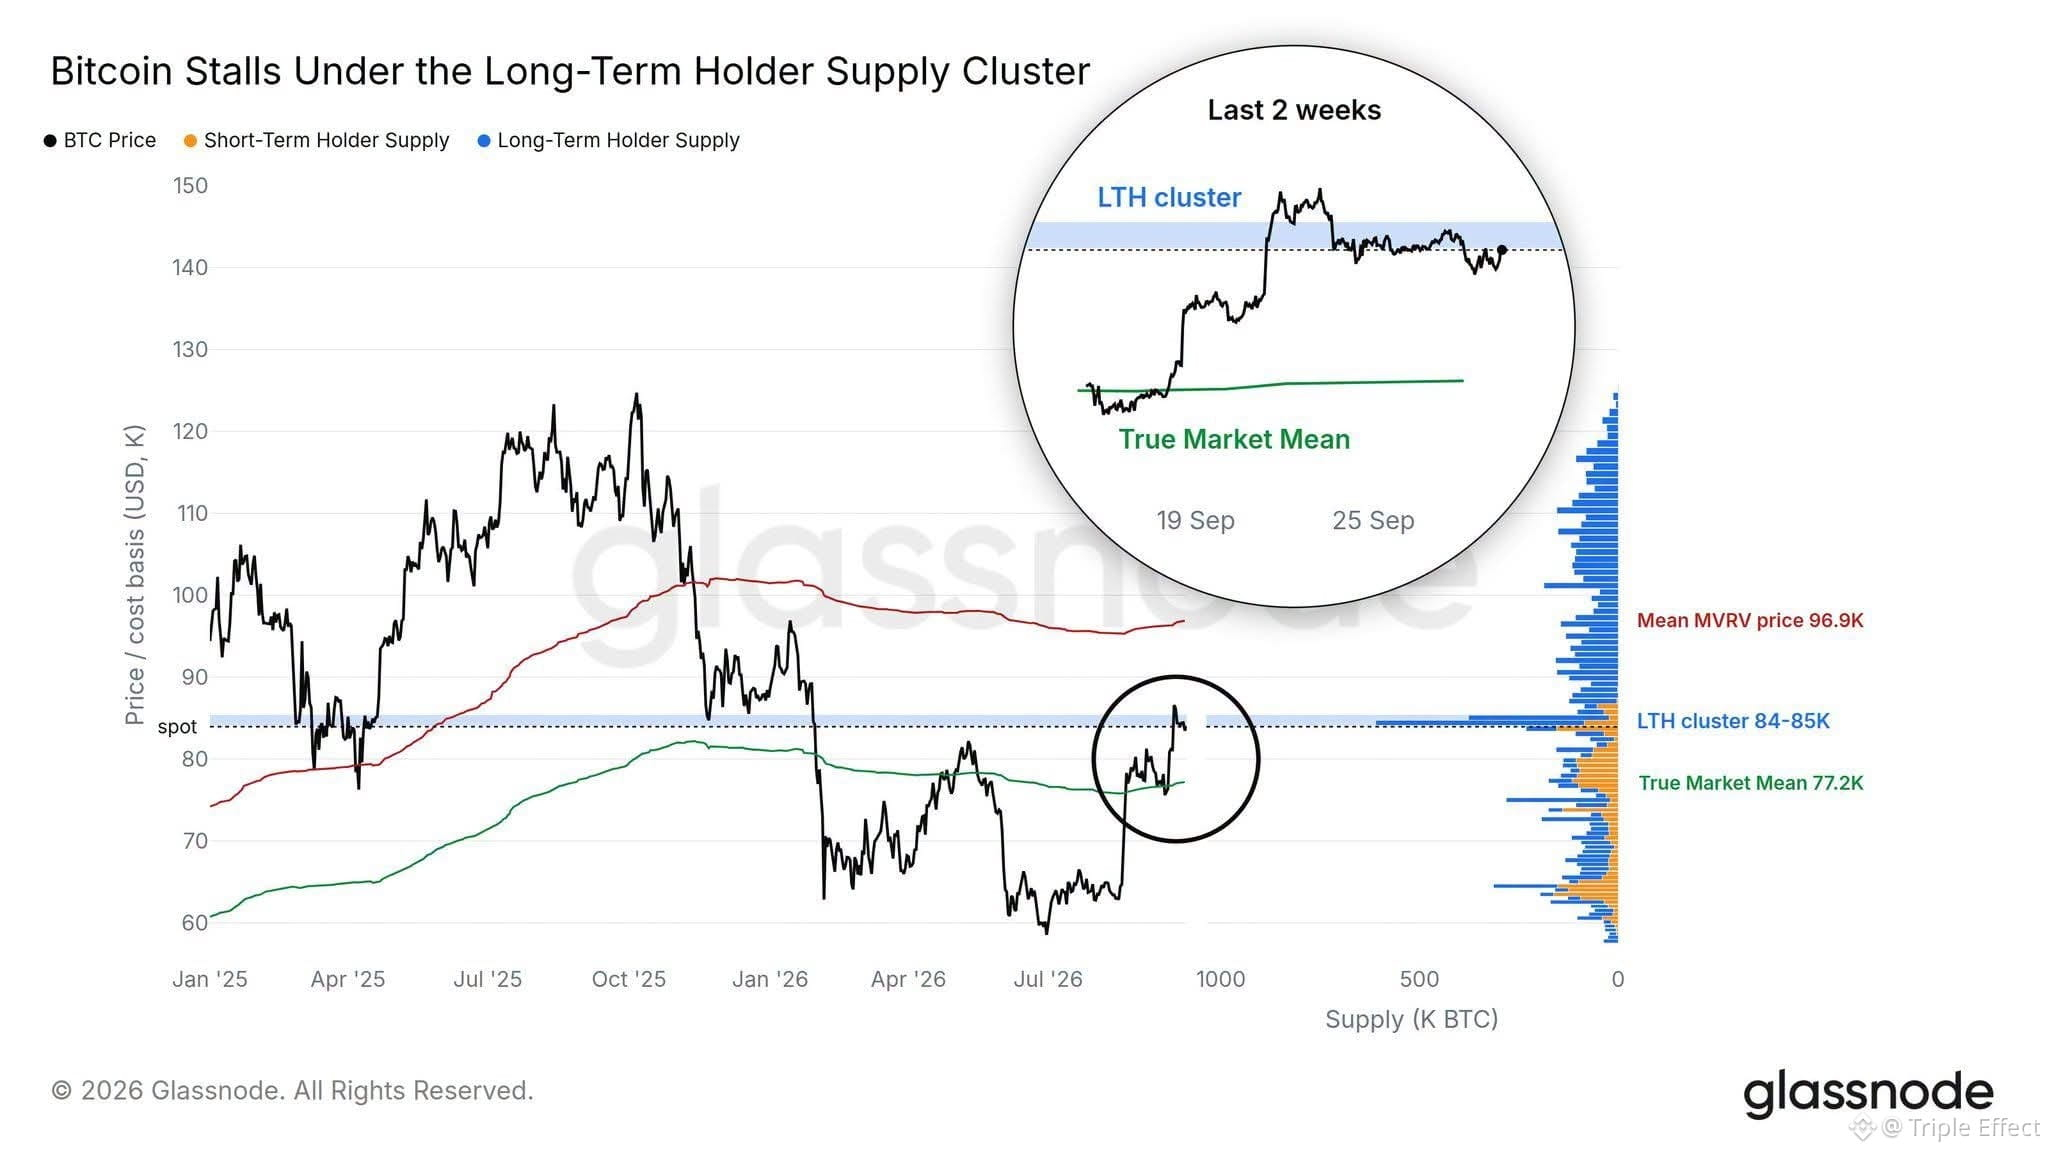
Bitcoin's price has stalled at a level of maximum supply.
There are more long-term holders of the coin at a price between $84,000 and $85,000 than at any other price on the chart.
The price needs to break through and stabilize above this level to continue its upward trend.
$ETH
#BTC
Bitcoin's price has stalled at a level of maximum supply.
There are more long-term holders of the coin at a price between $84,000 and $85,000 than at any other price on the chart.
The price needs to break through and stabilize above this level to continue its upward trend.
$ETH
#BTC
There are more long-term holders of the coin at a price between $84,000 and $85,000 than at any other price on the chart.
The price needs to break through and stabilize above this level to continue its upward trend.
$ETH
#BTC
873
Breaking:
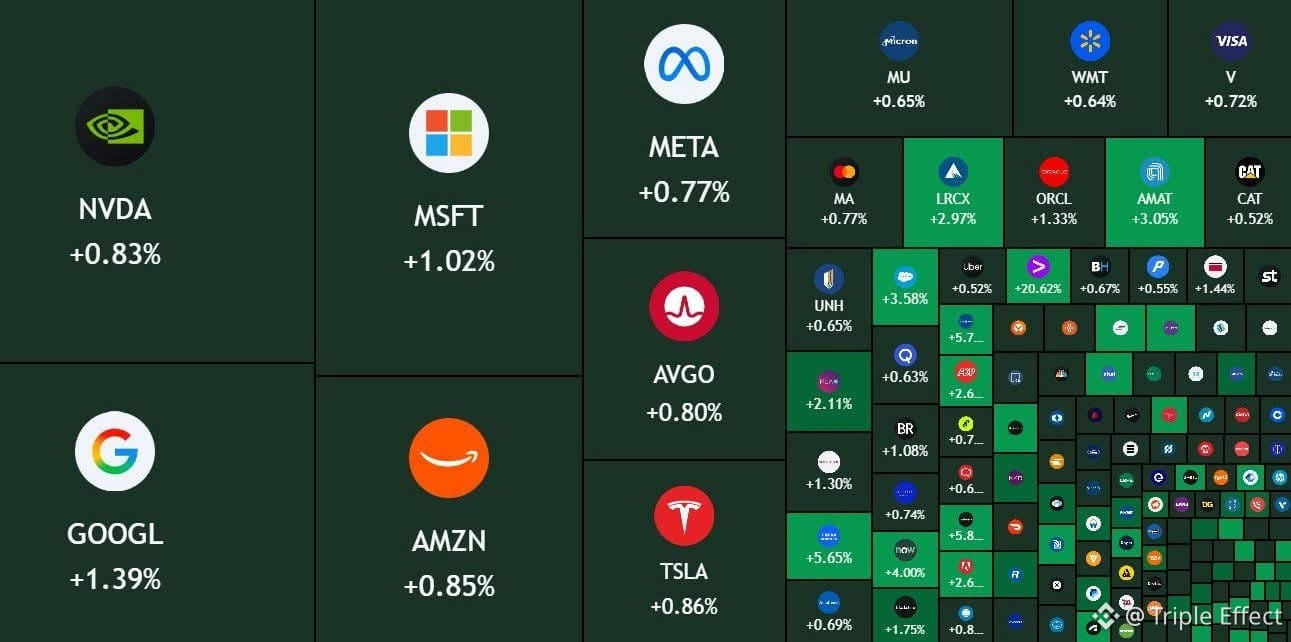
Nearly $250 billion was added to the US stock market at the opening bell.
📈 Strong inflows could be positive for Bitcoin and altcoins.
$BTC
#BTC
Breaking:
Nearly $250 billion was added to the US stock market at the opening bell.
📈 Strong inflows could be positive for Bitcoin and altcoins.
$BTC
#BTC
Nearly $250 billion was added to the US stock market at the opening bell.
📈 Strong inflows could be positive for Bitcoin and altcoins.
$BTC
#BTC
408
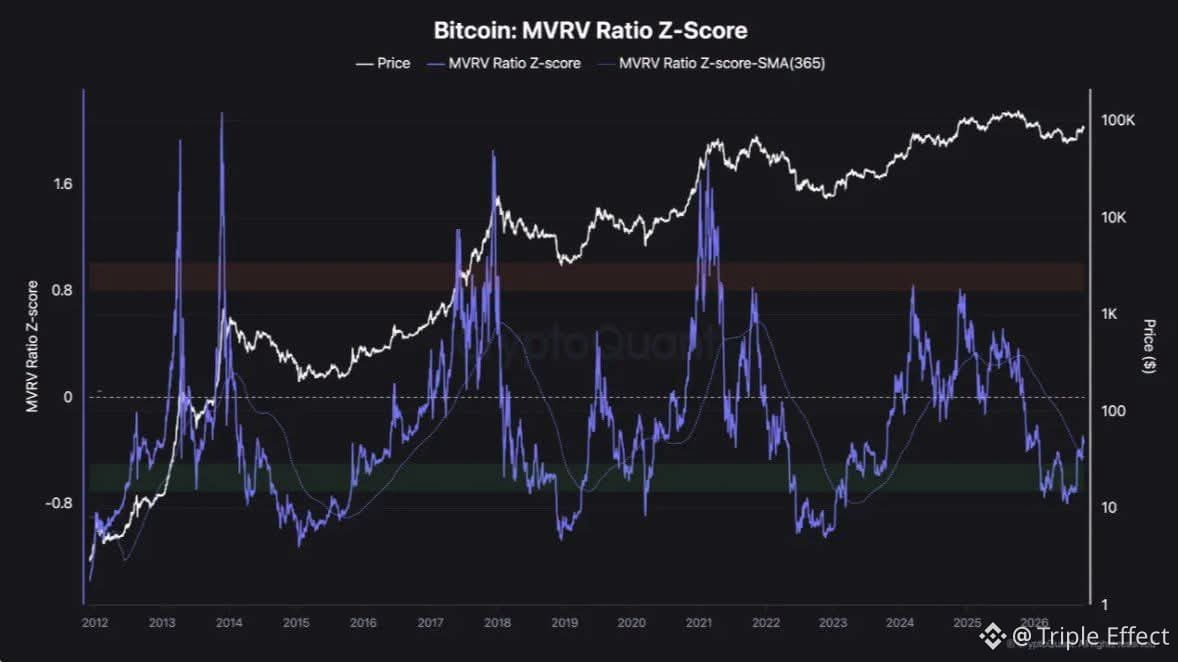
The MVRV Z-Score index holds above its 365-day moving average:
The long-term market structure remains bullish.
Historically, once the MVRV Z-Score index breaks above its 365-day moving average, this average often acts as support during a broader uptrend.
$BNB
#BTC
The MVRV Z-Score index holds above its 365-day moving average:
The long-term market structure remains bullish.
Historically, once the MVRV Z-Score index breaks above its 365-day moving average, this average often acts as support during a broader uptrend.
$BNB
#BTC
The long-term market structure remains bullish.
Historically, once the MVRV Z-Score index breaks above its 365-day moving average, this average often acts as support during a broader uptrend.
$BNB
#BTC
338
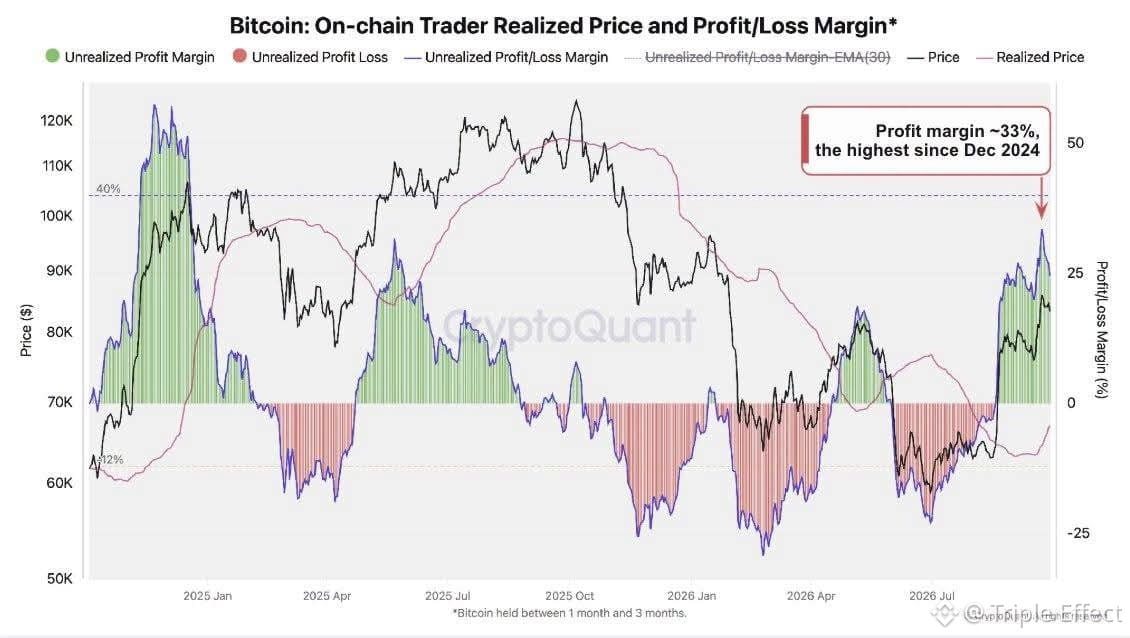
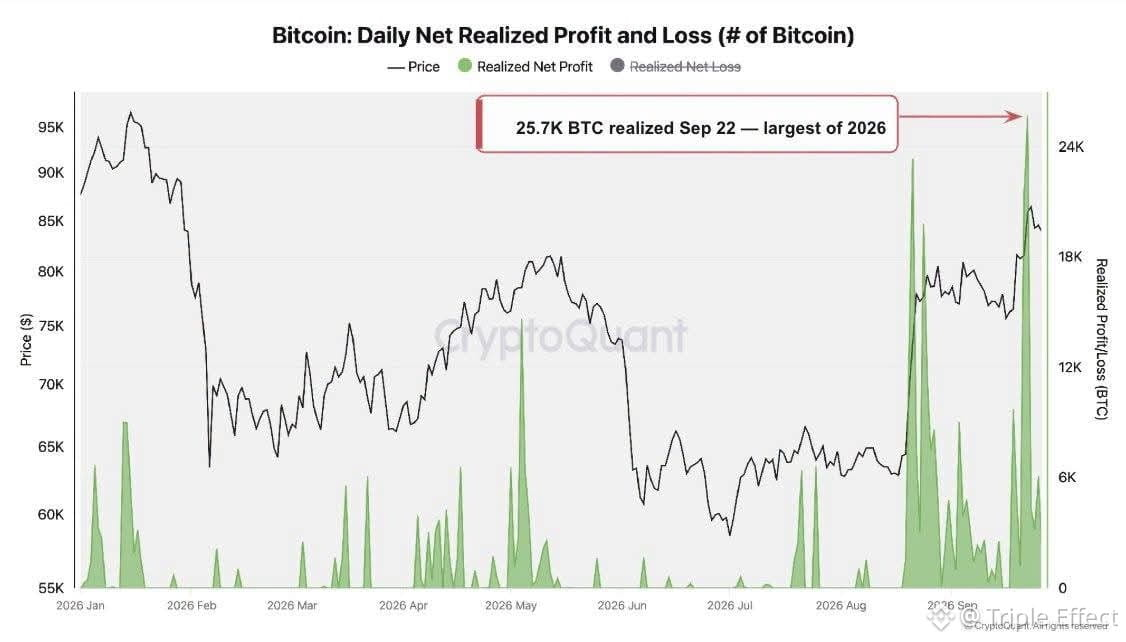
Investors are taking profits.
Profit-taking peaked in 2026, with traders' unrealized gains reaching 33%, while demand is declining.
The bull market is still in place, but its momentum is showing some cracks.
The $80,000 level is the first support level to watch.
$BTC
#BTC
Investors are taking profits.
Profit-taking peaked in 2026, with traders' unrealized gains reaching 33%, while demand is declining.
The bull market is still in place, but its momentum is showing some cracks.
The $80,000 level is the first support level to watch.
$BTC
#BTC
Profit-taking peaked in 2026, with traders' unrealized gains reaching 33%, while demand is declining.
The bull market is still in place, but its momentum is showing some cracks.
The $80,000 level is the first support level to watch.
$BTC
#BTC
442
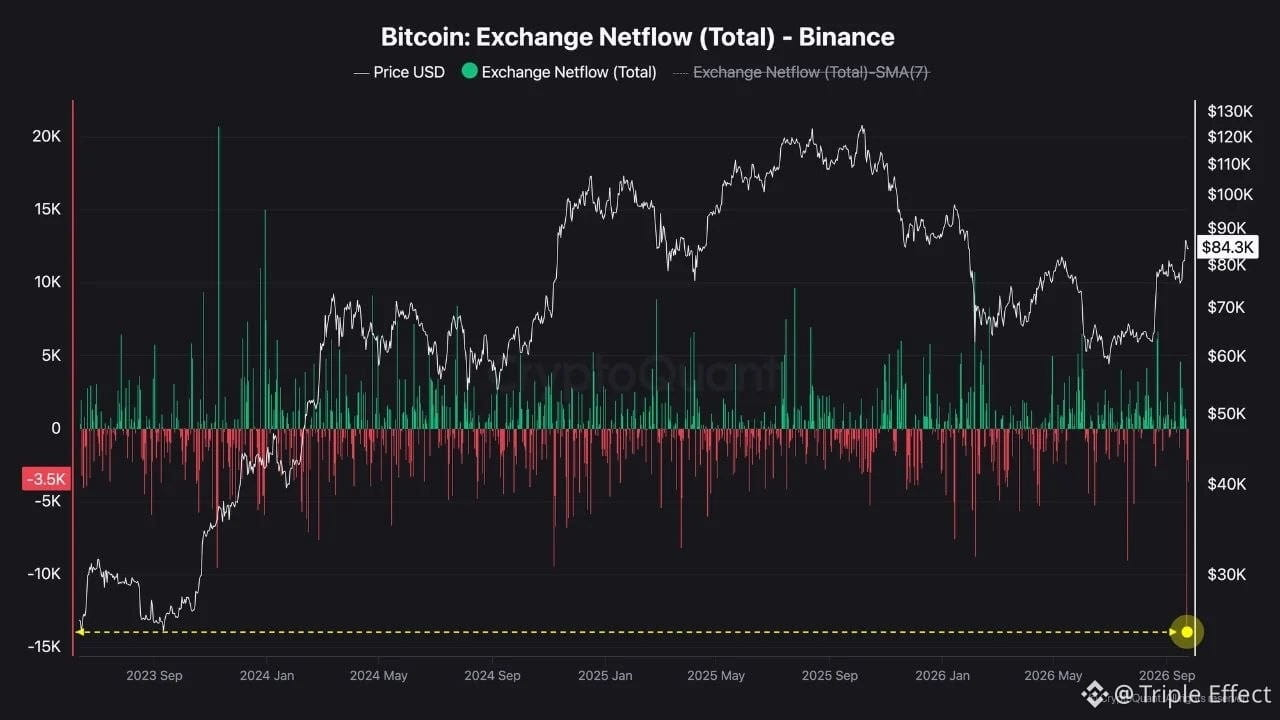
Binance is experiencing record outflows since 2023 amid rising Bitcoin demand.
Over four days, Bitcoin reserves on the Binance platform dropped from 705,000 BTC to 685,000 BTC.
When outflows become prevalent, it indicates that some investors are choosing to hold Bitcoin for themselves.
This behavior is often associated with long-term holdings, which is a positive indicator.
In practical terms, the decline in Bitcoin on trading platforms reduces potential selling pressure.
This sudden development suggests a wave of fear of missing out among new investors, especially those who anticipated a further drop in the Bitcoin price, as happened during previous price drops.
It wouldn't be surprising if these events were to recur as Bitcoin continues its upward trend.
$GOOGL.US
#BTC
Binance is experiencing record outflows since 2023 amid rising Bitcoin demand.
Over four days, Bitcoin reserves on the Binance platform dropped from 705,000 BTC to 685,000 BTC.
When outflows become prevalent, it indicates that some investors are choosing to hold Bitcoin for themselves.
This behavior is often associated with long-term holdings, which is a positive indicator.
In practical terms, the decline in Bitcoin on trading platforms reduces potential selling pressure.
This sudden development suggests a wave of fear of missing out among new investors, especially those who anticipated a further drop in the Bitcoin price, as happened during previous price drops.
It wouldn't be surprising if these events were to recur as Bitcoin continues its upward trend.
$GOOGL.US
#BTC
Over four days, Bitcoin reserves on the Binance platform dropped from 705,000 BTC to 685,000 BTC.
When outflows become prevalent, it indicates that some investors are choosing to hold Bitcoin for themselves.
This behavior is often associated with long-term holdings, which is a positive indicator.
In practical terms, the decline in Bitcoin on trading platforms reduces potential selling pressure.
This sudden development suggests a wave of fear of missing out among new investors, especially those who anticipated a further drop in the Bitcoin price, as happened during previous price drops.
It wouldn't be surprising if these events were to recur as Bitcoin continues its upward trend.
$GOOGL.US
#BTC
335
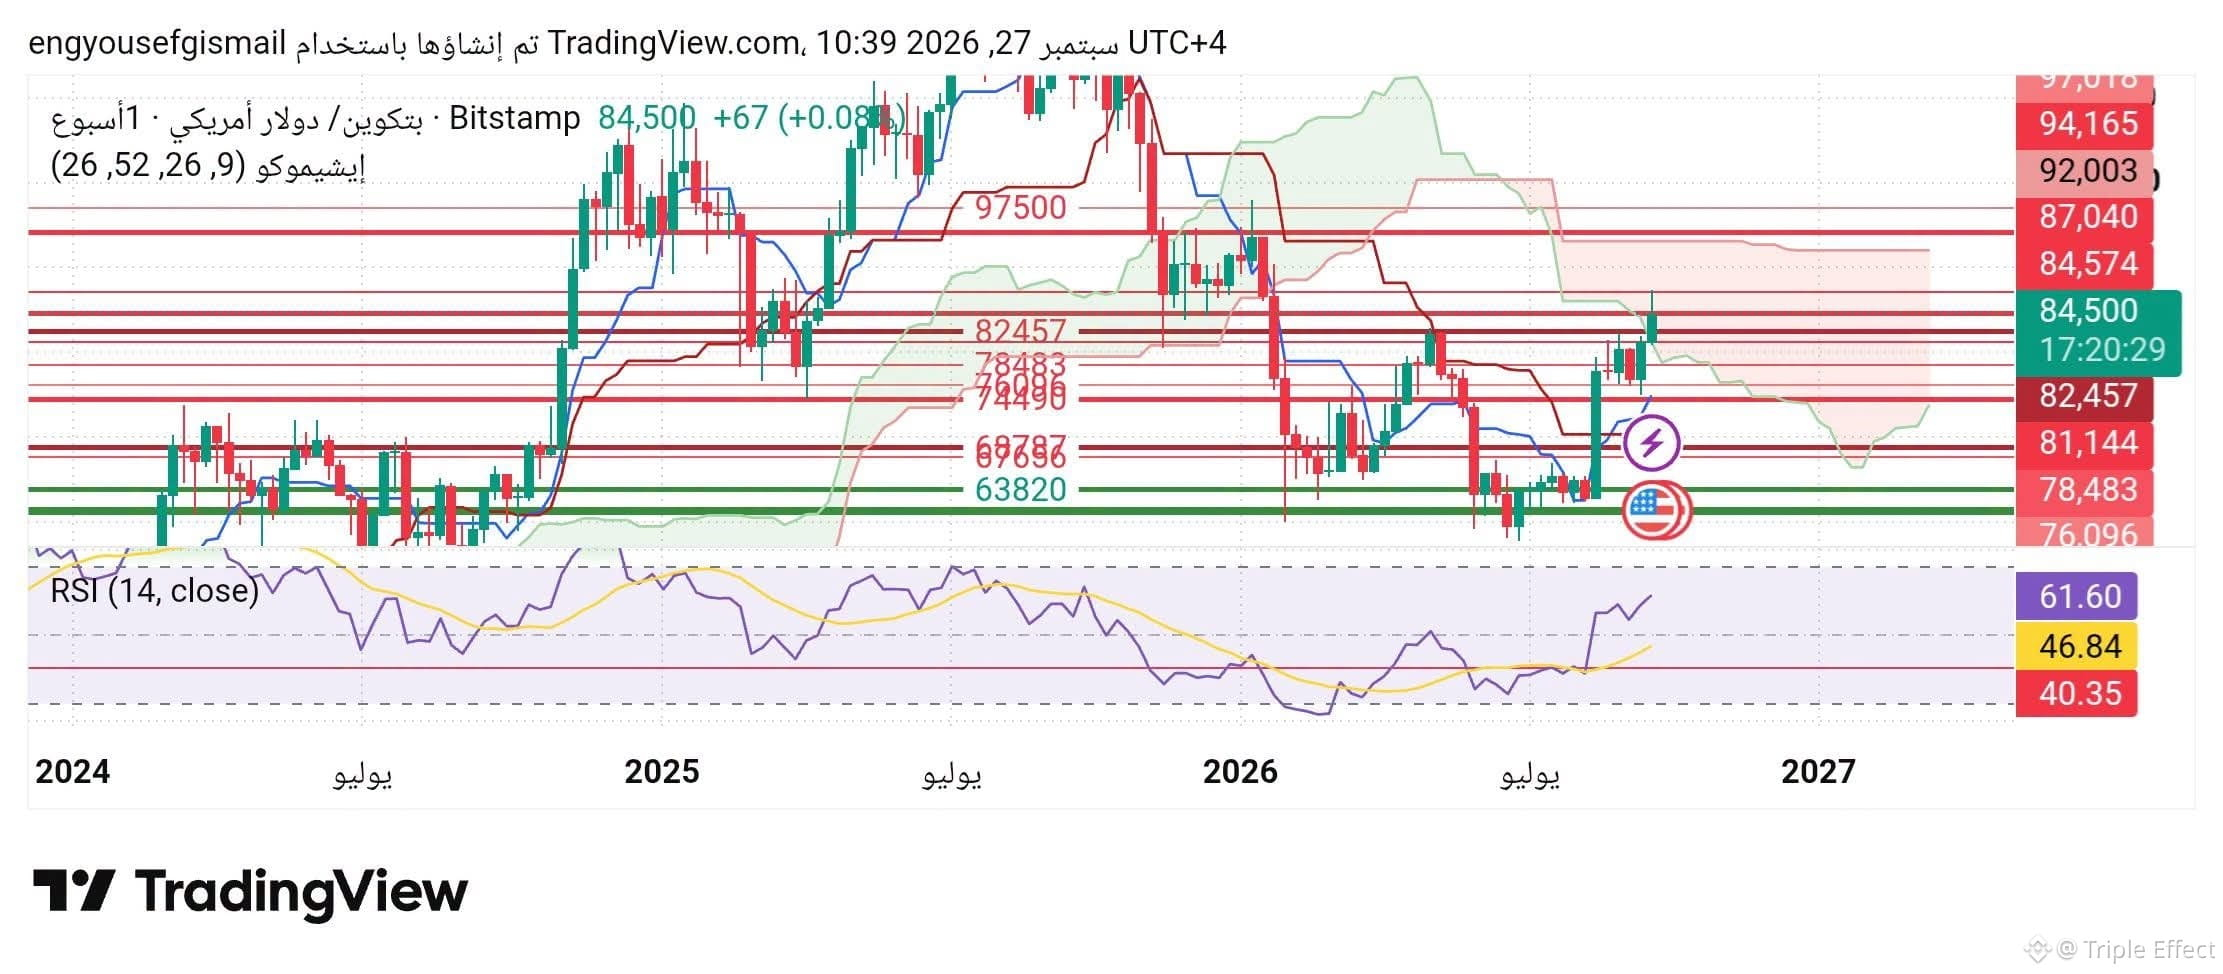
Bitcoin Analysis:
The 84574 resistance level is considered crucial because breaking through and holding above it on the weekly timeframe opens the way to reaching 94165.
Note:
The 84574 resistance has been tested 7 consecutive times so far, which is a positive sign.
$NVDA.US
#BTC
Bitcoin Analysis:
The 84574 resistance level is considered crucial because breaking through and holding above it on the weekly timeframe opens the way to reaching 94165.
Note:
The 84574 resistance has been tested 7 consecutive times so far, which is a positive sign.
$NVDA.US
#BTC
The 84574 resistance level is considered crucial because breaking through and holding above it on the weekly timeframe opens the way to reaching 94165.
Note:
The 84574 resistance has been tested 7 consecutive times so far, which is a positive sign.
$NVDA.US
#BTC
BTC-2.57%
NVDAUS+0.02%
120
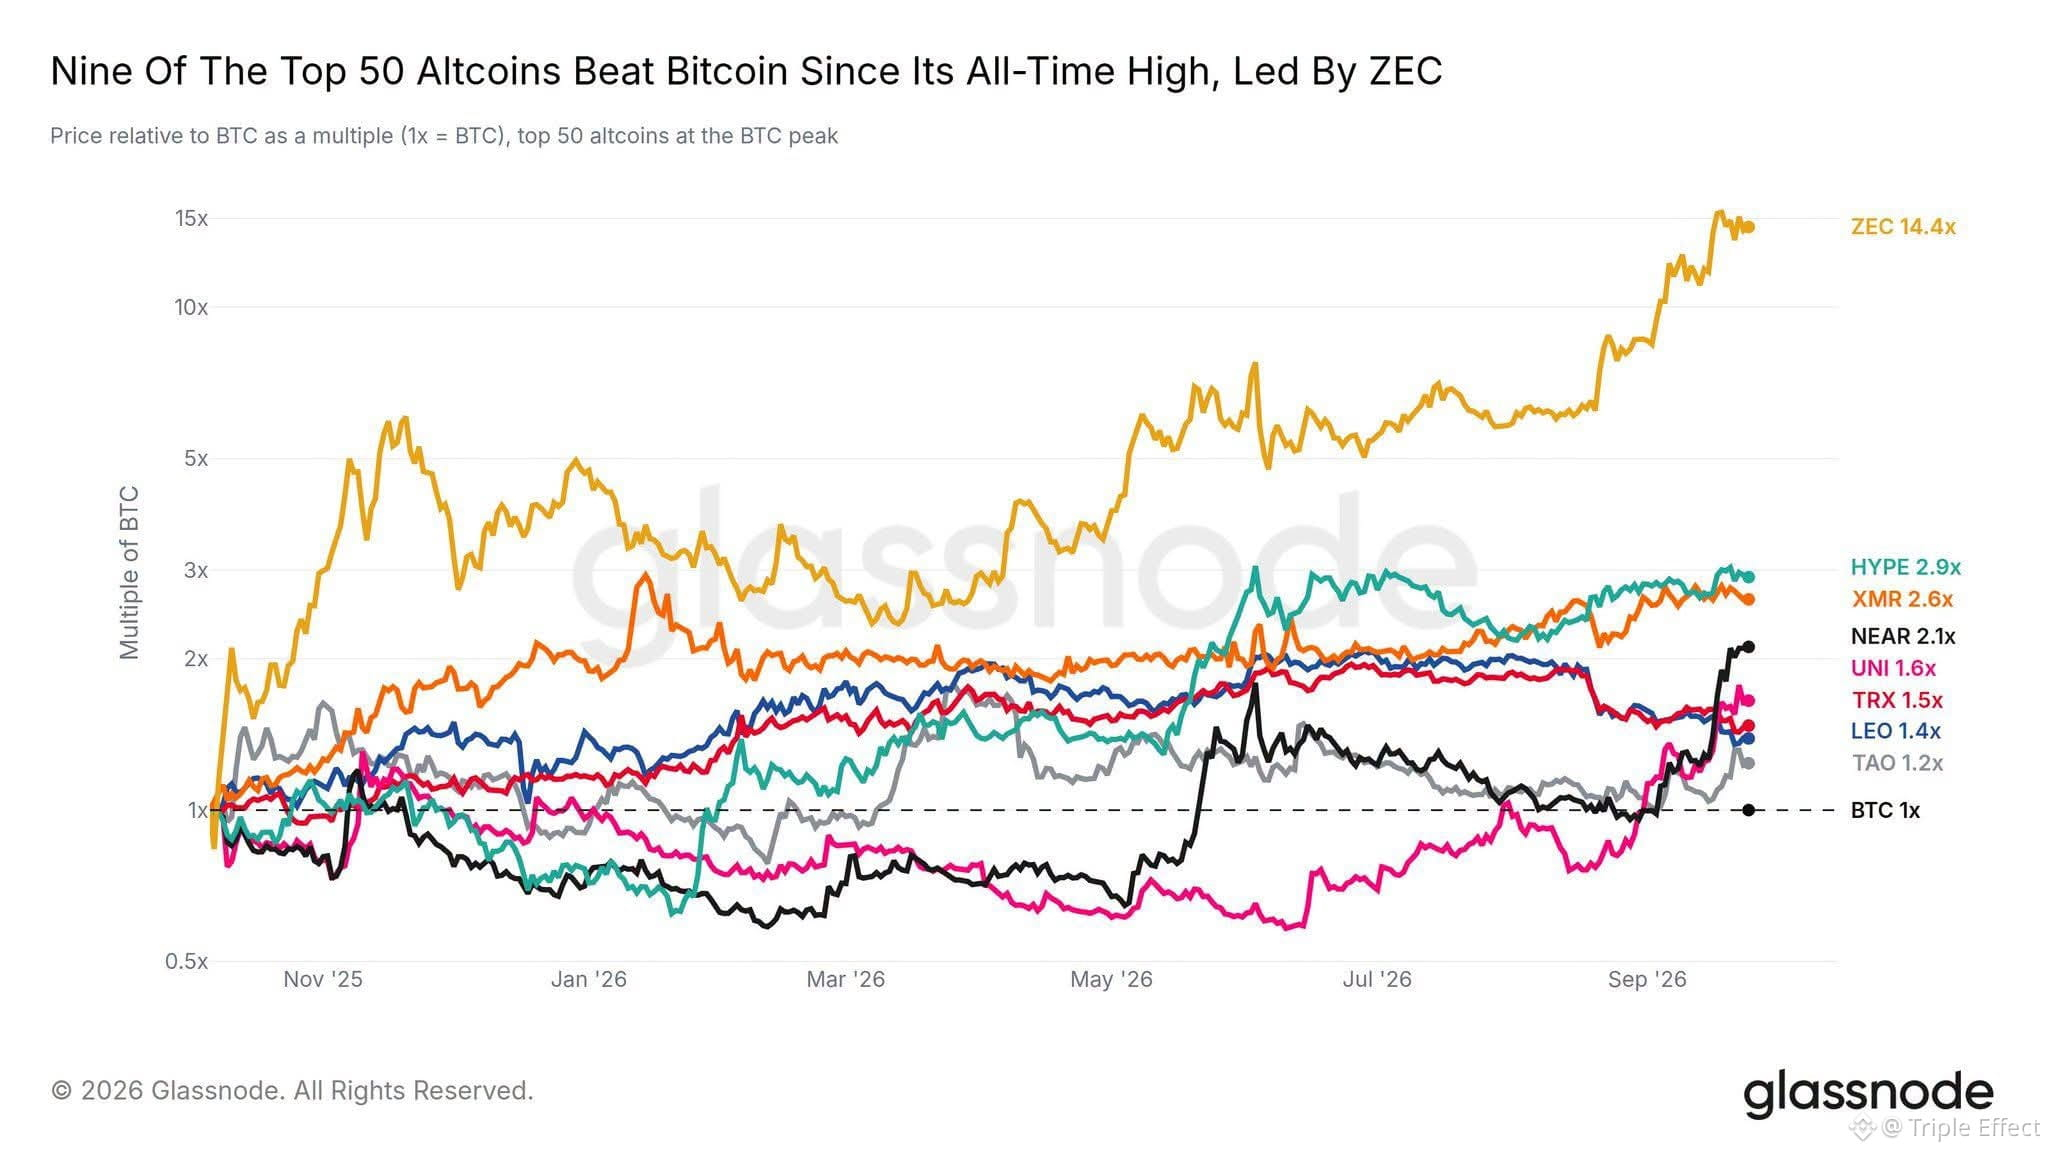
Only nine of the top 50 altcoins have outperformed Bitcoin since it reached its all-time high.
ZEC leads the list by a significant margin, having increased in value 14 times compared to Bitcoin.
HYPE, XMR, and NEAR follow with increases ranging from 2 to 3 times.
$NVDA.US
#Binance
Only nine of the top 50 altcoins have outperformed Bitcoin since it reached its all-time high.
ZEC leads the list by a significant margin, having increased in value 14 times compared to Bitcoin.
HYPE, XMR, and NEAR follow with increases ranging from 2 to 3 times.
$NVDA.US
#Binance
ZEC leads the list by a significant margin, having increased in value 14 times compared to Bitcoin.
HYPE, XMR, and NEAR follow with increases ranging from 2 to 3 times.
$NVDA.US
#Binance
221
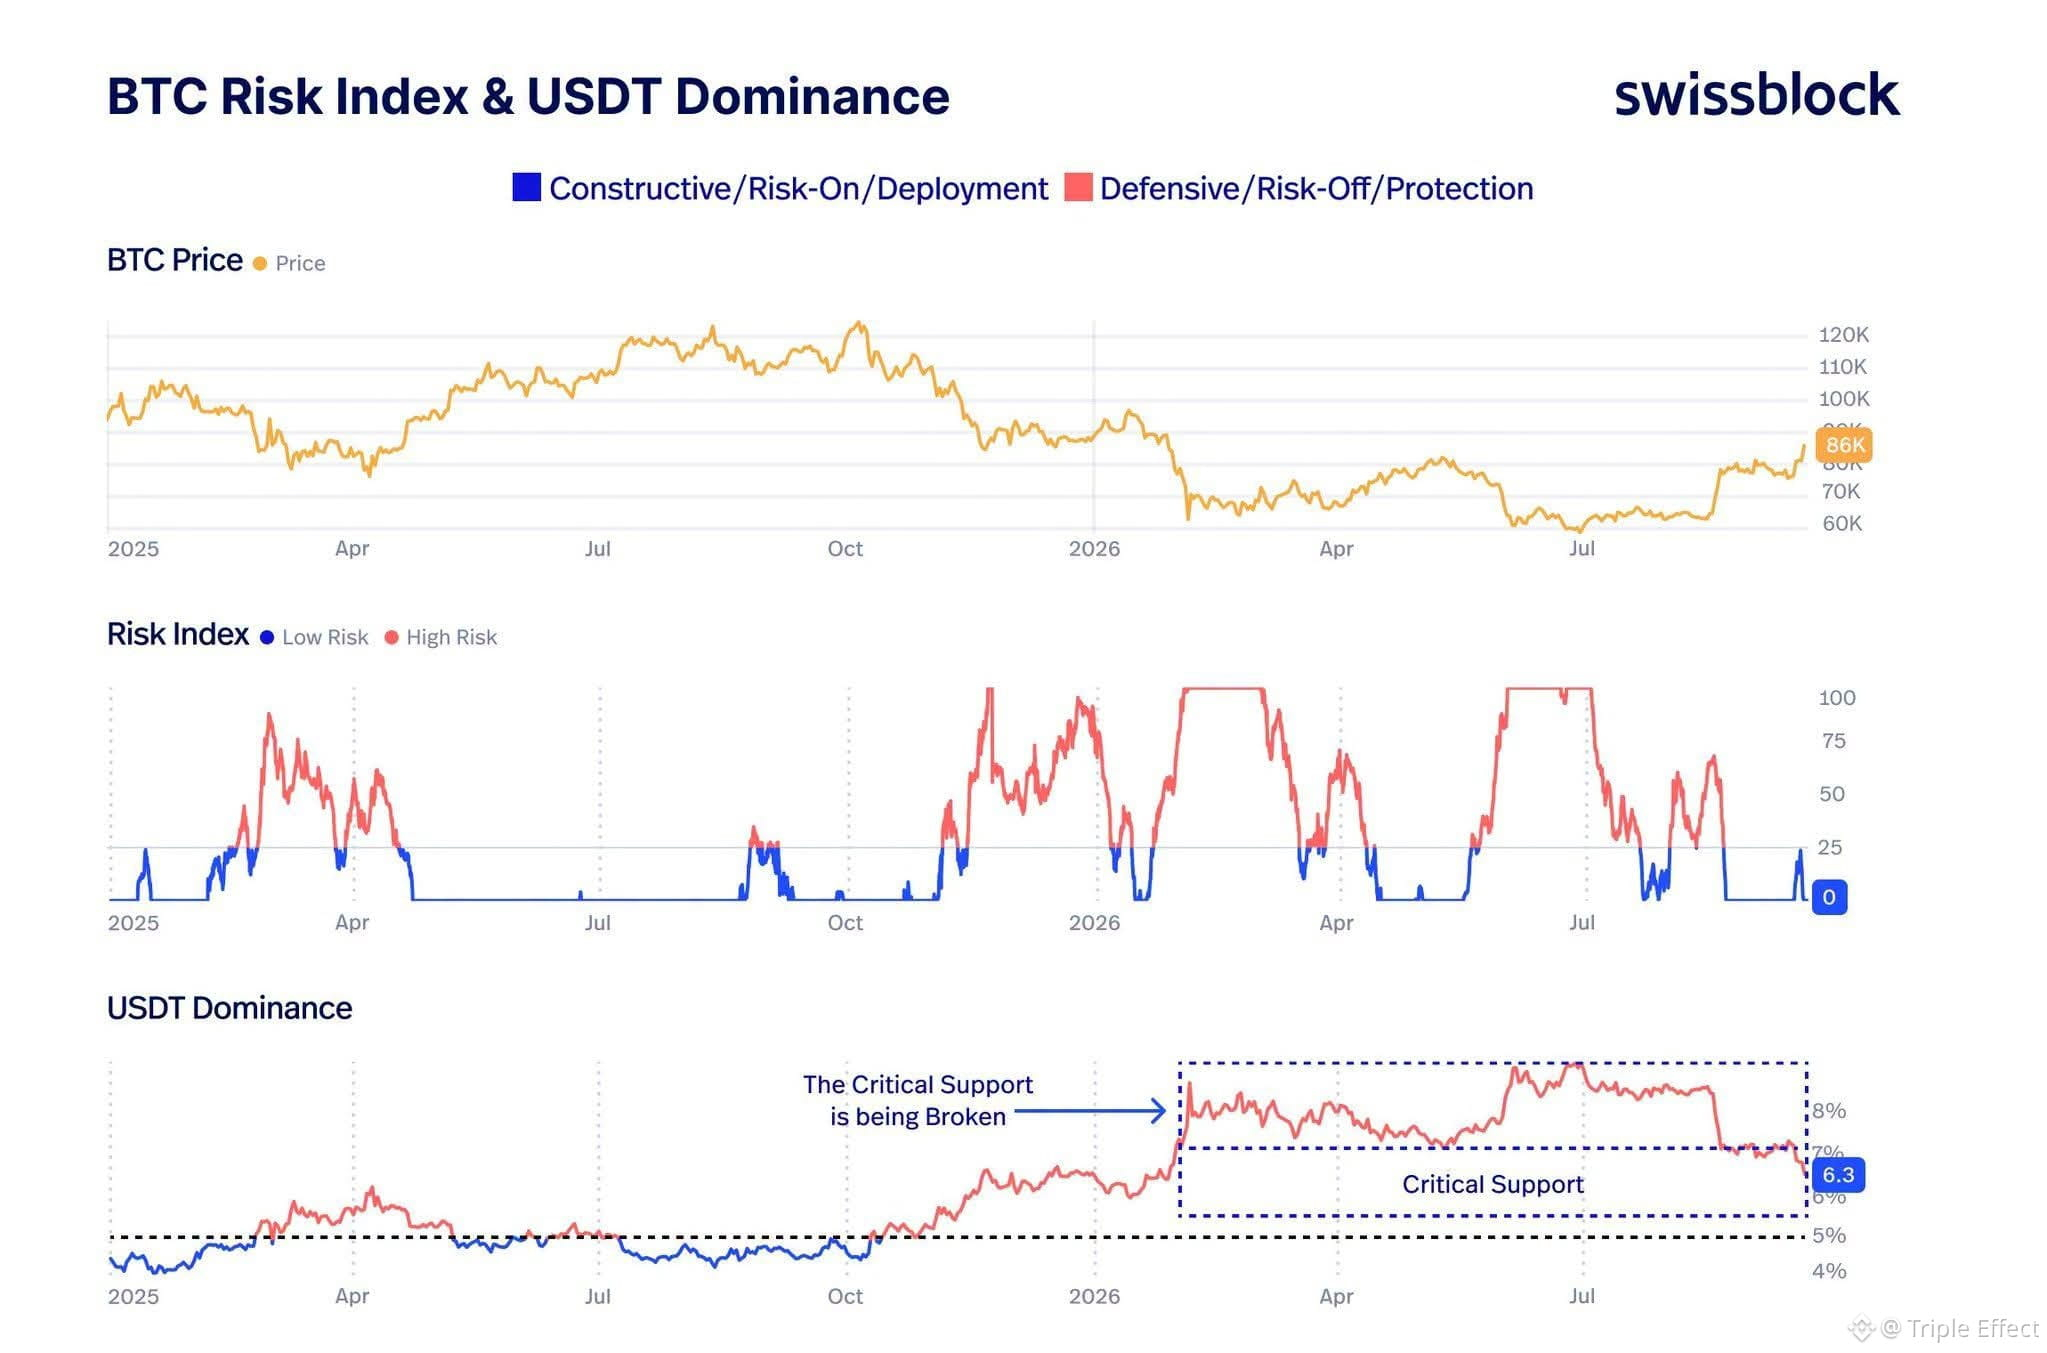
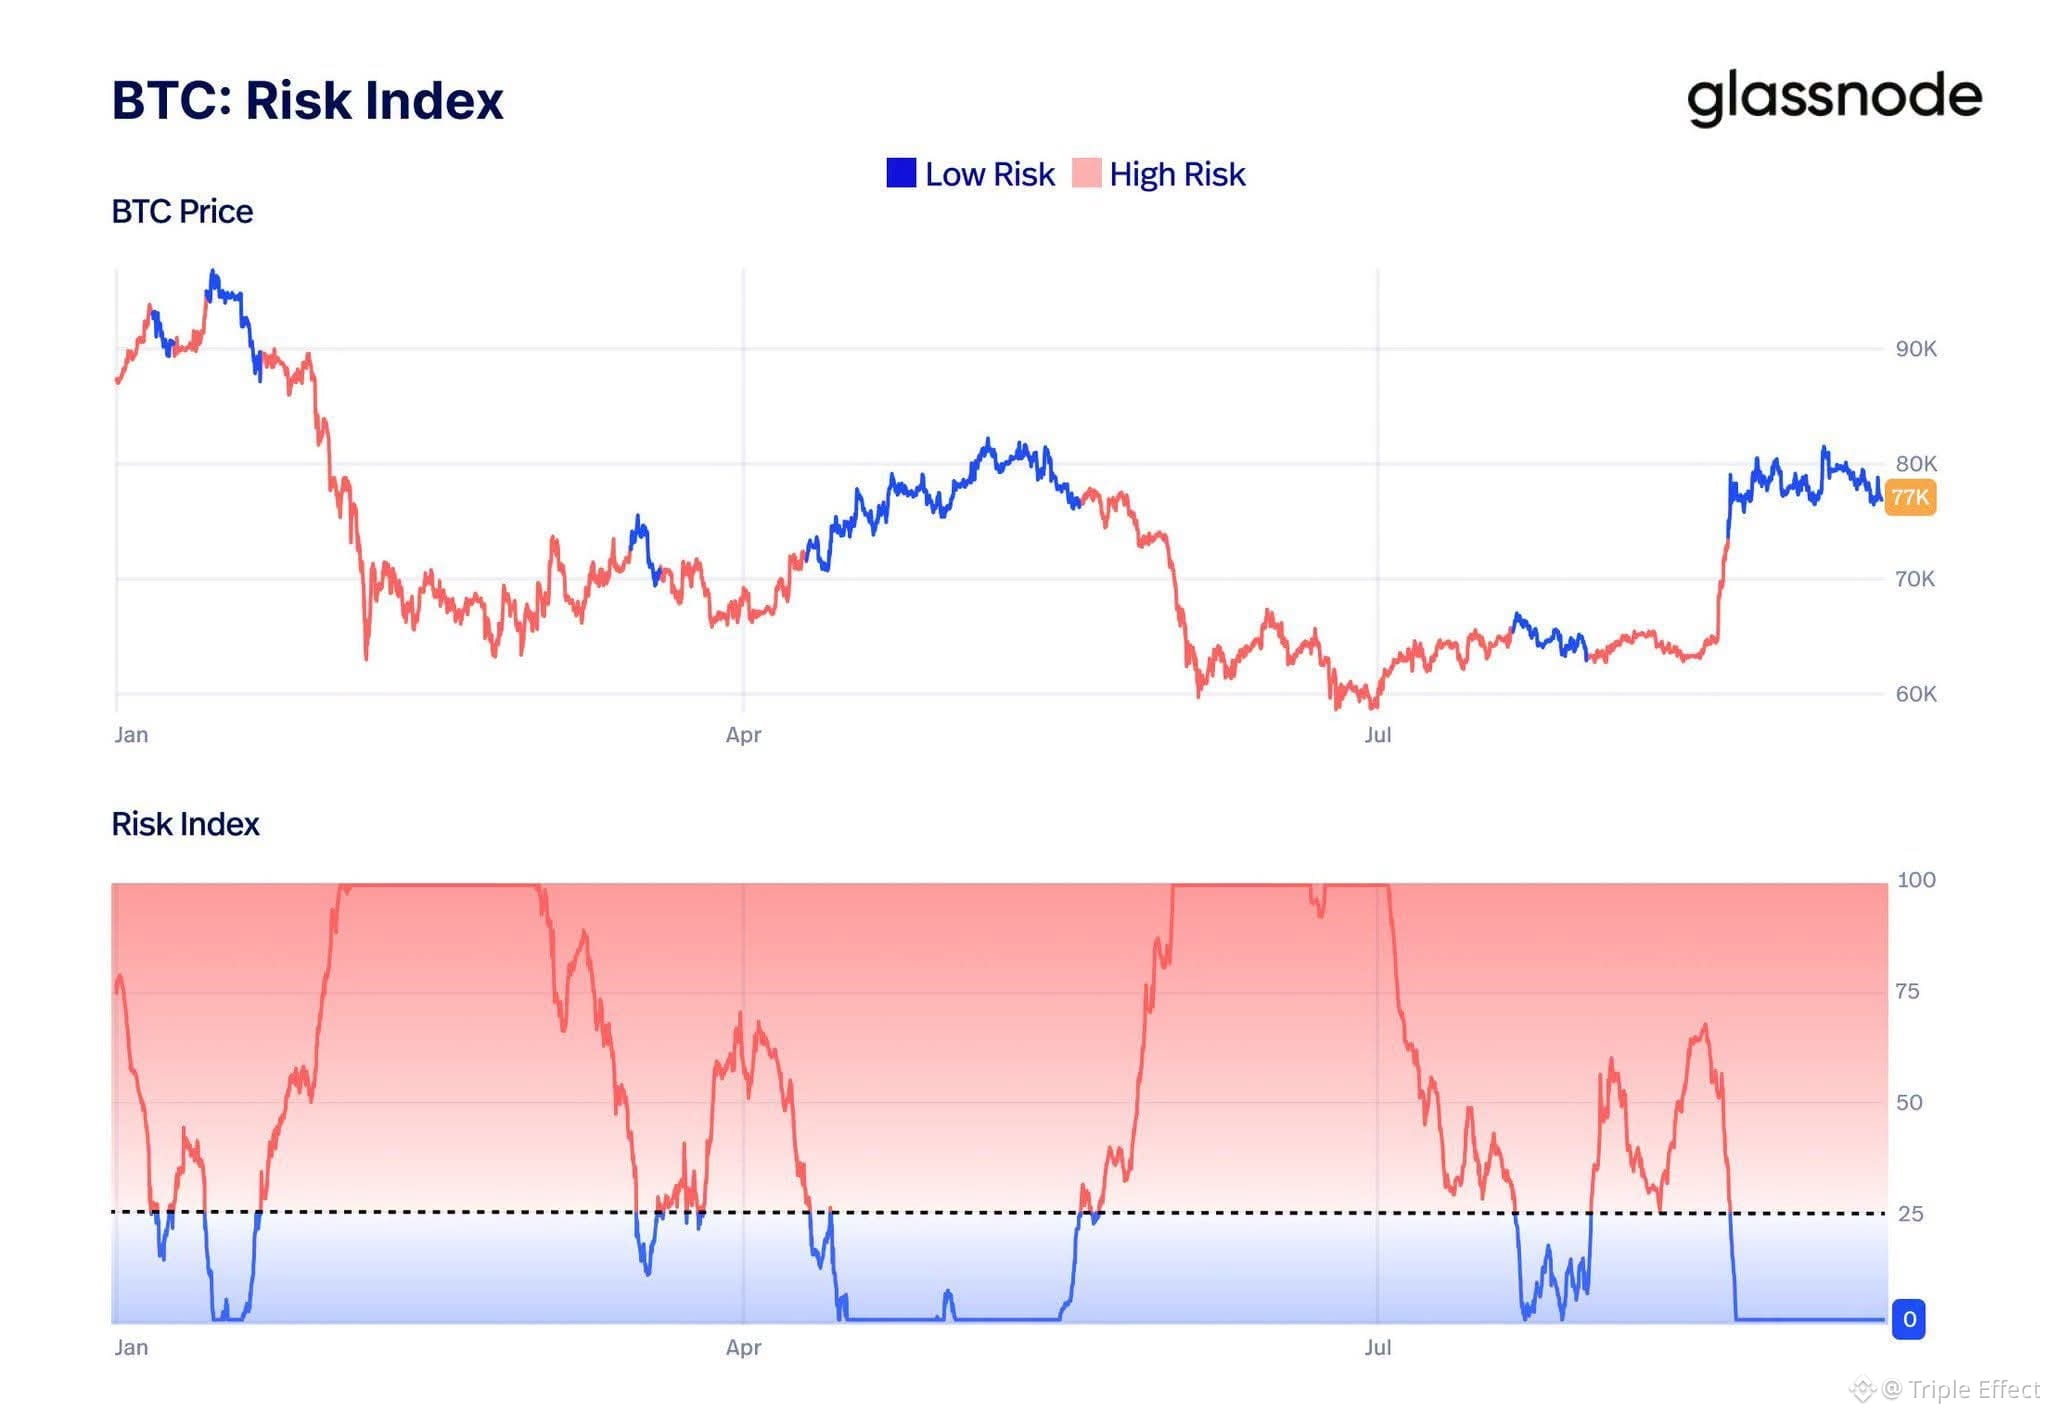
The crucial support level that held the USDT price steady for most of 2026 has begun to erode.
With the risk index returning to zero, conditions are ripe for further capital injections.
However, this pullback is only the first step.
Staying below this support level will confirm the shift towards a large-scale capital injection.
$AAPLB
#BTC
The crucial support level that held the USDT price steady for most of 2026 has begun to erode.
With the risk index returning to zero, conditions are ripe for further capital injections.
However, this pullback is only the first step.
Staying below this support level will confirm the shift towards a large-scale capital injection.
$AAPLB
#BTC
With the risk index returning to zero, conditions are ripe for further capital injections.
However, this pullback is only the first step.
Staying below this support level will confirm the shift towards a large-scale capital injection.
$AAPLB
#BTC
1
873
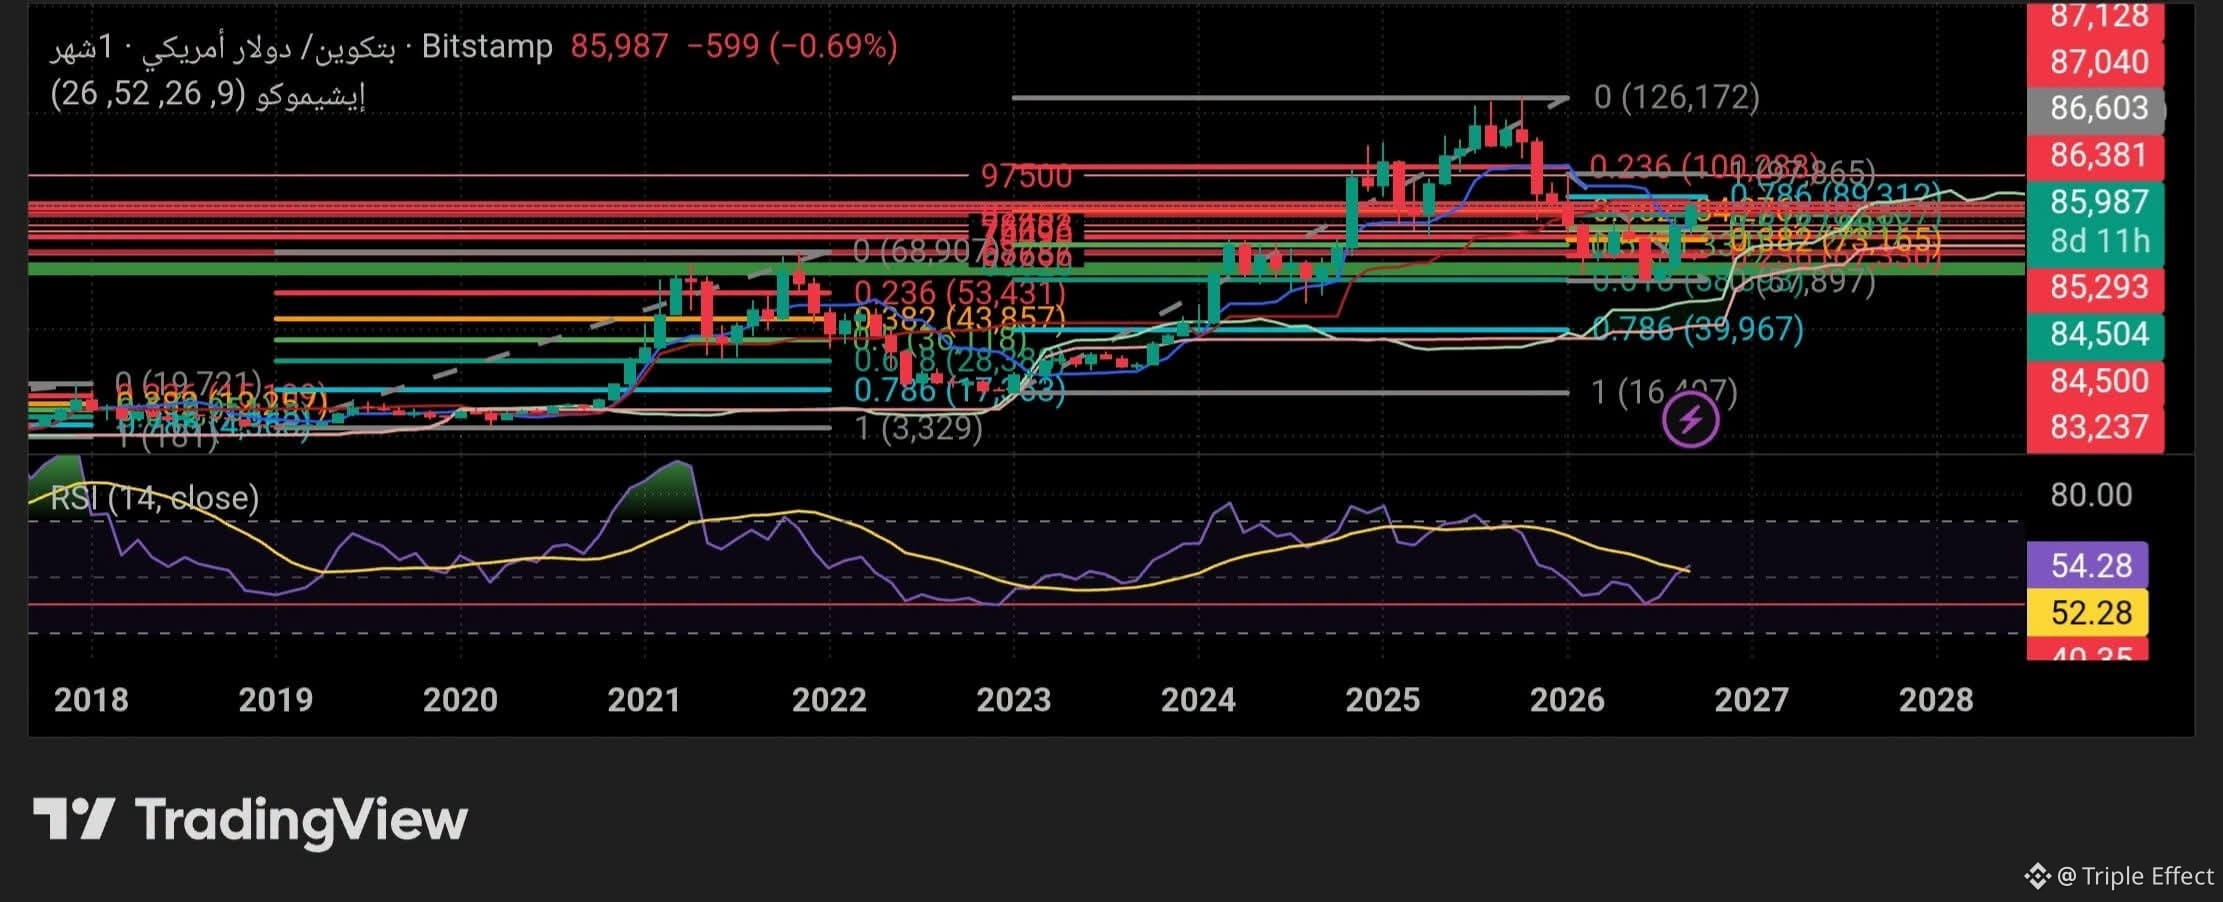
Bitcoin is currently trading at $85,992, which is higher than all previous highs:
• High: $53,000
• 155-day high: $72,000
• 2-year high: $86,000.
I believe a drop below $50,000 during this cycle is highly unlikely.
The hypothesis of a necessary retest of the high, as in every previous bearish cycle, has lost its last chance.
$NVDAB
#BTC
Bitcoin is currently trading at $85,992, which is higher than all previous highs:
• High: $53,000
• 155-day high: $72,000
• 2-year high: $86,000.
I believe a drop below $50,000 during this cycle is highly unlikely.
The hypothesis of a necessary retest of the high, as in every previous bearish cycle, has lost its last chance.
$NVDAB
#BTC
• High: $53,000
• 155-day high: $72,000
• 2-year high: $86,000.
I believe a drop below $50,000 during this cycle is highly unlikely.
The hypothesis of a necessary retest of the high, as in every previous bearish cycle, has lost its last chance.
$NVDAB
#BTC
700
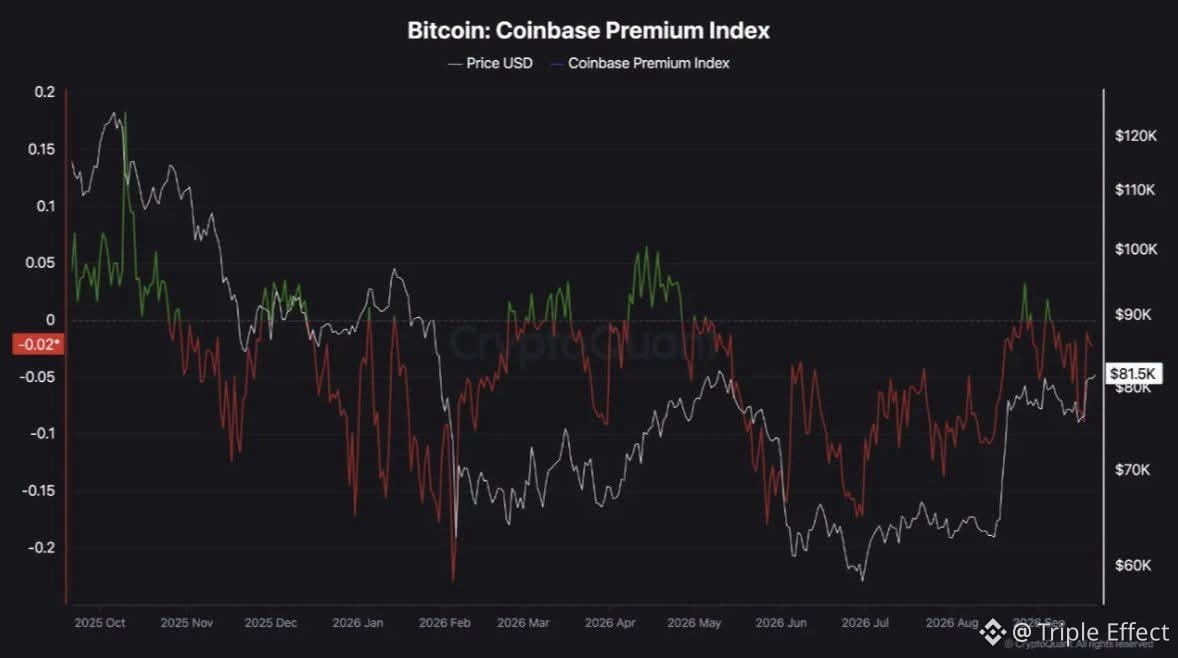
Bitcoin's price on Coinbase has fallen back into negative territory: spot demand in the US remains uncertain.
"But from a market structure perspective, a sustained return to positive territory would make Bitcoin's current rally more convincing.
$AAPL.US
#BTC
Bitcoin's price on Coinbase has fallen back into negative territory: spot demand in the US remains uncertain.
"But from a market structure perspective, a sustained return to positive territory would make Bitcoin's current rally more convincing.
$AAPL.US
#BTC
"But from a market structure perspective, a sustained return to positive territory would make Bitcoin's current rally more convincing.
$AAPL.US
#BTC
788
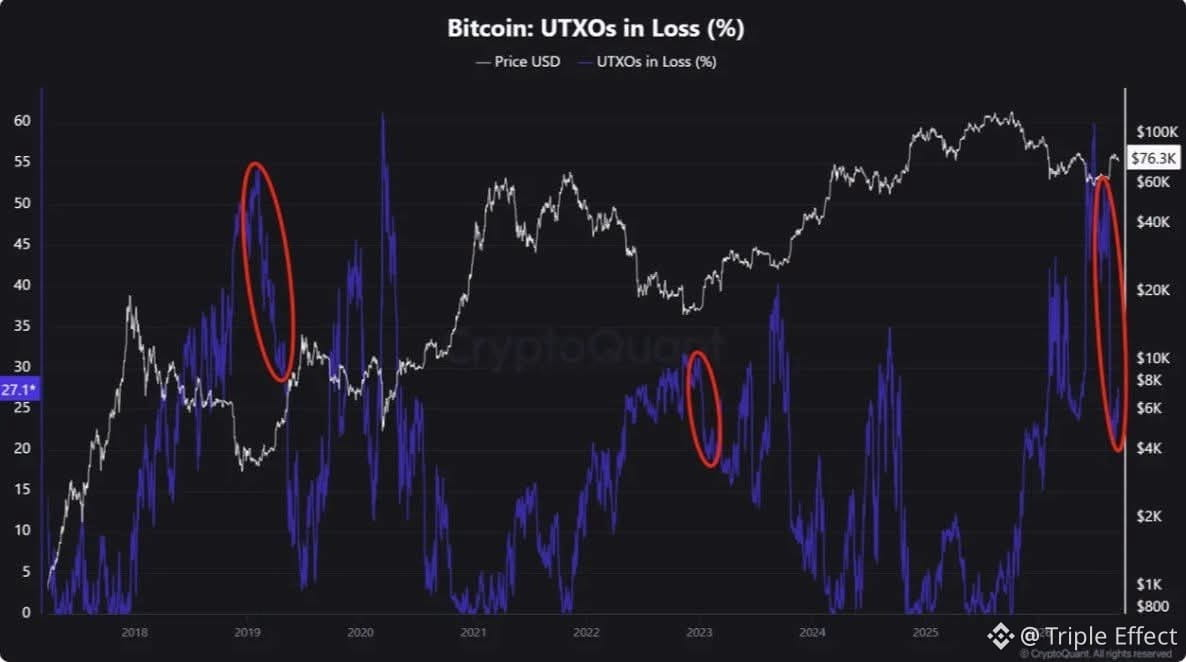
Based on the return of long-term investor liquidity, we are now at the beginning of an upward phase.
Bitcoin's liquidity structure shapes my view, so I deliberately avoid historical cycle patterns that have proven highly successful in predicting bottoms so far.
The liquidity structure indicates the start of an upward phase, with a high probability of reaching a bottom.
If I'm correct, the question remains: how long will the rise continue?
Therefore, I estimate the probability of reaching a bottom at 70%.
This is not financial advice, just thinking out loud.
#BTC
Based on the return of long-term investor liquidity, we are now at the beginning of an upward phase.
Bitcoin's liquidity structure shapes my view, so I deliberately avoid historical cycle patterns that have proven highly successful in predicting bottoms so far.
The liquidity structure indicates the start of an upward phase, with a high probability of reaching a bottom.
If I'm correct, the question remains: how long will the rise continue?
Therefore, I estimate the probability of reaching a bottom at 70%.
This is not financial advice, just thinking out loud.
#BTC
Bitcoin's liquidity structure shapes my view, so I deliberately avoid historical cycle patterns that have proven highly successful in predicting bottoms so far.
The liquidity structure indicates the start of an upward phase, with a high probability of reaching a bottom.
If I'm correct, the question remains: how long will the rise continue?
Therefore, I estimate the probability of reaching a bottom at 70%.
This is not financial advice, just thinking out loud.
#BTC
116
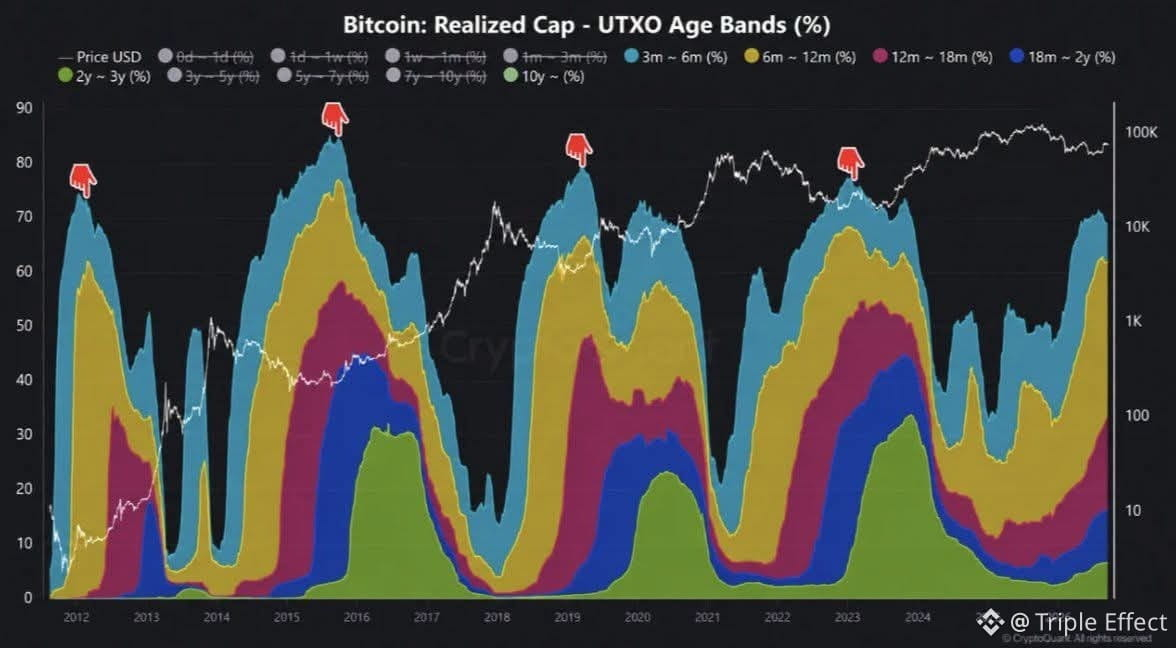
One pattern observed in cryptocurrency developments, based on Bitcoin's last three bottoms, shows that the price is still 38% below its all-time high, significantly higher than its 2022 low – indicating a mid-cycle base-building phase, not a bottom.
#BTC
One pattern observed in cryptocurrency developments, based on Bitcoin's last three bottoms, shows that the price is still 38% below its all-time high, significantly higher than its 2022 low – indicating a mid-cycle base-building phase, not a bottom.
#BTC
#BTC
156
Market Update:
$350 million in long positions were liquidated in the cryptocurrency market in just 20 minutes.
This followed news that the Clarity Act failed to secure the 60 votes needed to proceed in the US Senate.
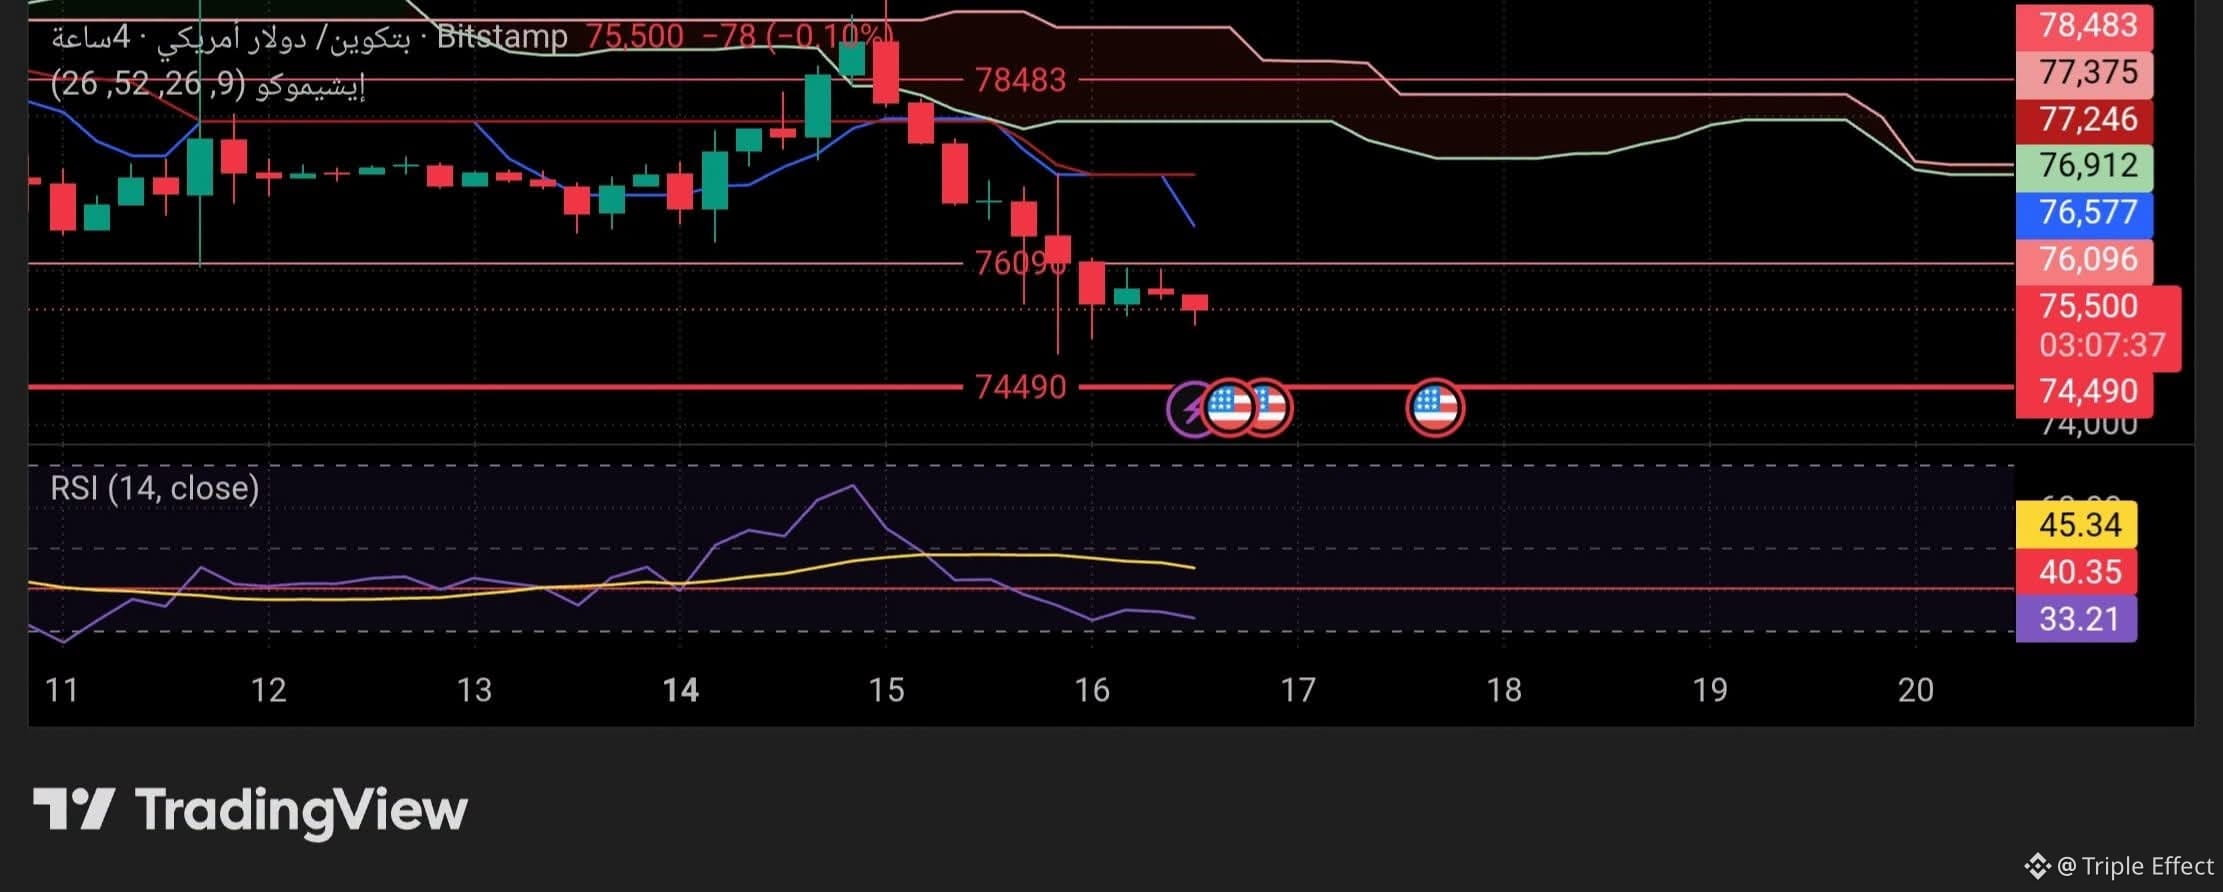
Today, we await the Federal Reserve's decision on raising interest rates.
Of course, we mustn't forget to consider the implications of this decision, the Fed Chair's tone, and the general trend of bond yields.
Indicators point to further declines.
Don't rush into trading or gamble.
Wait for confirmation and further developments before making any trades.
$GOOGL.US
#BTC
Market Update:
$350 million in long positions were liquidated in the cryptocurrency market in just 20 minutes.
This followed news that the Clarity Act failed to secure the 60 votes needed to proceed in the US Senate.
Today, we await the Federal Reserve's decision on raising interest rates.
Of course, we mustn't forget to consider the implications of this decision, the Fed Chair's tone, and the general trend of bond yields.
Indicators point to further declines.
Don't rush into trading or gamble.
Wait for confirmation and further developments before making any trades.
$GOOGL.US
#BTC
$350 million in long positions were liquidated in the cryptocurrency market in just 20 minutes.
This followed news that the Clarity Act failed to secure the 60 votes needed to proceed in the US Senate.
Today, we await the Federal Reserve's decision on raising interest rates.
Of course, we mustn't forget to consider the implications of this decision, the Fed Chair's tone, and the general trend of bond yields.
Indicators point to further declines.
Don't rush into trading or gamble.
Wait for confirmation and further developments before making any trades.
$GOOGL.US
#BTC
762
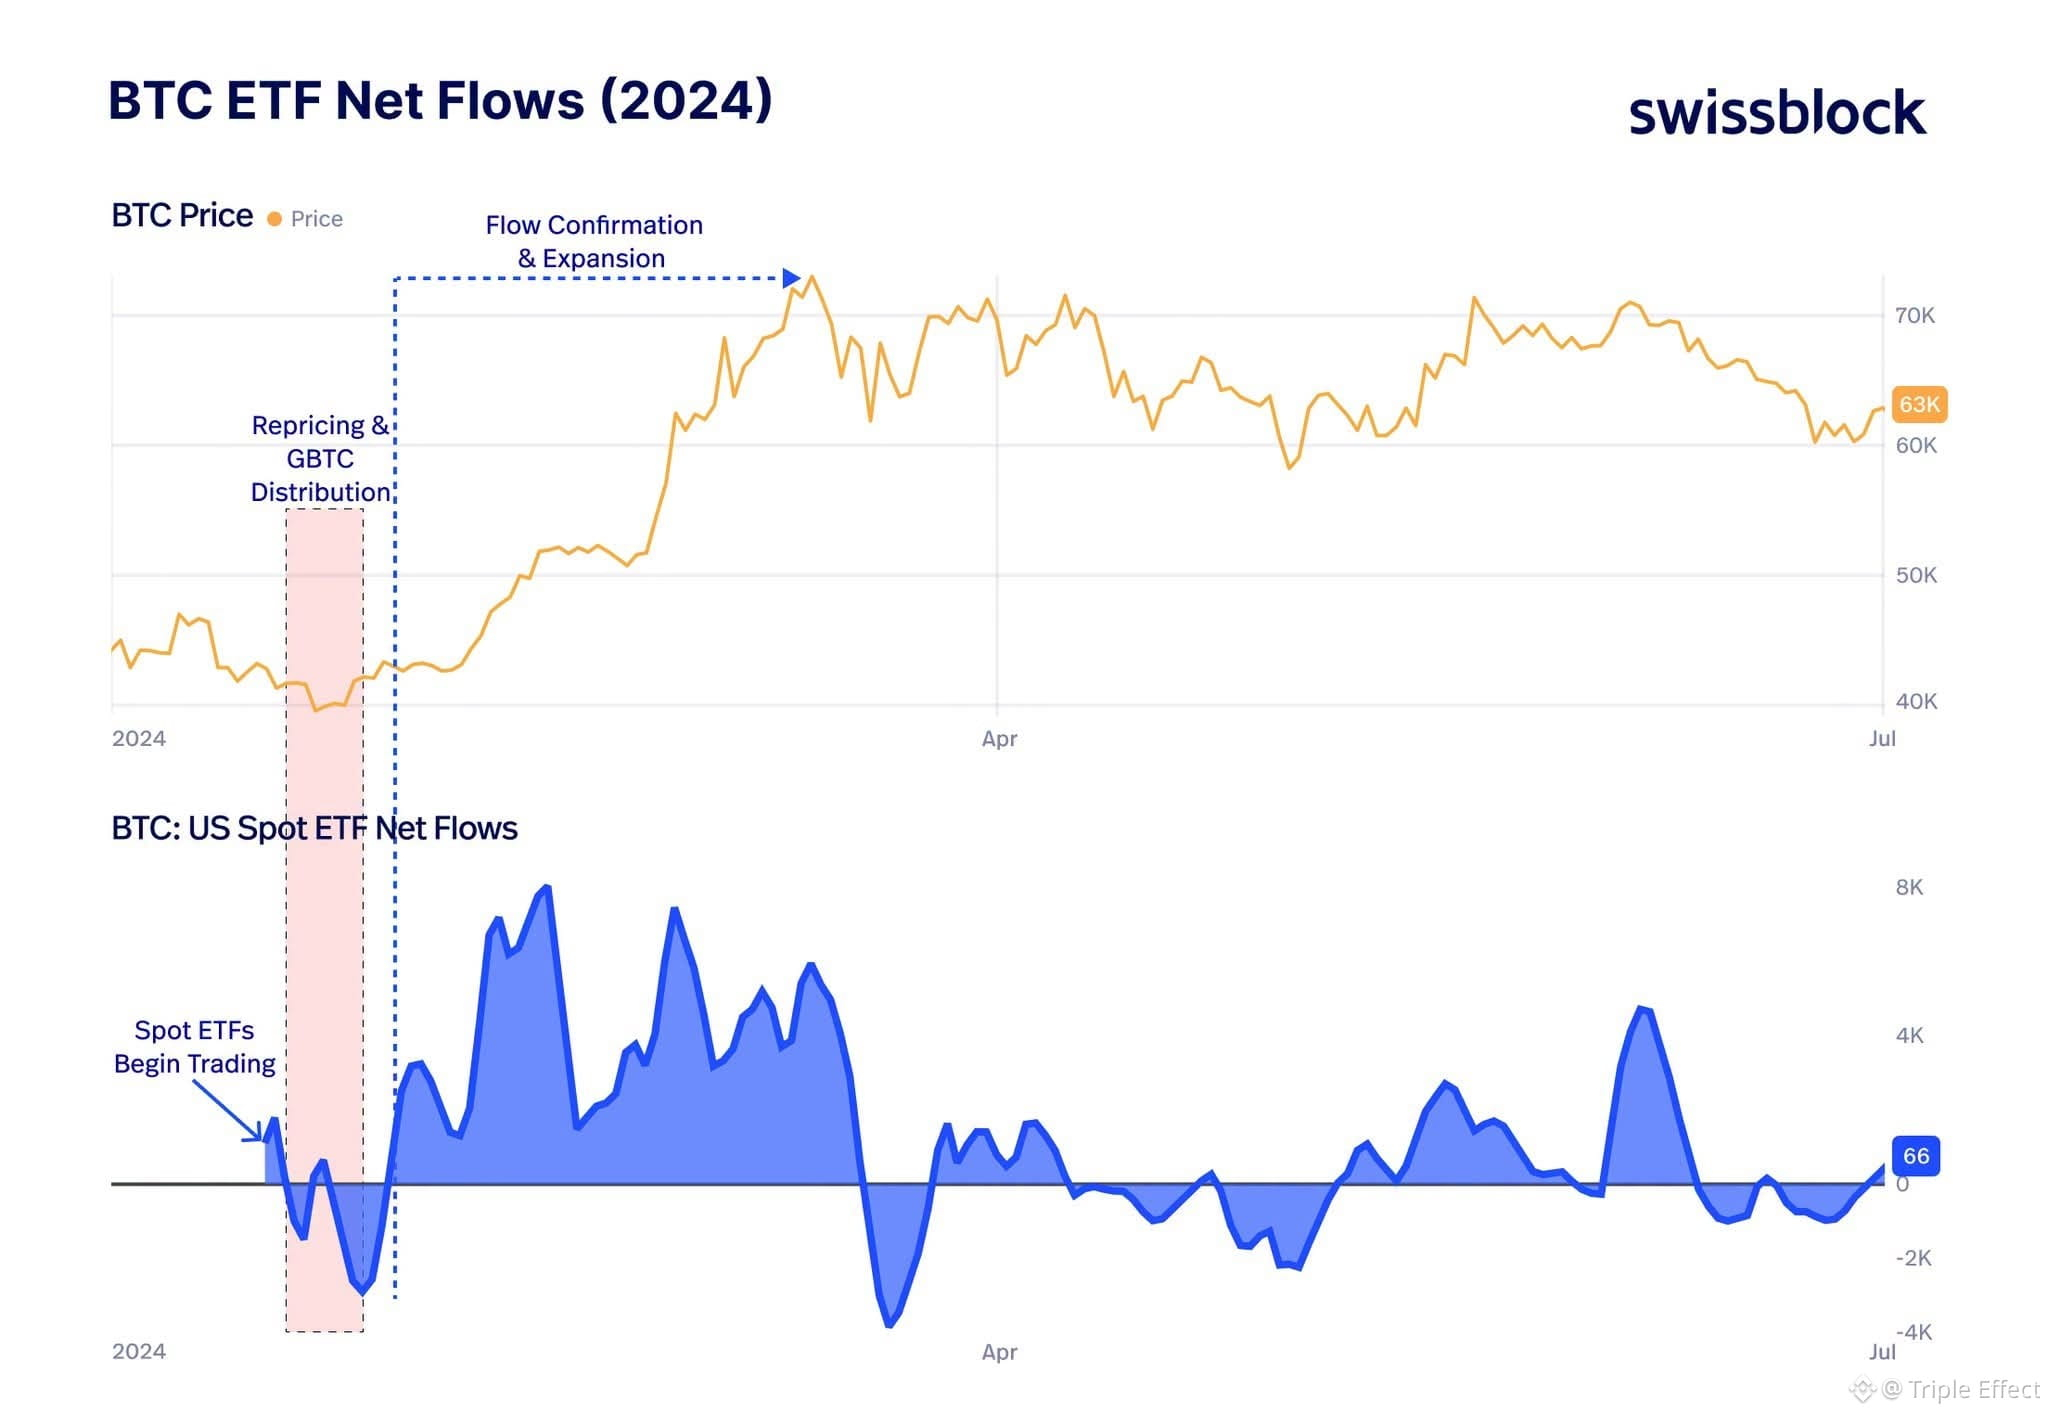
Could the progress made on the CLARITY Act present an opportunity to sell Bitcoin?
The bill is still pending a procedural vote in the Senate and is not yet law.
For example, the launch of the exchange-traded fund (ETF) began with a repricing and distribution of GBTC, not an immediate expansion.
The surge came after consistently positive inflows. This factor paves the way, but strong and sustained demand will determine the next steps.
$BTC
#BTC
Could the progress made on the CLARITY Act present an opportunity to sell Bitcoin?
The bill is still pending a procedural vote in the Senate and is not yet law.
For example, the launch of the exchange-traded fund (ETF) began with a repricing and distribution of GBTC, not an immediate expansion.
The surge came after consistently positive inflows. This factor paves the way, but strong and sustained demand will determine the next steps.
$BTC
#BTC
The bill is still pending a procedural vote in the Senate and is not yet law.
For example, the launch of the exchange-traded fund (ETF) began with a repricing and distribution of GBTC, not an immediate expansion.
The surge came after consistently positive inflows. This factor paves the way, but strong and sustained demand will determine the next steps.
$BTC
#BTC
597
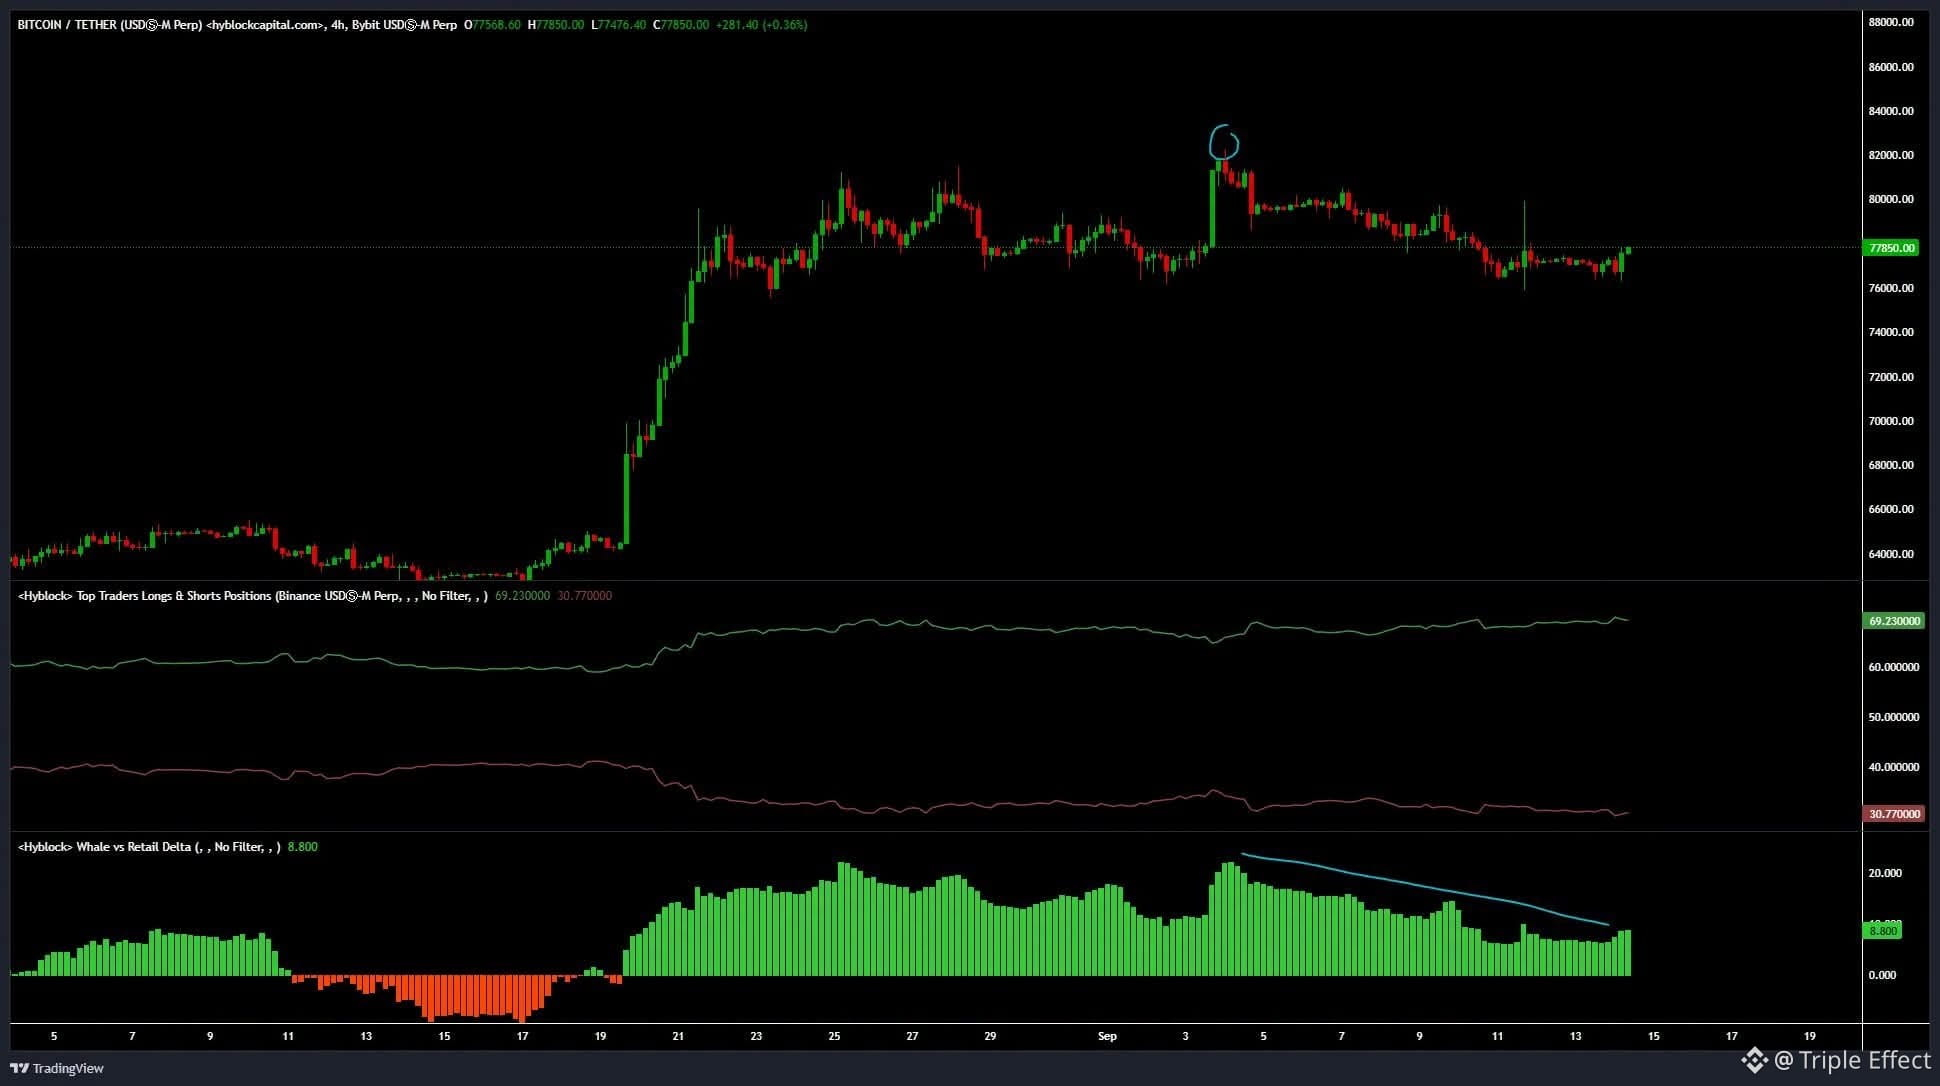
Data on retail buy/sell positions for the Bitcoin/USD pair shows that after the price peaked at $82,000, the percentage of whales dropped from 22% to 8.8%.
During this period, retail buy positions continued to dominate the market at 69.3%, showing little change despite the decrease in whales.
A further decline and a complete sell-off are needed.
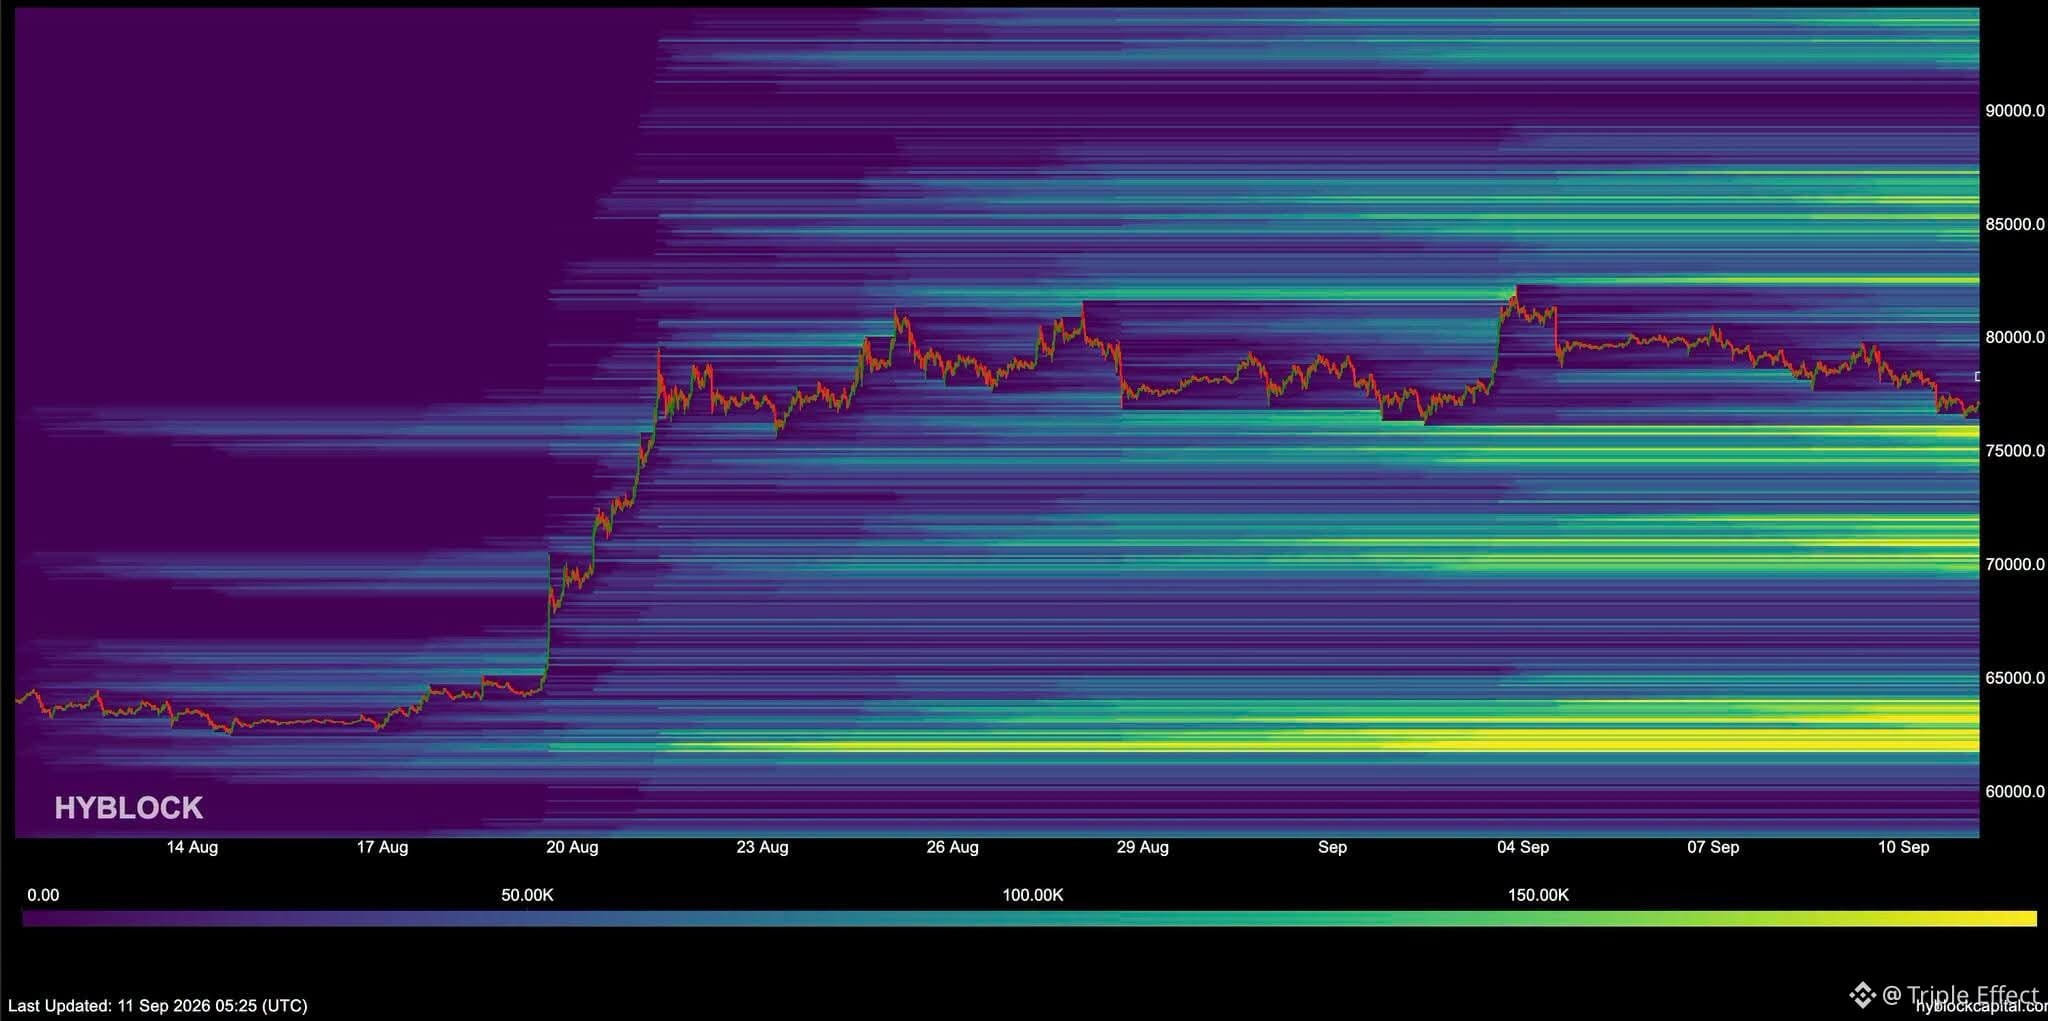
The $75,000 area is prominent on the Bitcoin liquidity map.
Liquidity remains strong in the lower zones, and I am closely monitoring how the price reacts around these levels.
$BTC
#BTC
Data on retail buy/sell positions for the Bitcoin/USD pair shows that after the price peaked at $82,000, the percentage of whales dropped from 22% to 8.8%.
During this period, retail buy positions continued to dominate the market at 69.3%, showing little change despite the decrease in whales.
A further decline and a complete sell-off are needed.
The $75,000 area is prominent on the Bitcoin liquidity map.
Liquidity remains strong in the lower zones, and I am closely monitoring how the price reacts around these levels.
$BTC
#BTC
During this period, retail buy positions continued to dominate the market at 69.3%, showing little change despite the decrease in whales.
A further decline and a complete sell-off are needed.
The $75,000 area is prominent on the Bitcoin liquidity map.
Liquidity remains strong in the lower zones, and I am closely monitoring how the price reacts around these levels.
$BTC
#BTC
708
Bitcoin's price volatility has returned, gradually falling below its highs.
However, Bitcoin is absorbing selling pressure without any structural disruptions so far.
The upward momentum has subsided.
A continued rise in the risk index would be the clearest indication that the price structure is beginning to become more volatile.
$NVDA.US
#BTC
Bitcoin's price volatility has returned, gradually falling below its highs.
However, Bitcoin is absorbing selling pressure without any structural disruptions so far.
The upward momentum has subsided.
A continued rise in the risk index would be the clearest indication that the price structure is beginning to become more volatile.
$NVDA.US
#BTC
However, Bitcoin is absorbing selling pressure without any structural disruptions so far.
The upward momentum has subsided.
A continued rise in the risk index would be the clearest indication that the price structure is beginning to become more volatile.
$NVDA.US
#BTC
1k
Log in to explore more content
Join global crypto users on Binance Square
⚡️ Get latest and useful information about crypto.
💬 Trusted by the world’s largest crypto exchange.
👍 Discover real insights from verified creators.
Email / Phone number
Trending Topics
FedMinutesFocusOnOctoberPause
140,465 views
1,218 Discussing
🚨 HIGH ALERT ‼️ PLEASE DON’T TRADE BLINDLY FOR THE NEXT HOUR 🚨
Guys, we have FOMC Minutes coming in less than 1 hour.
And after the kind of volatility we already saw today, I really don’t want anyone opening random high-leverage positions just before this release.
The biggest reaction I’m watching will be in Gold (XAU), Silver (XAG), BTC and ETH. Then coins like SOL and other highly leveraged mid/low-cap alts can exaggerate whatever move BTC makes.
Gold and Silver are especially sensitive tonight because the market is already reacting to the US dollar + Treasury yields, and both metals have been under heavy pressure ahead of the Fed minutes.
Briefly speaking
📉Hawkish Fed Minutes → Dollar/yields can push higher → pressure on BTC, crypto, Gold & silver
📈Dovish Fed Minutes → Dollar/yields can cool → BTC, Gold, Silver and risk assets can bounce hard.
And please remember the first candle can be a trap. We can get a pump, immediate dump, liquidations on both sides, and then the real direction.
So for now, protect your positions, reduce unnecessary leverage and don’t FOMO into the first move.
Tonight I’m watching $XAU , $XAG and $BTC first. These will tell us very quickly how the market is reading the Fed.
I will Update you guys on time
Follow @Panda Traders and Turn on Your notifications right now
#FedMinutesFocusOnOctoberPause
Panda Traders
·18 Likes
·3.6k views
BinanceLaunchesBinanceIntelligence
1.1M views
6,419 Discussing
EvernorthDelaysNasdaqDebutToOct12
10,622 views
270 Discussing