
Muhammad AB Ali
108 Posts

Muhammad AB Ali
Report
Block User
Founder @Solutionperk | Whitepaper Writer | Business Development | Market Analyst | Craft Business and Marketing Documents
Frequent Trader
5 Years
10 Following
98 Followers
235 Liked
Posts
·
--
Bullish
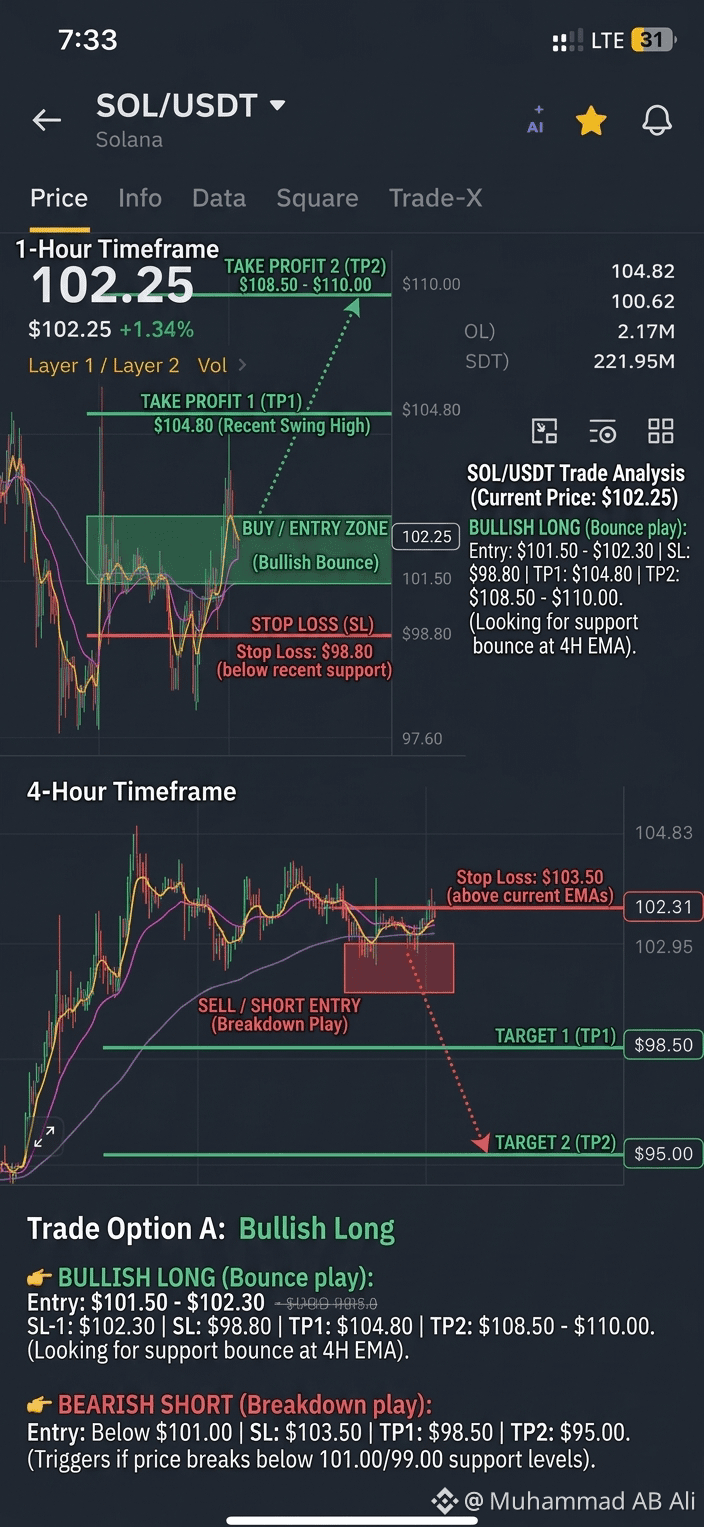
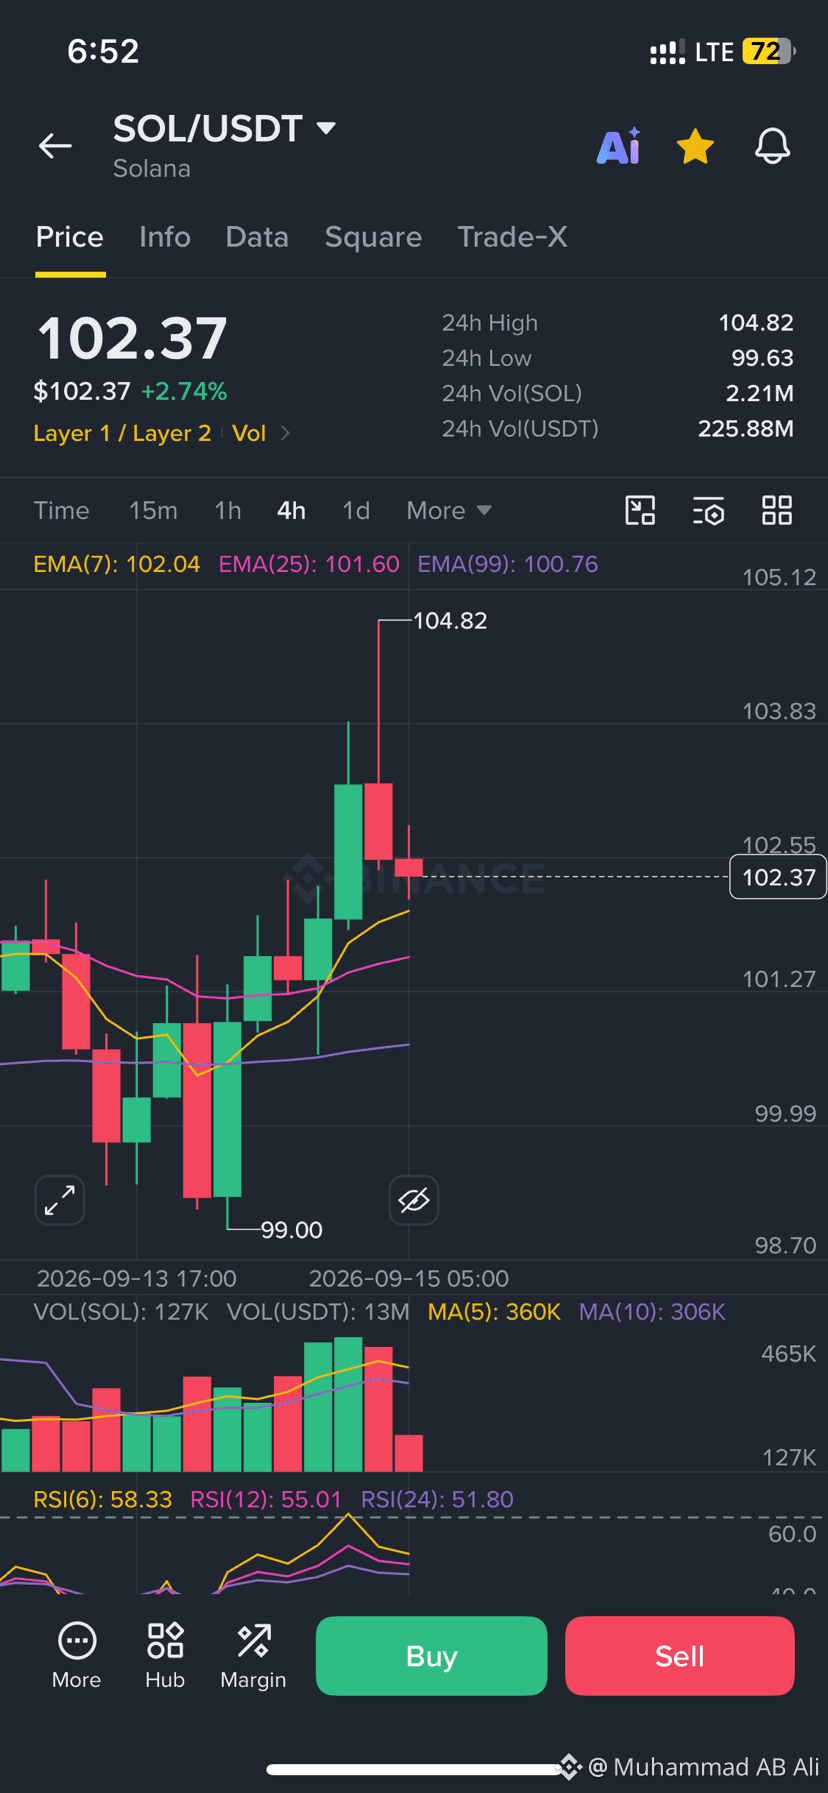
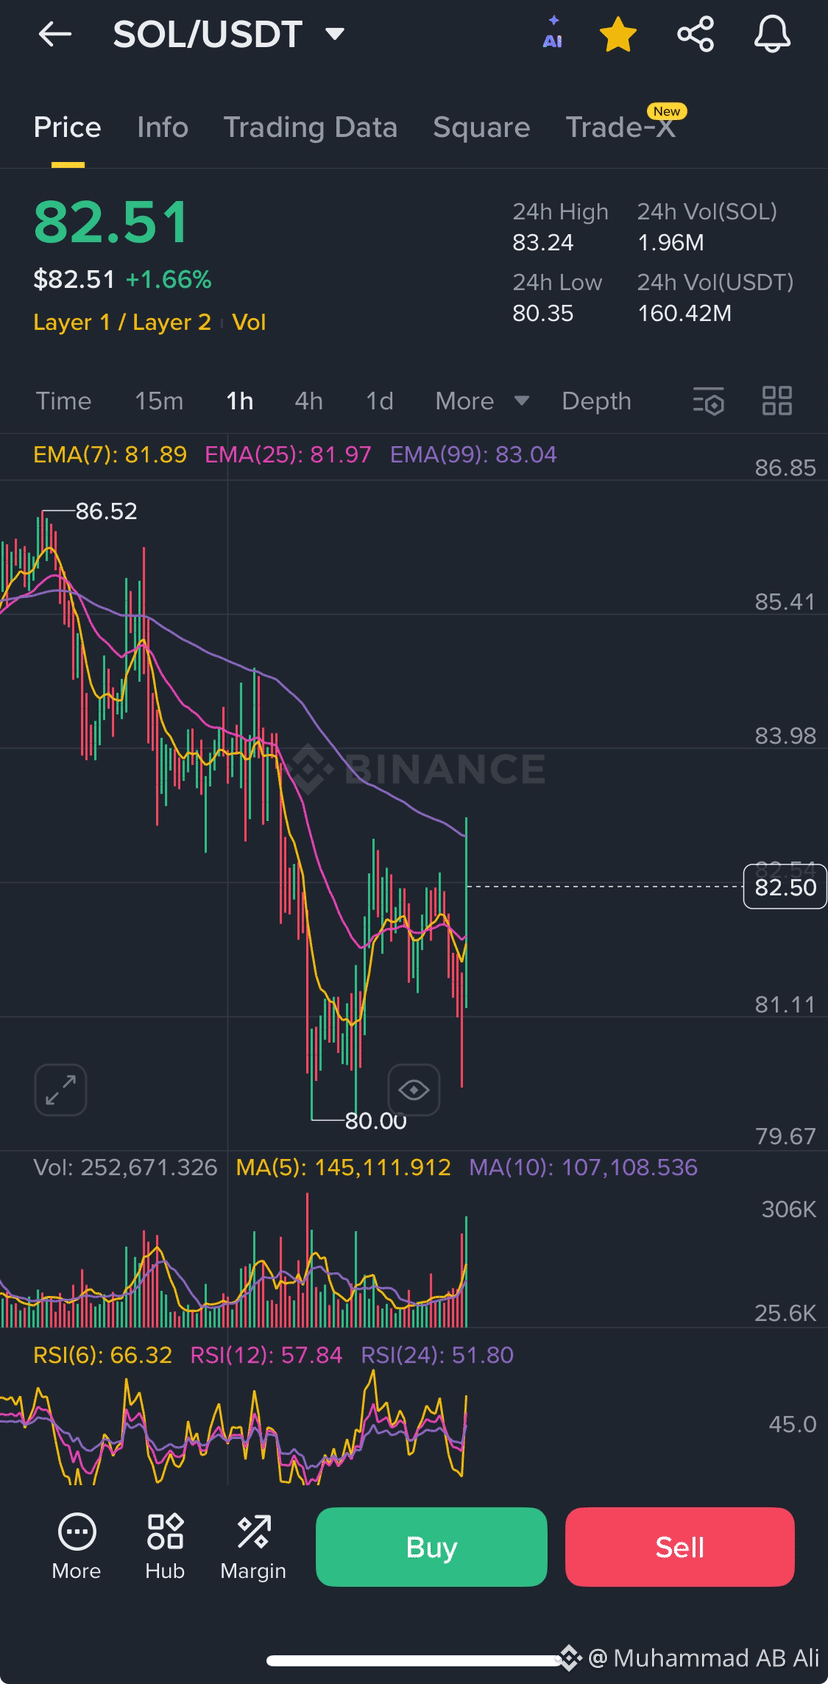
$SOL wanna play some other game
Keep your eye on
Market will skyrocket soon
$SOL wanna play some other game
Keep your eye on
Market will skyrocket soon
Keep your eye on
Market will skyrocket soon
56
·
--
Bullish
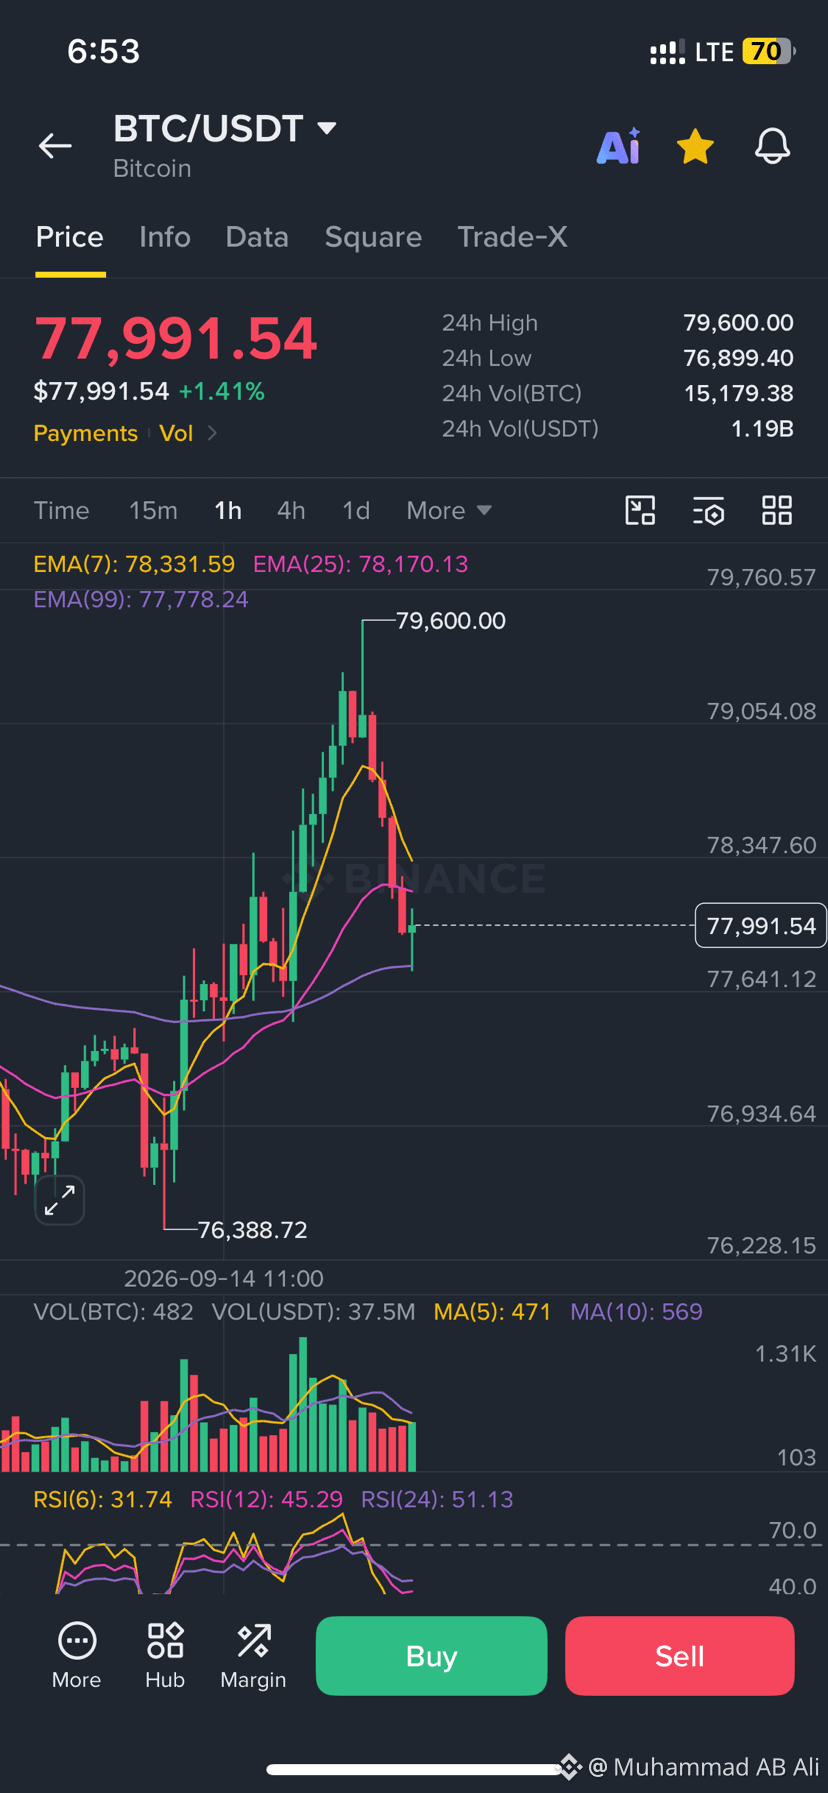
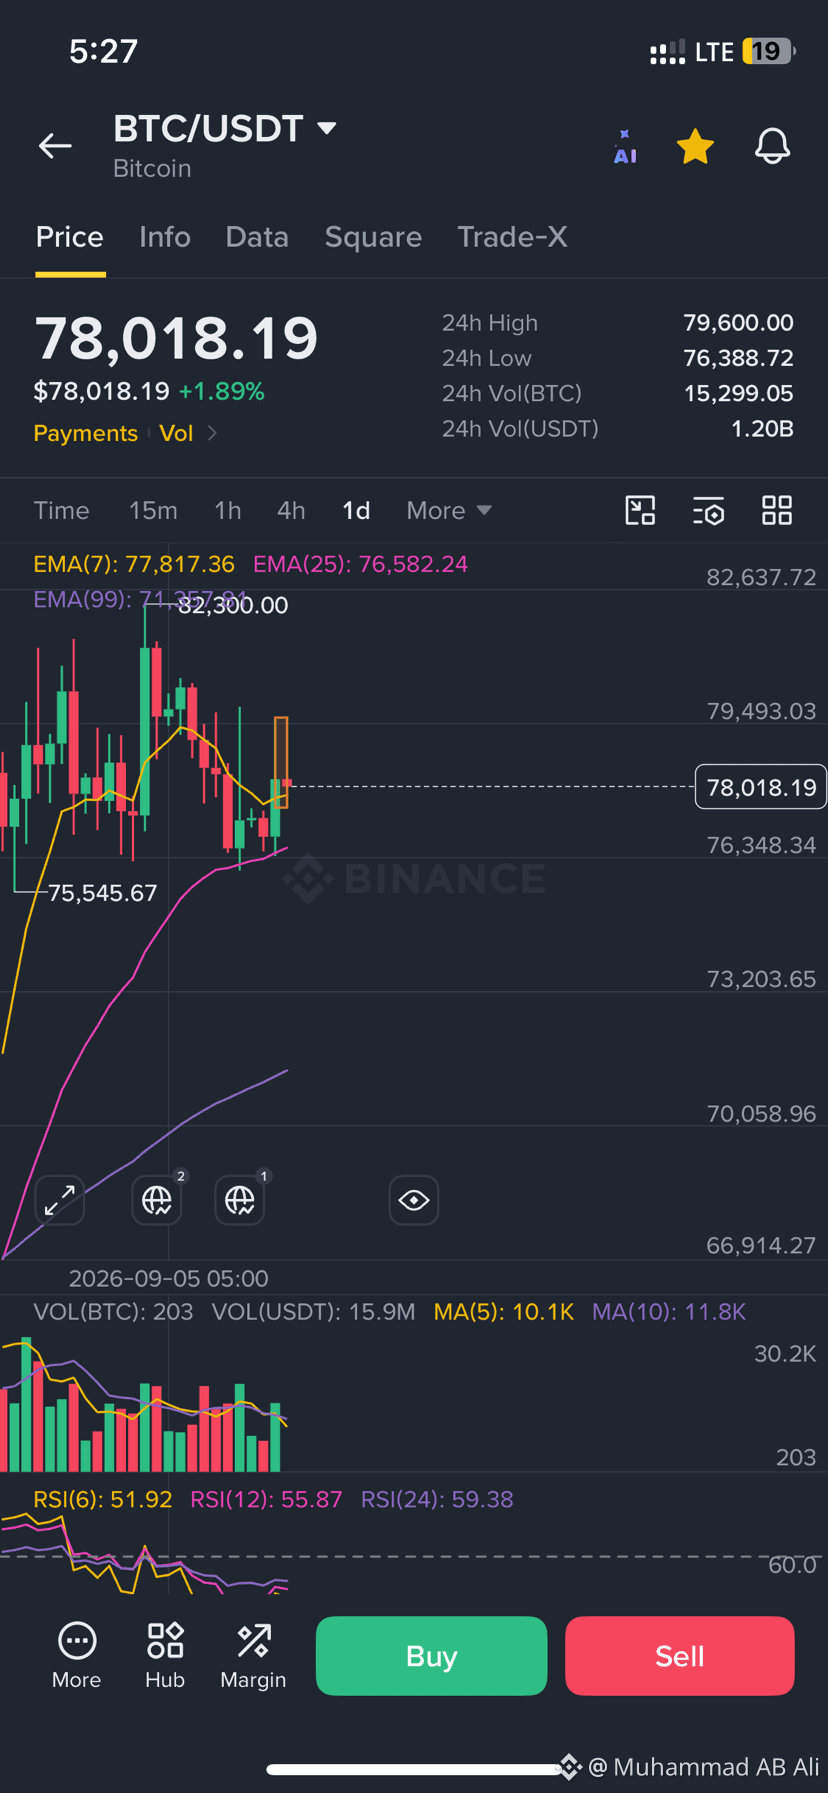
If $BTC survive above 79k
You all will see massive bullish run
Keep your eyes on and don’t miss this oportunity.
Thanks me later
If $BTC survive above 79k
You all will see massive bullish run
Keep your eyes on and don’t miss this oportunity.
Thanks me later
You all will see massive bullish run
Keep your eyes on and don’t miss this oportunity.
Thanks me later
155
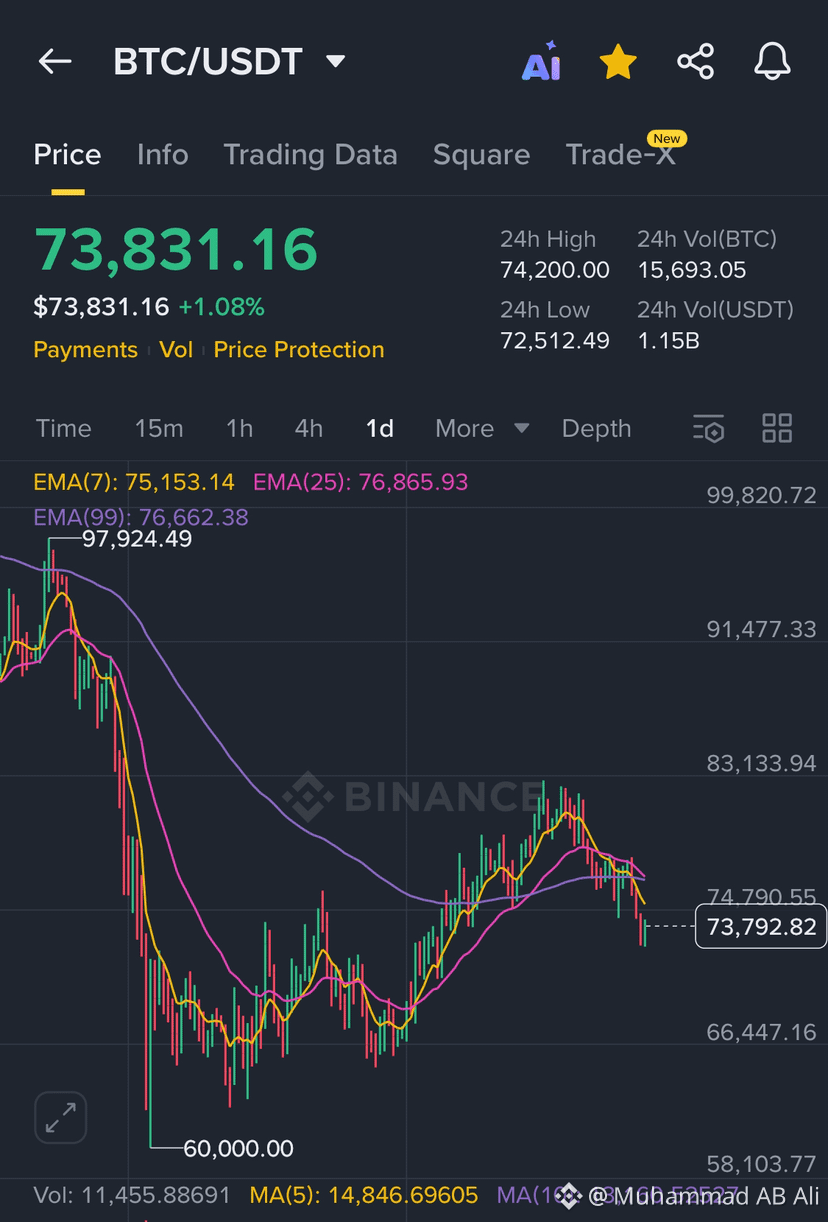
It’s not a time for $BTC to bounce back
It is felexible to go down and got support at 69k to bounce back bullish
Stay tunned for more
It’s not a time for $BTC to bounce back
It is felexible to go down and got support at 69k to bounce back bullish
Stay tunned for more
It is felexible to go down and got support at 69k to bounce back bullish
Stay tunned for more
74
100
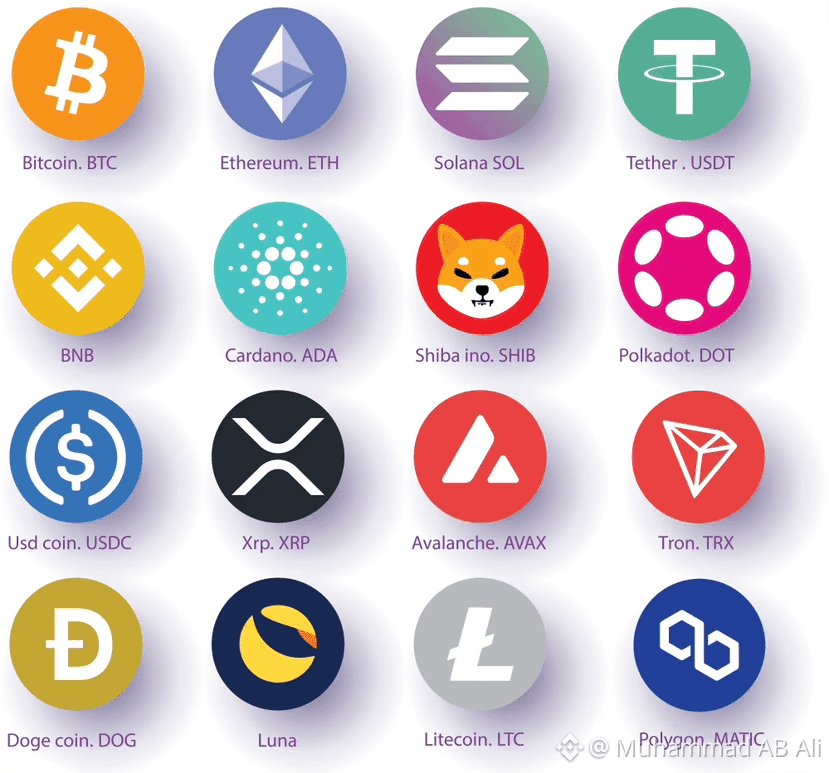
If you had $30,000, which coin would you put it all in?
Asking for a friend
$SOL $ASTER $SUI
$TRX $BNB $LINK
$HYPE $TON $AVAX $BTC
#TrumpSeeksQuickEndToIranWar
#CLARITYActHitAnotherRoadblock
#OilPricesDrop
#TrumpSaysIranWarHasBeenWon
#Write2Earn
If you had $30,000, which coin would you put it all in?
Asking for a friend
$SOL $ASTER $SUI
$TRX $BNB $LINK
$HYPE $TON $AVAX $BTC
#TrumpSeeksQuickEndToIranWar
#CLARITYActHitAnotherRoadblock
#OilPricesDrop
#TrumpSaysIranWarHasBeenWon
#Write2Earn
Asking for a friend
$SOL $ASTER $SUI
$TRX $BNB $LINK
$HYPE $TON $AVAX $BTC
#TrumpSeeksQuickEndToIranWar
#CLARITYActHitAnotherRoadblock
#OilPricesDrop
#TrumpSaysIranWarHasBeenWon
#Write2Earn
1
1
39
🚨 Solana Alert 🚨
Avoid "catching the falling knife" until you see a green 4-hour candle close above $89.00.
$SOL #TechnicalAnalysis
{future}(SOLUSDT)
🚨 Solana Alert 🚨
Avoid "catching the falling knife" until you see a green 4-hour candle close above $89.00.
$SOL #TechnicalAnalysis
Avoid "catching the falling knife" until you see a green 4-hour candle close above $89.00.
$SOL #TechnicalAnalysis
1
93
If you are trading SOL today, the move to watch is the $85.00 break.
If SOL can’t reclaim $88.50 (the EMA 7) by the daily close, it will likely follow Bitcoin's lead during today’s massive options expiry and potentially retest the $80.00 - $82.00 zone
$BTC $SOL #sol
{future}(SOLUSDT)
{future}(BTCUSDT)
If you are trading SOL today, the move to watch is the $85.00 break.
If SOL can’t reclaim $88.50 (the EMA 7) by the daily close, it will likely follow Bitcoin's lead during today’s massive options expiry and potentially retest the $80.00 - $82.00 zone
$BTC $SOL #sol
If SOL can’t reclaim $88.50 (the EMA 7) by the daily close, it will likely follow Bitcoin's lead during today’s massive options expiry and potentially retest the $80.00 - $82.00 zone
$BTC $SOL #sol
1
44
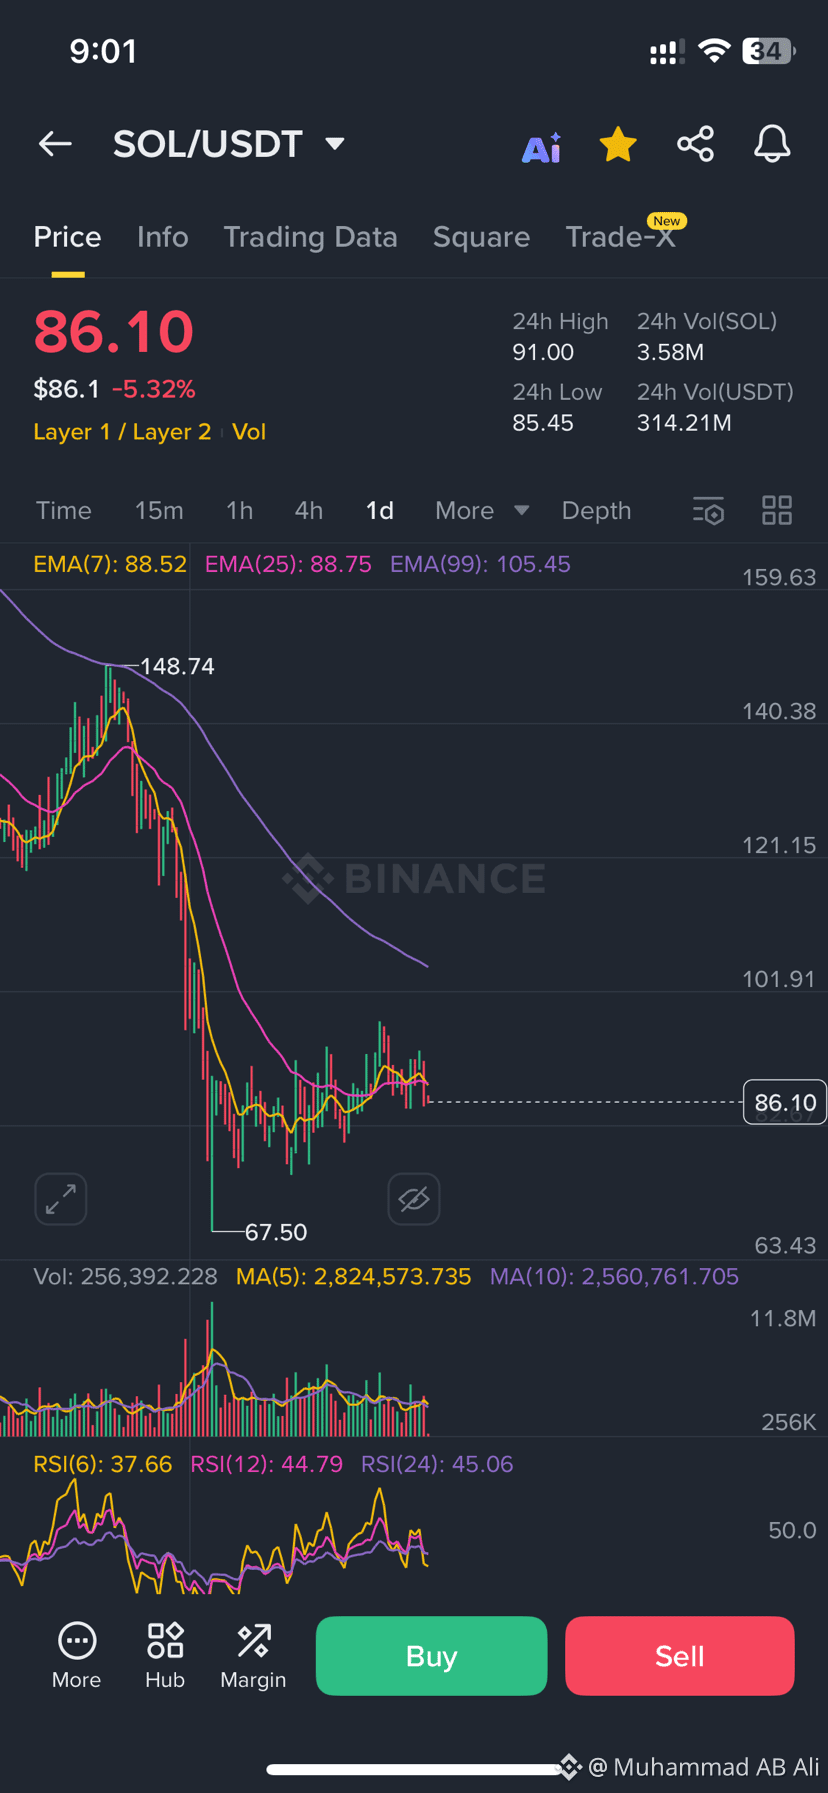
$SOL today’s breakdown
• Current Price: $86.10, showing a -5.32% drop over the last 24 hours.
• Support & Resistance: SOL is struggling to hold the $85.00 level. If it breaks decisively below the daily low of $85.45, the next major safety net is down at $82.45 or even the February wick at $67.50.
• Moving Averages: The price is trading below all major EMAs—EMA(7) at $88.52, EMA(25) at $88.75, and EMA(99) at $105.45. This confirms a short-to-medium-term bearish trend.
• RSI(6): At 37.66, the RSI is approaching "oversold" territory. While this suggests the selling pressure might cool off soon, it doesn’t yet show a strong reversal signal.
#sol
{future}(SOLUSDT)
$SOL today’s breakdown
• Current Price: $86.10, showing a -5.32% drop over the last 24 hours.
• Support & Resistance: SOL is struggling to hold the $85.00 level. If it breaks decisively below the daily low of $85.45, the next major safety net is down at $82.45 or even the February wick at $67.50.
• Moving Averages: The price is trading below all major EMAs—EMA(7) at $88.52, EMA(25) at $88.75, and EMA(99) at $105.45. This confirms a short-to-medium-term bearish trend.
• RSI(6): At 37.66, the RSI is approaching "oversold" territory. While this suggests the selling pressure might cool off soon, it doesn’t yet show a strong reversal signal.
#sol
• Current Price: $86.10, showing a -5.32% drop over the last 24 hours.
• Support & Resistance: SOL is struggling to hold the $85.00 level. If it breaks decisively below the daily low of $85.45, the next major safety net is down at $82.45 or even the February wick at $67.50.
• Moving Averages: The price is trading below all major EMAs—EMA(7) at $88.52, EMA(25) at $88.75, and EMA(99) at $105.45. This confirms a short-to-medium-term bearish trend.
• RSI(6): At 37.66, the RSI is approaching "oversold" territory. While this suggests the selling pressure might cool off soon, it doesn’t yet show a strong reversal signal.
#sol
1
94
If BTC closes a 4-hour candle below $68,122 (yesterday's low), the "Gamma Flip" from the options expiry could accelerate a drop toward the $62,500 support zone.
$BTC #btc
{future}(BTCUSDT)
If BTC closes a 4-hour candle below $68,122 (yesterday's low), the "Gamma Flip" from the options expiry could accelerate a drop toward the $62,500 support zone.
$BTC #btc
$BTC #btc
1
56
$BTC Daily Update: Searching for a Bottom 🔍
Bitcoin continues its downward slide today, currently at $68,896.
• 24h High: $70,921
• 24h Low: $68,153
• Key Indicator: The price is being suppressed by the 7-day and 25-day EMAs. We need a daily close above $70.2k to flip the short-term momentum.
Is this the ultimate "Buy the Dip" zone, or are we heading back to $60k? Let's see how the weekly close handles this pressure. 🍿
#BTC #CryptoMarket
$ETH $SOL
{future}(SOLUSDT)
{future}(ETHUSDT)
{future}(BTCUSDT)
$BTC Daily Update: Searching for a Bottom 🔍
Bitcoin continues its downward slide today, currently at $68,896.
• 24h High: $70,921
• 24h Low: $68,153
• Key Indicator: The price is being suppressed by the 7-day and 25-day EMAs. We need a daily close above $70.2k to flip the short-term momentum.
Is this the ultimate "Buy the Dip" zone, or are we heading back to $60k? Let's see how the weekly close handles this pressure. 🍿
#BTC #CryptoMarket
$ETH $SOL
Bitcoin continues its downward slide today, currently at $68,896.
• 24h High: $70,921
• 24h Low: $68,153
• Key Indicator: The price is being suppressed by the 7-day and 25-day EMAs. We need a daily close above $70.2k to flip the short-term momentum.
Is this the ultimate "Buy the Dip" zone, or are we heading back to $60k? Let's see how the weekly close handles this pressure. 🍿
#BTC #CryptoMarket
$ETH $SOL
1
49
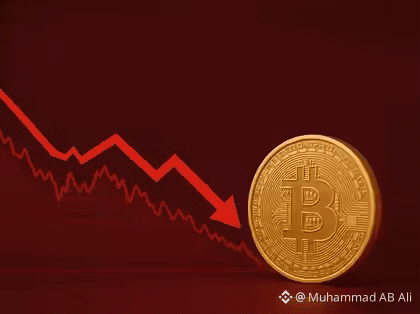
Bitcoin's Brutal Correction: Is the Top In? 📉
The daily chart is painting a sobering picture for $BTC Since hitting the nearly $98k high, Bitcoin has shed over $29,000 in value, currently stabilizing around $68,896.
The Scenario:
1. Bearish Pressure: The EMA(99) is way up at $77,534, showing just how far we've fallen from the long-term trend line.
2. Volatility: 24h volume is at a massive $1.49B, indicating that both buyers and sellers are fighting aggressively at these levels.
3. The Goal: Recovery starts only when we flip $71,000 back into support. Until then, stay cautious.
$ETH $SOL #BTC #crypto
{future}(SOLUSDT)
{future}(ETHUSDT)
{future}(BTCUSDT)
Bitcoin's Brutal Correction: Is the Top In? 📉
The daily chart is painting a sobering picture for $BTC Since hitting the nearly $98k high, Bitcoin has shed over $29,000 in value, currently stabilizing around $68,896.
The Scenario:
1. Bearish Pressure: The EMA(99) is way up at $77,534, showing just how far we've fallen from the long-term trend line.
2. Volatility: 24h volume is at a massive $1.49B, indicating that both buyers and sellers are fighting aggressively at these levels.
3. The Goal: Recovery starts only when we flip $71,000 back into support. Until then, stay cautious.
$ETH $SOL #BTC #crypto
The daily chart is painting a sobering picture for $BTC Since hitting the nearly $98k high, Bitcoin has shed over $29,000 in value, currently stabilizing around $68,896.
The Scenario:
1. Bearish Pressure: The EMA(99) is way up at $77,534, showing just how far we've fallen from the long-term trend line.
2. Volatility: 24h volume is at a massive $1.49B, indicating that both buyers and sellers are fighting aggressively at these levels.
3. The Goal: Recovery starts only when we flip $71,000 back into support. Until then, stay cautious.
$ETH $SOL #BTC #crypto
1
39
$BTC Battling to Hold the $68k Level 🛡️
Bitcoin is currently down -2.82%, sitting at $68,896. After a rapid descent from the $97,924 peak, we are looking for where the "bleeding" stops.
• The Trend: Price is currently trading below the EMA(7) ($69,816) and EMA(25) ($70,147), which are now acting as overhead resistance.
• The Psychological Floor: We saw a wick down to $60,000 recently, showing a massive liquidity grab. Bulls need to keep the price above $68,000 to prevent a retest of those lower depths.
• RSI Check: The RSI(6) is at 41.02. It's not quite "oversold" yet, meaning there could be more sideways chop or a slight further dip before a genuine reversal.
#BTC #ETH $ETH $SOL
{spot}(SOLUSDT)
{spot}(ETHUSDT)
{future}(BTCUSDT)
$BTC Battling to Hold the $68k Level 🛡️
Bitcoin is currently down -2.82%, sitting at $68,896. After a rapid descent from the $97,924 peak, we are looking for where the "bleeding" stops.
• The Trend: Price is currently trading below the EMA(7) ($69,816) and EMA(25) ($70,147), which are now acting as overhead resistance.
• The Psychological Floor: We saw a wick down to $60,000 recently, showing a massive liquidity grab. Bulls need to keep the price above $68,000 to prevent a retest of those lower depths.
• RSI Check: The RSI(6) is at 41.02. It's not quite "oversold" yet, meaning there could be more sideways chop or a slight further dip before a genuine reversal.
#BTC #ETH $ETH $SOL
Bitcoin is currently down -2.82%, sitting at $68,896. After a rapid descent from the $97,924 peak, we are looking for where the "bleeding" stops.
• The Trend: Price is currently trading below the EMA(7) ($69,816) and EMA(25) ($70,147), which are now acting as overhead resistance.
• The Psychological Floor: We saw a wick down to $60,000 recently, showing a massive liquidity grab. Bulls need to keep the price above $68,000 to prevent a retest of those lower depths.
• RSI Check: The RSI(6) is at 41.02. It's not quite "oversold" yet, meaning there could be more sideways chop or a slight further dip before a genuine reversal.
#BTC #ETH $ETH $SOL
1
46
·
--
Bullish
Bitcoin is facing a sharp downturn due to a combination of panic selling, massive liquidation of leveraged positions (over $1.3 billion in 12 hours), and reduced market liquidity. Major catalysts include institutional selling (e.g., Bitdeer), regulatory uncertainty, and investor sentiment shifting to "extreme fear" as geopolitical tensions increase.
$BTC
{spot}(BTCUSDT)
Bitcoin is facing a sharp downturn due to a combination of panic selling, massive liquidation of leveraged positions (over $1.3 billion in 12 hours), and reduced market liquidity. Major catalysts include institutional selling (e.g., Bitdeer), regulatory uncertainty, and investor sentiment shifting to "extreme fear" as geopolitical tensions increase.
$BTC
$BTC
1
21
The Architecture of Digital Trust: Why $SIGN is the Foundation for MENA’s Future
As the Middle East pivots from oil-based economies to digital-first powerhouses, "Digital Sovereignty" is no longer a buzzword—it is a national security and economic requirement. Projects in Dubai, NEOM, and Qatar are not just building cities; they are building ecosystems that require instant, tamper-proof verification.
This is where @SignOfficial enters the frame. Unlike traditional systems that rely on centralized databases (which are prone to silos and breaches), Sign Protocol provides an omnichain attestation layer. This acts as the "Digital Sovereign Infrastructure" that allows:
1. Cross-Border Economic Coordination: A business credential issued in Riyadh can be verified in Abu Dhabi in seconds, not weeks, removing billions in administrative friction.
2. RWA Tokenization: SIGN provides the trust layer for Real World Assets, ensuring that tokenized property or commodities are legally verified and transparently managed on-chain.
3. Privacy-Preserving Identity: Using the protocol, individuals can prove their qualifications or identity without exposing sensitive personal data—a key requirement for smart government frameworks.
The SIGN token is more than just an asset; it is the utility fuel powering these attestations and securing the network's governance. By turning "trust" into a programmable, automated service, @SignOfficial is providing the invisible engine for the next decade of Middle East economic growth. 🌍🚀
$BTC
#signdigitalsovereigninfra
{future}(BTCUSDT)
{future}(SIGNUSDT)
The Architecture of Digital Trust: Why $SIGN is the Foundation for MENA’s Future
As the Middle East pivots from oil-based economies to digital-first powerhouses, "Digital Sovereignty" is no longer a buzzword—it is a national security and economic requirement. Projects in Dubai, NEOM, and Qatar are not just building cities; they are building ecosystems that require instant, tamper-proof verification.
This is where @SignOfficial enters the frame. Unlike traditional systems that rely on centralized databases (which are prone to silos and breaches), Sign Protocol provides an omnichain attestation layer. This acts as the "Digital Sovereign Infrastructure" that allows:
1. Cross-Border Economic Coordination: A business credential issued in Riyadh can be verified in Abu Dhabi in seconds, not weeks, removing billions in administrative friction.
2. RWA Tokenization: SIGN provides the trust layer for Real World Assets, ensuring that tokenized property or commodities are legally verified and transparently managed on-chain.
3. Privacy-Preserving Identity: Using the protocol, individuals can prove their qualifications or identity without exposing sensitive personal data—a key requirement for smart government frameworks.
The SIGN token is more than just an asset; it is the utility fuel powering these attestations and securing the network's governance. By turning "trust" into a programmable, automated service, @SignOfficial is providing the invisible engine for the next decade of Middle East economic growth. 🌍🚀
$BTC
#signdigitalsovereigninfra
As the Middle East pivots from oil-based economies to digital-first powerhouses, "Digital Sovereignty" is no longer a buzzword—it is a national security and economic requirement. Projects in Dubai, NEOM, and Qatar are not just building cities; they are building ecosystems that require instant, tamper-proof verification.
This is where @SignOfficial enters the frame. Unlike traditional systems that rely on centralized databases (which are prone to silos and breaches), Sign Protocol provides an omnichain attestation layer. This acts as the "Digital Sovereign Infrastructure" that allows:
1. Cross-Border Economic Coordination: A business credential issued in Riyadh can be verified in Abu Dhabi in seconds, not weeks, removing billions in administrative friction.
2. RWA Tokenization: SIGN provides the trust layer for Real World Assets, ensuring that tokenized property or commodities are legally verified and transparently managed on-chain.
3. Privacy-Preserving Identity: Using the protocol, individuals can prove their qualifications or identity without exposing sensitive personal data—a key requirement for smart government frameworks.
The SIGN token is more than just an asset; it is the utility fuel powering these attestations and securing the network's governance. By turning "trust" into a programmable, automated service, @SignOfficial is providing the invisible engine for the next decade of Middle East economic growth. 🌍🚀
$BTC
#signdigitalsovereigninfra
2
47
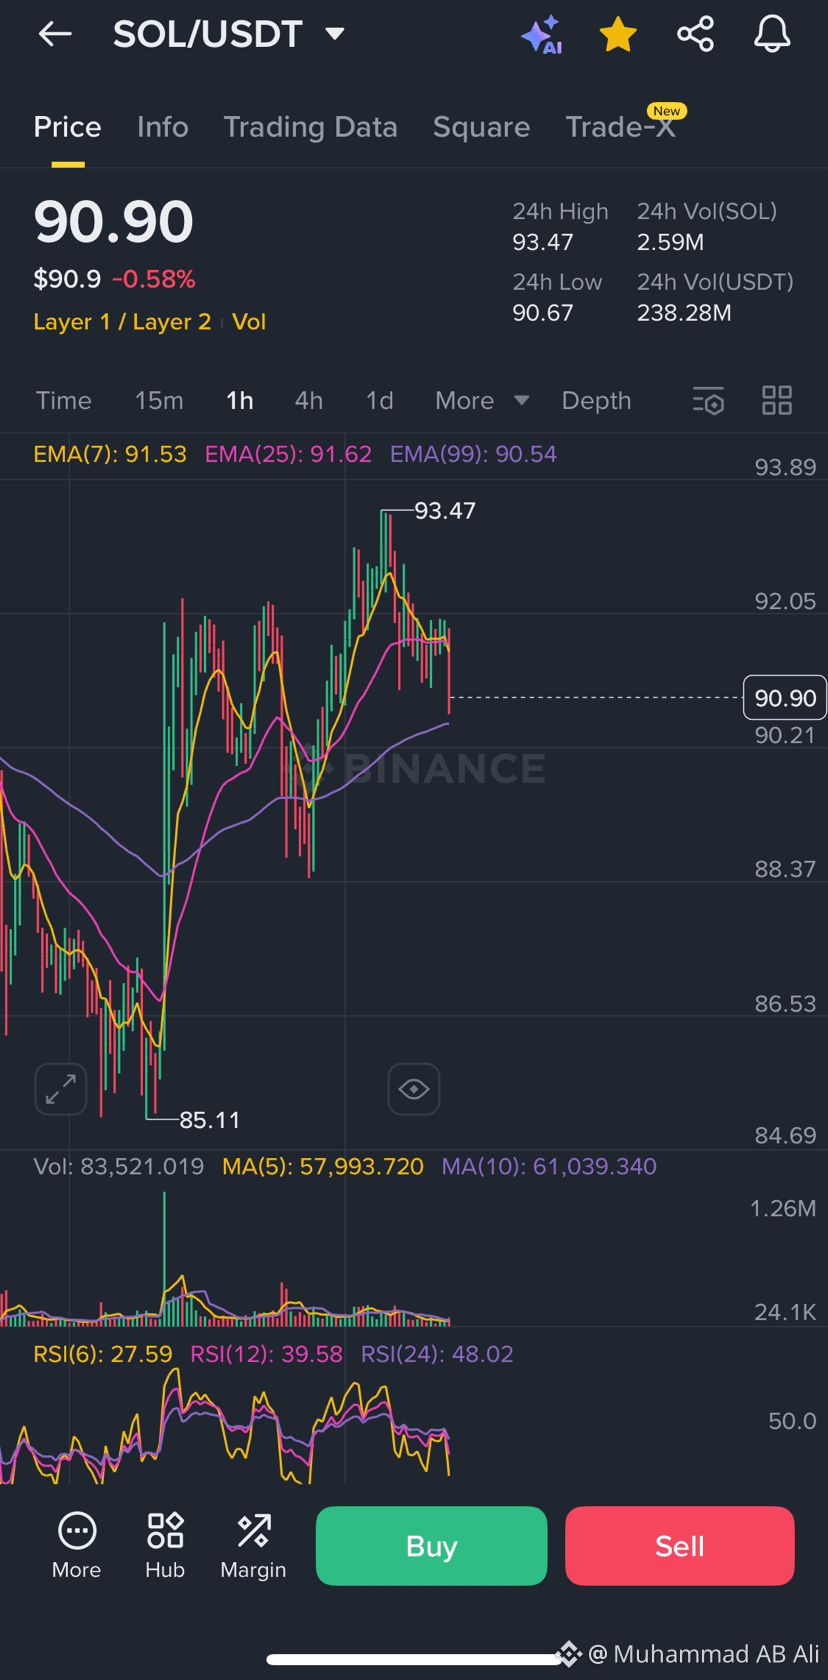
SOL/USDT: 1H vs. 4H Timeframe Analysis
1. The 1-Hour Chart (The "Micro" View)
The 1-hour chart is currently showing short-term exhaustion. After a climb toward $93.47, we are seeing a "cooling off" period.
• Price Action: Consolidating around $90.90.
• Moving Averages: The price is testing the EMA(99) at $90.54. In day trading, this is often the "make or break" line for the session.
• RSI (Relative Strength Index): At 27.59, the hourly RSI is oversold.
• Interpretation: While the red candles look scary, this indicates that the immediate selling pressure is likely tapped out. Expect a "relief bounce" or sideways movement soon as buyers step back in at these lower levels.
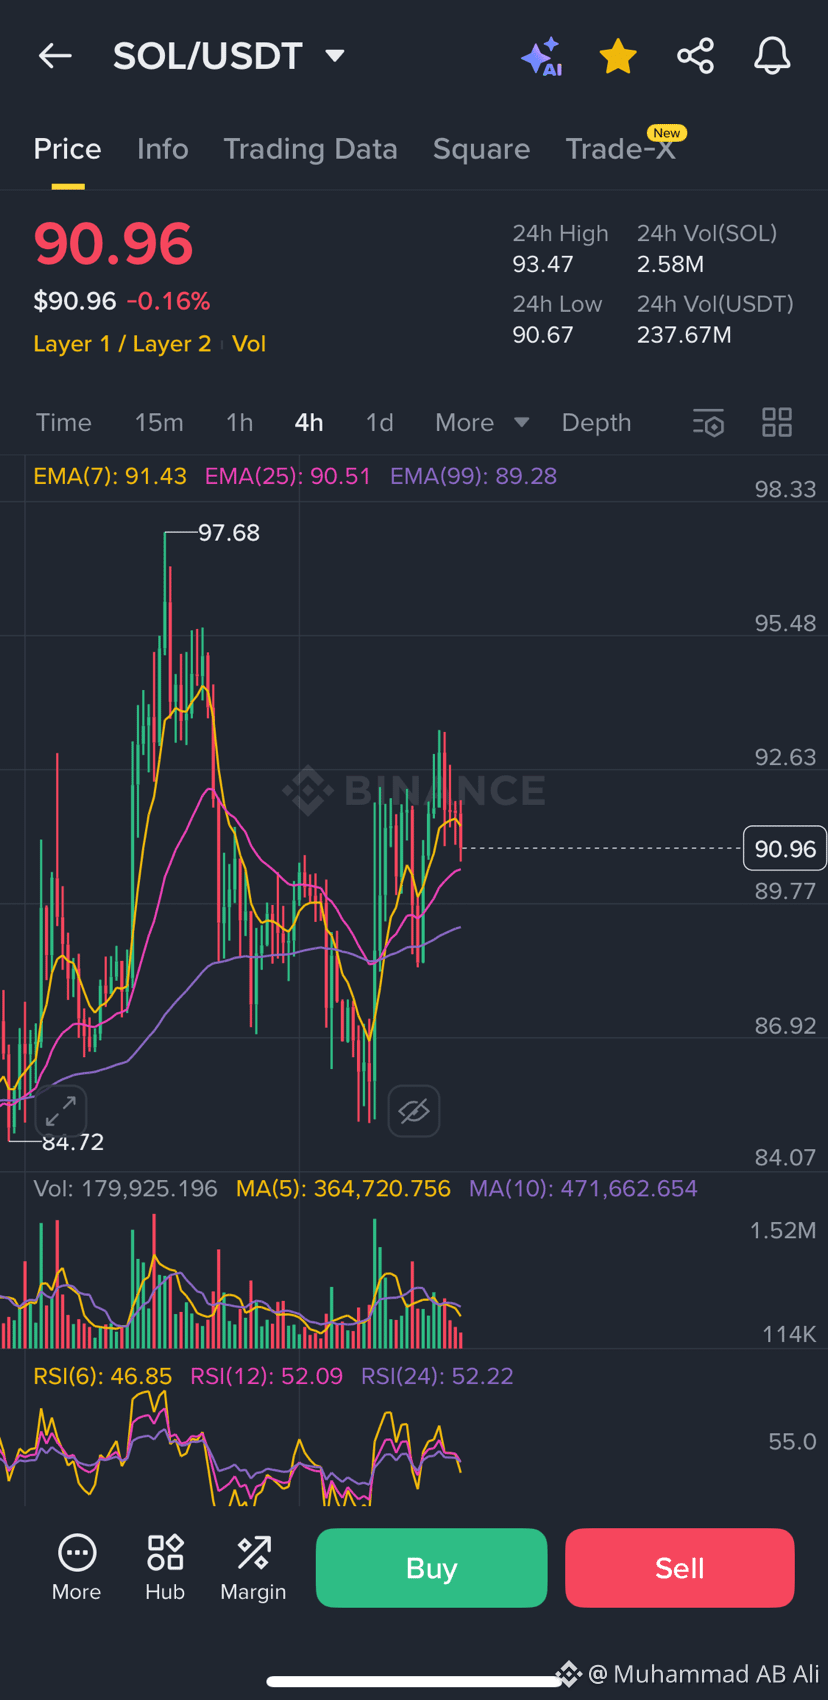
2. The 4-Hour Chart (The "Macro" View)
The 4-hour chart tells a much more bullish and stable story. It filters out the hourly volatility to show the structural trend.
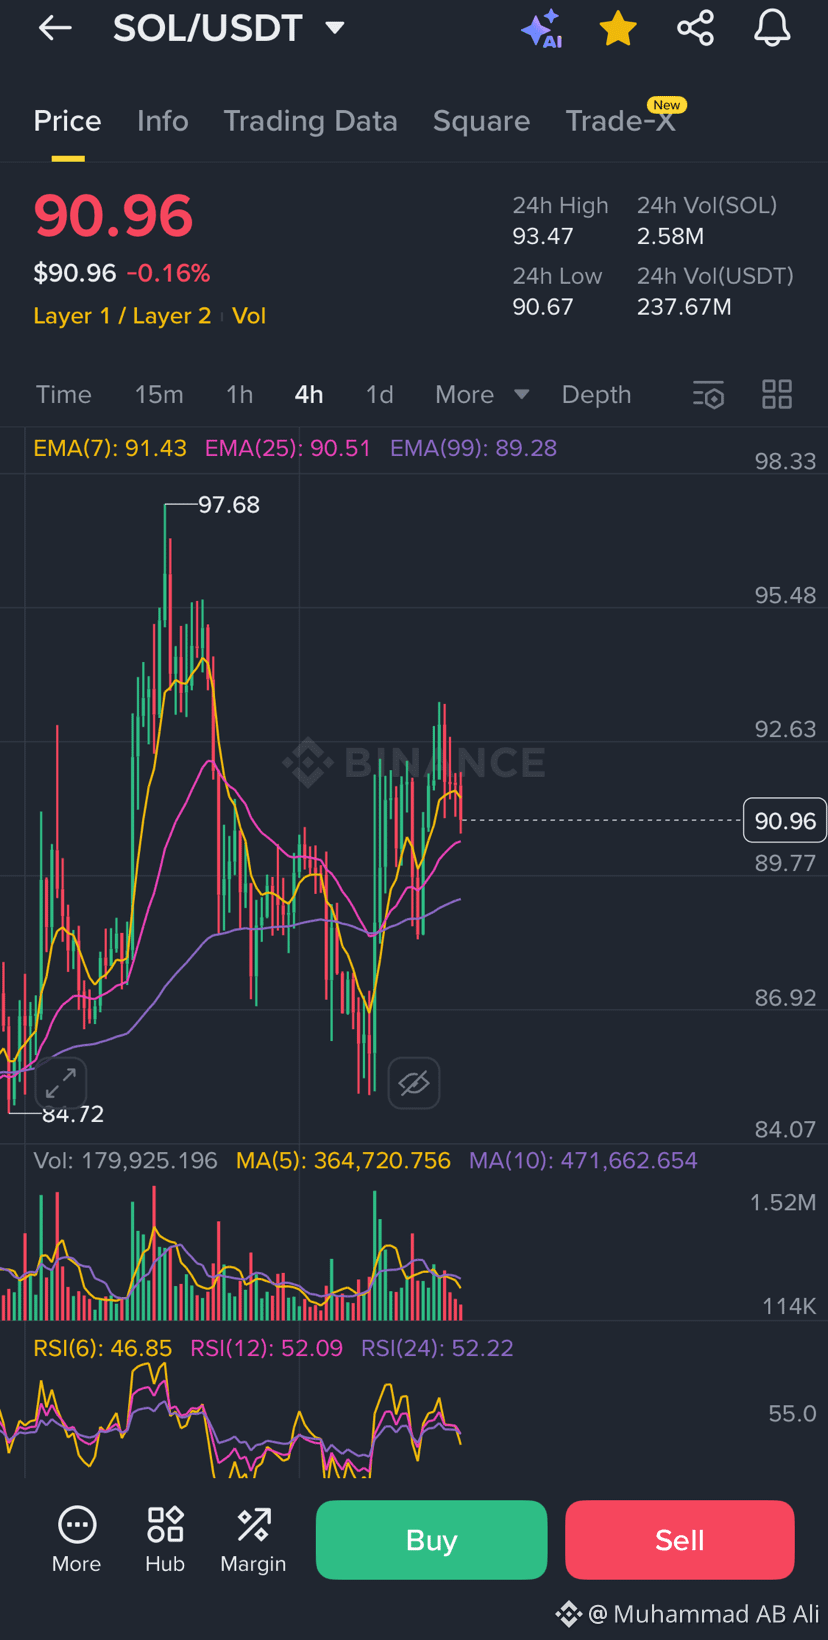
• Price Action: Despite the small hourly dip, Solana is in a clear recovery phase from its recent $84.72 bottom.
• Moving Averages: The 4-hour price is trading above both the EMA(25) ($90.51) and the EMA(99) ($89.28).
• Interpretation: As long as the price stays above $89.50 on the 4H, the uptrend is healthy. This timeframe suggests the current dip is just a "retest" of support rather than a trend reversal.
• RSI: At 46.85, it is in the "Neutral Zone." This is ideal for bulls because it means there is no "overheating"—there is plenty of room for the price to move toward $95–$100 before the market becomes overbought.
#solana $BTC $ETH $SOL
{spot}(SOLUSDT)
{spot}(ETHUSDT)
{spot}(BTCUSDT)
SOL/USDT: 1H vs. 4H Timeframe Analysis
1. The 1-Hour Chart (The "Micro" View)
The 1-hour chart is currently showing short-term exhaustion. After a climb toward $93.47, we are seeing a "cooling off" period.
• Price Action: Consolidating around $90.90.
• Moving Averages: The price is testing the EMA(99) at $90.54. In day trading, this is often the "make or break" line for the session.
• RSI (Relative Strength Index): At 27.59, the hourly RSI is oversold.
• Interpretation: While the red candles look scary, this indicates that the immediate selling pressure is likely tapped out. Expect a "relief bounce" or sideways movement soon as buyers step back in at these lower levels.
2. The 4-Hour Chart (The "Macro" View)
The 4-hour chart tells a much more bullish and stable story. It filters out the hourly volatility to show the structural trend.
• Price Action: Despite the small hourly dip, Solana is in a clear recovery phase from its recent $84.72 bottom.
• Moving Averages: The 4-hour price is trading above both the EMA(25) ($90.51) and the EMA(99) ($89.28).
• Interpretation: As long as the price stays above $89.50 on the 4H, the uptrend is healthy. This timeframe suggests the current dip is just a "retest" of support rather than a trend reversal.
• RSI: At 46.85, it is in the "Neutral Zone." This is ideal for bulls because it means there is no "overheating"—there is plenty of room for the price to move toward $95–$100 before the market becomes overbought.
#solana $BTC $ETH $SOL
1. The 1-Hour Chart (The "Micro" View)
The 1-hour chart is currently showing short-term exhaustion. After a climb toward $93.47, we are seeing a "cooling off" period.
• Price Action: Consolidating around $90.90.
• Moving Averages: The price is testing the EMA(99) at $90.54. In day trading, this is often the "make or break" line for the session.
• RSI (Relative Strength Index): At 27.59, the hourly RSI is oversold.
• Interpretation: While the red candles look scary, this indicates that the immediate selling pressure is likely tapped out. Expect a "relief bounce" or sideways movement soon as buyers step back in at these lower levels.
2. The 4-Hour Chart (The "Macro" View)
The 4-hour chart tells a much more bullish and stable story. It filters out the hourly volatility to show the structural trend.
• Price Action: Despite the small hourly dip, Solana is in a clear recovery phase from its recent $84.72 bottom.
• Moving Averages: The 4-hour price is trading above both the EMA(25) ($90.51) and the EMA(99) ($89.28).
• Interpretation: As long as the price stays above $89.50 on the 4H, the uptrend is healthy. This timeframe suggests the current dip is just a "retest" of support rather than a trend reversal.
• RSI: At 46.85, it is in the "Neutral Zone." This is ideal for bulls because it means there is no "overheating"—there is plenty of room for the price to move toward $95–$100 before the market becomes overbought.
#solana $BTC $ETH $SOL
4
50
$SOL 4H Update: Consolidating for Strength 🚀
Solana is holding its ground at $90.96 (-0.16%). While the 1-hour chart looked like a correction, the 4-hour chart reveals a solid bounce from the recent lows.
• Current Price: $90.96
• Trend: Short-term Bullish / Medium-term Neutral
• Support: $90.51 (EMA 25)
• RSI: 46.8 (Neutral)
The chart is forming a potential "Bull Flag" or consolidation pattern. If we can flip the $91.43 resistance into support, we could see a quick move back to $97+.
#solana $BTC $ETH
{future}(ETHUSDT)
{future}(BTCUSDT)
{future}(SOLUSDT)
$SOL 4H Update: Consolidating for Strength 🚀
Solana is holding its ground at $90.96 (-0.16%). While the 1-hour chart looked like a correction, the 4-hour chart reveals a solid bounce from the recent lows.
• Current Price: $90.96
• Trend: Short-term Bullish / Medium-term Neutral
• Support: $90.51 (EMA 25)
• RSI: 46.8 (Neutral)
The chart is forming a potential "Bull Flag" or consolidation pattern. If we can flip the $91.43 resistance into support, we could see a quick move back to $97+.
#solana $BTC $ETH
Solana is holding its ground at $90.96 (-0.16%). While the 1-hour chart looked like a correction, the 4-hour chart reveals a solid bounce from the recent lows.
• Current Price: $90.96
• Trend: Short-term Bullish / Medium-term Neutral
• Support: $90.51 (EMA 25)
• RSI: 46.8 (Neutral)
The chart is forming a potential "Bull Flag" or consolidation pattern. If we can flip the $91.43 resistance into support, we could see a quick move back to $97+.
#solana $BTC $ETH
3
66
Key Levels to Watch for Solana ($SOL) 🛡️
Solana is at a critical junction on the 4-hour chart. After bouncing from the $84.72 bottom, the price has stabilized around $90.96.
The Setup:
1. Support Zone: $89.00 - $90.50 is now our "must-hold" floor. This area aligns with the 25 and 99 EMAs.
2. Momentum: The RSI(12) and RSI(24) are both hovering around 52, indicating a shift from bearish to slightly bullish sentiment.
3. Resistance: A clean break above $93.50 (the previous 24h high) would likely open the doors for a retest of the $100 psychological barrier.
$SOL
{future}(ETHUSDT)
{future}(SOLUSDT)
{future}(BTCUSDT)
Key Levels to Watch for Solana ($SOL ) 🛡️
Solana is at a critical junction on the 4-hour chart. After bouncing from the $84.72 bottom, the price has stabilized around $90.96.
The Setup:
1. Support Zone: $89.00 - $90.50 is now our "must-hold" floor. This area aligns with the 25 and 99 EMAs.
2. Momentum: The RSI(12) and RSI(24) are both hovering around 52, indicating a shift from bearish to slightly bullish sentiment.
3. Resistance: A clean break above $93.50 (the previous 24h high) would likely open the doors for a retest of the $100 psychological barrier.
$SOL
Solana is at a critical junction on the 4-hour chart. After bouncing from the $84.72 bottom, the price has stabilized around $90.96.
The Setup:
1. Support Zone: $89.00 - $90.50 is now our "must-hold" floor. This area aligns with the 25 and 99 EMAs.
2. Momentum: The RSI(12) and RSI(24) are both hovering around 52, indicating a shift from bearish to slightly bullish sentiment.
3. Resistance: A clean break above $93.50 (the previous 24h high) would likely open the doors for a retest of the $100 psychological barrier.
$SOL
2
52
$SOL Preparing for the Next Leg Up? 📈
Looking at the SOL 4-hour chart, the price is showing resilience. Despite a small intraday pullback to $90.96, Solana remains in a healthy uptrend on the medium-term timeframe.
• Moving Average Support: We are currently trading safely above the EMA(25) at $90.51 and the EMA(99) at $89.28. As long as SOL stays above these levels, the bullish structure remains intact.
• Target Resistance: The immediate goal for bulls is to reclaim the EMA(7) at $91.43 and push back toward the recent local high of $97.68.
• Indicator Health: The RSI (6) is at 46.85, which is neutral. This means there is plenty of "room to run" before the asset becomes overbought.
#solana #TrumpConsidersEndingIranConflict
$SOL Preparing for the Next Leg Up? 📈
Looking at the SOL 4-hour chart, the price is showing resilience. Despite a small intraday pullback to $90.96, Solana remains in a healthy uptrend on the medium-term timeframe.
• Moving Average Support: We are currently trading safely above the EMA(25) at $90.51 and the EMA(99) at $89.28. As long as SOL stays above these levels, the bullish structure remains intact.
• Target Resistance: The immediate goal for bulls is to reclaim the EMA(7) at $91.43 and push back toward the recent local high of $97.68.
• Indicator Health: The RSI (6) is at 46.85, which is neutral. This means there is plenty of "room to run" before the asset becomes overbought.
#solana #TrumpConsidersEndingIranConflict
Looking at the SOL 4-hour chart, the price is showing resilience. Despite a small intraday pullback to $90.96, Solana remains in a healthy uptrend on the medium-term timeframe.
• Moving Average Support: We are currently trading safely above the EMA(25) at $90.51 and the EMA(99) at $89.28. As long as SOL stays above these levels, the bullish structure remains intact.
• Target Resistance: The immediate goal for bulls is to reclaim the EMA(7) at $91.43 and push back toward the recent local high of $97.68.
• Indicator Health: The RSI (6) is at 46.85, which is neutral. This means there is plenty of "room to run" before the asset becomes overbought.
#solana #TrumpConsidersEndingIranConflict
3
92
Log in to explore more content
Join global crypto users on Binance Square
⚡️ Get latest and useful information about crypto.
💬 Trusted by the world’s largest crypto exchange.
👍 Discover real insights from verified creators.
Email / Phone number
Trending Topics
CanBTCReboundAfterFallingBelow60K?
176,142 views
810 Discussing
Bitcoin News | Bitcoin Falls Below $60,000 for the First Time Since July as IBIT Posts Record $541 Million Outflow
Binance News
·43 Likes
·80.7k views
GlobalStocksFaceLongestLosingStreakSince2023
69,948 views
687 Discussing
AnthropicPlungesTowardIPOPriceonDay2
29,862 views
324 Discussing