
Muhammad Aqib Javed 00
155 Posts

Muhammad Aqib Javed 00
Report
Block User
Open Trade
Occasional Trader
2.3 Years
14 Following
30 Followers
67 Liked
Posts
Portfolio
$HYPE
{spot}(HYPEUSDT)
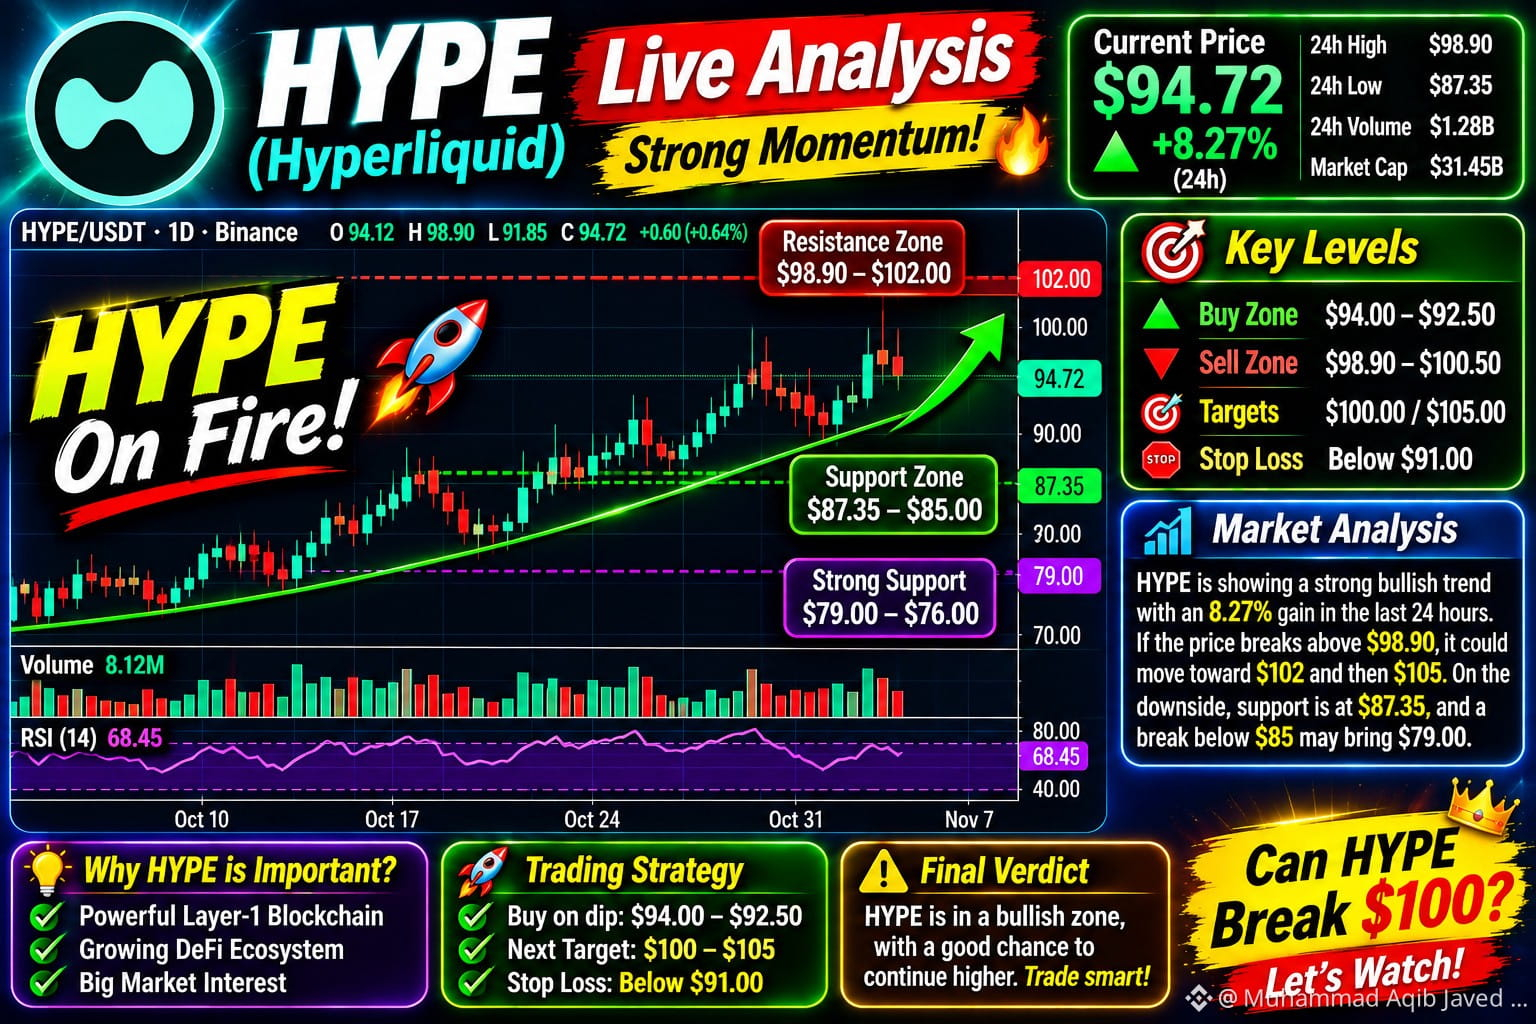
🚀 HYPE (Hyperliquid) LIVE Analysis | November 4, 2026: HYPE is trading near $83, with price action looking mixed after its recent pullback. The $82–$83 area is a nearby zone to watch; if buyers defend it and price reclaims $88 with strong volume, a move toward $90 and then the $97–$98 resistance area may come into view. If price breaks below $82, downside risk could increase toward $78. Hyperliquid’s HYPE token launched in November 2024 and supports its trading-focused blockchain ecosystem, but that background does not guarantee future price gains. Avoid chasing a sudden pump: wait for a confirmed candle close, use a stop-loss, and keep position size manageable. #hype #Hyperliquid #CryptoAnalysis #LiveTrading #TechnicalAnalysis
$HYPE
🚀 HYPE (Hyperliquid) LIVE Analysis | November 4, 2026: HYPE is trading near $83, with price action looking mixed after its recent pullback. The $82–$83 area is a nearby zone to watch; if buyers defend it and price reclaims $88 with strong volume, a move toward $90 and then the $97–$98 resistance area may come into view. If price breaks below $82, downside risk could increase toward $78. Hyperliquid’s HYPE token launched in November 2024 and supports its trading-focused blockchain ecosystem, but that background does not guarantee future price gains. Avoid chasing a sudden pump: wait for a confirmed candle close, use a stop-loss, and keep position size manageable. #hype #Hyperliquid #CryptoAnalysis #LiveTrading #TechnicalAnalysis
🚀 HYPE (Hyperliquid) LIVE Analysis | November 4, 2026: HYPE is trading near $83, with price action looking mixed after its recent pullback. The $82–$83 area is a nearby zone to watch; if buyers defend it and price reclaims $88 with strong volume, a move toward $90 and then the $97–$98 resistance area may come into view. If price breaks below $82, downside risk could increase toward $78. Hyperliquid’s HYPE token launched in November 2024 and supports its trading-focused blockchain ecosystem, but that background does not guarantee future price gains. Avoid chasing a sudden pump: wait for a confirmed candle close, use a stop-loss, and keep position size manageable. #hype #Hyperliquid #CryptoAnalysis #LiveTrading #TechnicalAnalysis
130
$AIOT
{future}(AIOTUSDT)
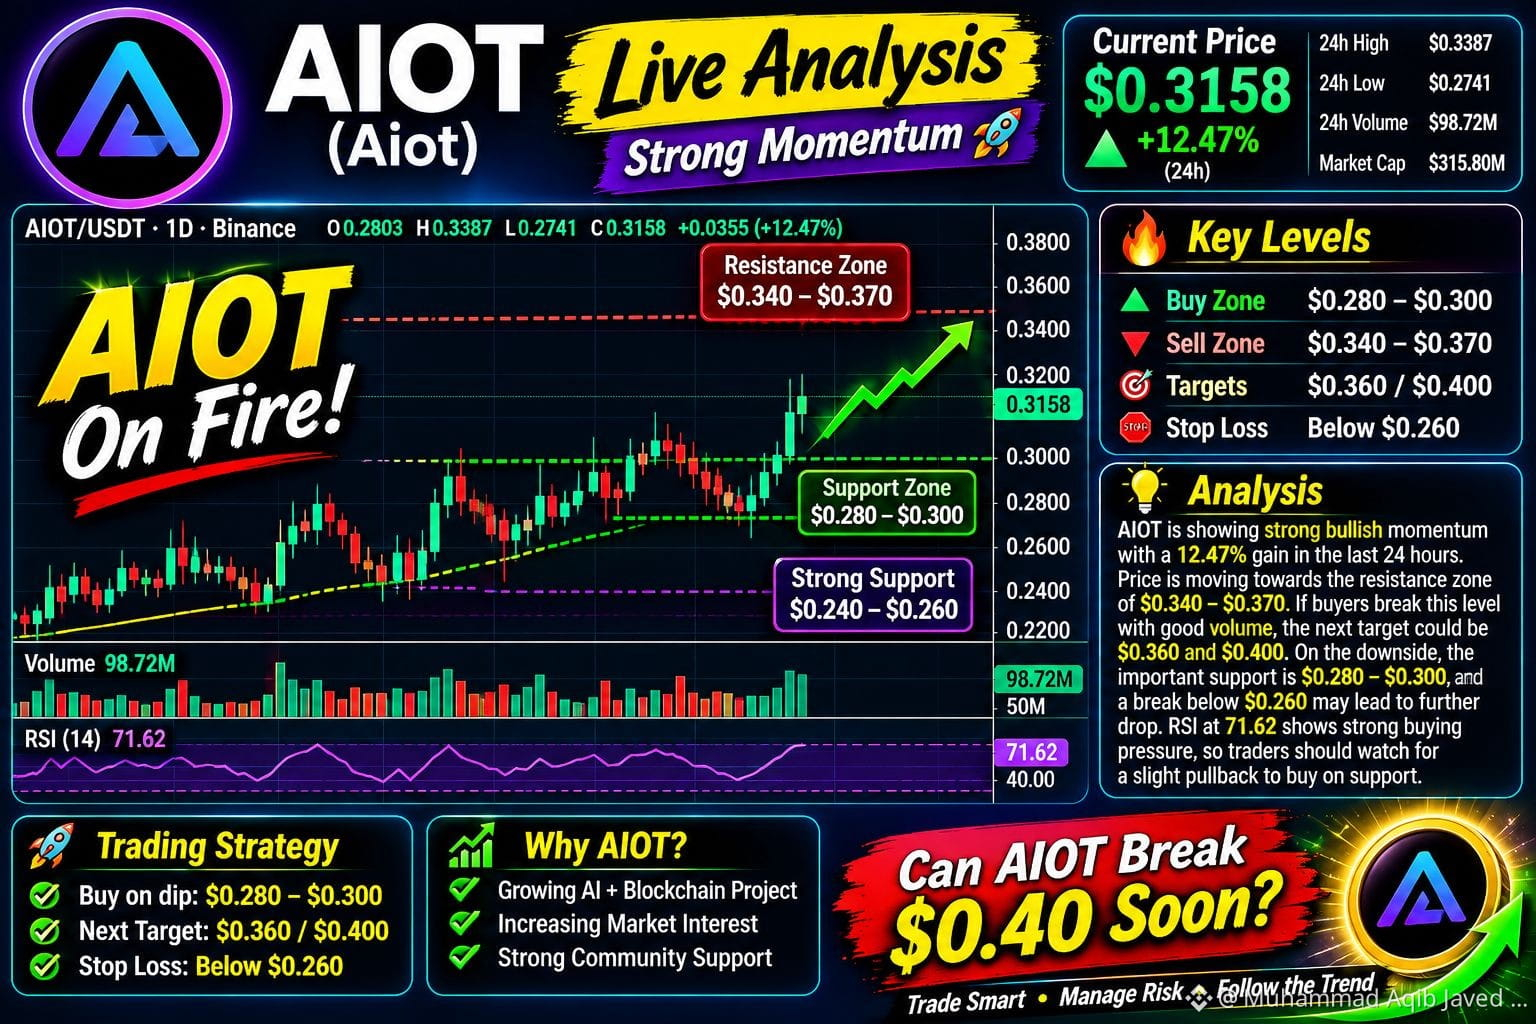
🚀 AIOT (OKZOO) LIVE MARKET ANALYSIS | November 1, 2026: AIOT is trading near $0.087, up about 22% in 24 hours, with price testing resistance around $0.0885 after reaching a high near $0.094. A strong candle close above $0.0885 with sustained volume could open a move toward the recent high; if price is rejected, watch support near $0.0786, then the $0.070–$0.071 area. AIOT belongs to OKZOO, a project building a decentralized network of sensor devices that collect real-world environmental data using AIoT technology. Momentum is strong, but the daily RSI is elevated, so chasing a sharp green candle carries risk—wait for a confirmed breakout or a pullback that holds support, set a stop-loss, and size the trade carefully. These levels can change quickly; verify the latest chart before entering. #AIOT #CryptoAnalysis #Binance #altcoins #YiHe:ProofOfReserves:10TokensAt100%Backing
$AIOT
🚀 AIOT (OKZOO) LIVE MARKET ANALYSIS | November 1, 2026: AIOT is trading near $0.087, up about 22% in 24 hours, with price testing resistance around $0.0885 after reaching a high near $0.094. A strong candle close above $0.0885 with sustained volume could open a move toward the recent high; if price is rejected, watch support near $0.0786, then the $0.070–$0.071 area. AIOT belongs to OKZOO, a project building a decentralized network of sensor devices that collect real-world environmental data using AIoT technology. Momentum is strong, but the daily RSI is elevated, so chasing a sharp green candle carries risk—wait for a confirmed breakout or a pullback that holds support, set a stop-loss, and size the trade carefully. These levels can change quickly; verify the latest chart before entering. #AIOT #CryptoAnalysis #Binance #altcoins #YiHe:ProofOfReserves:10TokensAt100%Backing
🚀 AIOT (OKZOO) LIVE MARKET ANALYSIS | November 1, 2026: AIOT is trading near $0.087, up about 22% in 24 hours, with price testing resistance around $0.0885 after reaching a high near $0.094. A strong candle close above $0.0885 with sustained volume could open a move toward the recent high; if price is rejected, watch support near $0.0786, then the $0.070–$0.071 area. AIOT belongs to OKZOO, a project building a decentralized network of sensor devices that collect real-world environmental data using AIoT technology. Momentum is strong, but the daily RSI is elevated, so chasing a sharp green candle carries risk—wait for a confirmed breakout or a pullback that holds support, set a stop-loss, and size the trade carefully. These levels can change quickly; verify the latest chart before entering. #AIOT #CryptoAnalysis #Binance #altcoins #YiHe:ProofOfReserves:10TokensAt100%Backing
127
$HYPE
{spot}(HYPEUSDT)
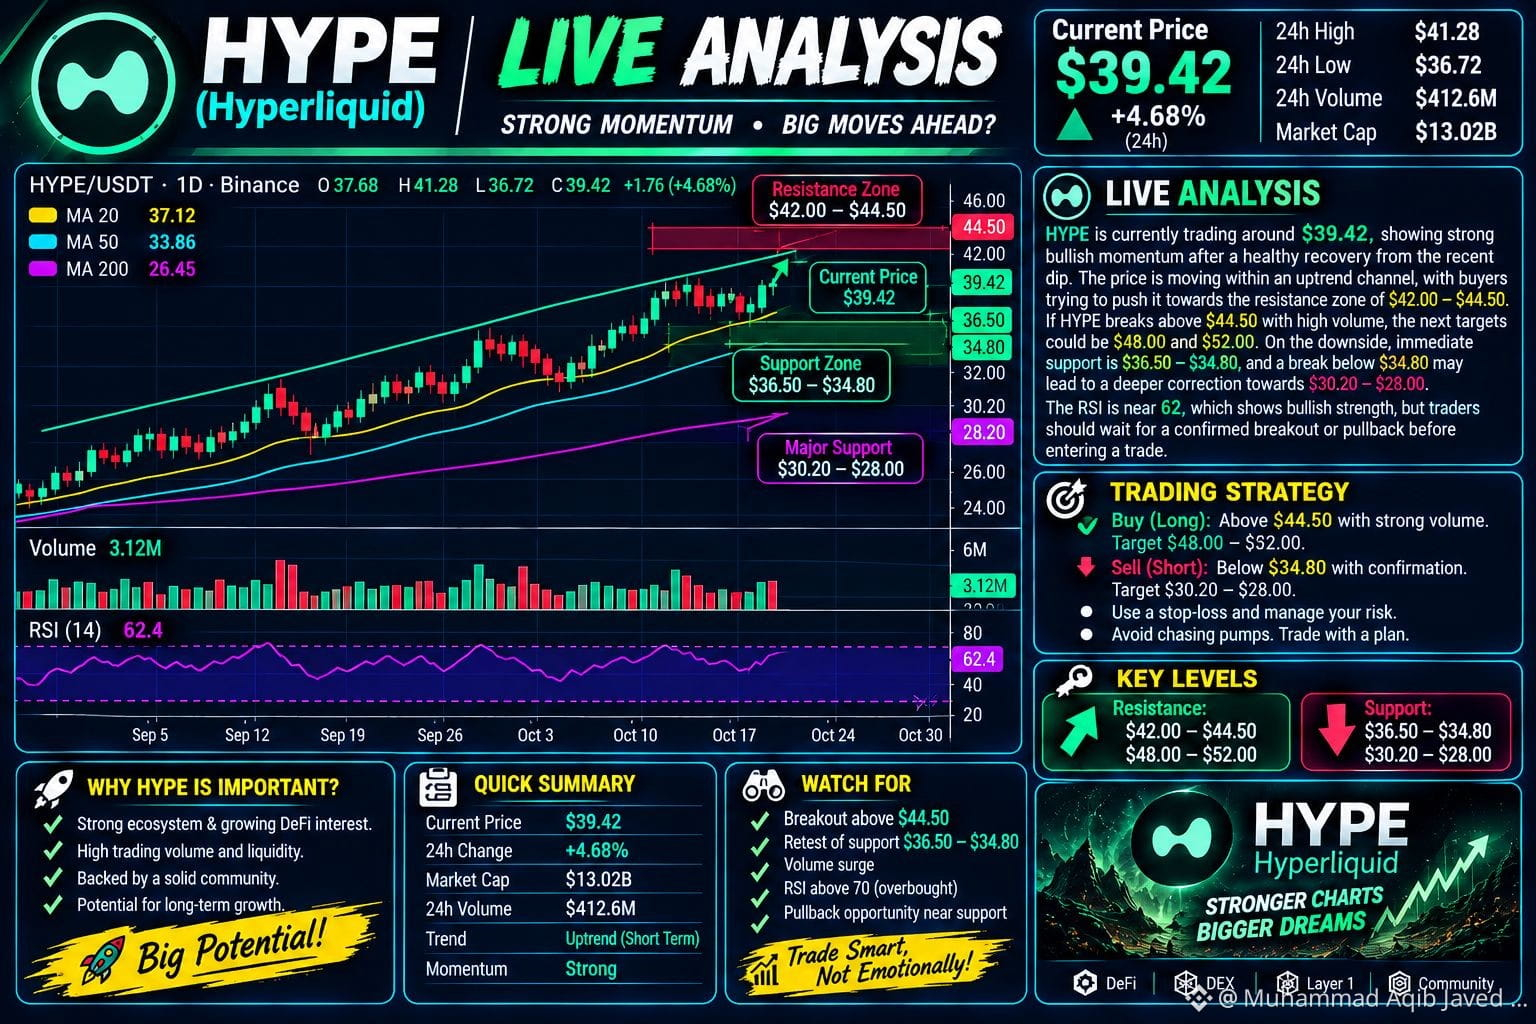
🚀 HYPE (Hyperliquid) LIVE MARKET ANALYSIS | October 31, 2026: HYPE is trading around $93.11, showing strong bullish momentum with an approximately 8.3% gain in the last 24 hours. Buyers are pushing toward the important resistance zone of $94.80–$98.90. A strong daily candle close above $98.90 with increasing volume could open the way toward $100–$105, while rejection near resistance may trigger a pullback toward the immediate support zone around $87–$85. A deeper correction could bring $79 into focus. Recent excitement around the ICE partnership announcement has added fresh market attention to Hyperliquid, but traders should watch whether buying volume can sustain this rally. HYPE is the native token of Hyperliquid, launched in November 2024, and powers its Layer-1 ecosystem, governance and staking. 📊 Trading Opportunity: Watch for a confirmed breakout above $95 or a bullish reversal near support rather than chasing green candles. Momentum is strong, but volatility is also high. Use a stop-loss, manage position size and trade with a clear plan. Can HYPE break $100 next? 🔥 #hype #CryptoTrading #BİNANCE #altcoins #CryptoMarket
$HYPE
🚀 HYPE (Hyperliquid) LIVE MARKET ANALYSIS | October 31, 2026: HYPE is trading around $93.11, showing strong bullish momentum with an approximately 8.3% gain in the last 24 hours. Buyers are pushing toward the important resistance zone of $94.80–$98.90. A strong daily candle close above $98.90 with increasing volume could open the way toward $100–$105, while rejection near resistance may trigger a pullback toward the immediate support zone around $87–$85. A deeper correction could bring $79 into focus. Recent excitement around the ICE partnership announcement has added fresh market attention to Hyperliquid, but traders should watch whether buying volume can sustain this rally. HYPE is the native token of Hyperliquid, launched in November 2024, and powers its Layer-1 ecosystem, governance and staking. 📊 Trading Opportunity: Watch for a confirmed breakout above $95 or a bullish reversal near support rather than chasing green candles. Momentum is strong, but volatility is also high. Use a stop-loss, manage position size and trade with a clear plan. Can HYPE break $100 next? 🔥 #hype #CryptoTrading #BİNANCE #altcoins #CryptoMarket
🚀 HYPE (Hyperliquid) LIVE MARKET ANALYSIS | October 31, 2026: HYPE is trading around $93.11, showing strong bullish momentum with an approximately 8.3% gain in the last 24 hours. Buyers are pushing toward the important resistance zone of $94.80–$98.90. A strong daily candle close above $98.90 with increasing volume could open the way toward $100–$105, while rejection near resistance may trigger a pullback toward the immediate support zone around $87–$85. A deeper correction could bring $79 into focus. Recent excitement around the ICE partnership announcement has added fresh market attention to Hyperliquid, but traders should watch whether buying volume can sustain this rally. HYPE is the native token of Hyperliquid, launched in November 2024, and powers its Layer-1 ecosystem, governance and staking. 📊 Trading Opportunity: Watch for a confirmed breakout above $95 or a bullish reversal near support rather than chasing green candles. Momentum is strong, but volatility is also high. Use a stop-loss, manage position size and trade with a clear plan. Can HYPE break $100 next? 🔥 #hype #CryptoTrading #BİNANCE #altcoins #CryptoMarket
54
Verified
$GOOGL
{stock_us}(GOOGL.US)
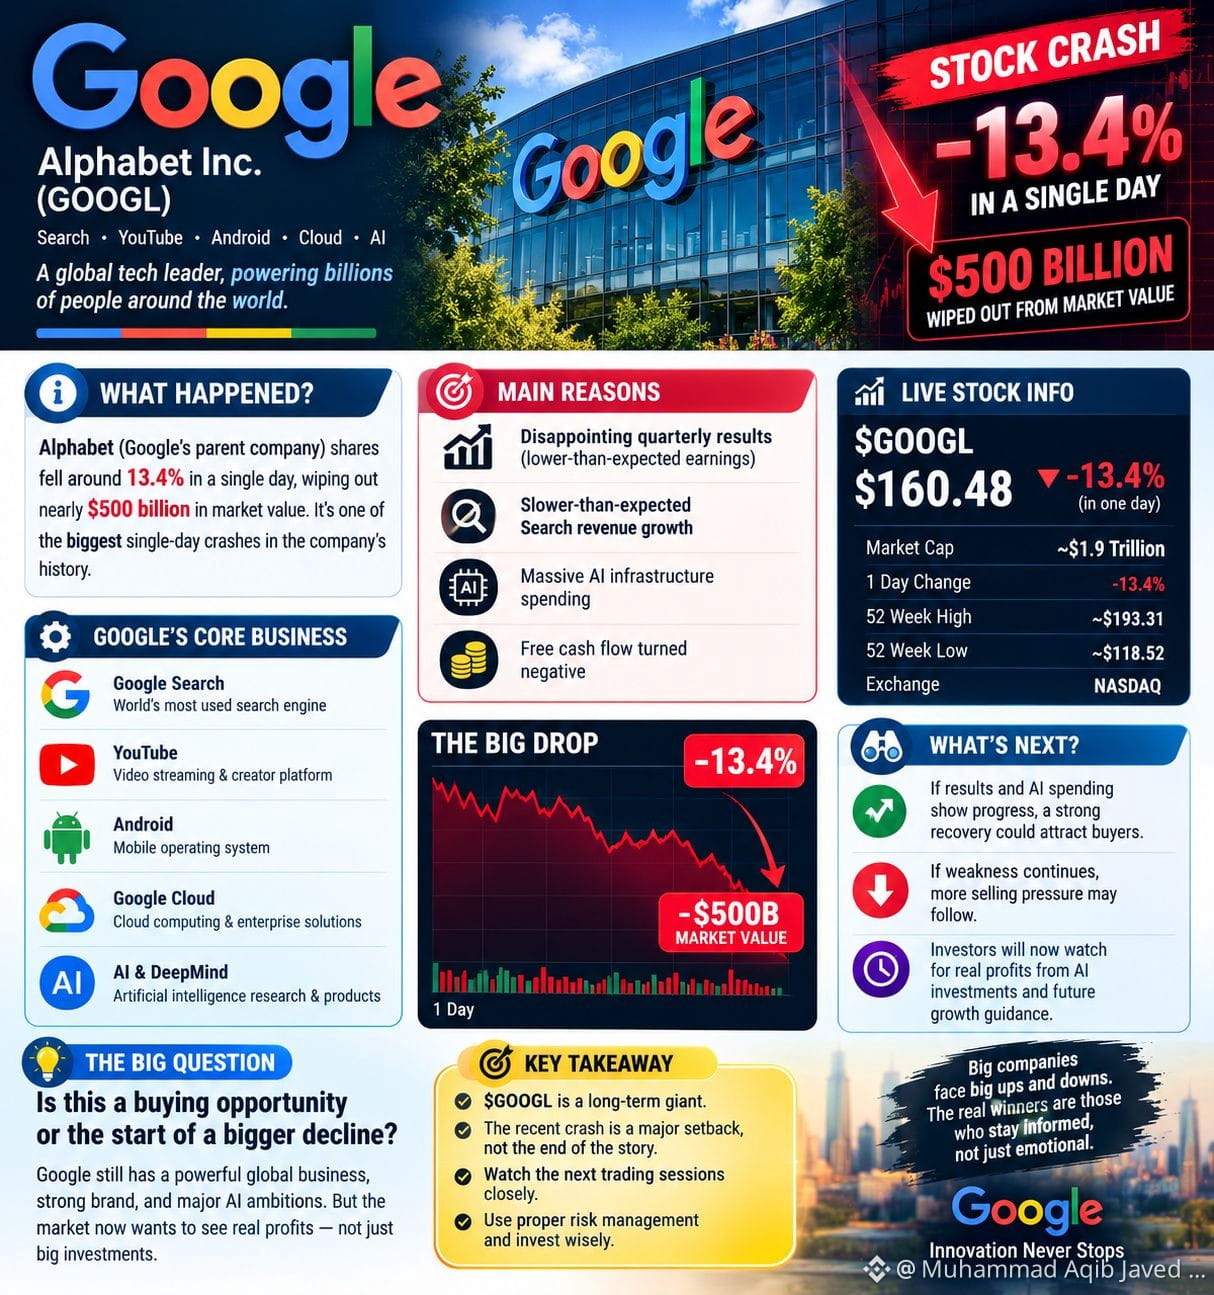
🚨 $GOOGL: A $500 BILLION WAKE-UP CALL! 😳🔥 Alphabet, Google's parent company, suffered one of the biggest single-day stock market crashes in history, with shares plunging around 13% and nearly $500 BILLION wiped from its market value. The main reasons? Disappointing quarterly results, slower-than-expected Search revenue growth, and massive AI infrastructure spending that pushed free cash flow into negative territory. 📉 But here's the big question: Is this the beginning of a bigger decline, or a potential buying opportunity? Google still has a powerful global business and major AI ambitions, but investors now want to see real profits from those investments. Watch the next trading sessions carefully — a strong recovery could attract buyers, while continued weakness may bring further selling pressure. 👀🔥 Would you buy $GOOGL after this historic crash, or wait for a stronger recovery? #Google #alphabet #stockmarket #AI #Investing
$GOOGL
🚨 $GOOGL : A $500 BILLION WAKE-UP CALL! 😳🔥 Alphabet, Google's parent company, suffered one of the biggest single-day stock market crashes in history, with shares plunging around 13% and nearly $500 BILLION wiped from its market value. The main reasons? Disappointing quarterly results, slower-than-expected Search revenue growth, and massive AI infrastructure spending that pushed free cash flow into negative territory. 📉 But here's the big question: Is this the beginning of a bigger decline, or a potential buying opportunity? Google still has a powerful global business and major AI ambitions, but investors now want to see real profits from those investments. Watch the next trading sessions carefully — a strong recovery could attract buyers, while continued weakness may bring further selling pressure. 👀🔥 Would you buy $GOOGL after this historic crash, or wait for a stronger recovery? #Google #alphabet #stockmarket #AI #Investing
🚨 $GOOGL : A $500 BILLION WAKE-UP CALL! 😳🔥 Alphabet, Google's parent company, suffered one of the biggest single-day stock market crashes in history, with shares plunging around 13% and nearly $500 BILLION wiped from its market value. The main reasons? Disappointing quarterly results, slower-than-expected Search revenue growth, and massive AI infrastructure spending that pushed free cash flow into negative territory. 📉 But here's the big question: Is this the beginning of a bigger decline, or a potential buying opportunity? Google still has a powerful global business and major AI ambitions, but investors now want to see real profits from those investments. Watch the next trading sessions carefully — a strong recovery could attract buyers, while continued weakness may bring further selling pressure. 👀🔥 Would you buy $GOOGL after this historic crash, or wait for a stronger recovery? #Google #alphabet #stockmarket #AI #Investing
GOOGL+4.05%
GOOGLUS+4.36%
1.7k
$HYPE
{spot}(HYPEUSDT)
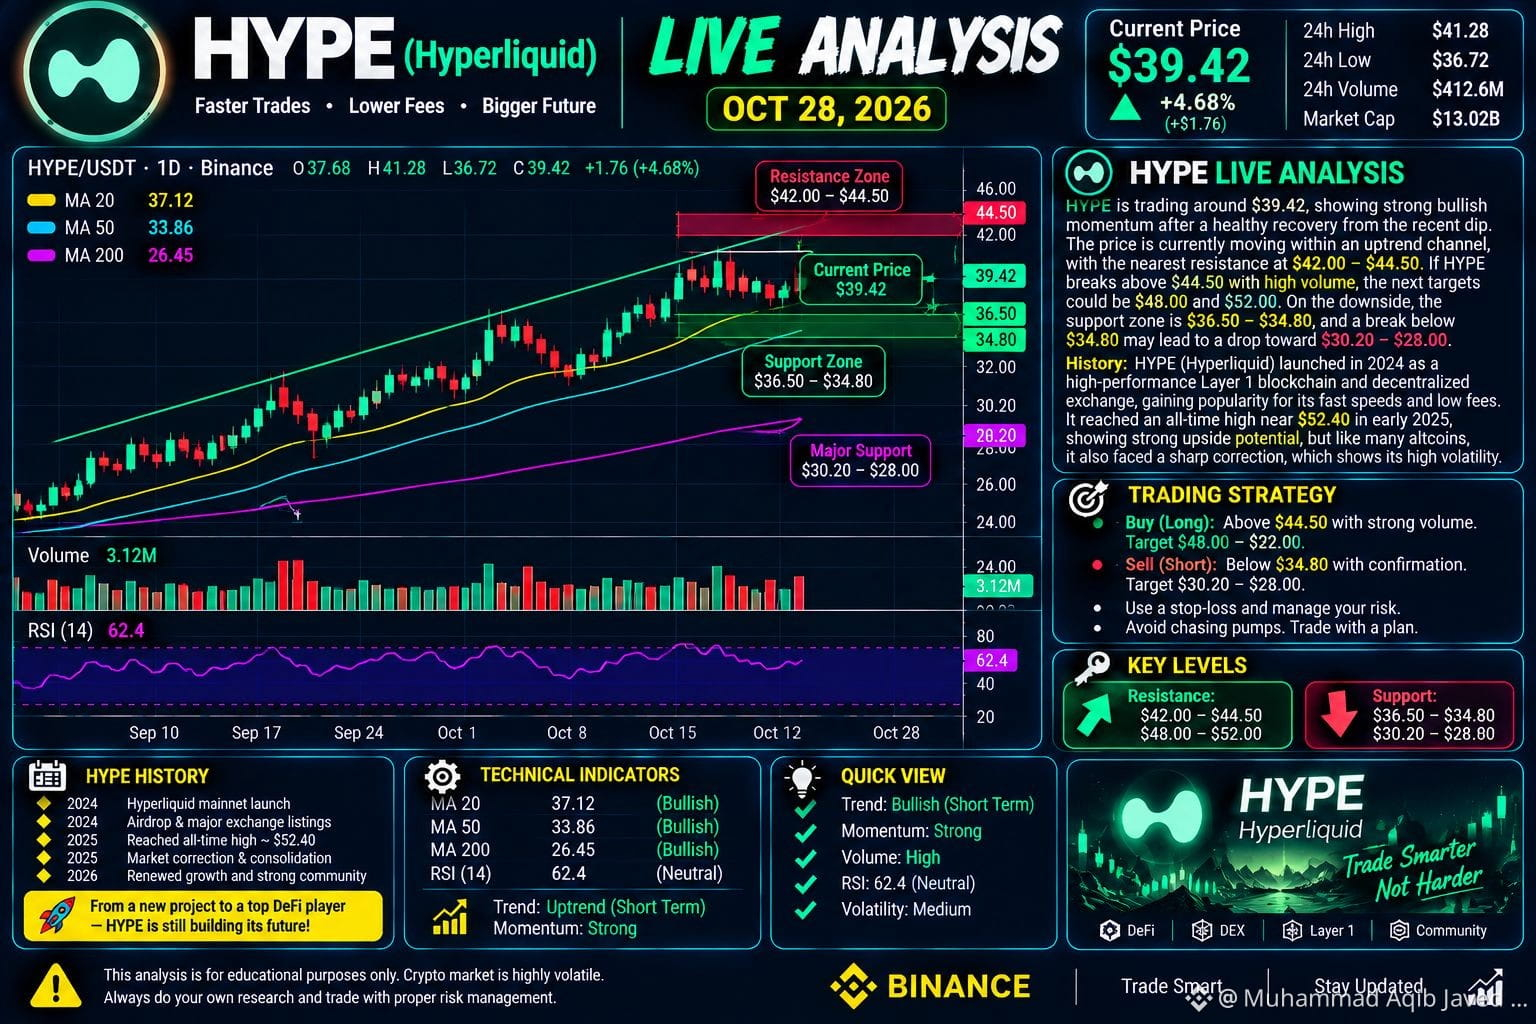
🚀 HYPE (Hyperliquid) LIVE Analysis | October 30, 2026: HYPE is showing strong bullish momentum, trading around $91–$93 after a powerful price recovery, with buyers attempting to push the token toward the important resistance zone of $92.50–$95.00. If HYPE breaks above $95 with strong trading volume and confirms the breakout on the 4-hour candle, the next potential targets could be $98–$100. On the downside, immediate support is around $85–$87, while a deeper correction could test $80–$82. Traders should watch the candle closes carefully because a rejection near resistance may trigger short-term profit-taking. History: Hyperliquid began development in 2022, launched its mainnet in 2023, and introduced the HYPE token on November 29, 2024, through a genesis distribution to early users. Its on-chain trading ecosystem has helped it gain attention in the DeFi market. With strong recent price action and growing market interest, HYPE is worth watching, but wait for confirmation instead of chasing a sudden pump. Use a stop-loss, manage your risk, and never invest money you cannot afford to lose. 📊 #hype #Hyperliquid #CryptoAnalysis #LiveTrading #Altcoins
$HYPE
🚀 HYPE (Hyperliquid) LIVE Analysis | October 30, 2026: HYPE is showing strong bullish momentum, trading around $91–$93 after a powerful price recovery, with buyers attempting to push the token toward the important resistance zone of $92.50–$95.00. If HYPE breaks above $95 with strong trading volume and confirms the breakout on the 4-hour candle, the next potential targets could be $98–$100. On the downside, immediate support is around $85–$87, while a deeper correction could test $80–$82. Traders should watch the candle closes carefully because a rejection near resistance may trigger short-term profit-taking. History: Hyperliquid began development in 2022, launched its mainnet in 2023, and introduced the HYPE token on November 29, 2024, through a genesis distribution to early users. Its on-chain trading ecosystem has helped it gain attention in the DeFi market. With strong recent price action and growing market interest, HYPE is worth watching, but wait for confirmation instead of chasing a sudden pump. Use a stop-loss, manage your risk, and never invest money you cannot afford to lose. 📊 #hype #Hyperliquid #CryptoAnalysis #LiveTrading #Altcoins
🚀 HYPE (Hyperliquid) LIVE Analysis | October 30, 2026: HYPE is showing strong bullish momentum, trading around $91–$93 after a powerful price recovery, with buyers attempting to push the token toward the important resistance zone of $92.50–$95.00. If HYPE breaks above $95 with strong trading volume and confirms the breakout on the 4-hour candle, the next potential targets could be $98–$100. On the downside, immediate support is around $85–$87, while a deeper correction could test $80–$82. Traders should watch the candle closes carefully because a rejection near resistance may trigger short-term profit-taking. History: Hyperliquid began development in 2022, launched its mainnet in 2023, and introduced the HYPE token on November 29, 2024, through a genesis distribution to early users. Its on-chain trading ecosystem has helped it gain attention in the DeFi market. With strong recent price action and growing market interest, HYPE is worth watching, but wait for confirmation instead of chasing a sudden pump. Use a stop-loss, manage your risk, and never invest money you cannot afford to lose. 📊 #hype #Hyperliquid #CryptoAnalysis #LiveTrading #Altcoins
171
$BTC
{spot}(BTCUSDT)
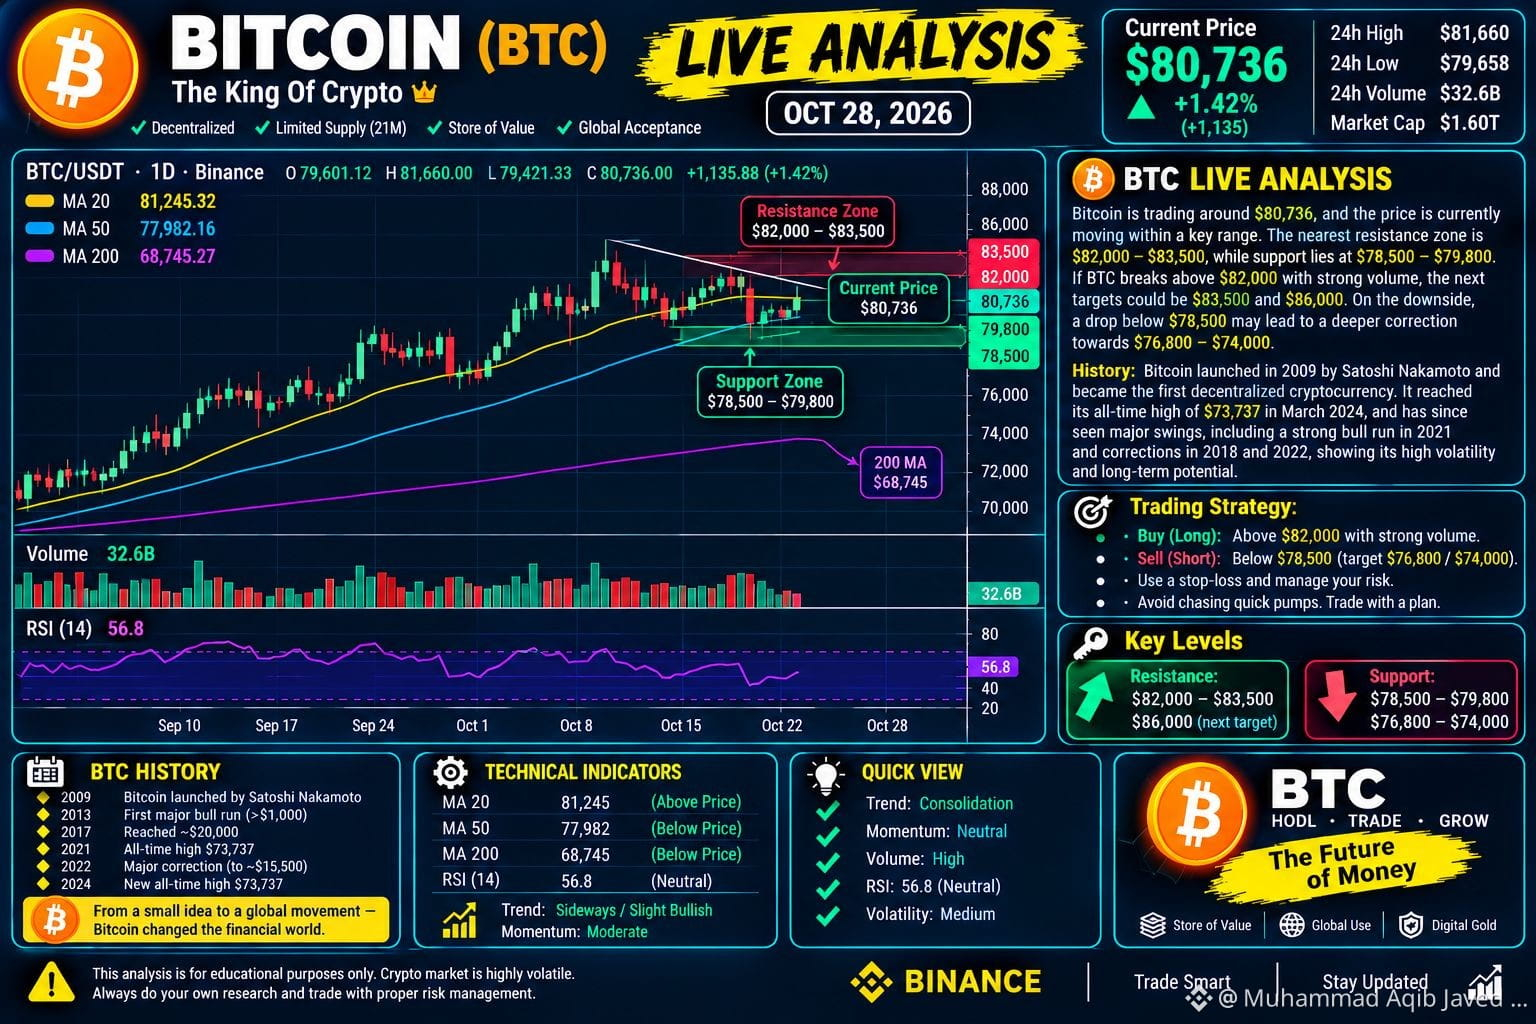
🚨 Bitcoin (BTC) Live Analysis | October 29, 2026: Bitcoin is trading near $79,900, and the short-term market structure currently looks bearish as sellers keep pressure on the $80,000 psychological level. The nearest support zone is around $79,030–$78,600, while resistance sits near $81,350–$82,050. If BTC reclaims $81,350 and confirms a breakout with strong buying volume, a recovery toward $82,050 and potentially $83,100 may follow; however, a decisive candle close below $79,030 could expose lower support levels near $78,600 and $76,400. Bitcoin launched in 2009 under the pseudonym Satoshi Nakamoto and introduced the first widely adopted decentralized digital currency, with a maximum supply of 21 million BTC. Its major market cycles—including the rallies of 2017 and 2021 and the sharp corrections that followed—show both its long-term significance and its high volatility. 📊 Trading Strategy: Avoid buying simply because the price has fallen; wait for a confirmed bullish reversal or a clear breakout, and consider downside risk if support fails. Always use a stop-loss, manage position size, and verify the latest candles before entering a trade. Bitcoin can offer opportunities, but profits are never guaranteed. #bitcoin #BTC #LiveAnalysis #cryptotrading #TechnicalAnalysisPost
$BTC
🚨 Bitcoin (BTC) Live Analysis | October 29, 2026: Bitcoin is trading near $79,900, and the short-term market structure currently looks bearish as sellers keep pressure on the $80,000 psychological level. The nearest support zone is around $79,030–$78,600, while resistance sits near $81,350–$82,050. If BTC reclaims $81,350 and confirms a breakout with strong buying volume, a recovery toward $82,050 and potentially $83,100 may follow; however, a decisive candle close below $79,030 could expose lower support levels near $78,600 and $76,400. Bitcoin launched in 2009 under the pseudonym Satoshi Nakamoto and introduced the first widely adopted decentralized digital currency, with a maximum supply of 21 million BTC. Its major market cycles—including the rallies of 2017 and 2021 and the sharp corrections that followed—show both its long-term significance and its high volatility. 📊 Trading Strategy: Avoid buying simply because the price has fallen; wait for a confirmed bullish reversal or a clear breakout, and consider downside risk if support fails. Always use a stop-loss, manage position size, and verify the latest candles before entering a trade. Bitcoin can offer opportunities, but profits are never guaranteed. #bitcoin #BTC #LiveAnalysis #cryptotrading #TechnicalAnalysisPost
🚨 Bitcoin (BTC) Live Analysis | October 29, 2026: Bitcoin is trading near $79,900, and the short-term market structure currently looks bearish as sellers keep pressure on the $80,000 psychological level. The nearest support zone is around $79,030–$78,600, while resistance sits near $81,350–$82,050. If BTC reclaims $81,350 and confirms a breakout with strong buying volume, a recovery toward $82,050 and potentially $83,100 may follow; however, a decisive candle close below $79,030 could expose lower support levels near $78,600 and $76,400. Bitcoin launched in 2009 under the pseudonym Satoshi Nakamoto and introduced the first widely adopted decentralized digital currency, with a maximum supply of 21 million BTC. Its major market cycles—including the rallies of 2017 and 2021 and the sharp corrections that followed—show both its long-term significance and its high volatility. 📊 Trading Strategy: Avoid buying simply because the price has fallen; wait for a confirmed bullish reversal or a clear breakout, and consider downside risk if support fails. Always use a stop-loss, manage position size, and verify the latest candles before entering a trade. Bitcoin can offer opportunities, but profits are never guaranteed. #bitcoin #BTC #LiveAnalysis #cryptotrading #TechnicalAnalysisPost
1
12
$MOVE
{spot}(MOVEUSDT)
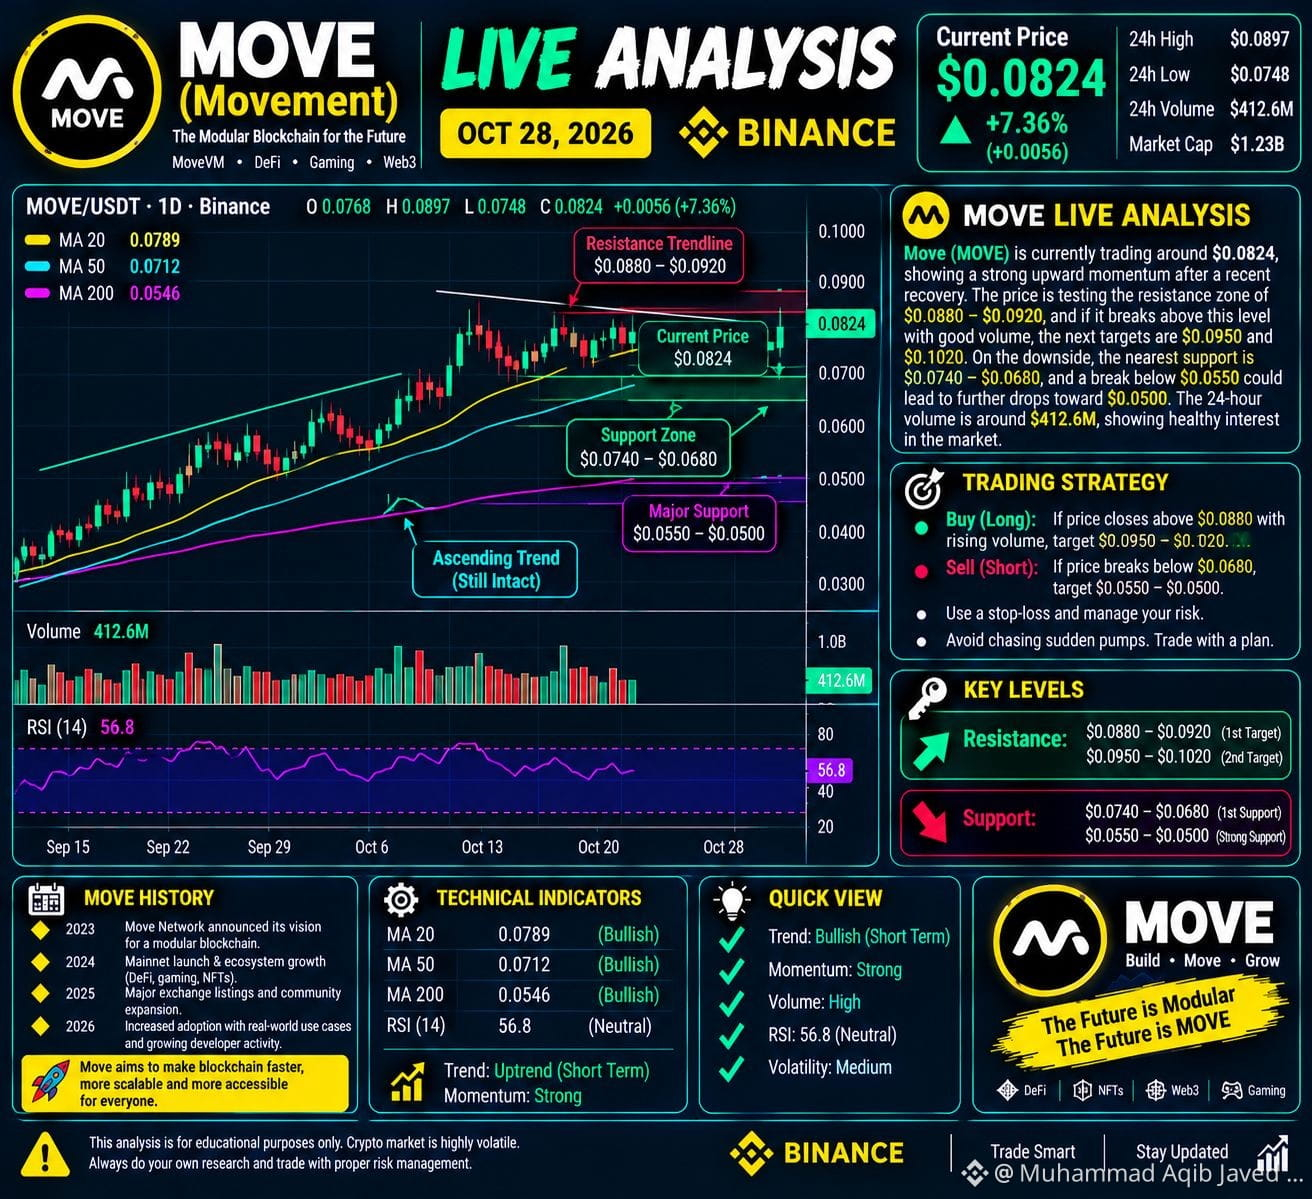
🚨 Movement (MOVE) Live Analysis | October 28, 2026: Movement (MOVE) is trading near $0.00669, and the current technical outlook remains bearish, with the price struggling below key moving averages. The nearest support is around $0.00664, followed by $0.00632, while resistance stands near $0.00696 and $0.00723. A strong candle close above $0.00696 with increasing volume could signal a short-term recovery, whereas a breakdown below $0.00664 may lead to further downside. The RSI is around 28, indicating oversold conditions; this can sometimes lead to a relief bounce, but it does not confirm a reversal. Movement Network is a blockchain project built around the Move programming language, designed to help developers create secure, scalable decentralized applications. Its MOVE token reached an all-time high of approximately $1.45 in December 2024, but has since experienced a major decline, highlighting the risks of volatility. 📊 Trading Strategy: Avoid rushing into a buy just because the price is low; wait for bullish candle confirmation above resistance or a clear bounce from support. Use a stop-loss, keep position size small, and remember that a breakdown can extend losses. These levels are technical references, not guaranteed targets—always verify the latest exchange chart before trading. #Move #MovementNetwork #CryptoAnalysis #LiveTrading #altcoins
$MOVE
🚨 Movement (MOVE) Live Analysis | October 28, 2026: Movement (MOVE) is trading near $0.00669, and the current technical outlook remains bearish, with the price struggling below key moving averages. The nearest support is around $0.00664, followed by $0.00632, while resistance stands near $0.00696 and $0.00723. A strong candle close above $0.00696 with increasing volume could signal a short-term recovery, whereas a breakdown below $0.00664 may lead to further downside. The RSI is around 28, indicating oversold conditions; this can sometimes lead to a relief bounce, but it does not confirm a reversal. Movement Network is a blockchain project built around the Move programming language, designed to help developers create secure, scalable decentralized applications. Its MOVE token reached an all-time high of approximately $1.45 in December 2024, but has since experienced a major decline, highlighting the risks of volatility. 📊 Trading Strategy: Avoid rushing into a buy just because the price is low; wait for bullish candle confirmation above resistance or a clear bounce from support. Use a stop-loss, keep position size small, and remember that a breakdown can extend losses. These levels are technical references, not guaranteed targets—always verify the latest exchange chart before trading. #Move #MovementNetwork #CryptoAnalysis #LiveTrading #altcoins
🚨 Movement (MOVE) Live Analysis | October 28, 2026: Movement (MOVE) is trading near $0.00669, and the current technical outlook remains bearish, with the price struggling below key moving averages. The nearest support is around $0.00664, followed by $0.00632, while resistance stands near $0.00696 and $0.00723. A strong candle close above $0.00696 with increasing volume could signal a short-term recovery, whereas a breakdown below $0.00664 may lead to further downside. The RSI is around 28, indicating oversold conditions; this can sometimes lead to a relief bounce, but it does not confirm a reversal. Movement Network is a blockchain project built around the Move programming language, designed to help developers create secure, scalable decentralized applications. Its MOVE token reached an all-time high of approximately $1.45 in December 2024, but has since experienced a major decline, highlighting the risks of volatility. 📊 Trading Strategy: Avoid rushing into a buy just because the price is low; wait for bullish candle confirmation above resistance or a clear bounce from support. Use a stop-loss, keep position size small, and remember that a breakdown can extend losses. These levels are technical references, not guaranteed targets—always verify the latest exchange chart before trading. #Move #MovementNetwork #CryptoAnalysis #LiveTrading #altcoins
138
$SOL
{spot}(SOLUSDT)
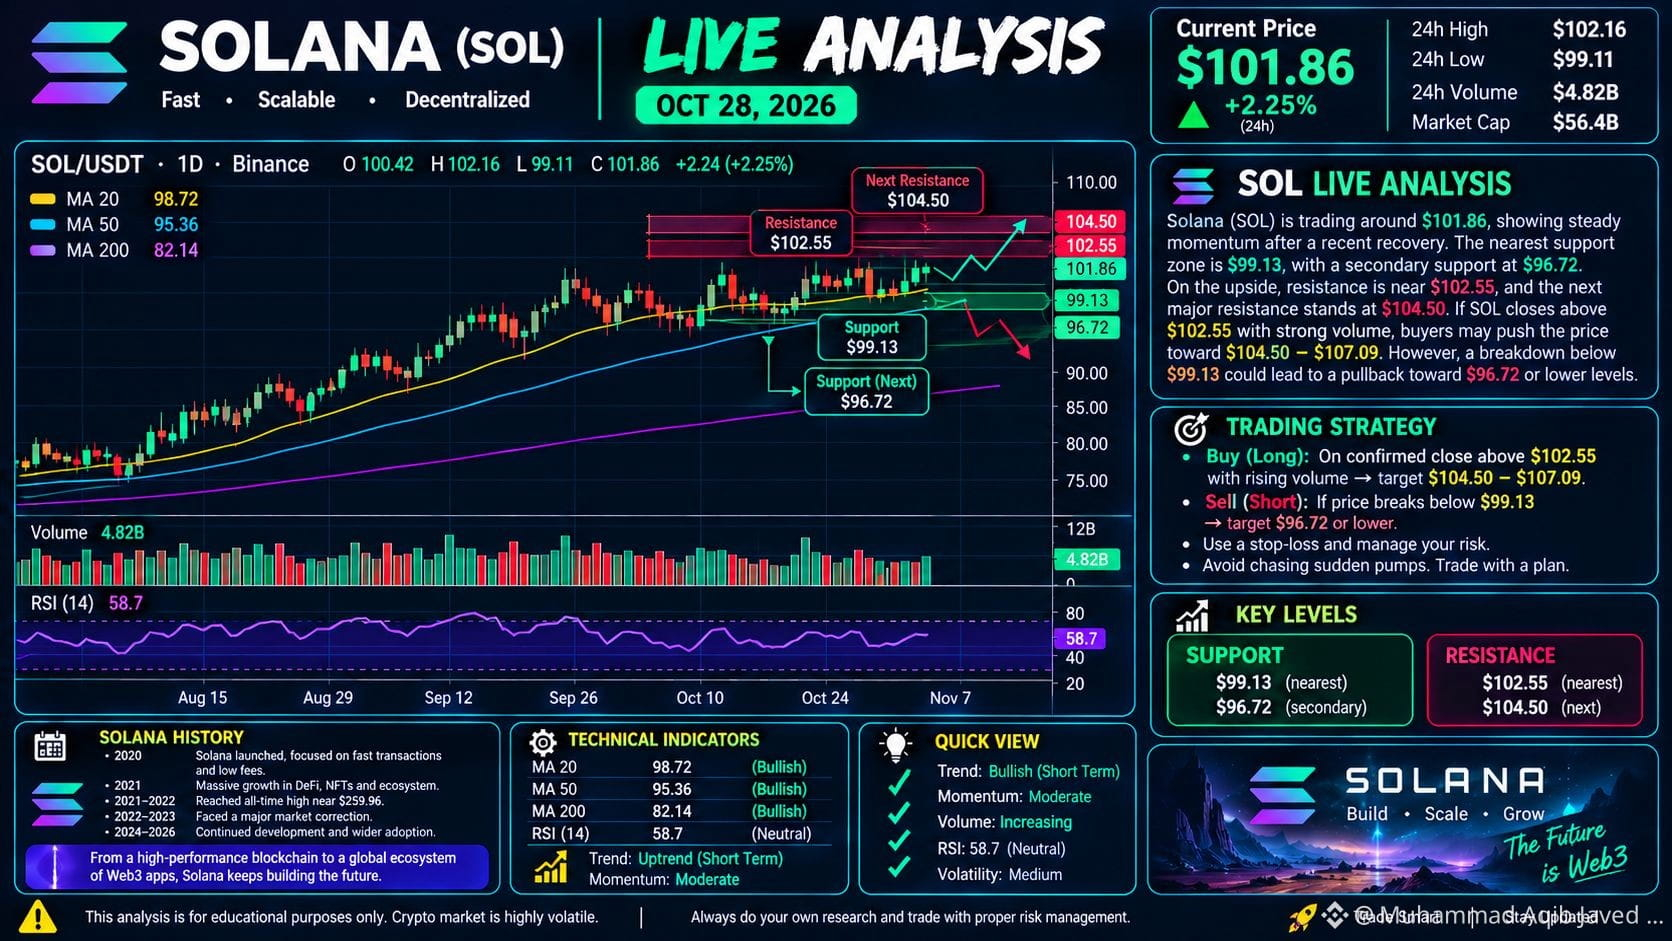
🚨 Solana (SOL) Live Analysis | October 28, 2026: Solana is trading near $101.70, with price action approaching a key resistance zone at $102.55. If SOL breaks above this level with a strong bullish candle and increasing volume, the next potential targets are $104.50 and $107.09; however, rejection at resistance could lead to a pullback toward support at $99.13, followed by $96.72 if selling pressure increases. Solana launched in 2020 with the goal of making blockchain transactions fast and affordable, and it later became a major ecosystem for DeFi, NFTs, and decentralized applications. Its history of rapid rallies and sharp corrections shows why traders should focus on confirmation rather than hype. 📈 Trading Strategy: Watch for a confirmed candle close above $102.55 before considering a long setup, or wait for a clear bounce near support; use a suitable stop-loss and manage position size carefully. SOL’s short-term direction remains sensitive to Bitcoin and broader market news, so avoid chasing sudden price movements. These levels are technical reference points, not guaranteed targets—always check the latest chart before trading. #sol #CryptoAnalysis #LiveTrading #TechnicalAnalysis #solana
$SOL
🚨 Solana (SOL) Live Analysis | October 28, 2026: Solana is trading near $101.70, with price action approaching a key resistance zone at $102.55. If SOL breaks above this level with a strong bullish candle and increasing volume, the next potential targets are $104.50 and $107.09; however, rejection at resistance could lead to a pullback toward support at $99.13, followed by $96.72 if selling pressure increases. Solana launched in 2020 with the goal of making blockchain transactions fast and affordable, and it later became a major ecosystem for DeFi, NFTs, and decentralized applications. Its history of rapid rallies and sharp corrections shows why traders should focus on confirmation rather than hype. 📈 Trading Strategy: Watch for a confirmed candle close above $102.55 before considering a long setup, or wait for a clear bounce near support; use a suitable stop-loss and manage position size carefully. SOL’s short-term direction remains sensitive to Bitcoin and broader market news, so avoid chasing sudden price movements. These levels are technical reference points, not guaranteed targets—always check the latest chart before trading. #sol #CryptoAnalysis #LiveTrading #TechnicalAnalysis #solana
🚨 Solana (SOL) Live Analysis | October 28, 2026: Solana is trading near $101.70, with price action approaching a key resistance zone at $102.55. If SOL breaks above this level with a strong bullish candle and increasing volume, the next potential targets are $104.50 and $107.09; however, rejection at resistance could lead to a pullback toward support at $99.13, followed by $96.72 if selling pressure increases. Solana launched in 2020 with the goal of making blockchain transactions fast and affordable, and it later became a major ecosystem for DeFi, NFTs, and decentralized applications. Its history of rapid rallies and sharp corrections shows why traders should focus on confirmation rather than hype. 📈 Trading Strategy: Watch for a confirmed candle close above $102.55 before considering a long setup, or wait for a clear bounce near support; use a suitable stop-loss and manage position size carefully. SOL’s short-term direction remains sensitive to Bitcoin and broader market news, so avoid chasing sudden price movements. These levels are technical reference points, not guaranteed targets—always check the latest chart before trading. #sol #CryptoAnalysis #LiveTrading #TechnicalAnalysis #solana
79
$BTC
{spot}(BTCUSDT)
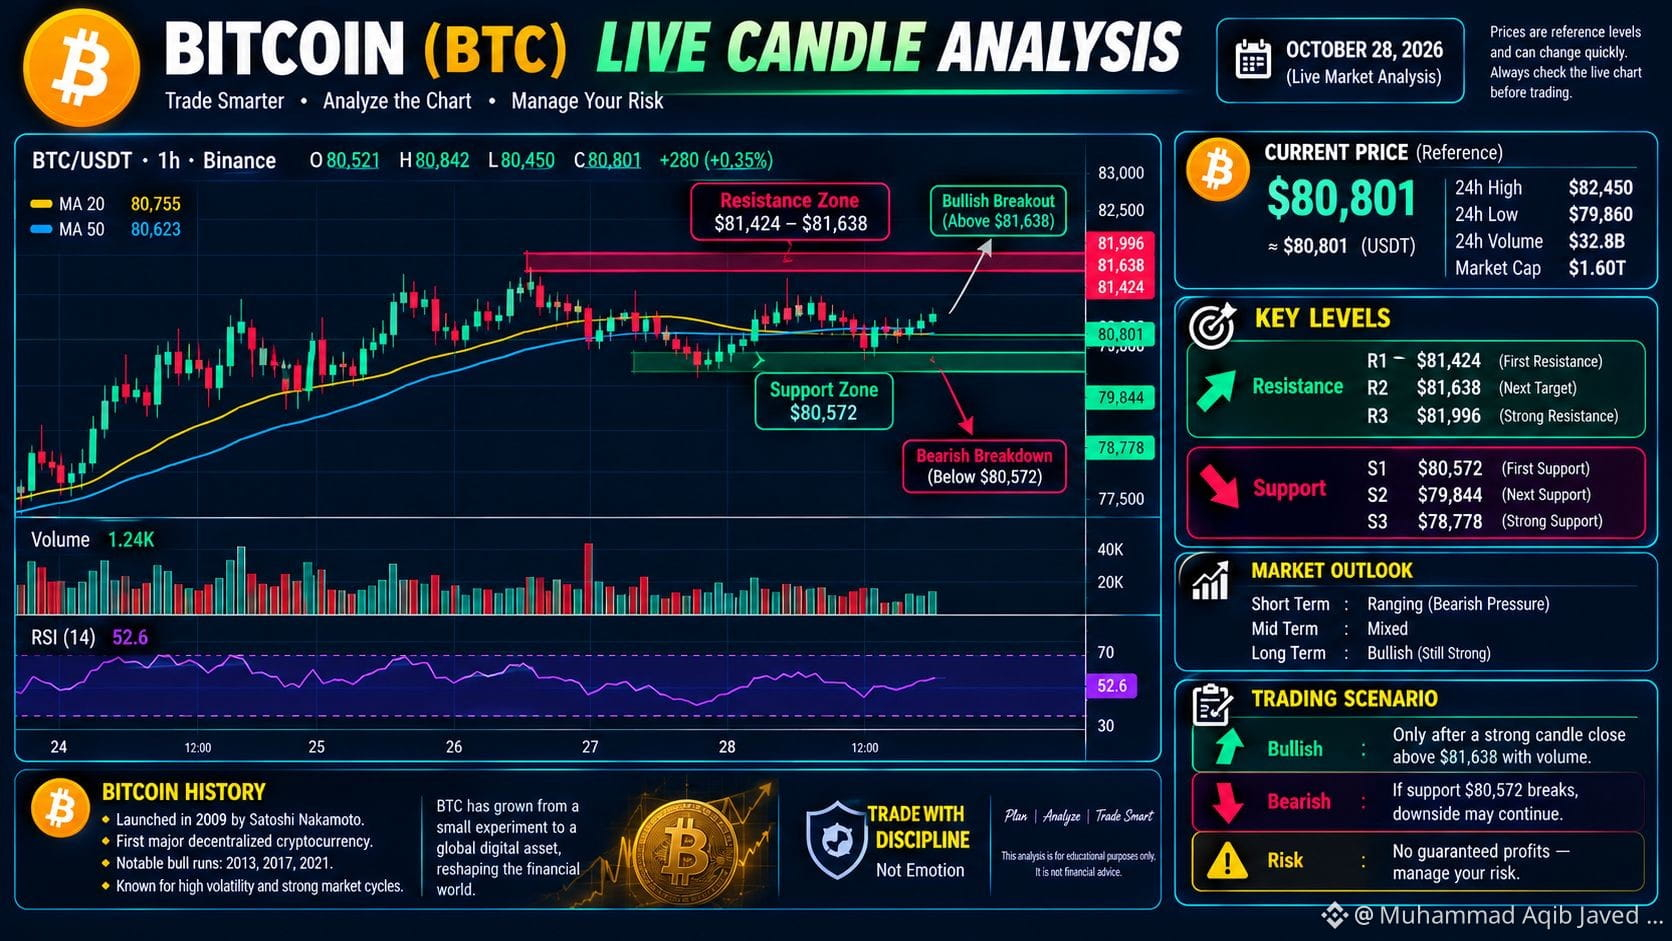
🚨 Bitcoin (BTC) Live Analysis | October 28, 2026: Bitcoin is trading near $80,800, with the market showing mixed momentum after recent selling pressure. The key support zone is around $80,570, followed by $79,840 and $78,780, while resistance stands near $81,420–$81,640. If BTC breaks above $81,640 with a strong candle close and rising volume, buyers may target $82,000 and higher levels; however, if price falls below $80,570, further downside toward $79,840 or $78,780 is possible. Bitcoin launched in 2009 under the name Satoshi Nakamoto and became the world’s first widely adopted decentralized cryptocurrency. Its historic bull runs in 2013, 2017 and 2021 attracted traders worldwide, while its sharp corrections demonstrated the importance of risk management. 📈 Trading Strategy: Avoid entering just because the price is moving. Wait for a confirmed breakout or a clear bounce from support, use a stop-loss, and manage position size carefully. Bitcoin may present opportunities in either direction, but no setup guarantees profit. Always verify current market prices before placing a trade. #bitcoin #BTC #LiveAnalysis #CryptoTrading. #CandlestickAnalysis
$BTC
🚨 Bitcoin (BTC) Live Analysis | October 28, 2026: Bitcoin is trading near $80,800, with the market showing mixed momentum after recent selling pressure. The key support zone is around $80,570, followed by $79,840 and $78,780, while resistance stands near $81,420–$81,640. If BTC breaks above $81,640 with a strong candle close and rising volume, buyers may target $82,000 and higher levels; however, if price falls below $80,570, further downside toward $79,840 or $78,780 is possible. Bitcoin launched in 2009 under the name Satoshi Nakamoto and became the world’s first widely adopted decentralized cryptocurrency. Its historic bull runs in 2013, 2017 and 2021 attracted traders worldwide, while its sharp corrections demonstrated the importance of risk management. 📈 Trading Strategy: Avoid entering just because the price is moving. Wait for a confirmed breakout or a clear bounce from support, use a stop-loss, and manage position size carefully. Bitcoin may present opportunities in either direction, but no setup guarantees profit. Always verify current market prices before placing a trade. #bitcoin #BTC #LiveAnalysis #CryptoTrading. #CandlestickAnalysis
🚨 Bitcoin (BTC) Live Analysis | October 28, 2026: Bitcoin is trading near $80,800, with the market showing mixed momentum after recent selling pressure. The key support zone is around $80,570, followed by $79,840 and $78,780, while resistance stands near $81,420–$81,640. If BTC breaks above $81,640 with a strong candle close and rising volume, buyers may target $82,000 and higher levels; however, if price falls below $80,570, further downside toward $79,840 or $78,780 is possible. Bitcoin launched in 2009 under the name Satoshi Nakamoto and became the world’s first widely adopted decentralized cryptocurrency. Its historic bull runs in 2013, 2017 and 2021 attracted traders worldwide, while its sharp corrections demonstrated the importance of risk management. 📈 Trading Strategy: Avoid entering just because the price is moving. Wait for a confirmed breakout or a clear bounce from support, use a stop-loss, and manage position size carefully. Bitcoin may present opportunities in either direction, but no setup guarantees profit. Always verify current market prices before placing a trade. #bitcoin #BTC #LiveAnalysis #CryptoTrading. #CandlestickAnalysis
70
$AIN
{future}(AINUSDT)
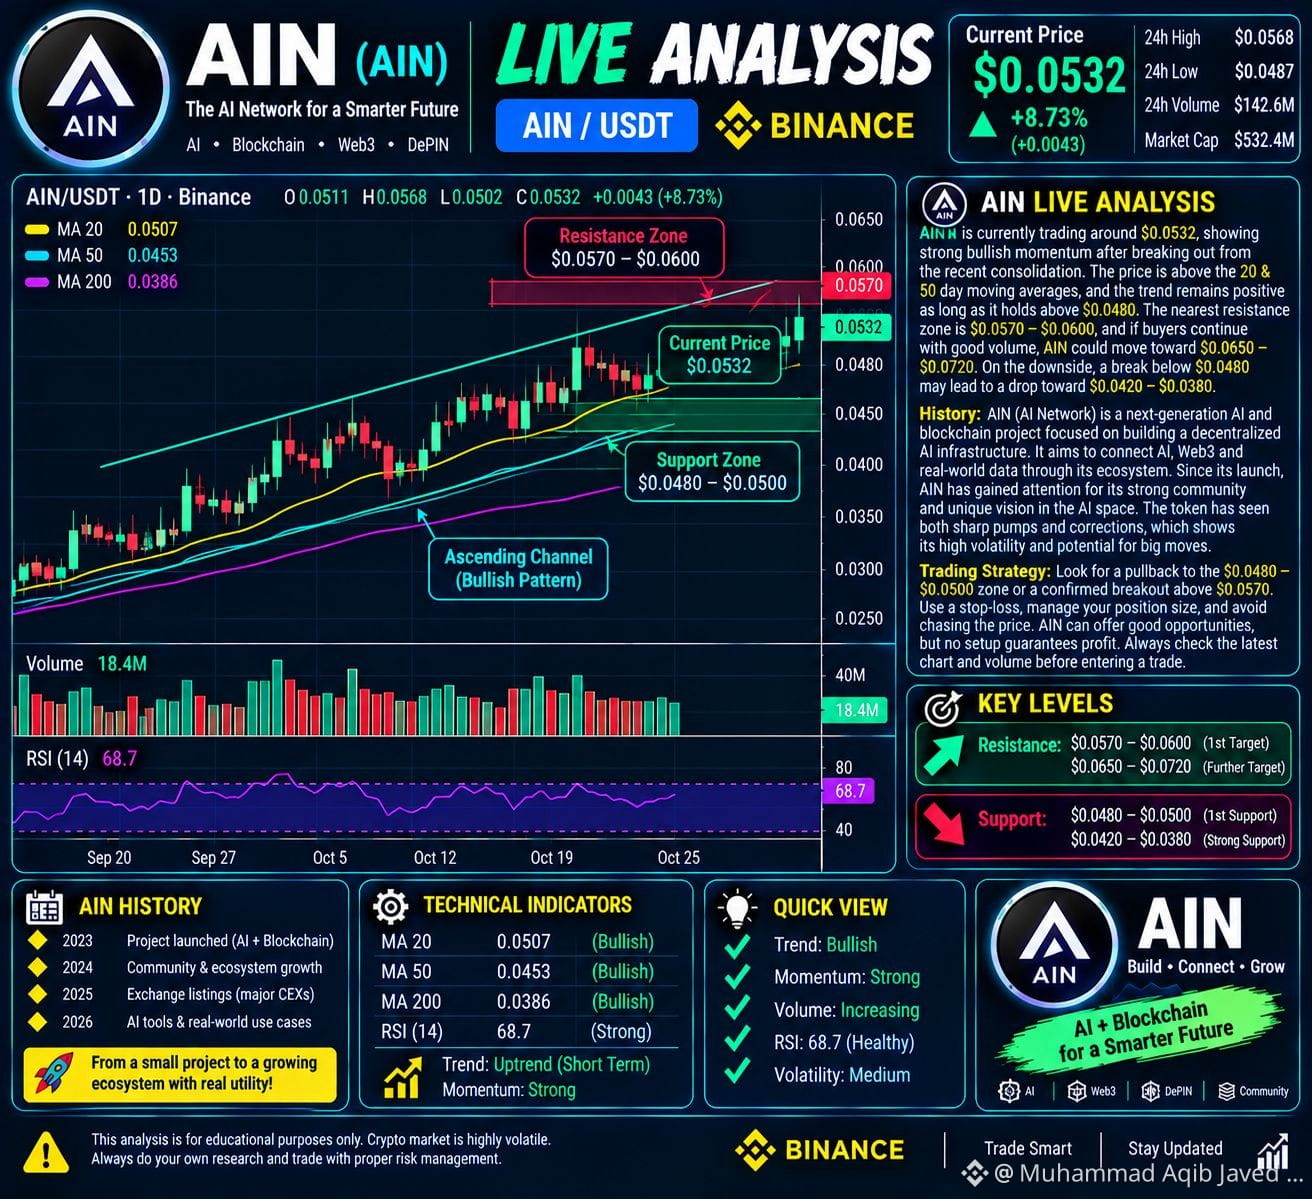
🚨 AIN (AI Network) Live Analysis | October 28, 2026: AIN is trading around $0.0116 in the latest available market data, with price action showing a relatively tight range and low trading volume, so confirmation is important before entering a trade. The immediate support zone is near $0.0114, while resistance lies around $0.0118–$0.0120; a stronger breakout above this area with rising volume could open a move toward $0.0125–$0.0129, whereas a drop below support may signal further weakness. AI Network is a blockchain-based cloud-computing project designed to support an open ecosystem of AI applications, connecting computing resources and developers through its network. Historically, AIN has experienced significant price swings and once reached an all-time high near $0.2648, showing both its volatility and the risks of buying after sharp moves. 📈 Trading Strategy: Watch for a confirmed candle close above resistance with increased volume, or wait for a clear bounce from support; set a stop-loss according to your risk tolerance and avoid chasing sudden pumps. AIN may offer trading opportunities, but low liquidity can increase slippage, and profits are never guaranteed. Always verify the correct AIN token and latest chart before trading. #AIN #CryptoAnalysis #LiveTrading #AiNarratives #BitmineAdds10452ETH
$AIN
🚨 AIN (AI Network) Live Analysis | October 28, 2026: AIN is trading around $0.0116 in the latest available market data, with price action showing a relatively tight range and low trading volume, so confirmation is important before entering a trade. The immediate support zone is near $0.0114, while resistance lies around $0.0118–$0.0120; a stronger breakout above this area with rising volume could open a move toward $0.0125–$0.0129, whereas a drop below support may signal further weakness. AI Network is a blockchain-based cloud-computing project designed to support an open ecosystem of AI applications, connecting computing resources and developers through its network. Historically, AIN has experienced significant price swings and once reached an all-time high near $0.2648, showing both its volatility and the risks of buying after sharp moves. 📈 Trading Strategy: Watch for a confirmed candle close above resistance with increased volume, or wait for a clear bounce from support; set a stop-loss according to your risk tolerance and avoid chasing sudden pumps. AIN may offer trading opportunities, but low liquidity can increase slippage, and profits are never guaranteed. Always verify the correct AIN token and latest chart before trading. #AIN #CryptoAnalysis #LiveTrading #AiNarratives #BitmineAdds10452ETH
🚨 AIN (AI Network) Live Analysis | October 28, 2026: AIN is trading around $0.0116 in the latest available market data, with price action showing a relatively tight range and low trading volume, so confirmation is important before entering a trade. The immediate support zone is near $0.0114, while resistance lies around $0.0118–$0.0120; a stronger breakout above this area with rising volume could open a move toward $0.0125–$0.0129, whereas a drop below support may signal further weakness. AI Network is a blockchain-based cloud-computing project designed to support an open ecosystem of AI applications, connecting computing resources and developers through its network. Historically, AIN has experienced significant price swings and once reached an all-time high near $0.2648, showing both its volatility and the risks of buying after sharp moves. 📈 Trading Strategy: Watch for a confirmed candle close above resistance with increased volume, or wait for a clear bounce from support; set a stop-loss according to your risk tolerance and avoid chasing sudden pumps. AIN may offer trading opportunities, but low liquidity can increase slippage, and profits are never guaranteed. Always verify the correct AIN token and latest chart before trading. #AIN #CryptoAnalysis #LiveTrading #AiNarratives #BitmineAdds10452ETH
618
$BTC
{spot}(BTCUSDT)
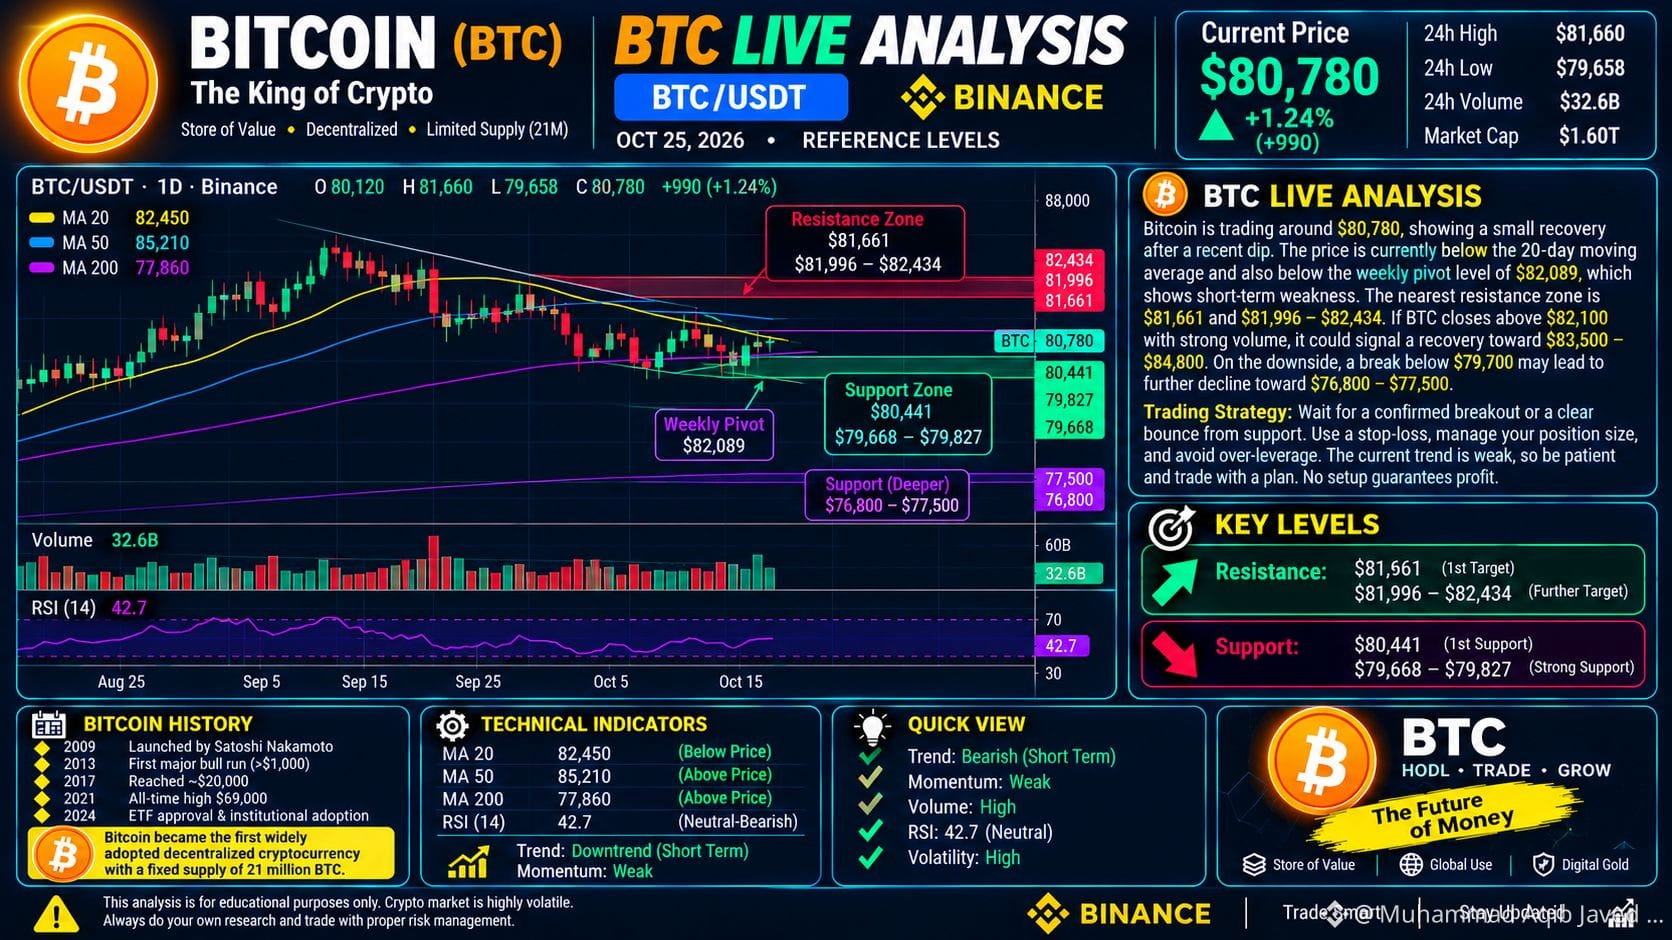
🚨 Bitcoin (BTC) Live Analysis | October 25, 2026: Bitcoin is trading near $80,700, and the market is at an important decision point after a recent pullback. The nearest support zone is around $80,450–$79,700, while resistance sits near $81,700–$82,700. If BTC forms a strong bullish candle and closes above $81,700 with rising volume, buyers may push the price toward $82,700 and potentially $84,200; however, a breakdown below $79,700 could open the door to further downside. Bitcoin launched in 2009 under the name Satoshi Nakamoto and became the first widely adopted decentralized cryptocurrency. Its history includes major bull runs in 2013, 2017 and 2021, followed by sharp corrections that show why risk management matters. 📈 Trading Strategy: Wait for a confirmed breakout or a clear bounce from support before considering an entry, set a stop-loss, and avoid chasing sudden price movements. BTC offers opportunities for short-term traders, but no trade guarantees profit—always check the latest candles before entering. #BTC #Bitcoin #LiveAnalysis #CryptoTrading #TechnicalAnalysis
$BTC
🚨 Bitcoin (BTC) Live Analysis | October 25, 2026: Bitcoin is trading near $80,700, and the market is at an important decision point after a recent pullback. The nearest support zone is around $80,450–$79,700, while resistance sits near $81,700–$82,700. If BTC forms a strong bullish candle and closes above $81,700 with rising volume, buyers may push the price toward $82,700 and potentially $84,200; however, a breakdown below $79,700 could open the door to further downside. Bitcoin launched in 2009 under the name Satoshi Nakamoto and became the first widely adopted decentralized cryptocurrency. Its history includes major bull runs in 2013, 2017 and 2021, followed by sharp corrections that show why risk management matters. 📈 Trading Strategy: Wait for a confirmed breakout or a clear bounce from support before considering an entry, set a stop-loss, and avoid chasing sudden price movements. BTC offers opportunities for short-term traders, but no trade guarantees profit—always check the latest candles before entering. #BTC #Bitcoin #LiveAnalysis #CryptoTrading #TechnicalAnalysis
🚨 Bitcoin (BTC) Live Analysis | October 25, 2026: Bitcoin is trading near $80,700, and the market is at an important decision point after a recent pullback. The nearest support zone is around $80,450–$79,700, while resistance sits near $81,700–$82,700. If BTC forms a strong bullish candle and closes above $81,700 with rising volume, buyers may push the price toward $82,700 and potentially $84,200; however, a breakdown below $79,700 could open the door to further downside. Bitcoin launched in 2009 under the name Satoshi Nakamoto and became the first widely adopted decentralized cryptocurrency. Its history includes major bull runs in 2013, 2017 and 2021, followed by sharp corrections that show why risk management matters. 📈 Trading Strategy: Wait for a confirmed breakout or a clear bounce from support before considering an entry, set a stop-loss, and avoid chasing sudden price movements. BTC offers opportunities for short-term traders, but no trade guarantees profit—always check the latest candles before entering. #BTC #Bitcoin #LiveAnalysis #CryptoTrading #TechnicalAnalysis
73
$IRYS
{future}(IRYSUSDT)
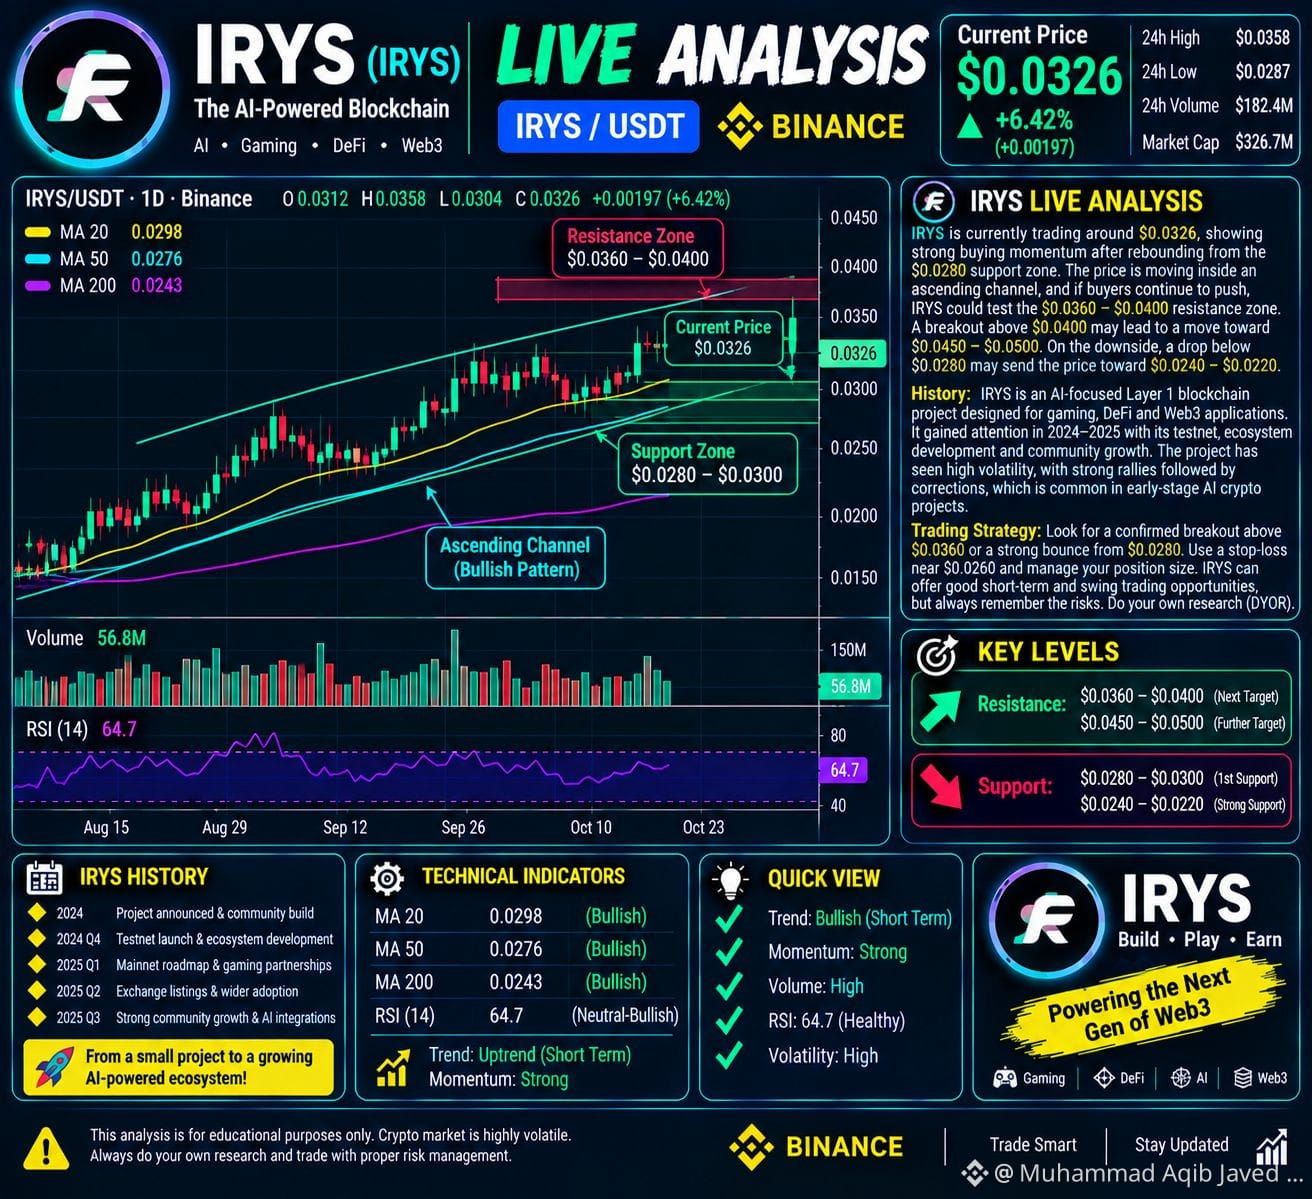
🚨 IRYS Coin Live Analysis | October 24, 2026: Irys (IRYS) is attracting major market attention after an extraordinary price surge, with recent market data showing a price near $0.079 and a sharp 24-hour gain. However, IRYS has also experienced extreme volatility, recently reaching an all-time high near $0.315 before pulling back heavily, making this a high-risk trading opportunity. Irys is a Layer-1 datachain project designed to combine on-chain data storage with smart-contract execution through IrysVM, giving it a role in the growing blockchain infrastructure ecosystem. 📈 Trading Strategy: Avoid buying after a sudden pump without confirmation. Watch the latest 15-minute and 1-hour candlesticks for a stable support level, stronger buying volume, and a confirmed breakout before considering an entry; if selling pressure continues, the price could fall further. Traders should use a stop-loss, avoid excessive leverage, and never invest money they cannot afford to lose. IRYS may offer opportunities for experienced traders, but a big price rise does not guarantee another rally. Always verify the live price on your exchange before trading. #İRYS #Irys #CryptoAnalysis #altcoins #cryptotrading
$IRYS
🚨 IRYS Coin Live Analysis | October 24, 2026: Irys (IRYS) is attracting major market attention after an extraordinary price surge, with recent market data showing a price near $0.079 and a sharp 24-hour gain. However, IRYS has also experienced extreme volatility, recently reaching an all-time high near $0.315 before pulling back heavily, making this a high-risk trading opportunity. Irys is a Layer-1 datachain project designed to combine on-chain data storage with smart-contract execution through IrysVM, giving it a role in the growing blockchain infrastructure ecosystem. 📈 Trading Strategy: Avoid buying after a sudden pump without confirmation. Watch the latest 15-minute and 1-hour candlesticks for a stable support level, stronger buying volume, and a confirmed breakout before considering an entry; if selling pressure continues, the price could fall further. Traders should use a stop-loss, avoid excessive leverage, and never invest money they cannot afford to lose. IRYS may offer opportunities for experienced traders, but a big price rise does not guarantee another rally. Always verify the live price on your exchange before trading. #İRYS #Irys #CryptoAnalysis #altcoins #cryptotrading
🚨 IRYS Coin Live Analysis | October 24, 2026: Irys (IRYS) is attracting major market attention after an extraordinary price surge, with recent market data showing a price near $0.079 and a sharp 24-hour gain. However, IRYS has also experienced extreme volatility, recently reaching an all-time high near $0.315 before pulling back heavily, making this a high-risk trading opportunity. Irys is a Layer-1 datachain project designed to combine on-chain data storage with smart-contract execution through IrysVM, giving it a role in the growing blockchain infrastructure ecosystem. 📈 Trading Strategy: Avoid buying after a sudden pump without confirmation. Watch the latest 15-minute and 1-hour candlesticks for a stable support level, stronger buying volume, and a confirmed breakout before considering an entry; if selling pressure continues, the price could fall further. Traders should use a stop-loss, avoid excessive leverage, and never invest money they cannot afford to lose. IRYS may offer opportunities for experienced traders, but a big price rise does not guarantee another rally. Always verify the live price on your exchange before trading. #İRYS #Irys #CryptoAnalysis #altcoins #cryptotrading
74
$BTC
{spot}(BTCUSDT)
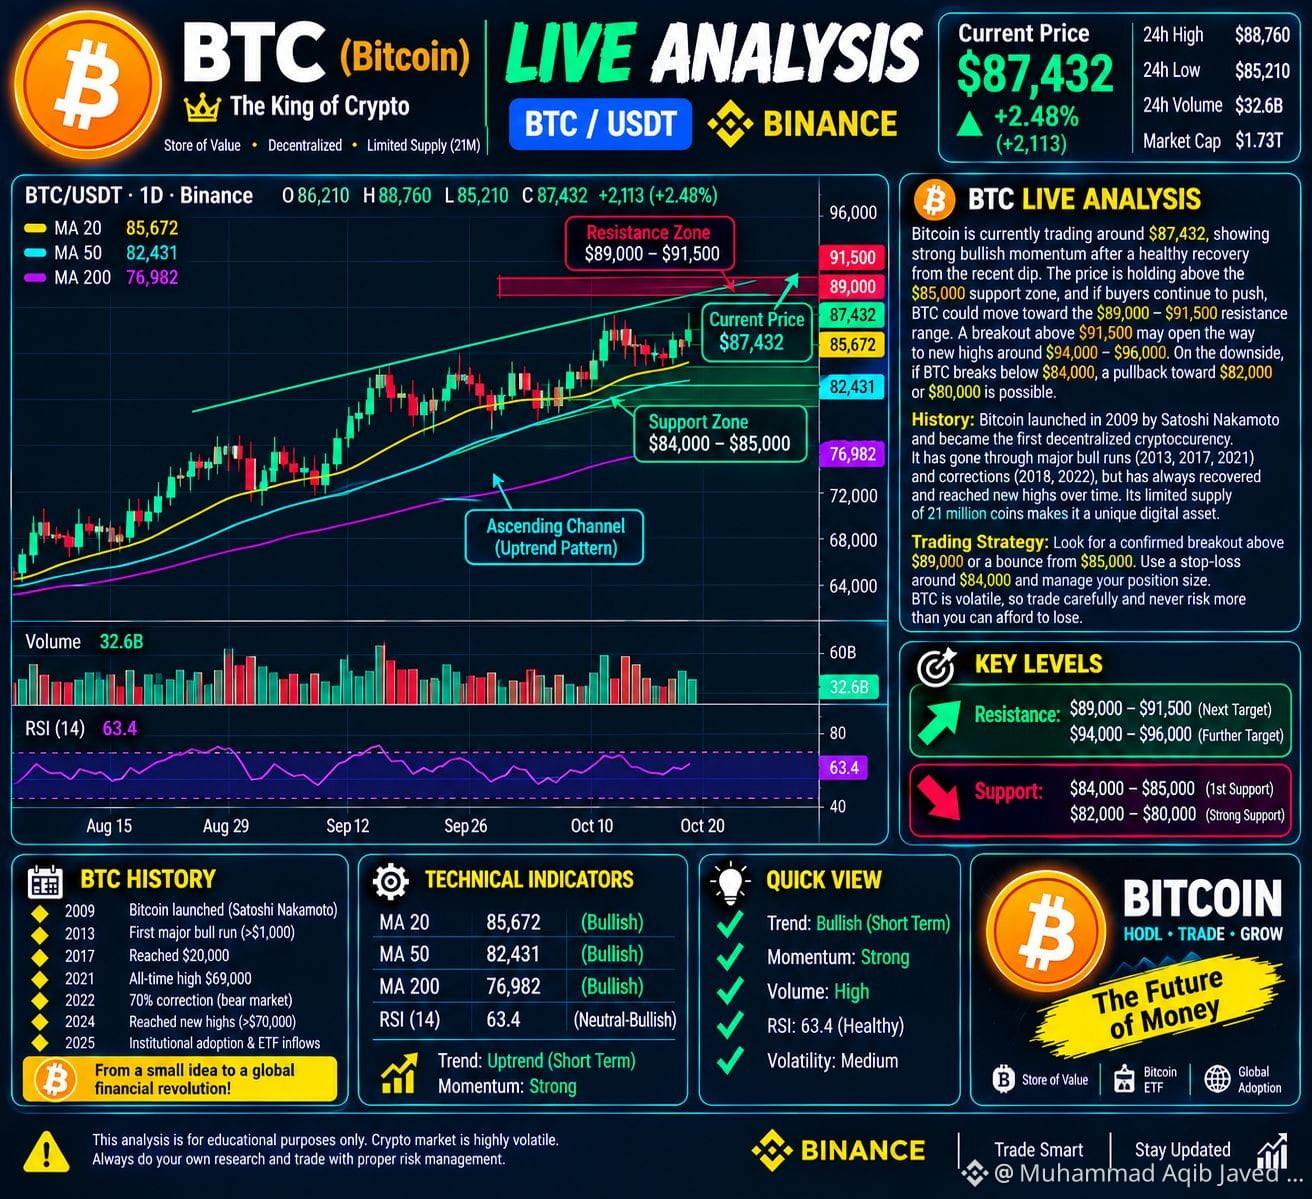
🚀 Bitcoin (BTC) Live Analysis | October 23, 2026: Bitcoin is trading around $81,800, with the market showing mixed signals after a recent pullback from the $84,000 area. Key support lies near $80,700–$79,700, while resistance is around $82,300–$84,000. If BTC forms a strong bullish candle and closes above $82,300 with increasing volume, buyers may push toward $84,000 and potentially $87,500; however, a breakdown below $80,700 could expose the $79,700–$78,400 zone. Bitcoin launched in 2009 under the name Satoshi Nakamoto and became the world’s first widely adopted decentralized cryptocurrency. Its history includes major bull runs in 2013, 2017 and 2021, alongside sharp corrections that remind traders how quickly market sentiment can change. Trading Strategy: Avoid chasing the price; wait for a confirmed breakout or a clear bounce from support, use a stop-loss, and manage risk carefully. Bitcoin offers trading opportunities, but no setup guarantees profit. Always check the latest BTC/USDT candles before entering a trade. 📊 #BTC #bitcoin #LiveAnalysis #cryptotrading #TechnicalAnalysis
$BTC
🚀 Bitcoin (BTC) Live Analysis | October 23, 2026: Bitcoin is trading around $81,800, with the market showing mixed signals after a recent pullback from the $84,000 area. Key support lies near $80,700–$79,700, while resistance is around $82,300–$84,000. If BTC forms a strong bullish candle and closes above $82,300 with increasing volume, buyers may push toward $84,000 and potentially $87,500; however, a breakdown below $80,700 could expose the $79,700–$78,400 zone. Bitcoin launched in 2009 under the name Satoshi Nakamoto and became the world’s first widely adopted decentralized cryptocurrency. Its history includes major bull runs in 2013, 2017 and 2021, alongside sharp corrections that remind traders how quickly market sentiment can change. Trading Strategy: Avoid chasing the price; wait for a confirmed breakout or a clear bounce from support, use a stop-loss, and manage risk carefully. Bitcoin offers trading opportunities, but no setup guarantees profit. Always check the latest BTC/USDT candles before entering a trade. 📊 #BTC #bitcoin #LiveAnalysis #cryptotrading #TechnicalAnalysis
🚀 Bitcoin (BTC) Live Analysis | October 23, 2026: Bitcoin is trading around $81,800, with the market showing mixed signals after a recent pullback from the $84,000 area. Key support lies near $80,700–$79,700, while resistance is around $82,300–$84,000. If BTC forms a strong bullish candle and closes above $82,300 with increasing volume, buyers may push toward $84,000 and potentially $87,500; however, a breakdown below $80,700 could expose the $79,700–$78,400 zone. Bitcoin launched in 2009 under the name Satoshi Nakamoto and became the world’s first widely adopted decentralized cryptocurrency. Its history includes major bull runs in 2013, 2017 and 2021, alongside sharp corrections that remind traders how quickly market sentiment can change. Trading Strategy: Avoid chasing the price; wait for a confirmed breakout or a clear bounce from support, use a stop-loss, and manage risk carefully. Bitcoin offers trading opportunities, but no setup guarantees profit. Always check the latest BTC/USDT candles before entering a trade. 📊 #BTC #bitcoin #LiveAnalysis #cryptotrading #TechnicalAnalysis
52
$SIREN
{future}(SIRENUSDT)
SIREN Coin Live Analysis — October 22, 2026
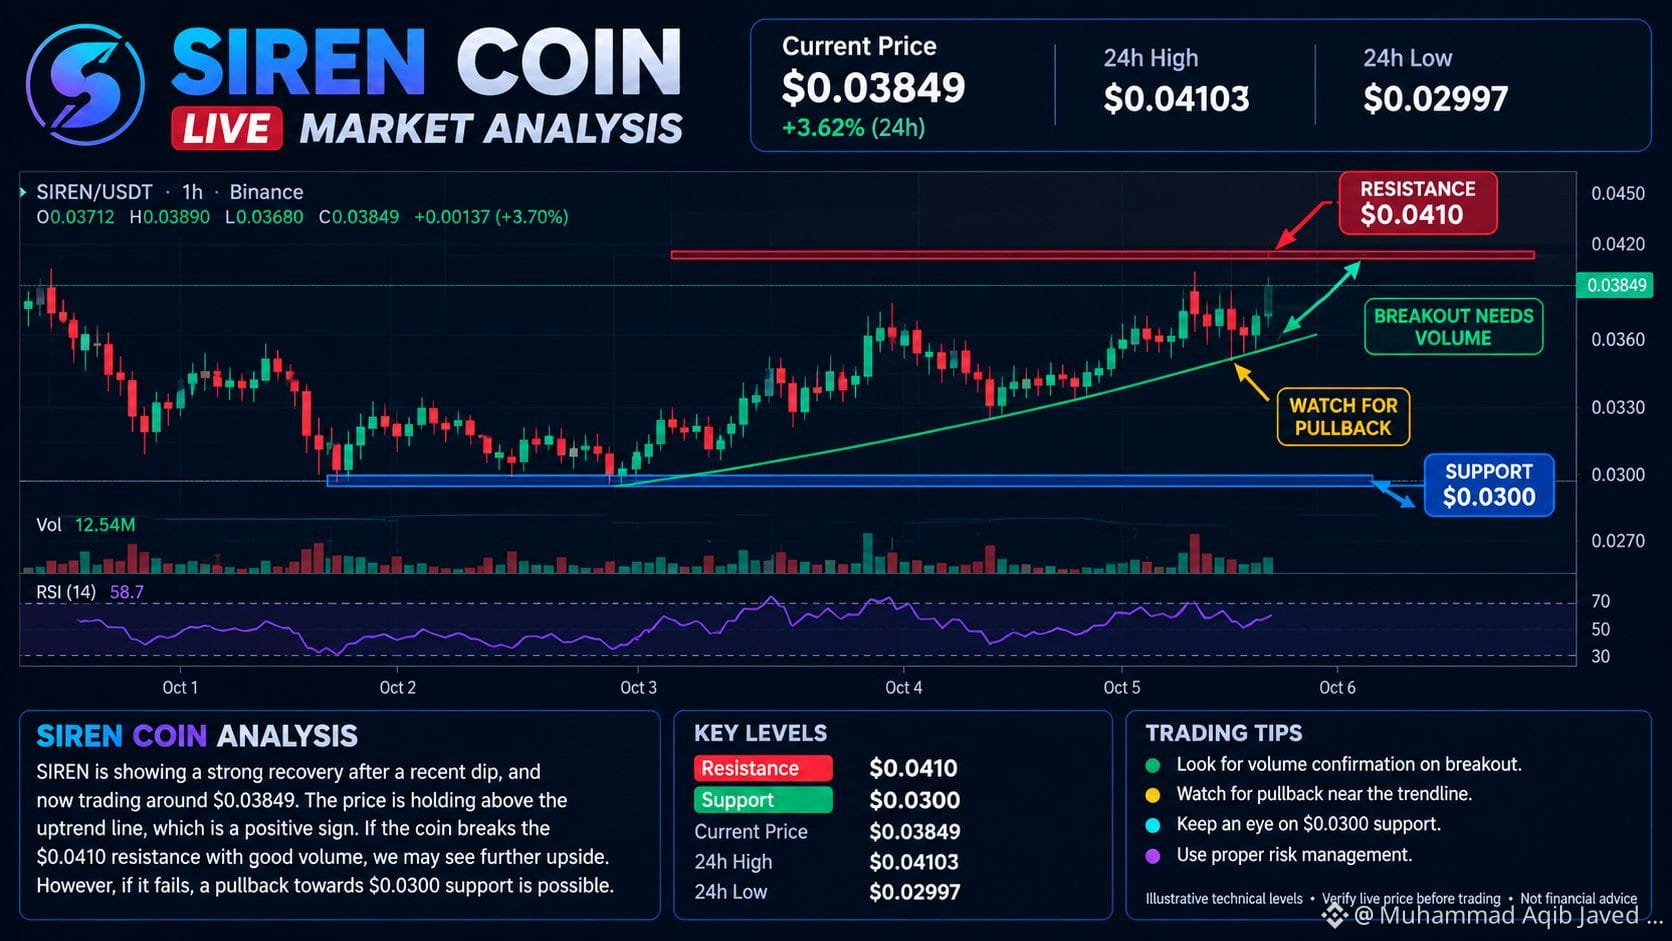
According to the latest available market data, SIREN is trading around $0.03849, with a reported 24-hour high of $0.04103 and low of $0.02997. SIREN has shown volatile price movements, so traders should watch the $0.0410 resistance and $0.0300 support zones. A strong candle close above resistance with rising trading volume could indicate further bullish momentum, while rejection near resistance may lead to a pullback. If the price falls below support, selling pressure could increase. Wait for candle confirmation before entering a trade, use a stop-loss, and avoid risking money you cannot afford to lose. These levels are reference points, not guaranteed predictions.
#EarningsSeason #siren #OCCIssuesFirstFinalRuleUnderGENIUSAct #BTC #SolanaSetToActivateAlpenglowToday
$SIREN
SIREN Coin Live Analysis — October 22, 2026
According to the latest available market data, SIREN is trading around $0.03849, with a reported 24-hour high of $0.04103 and low of $0.02997. SIREN has shown volatile price movements, so traders should watch the $0.0410 resistance and $0.0300 support zones. A strong candle close above resistance with rising trading volume could indicate further bullish momentum, while rejection near resistance may lead to a pullback. If the price falls below support, selling pressure could increase. Wait for candle confirmation before entering a trade, use a stop-loss, and avoid risking money you cannot afford to lose. These levels are reference points, not guaranteed predictions.
#EarningsSeason #siren #OCCIssuesFirstFinalRuleUnderGENIUSAct #BTC #SolanaSetToActivateAlpenglowToday
SIREN Coin Live Analysis — October 22, 2026
According to the latest available market data, SIREN is trading around $0.03849, with a reported 24-hour high of $0.04103 and low of $0.02997. SIREN has shown volatile price movements, so traders should watch the $0.0410 resistance and $0.0300 support zones. A strong candle close above resistance with rising trading volume could indicate further bullish momentum, while rejection near resistance may lead to a pullback. If the price falls below support, selling pressure could increase. Wait for candle confirmation before entering a trade, use a stop-loss, and avoid risking money you cannot afford to lose. These levels are reference points, not guaranteed predictions.
#EarningsSeason #siren #OCCIssuesFirstFinalRuleUnderGENIUSAct #BTC #SolanaSetToActivateAlpenglowToday
604
$SIREN
{future}(SIRENUSDT)
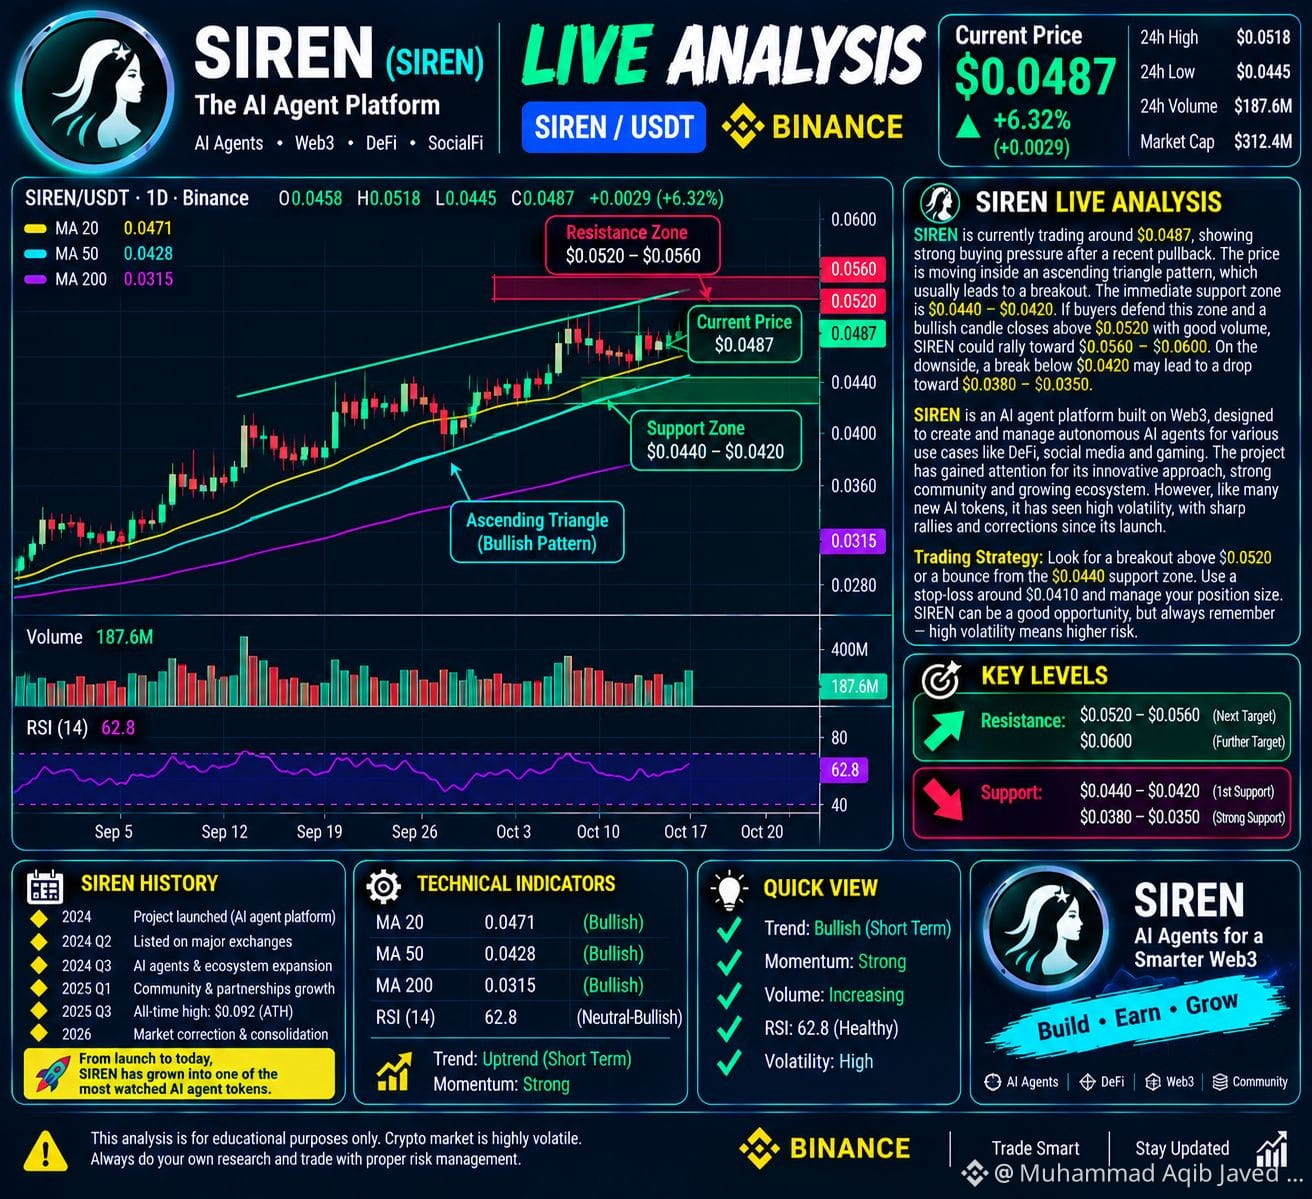
🚨 SIREN Coin Live Analysis | October 20, 2026: SIREN is showing extreme volatility after a sharp sell-off, so traders should watch for confirmation before entering a trade. Recent market data shows heavy price swings, with support near $0.022–$0.024 and potential resistance around $0.026–$0.030; these levels can change quickly across exchanges. SIREN is a BNB Chain token associated with an AI-focused ecosystem and trading-analysis tools, and its history includes dramatic rallies followed by steep corrections—meaning opportunity comes with significant risk. 📈 Trading Setup: A bullish candle closing above $0.026 with stronger volume could suggest a recovery attempt, while a break below $0.022 may signal further downside. Avoid chasing sudden green candles; wait for confirmation, set a stop-loss, and risk only what you can afford to lose. SIREN may attract short-term traders, but no setup guarantees profit. DYOR before trading. #siren #CryptoAnalysis #Altcoins #TradingStrategy #JapanFSAPublishesOnChainFinanceForumMinutes
$SIREN
🚨 SIREN Coin Live Analysis | October 20, 2026: SIREN is showing extreme volatility after a sharp sell-off, so traders should watch for confirmation before entering a trade. Recent market data shows heavy price swings, with support near $0.022–$0.024 and potential resistance around $0.026–$0.030; these levels can change quickly across exchanges. SIREN is a BNB Chain token associated with an AI-focused ecosystem and trading-analysis tools, and its history includes dramatic rallies followed by steep corrections—meaning opportunity comes with significant risk. 📈 Trading Setup: A bullish candle closing above $0.026 with stronger volume could suggest a recovery attempt, while a break below $0.022 may signal further downside. Avoid chasing sudden green candles; wait for confirmation, set a stop-loss, and risk only what you can afford to lose. SIREN may attract short-term traders, but no setup guarantees profit. DYOR before trading. #siren #CryptoAnalysis #Altcoins #TradingStrategy #JapanFSAPublishesOnChainFinanceForumMinutes
🚨 SIREN Coin Live Analysis | October 20, 2026: SIREN is showing extreme volatility after a sharp sell-off, so traders should watch for confirmation before entering a trade. Recent market data shows heavy price swings, with support near $0.022–$0.024 and potential resistance around $0.026–$0.030; these levels can change quickly across exchanges. SIREN is a BNB Chain token associated with an AI-focused ecosystem and trading-analysis tools, and its history includes dramatic rallies followed by steep corrections—meaning opportunity comes with significant risk. 📈 Trading Setup: A bullish candle closing above $0.026 with stronger volume could suggest a recovery attempt, while a break below $0.022 may signal further downside. Avoid chasing sudden green candles; wait for confirmation, set a stop-loss, and risk only what you can afford to lose. SIREN may attract short-term traders, but no setup guarantees profit. DYOR before trading. #siren #CryptoAnalysis #Altcoins #TradingStrategy #JapanFSAPublishesOnChainFinanceForumMinutes
265
$TAO
{spot}(TAOUSDT)
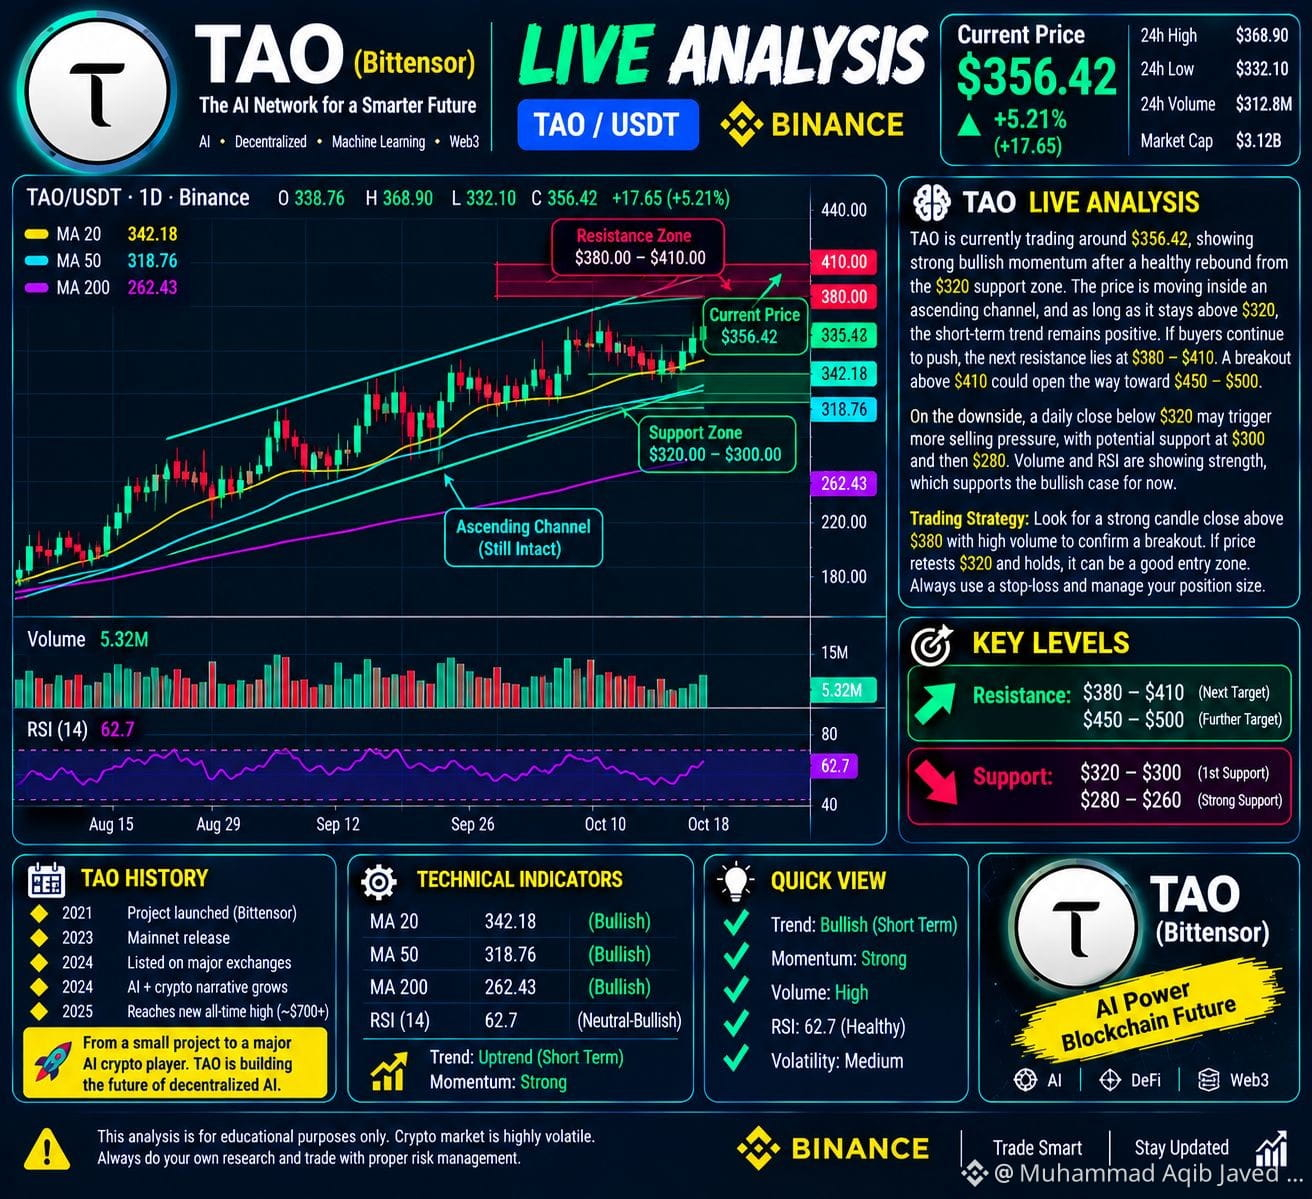
🚀 Bittensor (TAO) Live Analysis | October 20, 2026: TAO is trading near $268, and the market is showing mixed signals after a recent pullback from the $295 area. The immediate support zone is around $263–$265; if buyers defend this level and a bullish candle closes above $275 with strong volume, TAO could attempt a recovery toward $283–$295, while a break below $263 may expose lower support near $254–$248. Bittensor is an AI-focused decentralized network that rewards contributors for providing machine-learning services, placing TAO at the intersection of artificial intelligence and blockchain technology. Since its early development, the project has attracted attention from traders interested in decentralized AI, but its history also includes sharp rallies and substantial corrections. Trading strategy: Watch for a confirmed breakout above $275 or a clear bounce from support before considering an entry; if support fails, avoid rushing into a buy. Set a stop-loss, manage position size, and remember that TAO’s volatility can create both opportunities and losses—no price target guarantees profit. 📊 #TAO #bittensor #AI #CryptoAnalysis #Trading
$TAO
🚀 Bittensor (TAO) Live Analysis | October 20, 2026: TAO is trading near $268, and the market is showing mixed signals after a recent pullback from the $295 area. The immediate support zone is around $263–$265; if buyers defend this level and a bullish candle closes above $275 with strong volume, TAO could attempt a recovery toward $283–$295, while a break below $263 may expose lower support near $254–$248. Bittensor is an AI-focused decentralized network that rewards contributors for providing machine-learning services, placing TAO at the intersection of artificial intelligence and blockchain technology. Since its early development, the project has attracted attention from traders interested in decentralized AI, but its history also includes sharp rallies and substantial corrections. Trading strategy: Watch for a confirmed breakout above $275 or a clear bounce from support before considering an entry; if support fails, avoid rushing into a buy. Set a stop-loss, manage position size, and remember that TAO’s volatility can create both opportunities and losses—no price target guarantees profit. 📊 #TAO #bittensor #AI #CryptoAnalysis #Trading
🚀 Bittensor (TAO) Live Analysis | October 20, 2026: TAO is trading near $268, and the market is showing mixed signals after a recent pullback from the $295 area. The immediate support zone is around $263–$265; if buyers defend this level and a bullish candle closes above $275 with strong volume, TAO could attempt a recovery toward $283–$295, while a break below $263 may expose lower support near $254–$248. Bittensor is an AI-focused decentralized network that rewards contributors for providing machine-learning services, placing TAO at the intersection of artificial intelligence and blockchain technology. Since its early development, the project has attracted attention from traders interested in decentralized AI, but its history also includes sharp rallies and substantial corrections. Trading strategy: Watch for a confirmed breakout above $275 or a clear bounce from support before considering an entry; if support fails, avoid rushing into a buy. Set a stop-loss, manage position size, and remember that TAO’s volatility can create both opportunities and losses—no price target guarantees profit. 📊 #TAO #bittensor #AI #CryptoAnalysis #Trading
136
$BTC
{spot}(BTCUSDT)
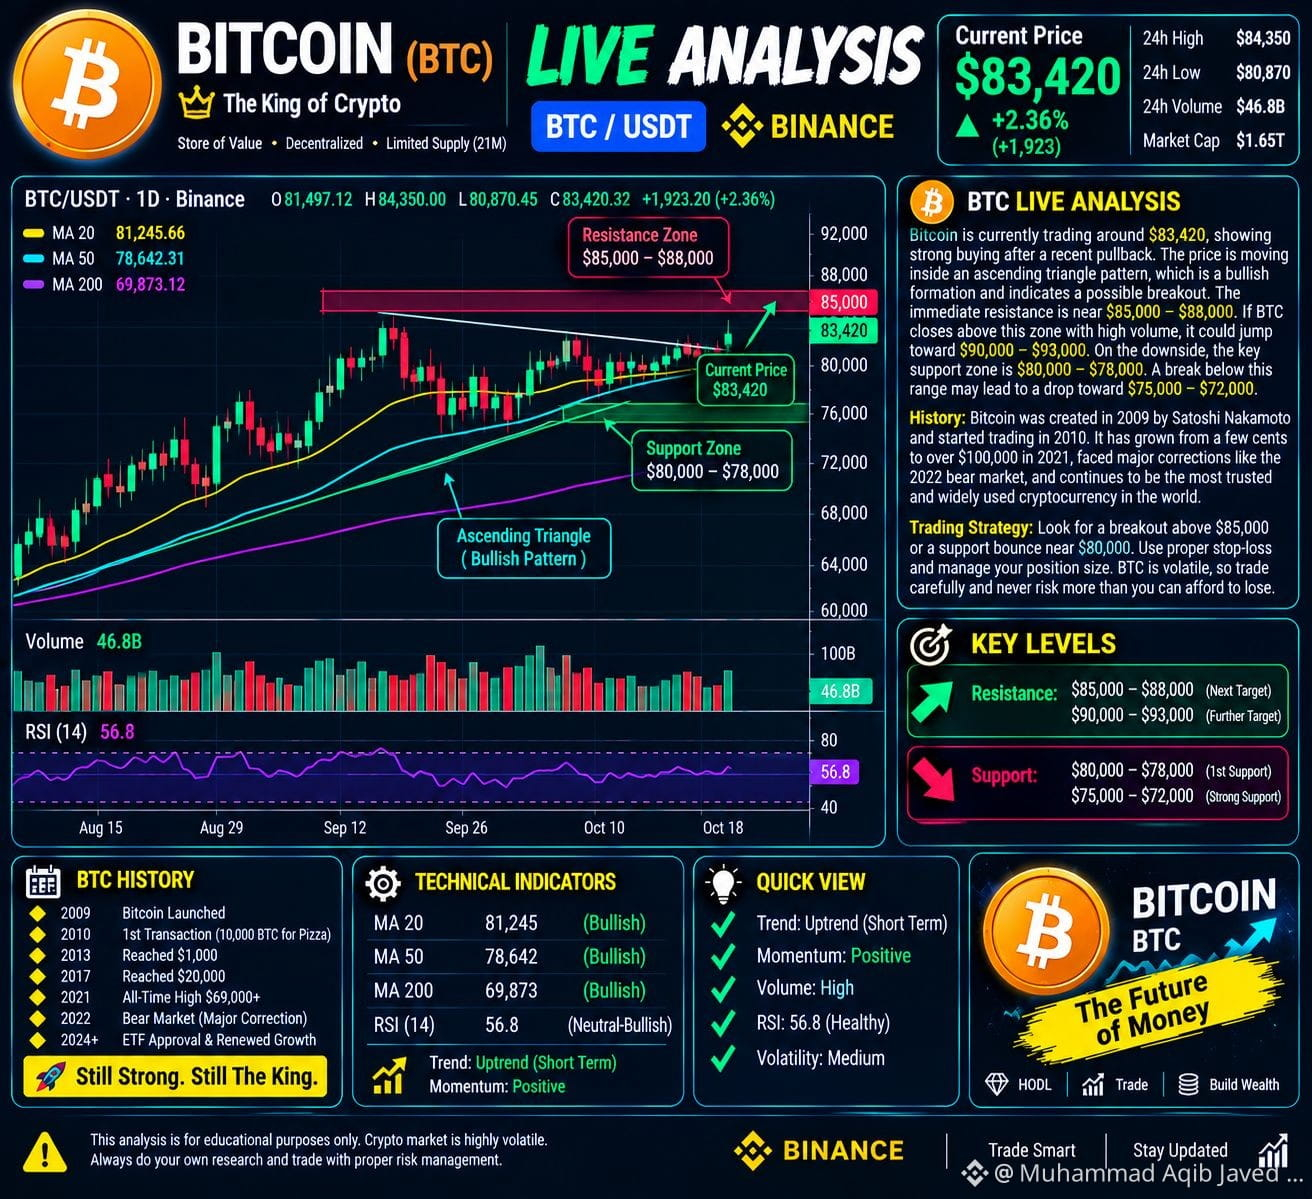
🚀 Bitcoin (BTC) Live Analysis | October 18, 2026: Bitcoin is trading around $81,700, with the market showing mixed signals as buyers attempt to defend the $81,000 support zone. If BTC holds support and a strong bullish candle closes above $82,000–$82,500 with rising volume, a recovery toward $83,500–$84,200 may become possible; a breakout above $84,200 could strengthen bullish momentum. However, if BTC breaks below $81,000, traders should watch the next support zones near $80,000 and $79,700 for potential downside. Bitcoin launched in 2009 under the name Satoshi Nakamoto and became the world’s first widely adopted decentralized cryptocurrency, with a fixed maximum supply of 21 million BTC. Its history includes major rallies, crashes, and recoveries, making it one of the most closely watched assets in crypto. Trading strategy: Avoid entering just because the price is moving; wait for candle confirmation and volume, plan your entry and stop-loss in advance, and manage position size carefully. BTC may offer an opportunity if resistance breaks, but false breakouts happen and profits are never guaranteed. 📈 #bitcoin #BTC #CryptoAnalysis #Trading #CelestiaRises16%To2026High
$BTC
🚀 Bitcoin (BTC) Live Analysis | October 18, 2026: Bitcoin is trading around $81,700, with the market showing mixed signals as buyers attempt to defend the $81,000 support zone. If BTC holds support and a strong bullish candle closes above $82,000–$82,500 with rising volume, a recovery toward $83,500–$84,200 may become possible; a breakout above $84,200 could strengthen bullish momentum. However, if BTC breaks below $81,000, traders should watch the next support zones near $80,000 and $79,700 for potential downside. Bitcoin launched in 2009 under the name Satoshi Nakamoto and became the world’s first widely adopted decentralized cryptocurrency, with a fixed maximum supply of 21 million BTC. Its history includes major rallies, crashes, and recoveries, making it one of the most closely watched assets in crypto. Trading strategy: Avoid entering just because the price is moving; wait for candle confirmation and volume, plan your entry and stop-loss in advance, and manage position size carefully. BTC may offer an opportunity if resistance breaks, but false breakouts happen and profits are never guaranteed. 📈 #bitcoin #BTC #CryptoAnalysis #Trading #CelestiaRises16%To2026High
🚀 Bitcoin (BTC) Live Analysis | October 18, 2026: Bitcoin is trading around $81,700, with the market showing mixed signals as buyers attempt to defend the $81,000 support zone. If BTC holds support and a strong bullish candle closes above $82,000–$82,500 with rising volume, a recovery toward $83,500–$84,200 may become possible; a breakout above $84,200 could strengthen bullish momentum. However, if BTC breaks below $81,000, traders should watch the next support zones near $80,000 and $79,700 for potential downside. Bitcoin launched in 2009 under the name Satoshi Nakamoto and became the world’s first widely adopted decentralized cryptocurrency, with a fixed maximum supply of 21 million BTC. Its history includes major rallies, crashes, and recoveries, making it one of the most closely watched assets in crypto. Trading strategy: Avoid entering just because the price is moving; wait for candle confirmation and volume, plan your entry and stop-loss in advance, and manage position size carefully. BTC may offer an opportunity if resistance breaks, but false breakouts happen and profits are never guaranteed. 📈 #bitcoin #BTC #CryptoAnalysis #Trading #CelestiaRises16%To2026High
67
$AGT
{future}(AGTUSDT)
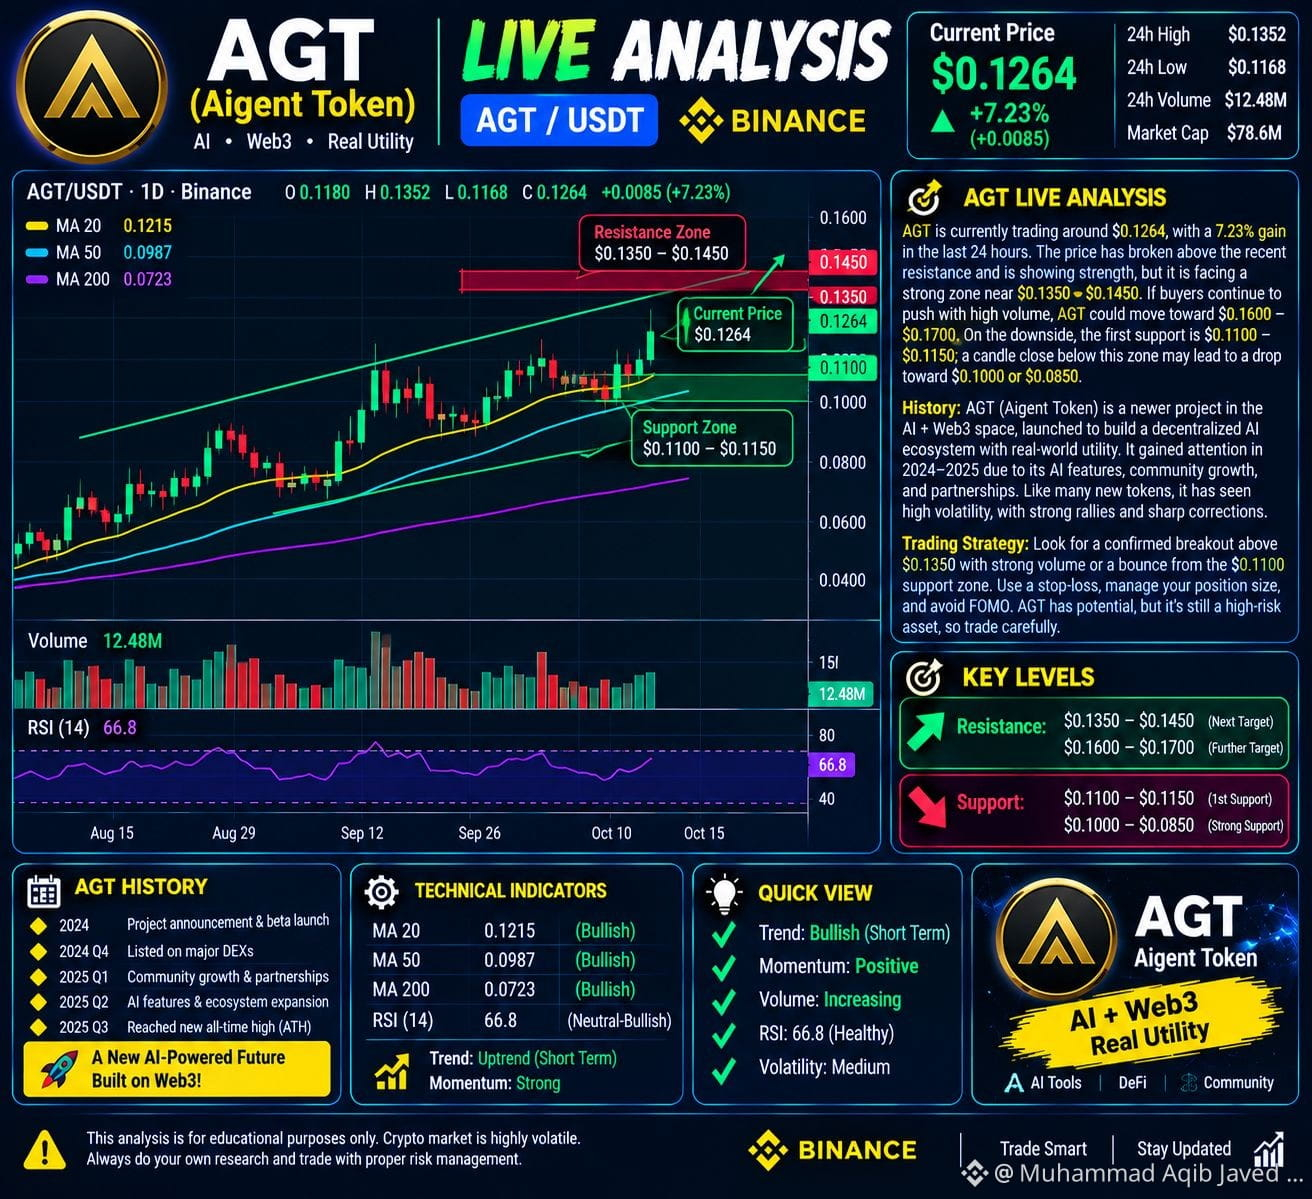
🚀 AIGENT Token (AGT) Live Analysis | October 18, 2026: AIGENT is an AI-focused crypto project aiming to make cryptocurrency easier to understand through community-oriented AI tools and applications. Its official project information highlights custom AI applications, token distribution, and community development, making it a project to research as the AI and blockchain sectors evolve. However, I could not verify a reliable live exchange price or current candlestick data for this specific AGT token, and several different cryptocurrencies use the AGT ticker, so traders should confirm the exact token and contract before making a decision. Trading strategy: Open the correct AGT/USDT chart on your exchange, identify the latest support and resistance levels, and wait for a candle to close above resistance with stronger trading volume before considering a breakout entry; if price loses support, further downside is possible. Check liquidity, contract details, and exchange availability before trading, use a stop-loss, and avoid chasing sudden pumps. AGT may be worth watching, but a verified chart and careful risk management matter more than hype. 📊 #AGT #aigent #AI #CryptoAnalysis #Trading
$AGT
🚀 AIGENT Token (AGT) Live Analysis | October 18, 2026: AIGENT is an AI-focused crypto project aiming to make cryptocurrency easier to understand through community-oriented AI tools and applications. Its official project information highlights custom AI applications, token distribution, and community development, making it a project to research as the AI and blockchain sectors evolve. However, I could not verify a reliable live exchange price or current candlestick data for this specific AGT token, and several different cryptocurrencies use the AGT ticker, so traders should confirm the exact token and contract before making a decision. Trading strategy: Open the correct AGT/USDT chart on your exchange, identify the latest support and resistance levels, and wait for a candle to close above resistance with stronger trading volume before considering a breakout entry; if price loses support, further downside is possible. Check liquidity, contract details, and exchange availability before trading, use a stop-loss, and avoid chasing sudden pumps. AGT may be worth watching, but a verified chart and careful risk management matter more than hype. 📊 #AGT #aigent #AI #CryptoAnalysis #Trading
🚀 AIGENT Token (AGT) Live Analysis | October 18, 2026: AIGENT is an AI-focused crypto project aiming to make cryptocurrency easier to understand through community-oriented AI tools and applications. Its official project information highlights custom AI applications, token distribution, and community development, making it a project to research as the AI and blockchain sectors evolve. However, I could not verify a reliable live exchange price or current candlestick data for this specific AGT token, and several different cryptocurrencies use the AGT ticker, so traders should confirm the exact token and contract before making a decision. Trading strategy: Open the correct AGT/USDT chart on your exchange, identify the latest support and resistance levels, and wait for a candle to close above resistance with stronger trading volume before considering a breakout entry; if price loses support, further downside is possible. Check liquidity, contract details, and exchange availability before trading, use a stop-loss, and avoid chasing sudden pumps. AGT may be worth watching, but a verified chart and careful risk management matter more than hype. 📊 #AGT #aigent #AI #CryptoAnalysis #Trading
680
$SOL
{spot}(SOLUSDT)
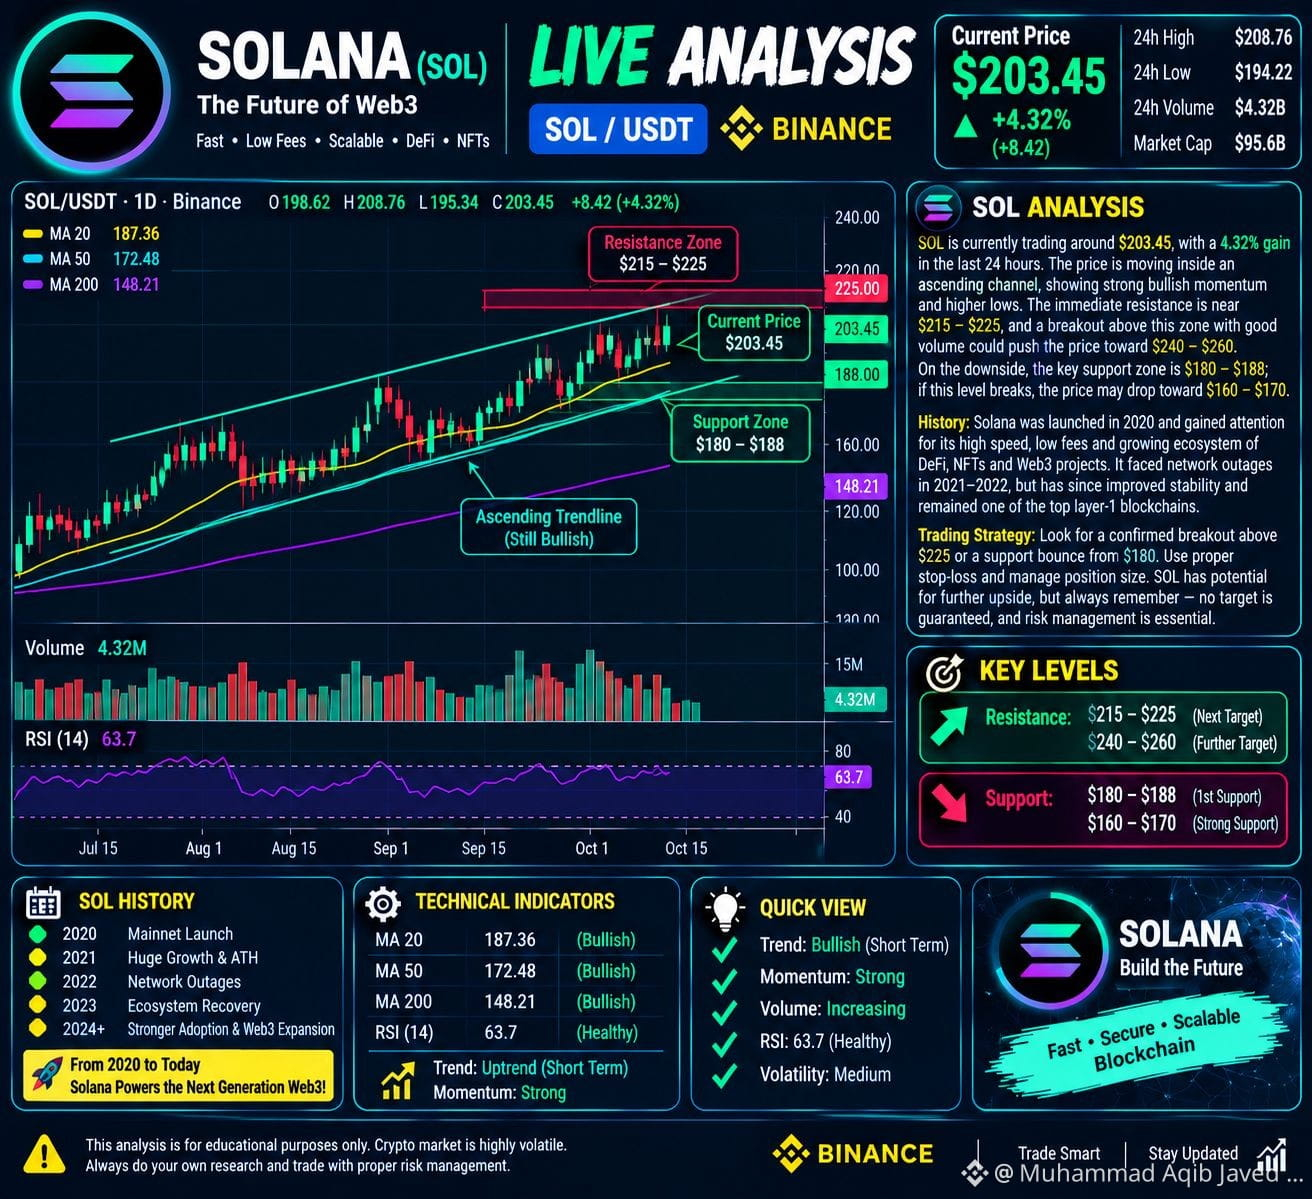
🚀 Solana (SOL) Live Analysis | October 15, 2026: Solana is trading near $103.83 after a recent market pullback, with price action showing weakness in the short term and traders watching the $103.50 support zone closely. If SOL holds this level and forms a strong bullish candle, a recovery toward $106–$108 may be possible; a confirmed breakout above $108.25 could open the way toward $111. However, if price closes below $103.50, further downside toward $101.50 or $98.50 may follow. Solana launched its mainnet in 2020 and became widely known for its fast transactions, relatively low fees, and growing DeFi, NFT, and Web3 ecosystem. Its history includes rapid growth as well as major market corrections, so volatility remains an important risk. Trading setup: Watch for a confirmed support bounce or a high-volume breakout before entering; set a stop-loss and avoid risking money you cannot afford to lose. SOL could present an opportunity if buyers regain control, but no setup guarantees profit. 📈 #solana #sol #CryptoAnalysis #bitcoin #Trading
$SOL
🚀 Solana (SOL) Live Analysis | October 15, 2026: Solana is trading near $103.83 after a recent market pullback, with price action showing weakness in the short term and traders watching the $103.50 support zone closely. If SOL holds this level and forms a strong bullish candle, a recovery toward $106–$108 may be possible; a confirmed breakout above $108.25 could open the way toward $111. However, if price closes below $103.50, further downside toward $101.50 or $98.50 may follow. Solana launched its mainnet in 2020 and became widely known for its fast transactions, relatively low fees, and growing DeFi, NFT, and Web3 ecosystem. Its history includes rapid growth as well as major market corrections, so volatility remains an important risk. Trading setup: Watch for a confirmed support bounce or a high-volume breakout before entering; set a stop-loss and avoid risking money you cannot afford to lose. SOL could present an opportunity if buyers regain control, but no setup guarantees profit. 📈 #solana #sol #CryptoAnalysis #bitcoin #Trading
🚀 Solana (SOL) Live Analysis | October 15, 2026: Solana is trading near $103.83 after a recent market pullback, with price action showing weakness in the short term and traders watching the $103.50 support zone closely. If SOL holds this level and forms a strong bullish candle, a recovery toward $106–$108 may be possible; a confirmed breakout above $108.25 could open the way toward $111. However, if price closes below $103.50, further downside toward $101.50 or $98.50 may follow. Solana launched its mainnet in 2020 and became widely known for its fast transactions, relatively low fees, and growing DeFi, NFT, and Web3 ecosystem. Its history includes rapid growth as well as major market corrections, so volatility remains an important risk. Trading setup: Watch for a confirmed support bounce or a high-volume breakout before entering; set a stop-loss and avoid risking money you cannot afford to lose. SOL could present an opportunity if buyers regain control, but no setup guarantees profit. 📈 #solana #sol #CryptoAnalysis #bitcoin #Trading
1
81
$LUNC
{spot}(LUNCUSDT)
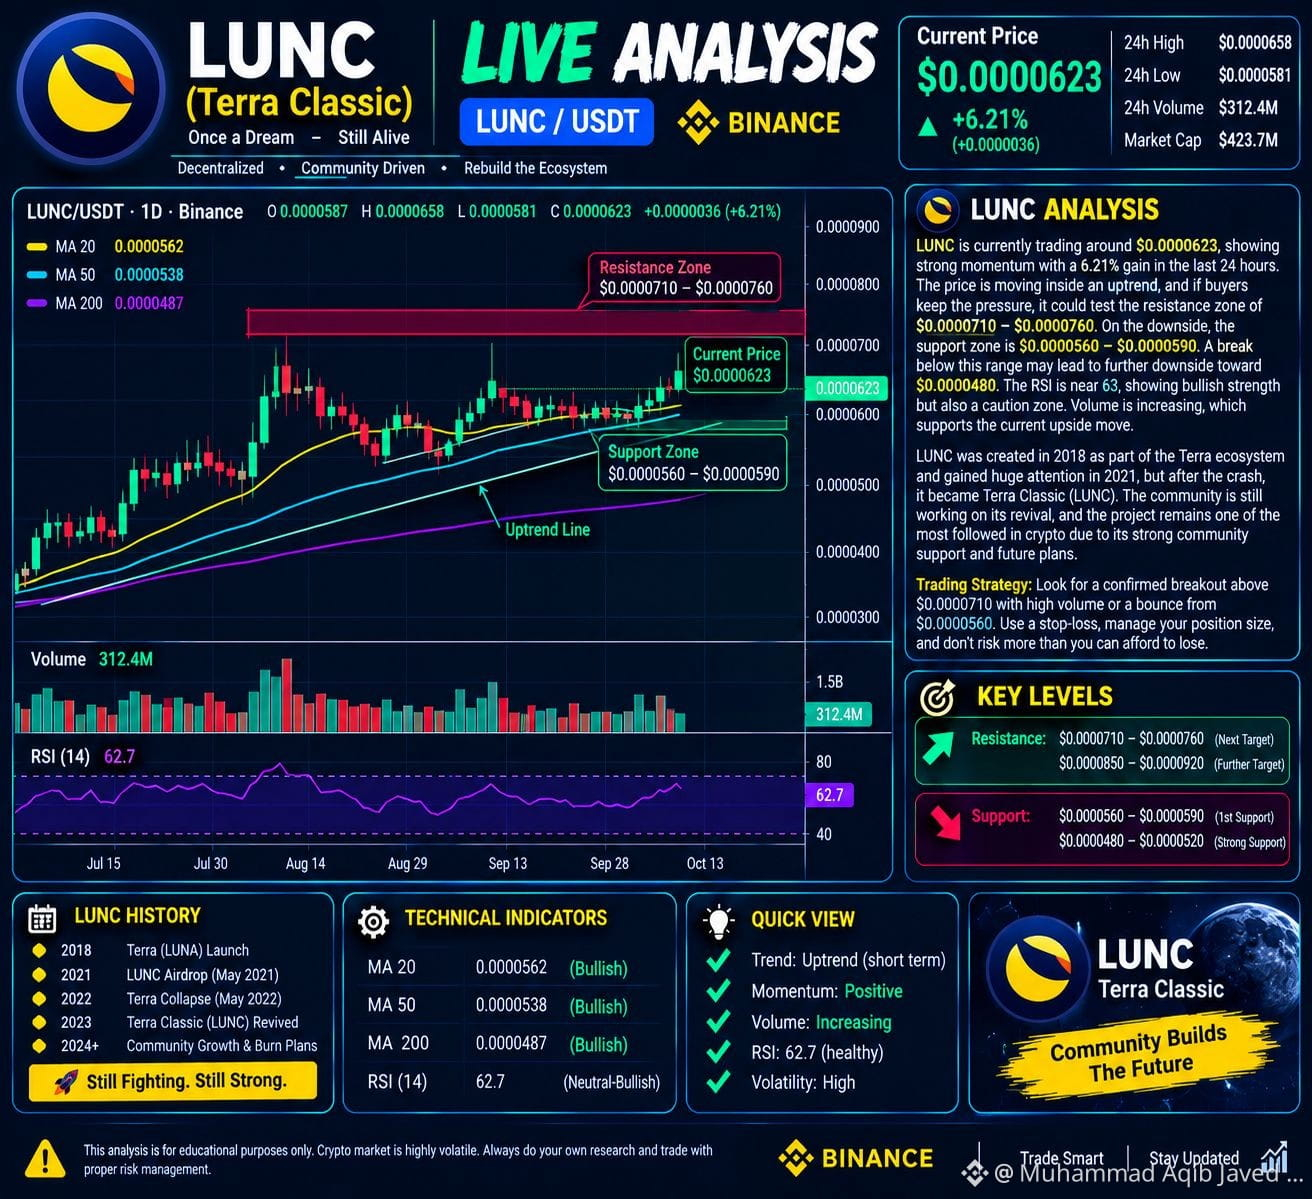
🚀 Terra Classic (LUNC) Live Analysis | October 14, 2026: LUNC is trading near $0.0000499, showing a small recovery after recent selling pressure, but the overall technical trend remains bearish, so traders should wait for confirmation before entering. The immediate resistance zone is around $0.0000508–$0.0000523; if LUNC breaks above this range with strong buying volume, a recovery toward $0.0000550 may become possible. On the downside, support lies near $0.0000483, followed by $0.0000475; a candle close below support could signal further weakness. LUNC has a dramatic history: the original Terra ecosystem surged in 2021 and reached extraordinary highs before its catastrophic collapse in May 2022, after which the original chain and token became Terra Classic (LUNC). The community continues to pursue revival efforts, but its history also highlights the risks of extreme volatility and speculative trading. Trading strategy: watch for a confirmed breakout or a support bounce, check volume before entry, and always set a stop-loss. LUNC may offer a trading opportunity if momentum improves, but never buy solely because the price looks cheap—protect your capital and remember that profits are never guaranteed. 📊 #LUNC #TerraClassic #CryptoAnalysis
#CPIWatch #EvernorthNasdaqDebutClosesDown1.05%
$LUNC
🚀 Terra Classic (LUNC) Live Analysis | October 14, 2026: LUNC is trading near $0.0000499, showing a small recovery after recent selling pressure, but the overall technical trend remains bearish, so traders should wait for confirmation before entering. The immediate resistance zone is around $0.0000508–$0.0000523; if LUNC breaks above this range with strong buying volume, a recovery toward $0.0000550 may become possible. On the downside, support lies near $0.0000483, followed by $0.0000475; a candle close below support could signal further weakness. LUNC has a dramatic history: the original Terra ecosystem surged in 2021 and reached extraordinary highs before its catastrophic collapse in May 2022, after which the original chain and token became Terra Classic (LUNC). The community continues to pursue revival efforts, but its history also highlights the risks of extreme volatility and speculative trading. Trading strategy: watch for a confirmed breakout or a support bounce, check volume before entry, and always set a stop-loss. LUNC may offer a trading opportunity if momentum improves, but never buy solely because the price looks cheap—protect your capital and remember that profits are never guaranteed. 📊 #LUNC #TerraClassic #CryptoAnalysis
#CPIWatch #EvernorthNasdaqDebutClosesDown1.05%
🚀 Terra Classic (LUNC) Live Analysis | October 14, 2026: LUNC is trading near $0.0000499, showing a small recovery after recent selling pressure, but the overall technical trend remains bearish, so traders should wait for confirmation before entering. The immediate resistance zone is around $0.0000508–$0.0000523; if LUNC breaks above this range with strong buying volume, a recovery toward $0.0000550 may become possible. On the downside, support lies near $0.0000483, followed by $0.0000475; a candle close below support could signal further weakness. LUNC has a dramatic history: the original Terra ecosystem surged in 2021 and reached extraordinary highs before its catastrophic collapse in May 2022, after which the original chain and token became Terra Classic (LUNC). The community continues to pursue revival efforts, but its history also highlights the risks of extreme volatility and speculative trading. Trading strategy: watch for a confirmed breakout or a support bounce, check volume before entry, and always set a stop-loss. LUNC may offer a trading opportunity if momentum improves, but never buy solely because the price looks cheap—protect your capital and remember that profits are never guaranteed. 📊 #LUNC #TerraClassic #CryptoAnalysis
#CPIWatch #EvernorthNasdaqDebutClosesDown1.05%
10
1.2k
Log in to explore more content
Join global crypto users on Binance Square
⚡️ Get latest and useful information about crypto.
💬 Trusted by the world’s largest crypto exchange.
👍 Discover real insights from verified creators.
Email / Phone number
Trending Topics
BTCRebounds80K
4,546 views
266 Discussing
#btcrebounds80k Bitcoin has made a sharp recovery, jumping over 4% to reclaim the $80,000 level. This price jump came right after a temporary drop below $76,000. Lower crude oil prices and heavy option market bets helped push the crypto market back up. Over $370 million in short trades were wiped out in a huge wave of market liquidations during the surge. Traders are now watching to see if Bitcoin can stay above $80,000 and keep moving toward higher target levels.
$BTC $SOL $ETH
Jojo_1122
·0 Likes
·2.8k views
Binance98PercentReplenished
6,614 views
324 Discussing
USMidterms-WhatAreMarketsExpecting?
232,706 views
1,772 Discussing