
CryptoOG 1
328 Posts

CryptoOG 1
Crypto Expert 📈 || Web3 Alpha 📊 || Moderator 🖥
0 Following
2 Followers
18 Liked
Posts
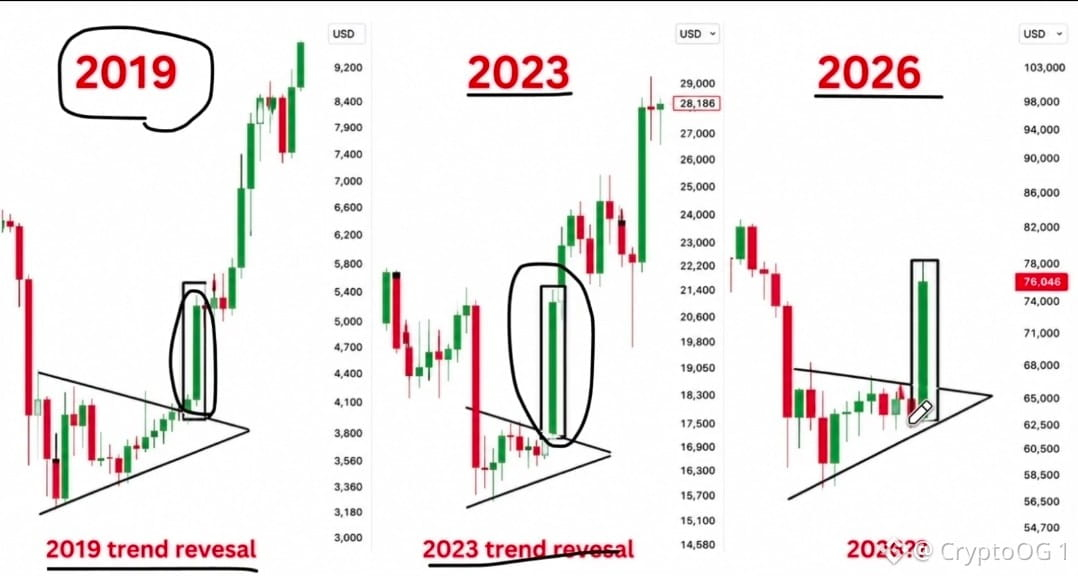
$BTC IS REPEATING HISTORY RIGHT NOW!! Same descending wedge. Same breakout. Same structure. Every time this pattern completed, BTC never looked back: 2019 trend reversal - confirmed 2023 trend reversal - confirmed 2026 trend reversal - ??? You can NOT ignore this chart now
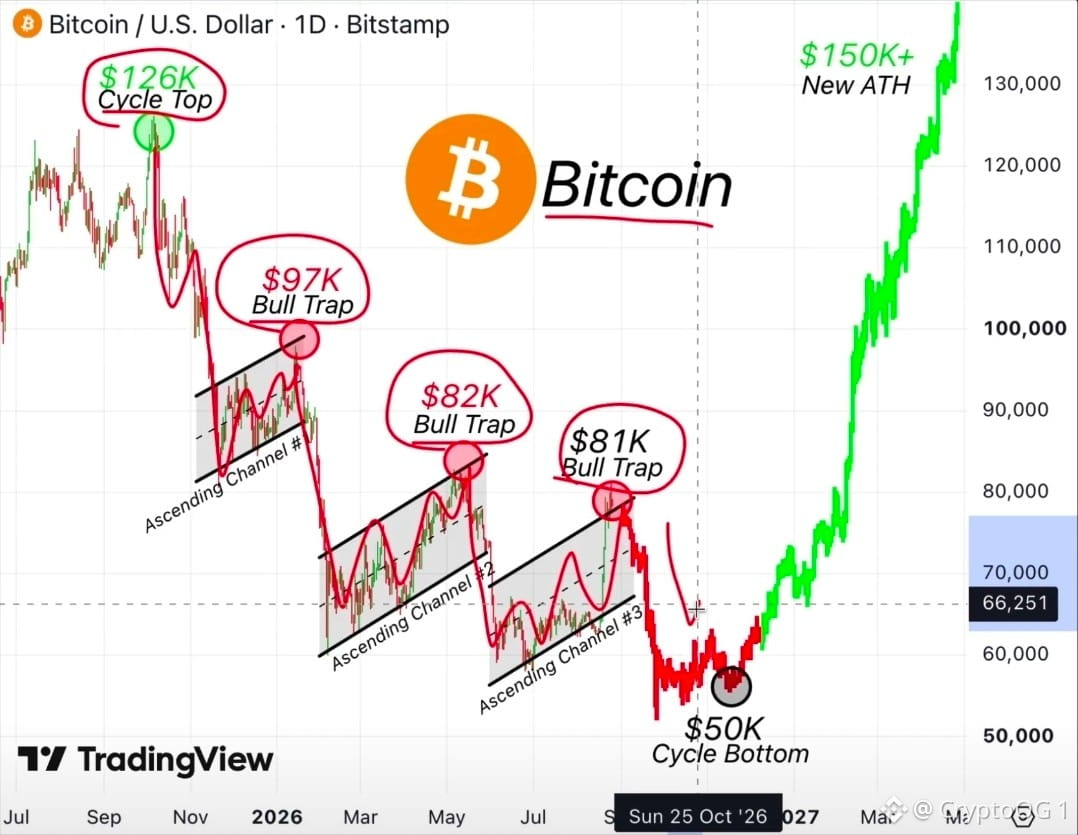
THE FINAL BITCOIN BULL TRAP JUST ENDED. $BTC rejected $80K, and the pattern is complete. I warned you this was the last chance to sell before the real drop. Most people still think we're going higher. They're wrong. Here's the roadmap from here: $79K → $67K → $55K → New Bull Run I called the $126K top in October 2025, the $15K bottom in November 2022, and the recent pump to $83K. If you missed those calls, don't worry. I'll call the next one too. Follow now. I'll call every major move.
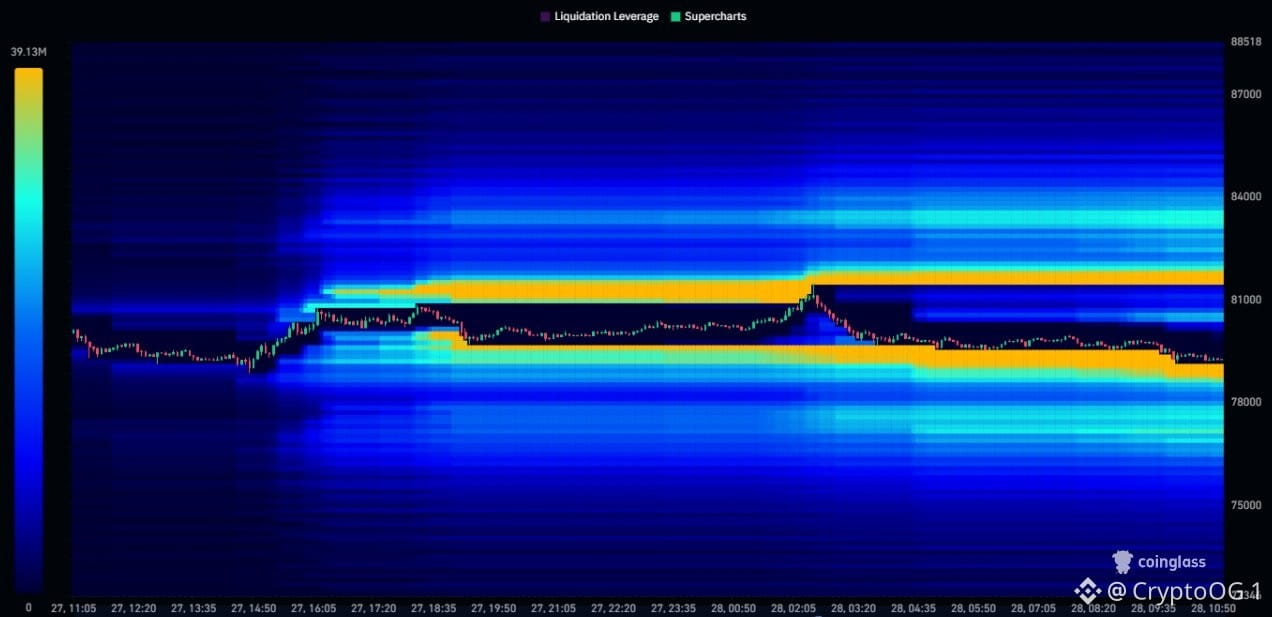
This is getting seriously crazy. $BTC pumped to $81,500 this morning and then immediately dumped back below $79,300 liquidating $465M in 24 hours! But here’s the important part: Yesterday, I said $80,400 - $81,600 was the main zone above and that holding above $80,000 would confirm Bulls were back in control. Bitcoin swept that upside zone almost perfectly, reaching $81,500, but failed to hold $80,000 which has weakened the short-term structure again. Bitcoin now has roughly $5.7B liquidity below between $75,000 - $78,500 and $2.8B above between $81,500 - $84,000. This means the HTF imbalance has shifted heavily back towards the downside, making a deeper pullback a big risk again. On the LTF, the largest liquidity zones now sit at $78,600 - $79,100 below and $81,300 - $81,900 above, making these the likely levels to sweep today. Whales still have huge sell walls that have formed around $80,800 - $83,000 while large bids remain underneath around $78,000 - $79,000 and lower. This means smart money are still buying dips, but there's a huge wall Bulls need to break for continuation. Meanwhile, OI has rebuilt, futures traders are buying and Coinbase Premium has finally turned positive, but spot demand has started weakening. This means leverage is coming back into the market faster than spot demand. So to make things simple for you: - $81.5K upside liquidity was swept - Failure to hold $80K is Bearish - $79.1K and $78.3K are now the two LTF zones - $5.7B below makes a pullback to $75K - $78.5K the bigger HTF risk - Bulls need to reclaim $80K quickly I’ll post any changes to my positioning and the key levels I’m watching in the free Telegram (link in bio).
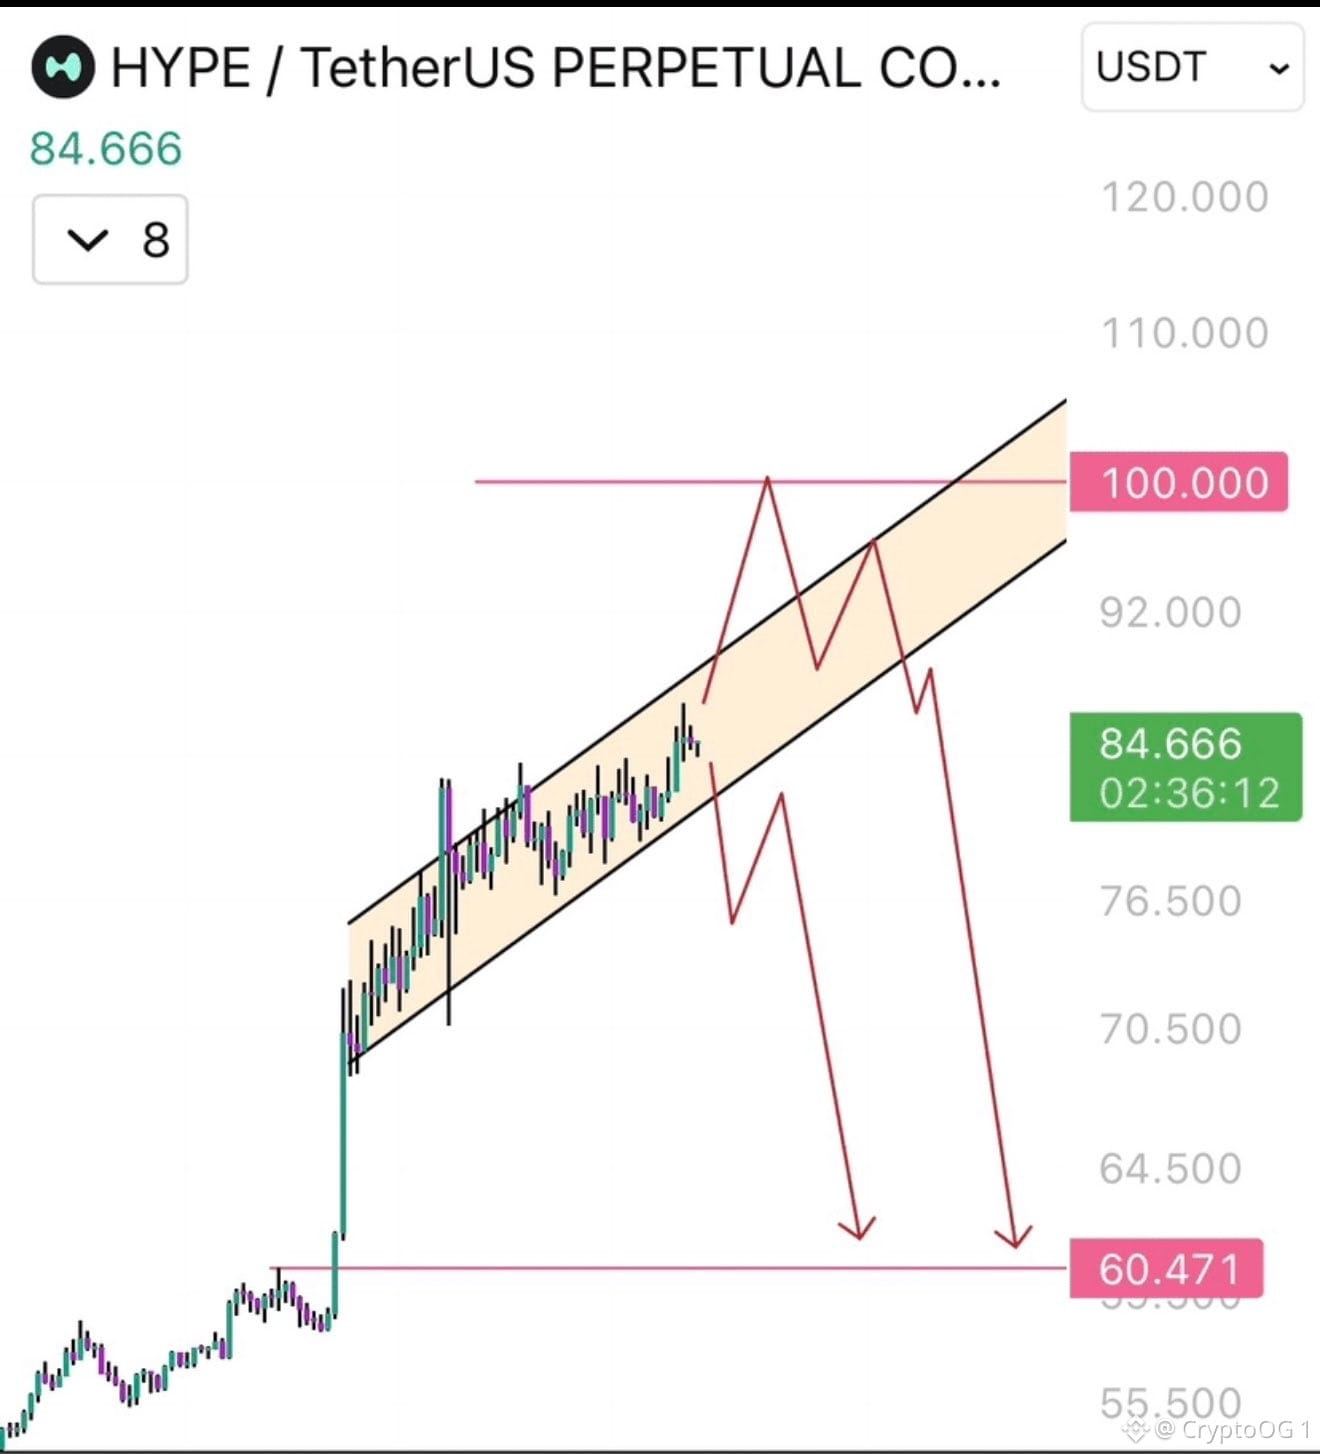
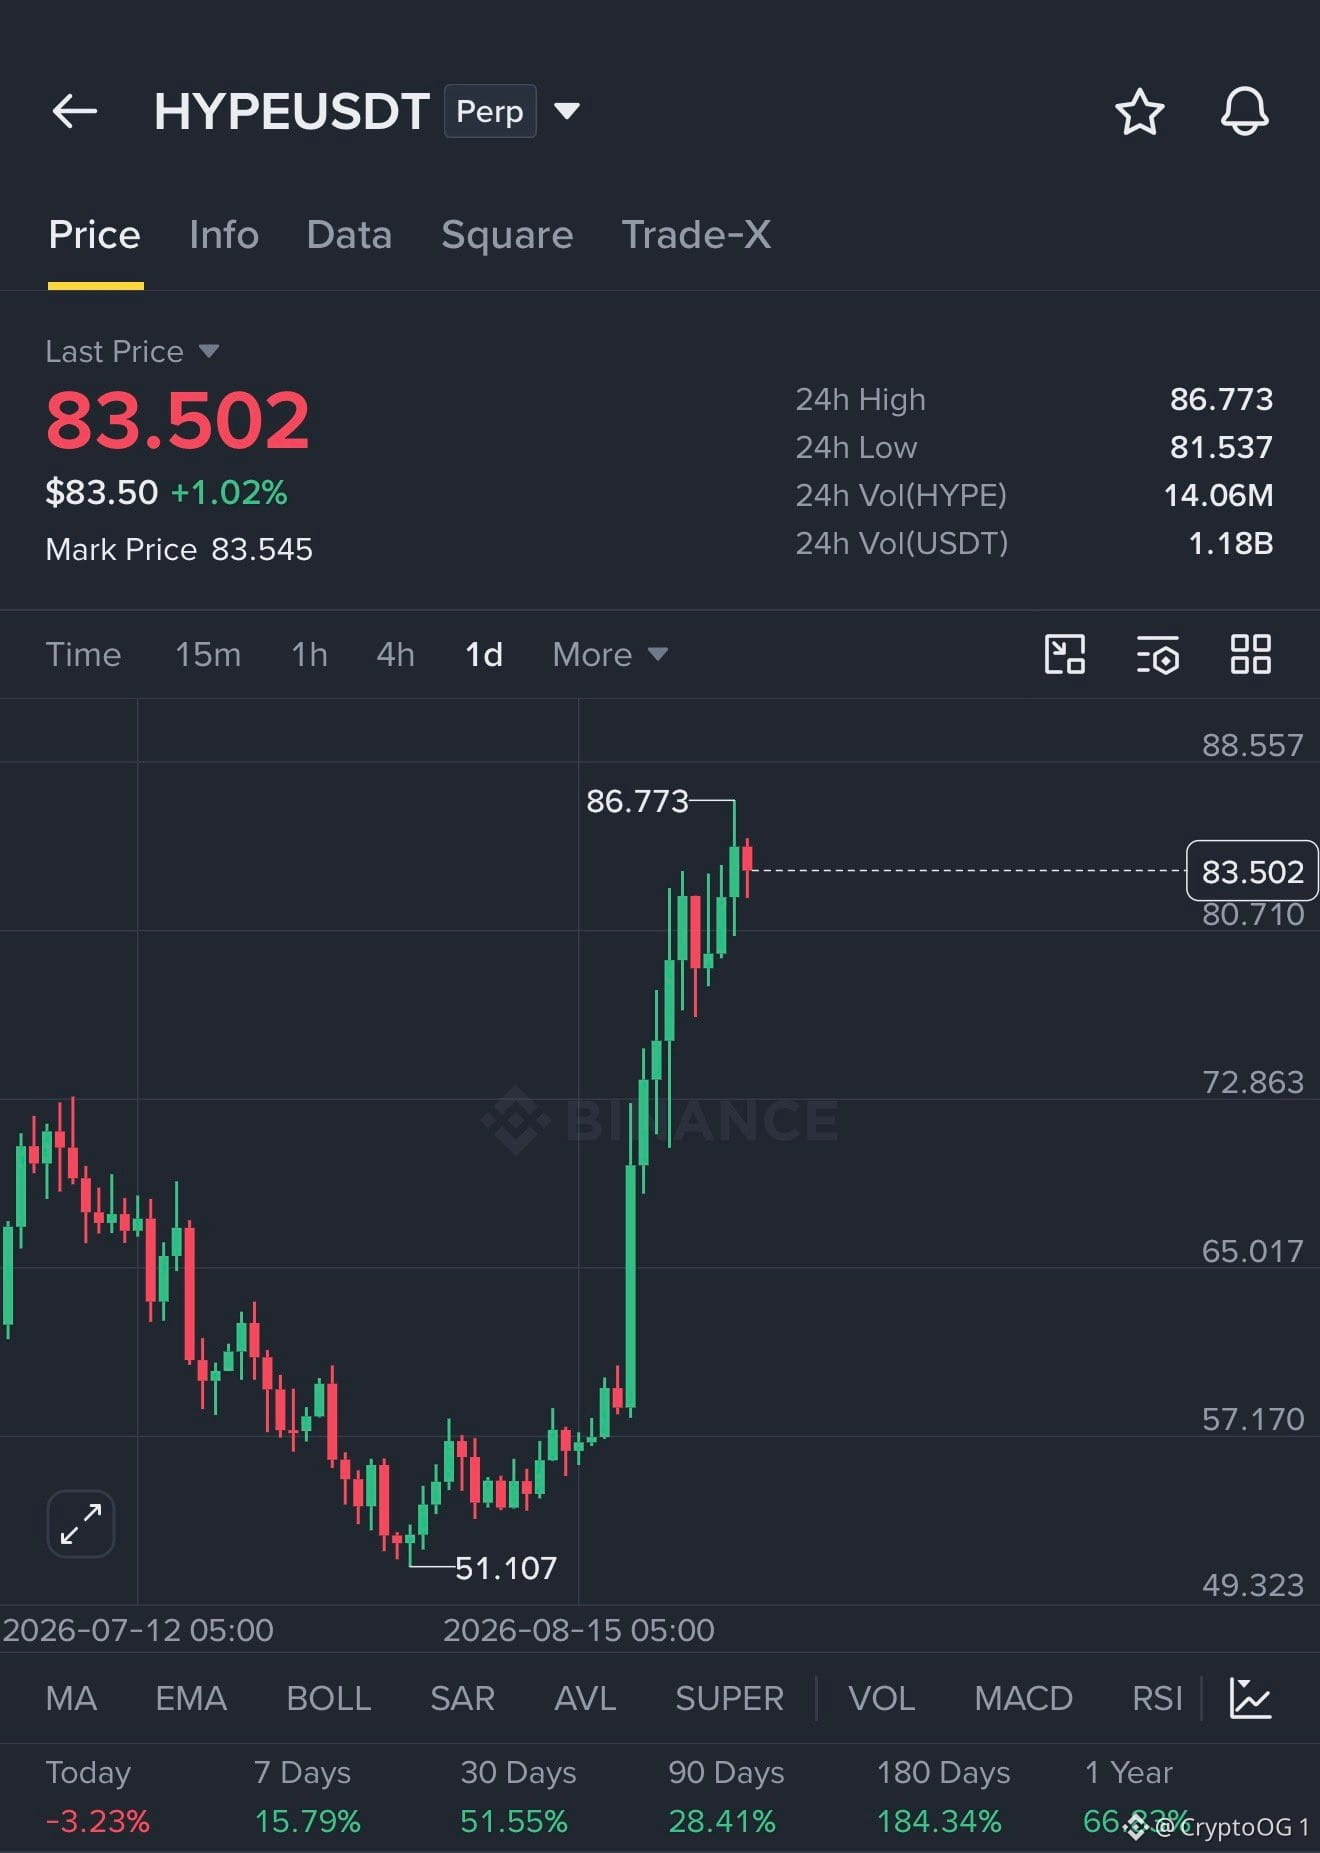
$HYPE is giving two possible short setups here. First, if the price loses this rising channel from the current area, I think we can see a quick move toward $76 and then potentially the $60 region. Second, the setup is if $HYPE pumps again toward $95-$100. TBH, that would be an even better short area if it gets rejected from there. What are your thoughts on $HYPE ? Do you think it will pump towards $100 or will dump now?
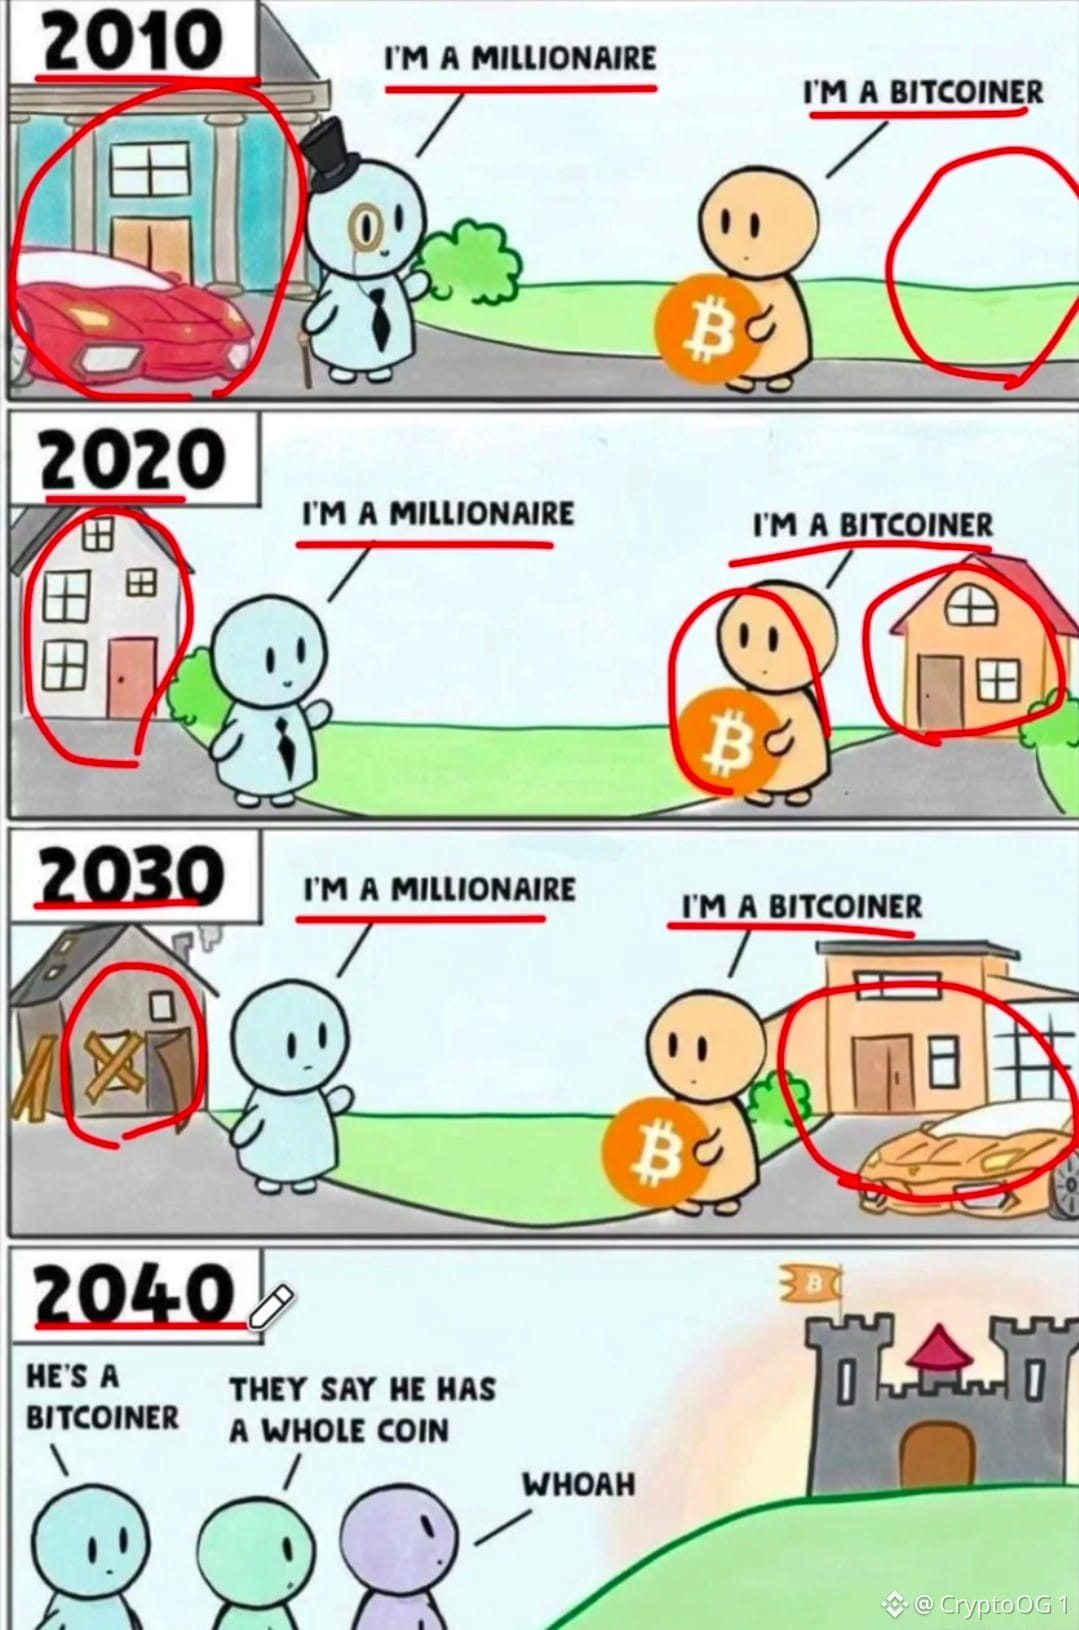
In 2010, buying a house was flex In 2020, buying stocks was flex In 2030, buying Bitcoin will be flex In 2040, having a whole $BTC will be flex
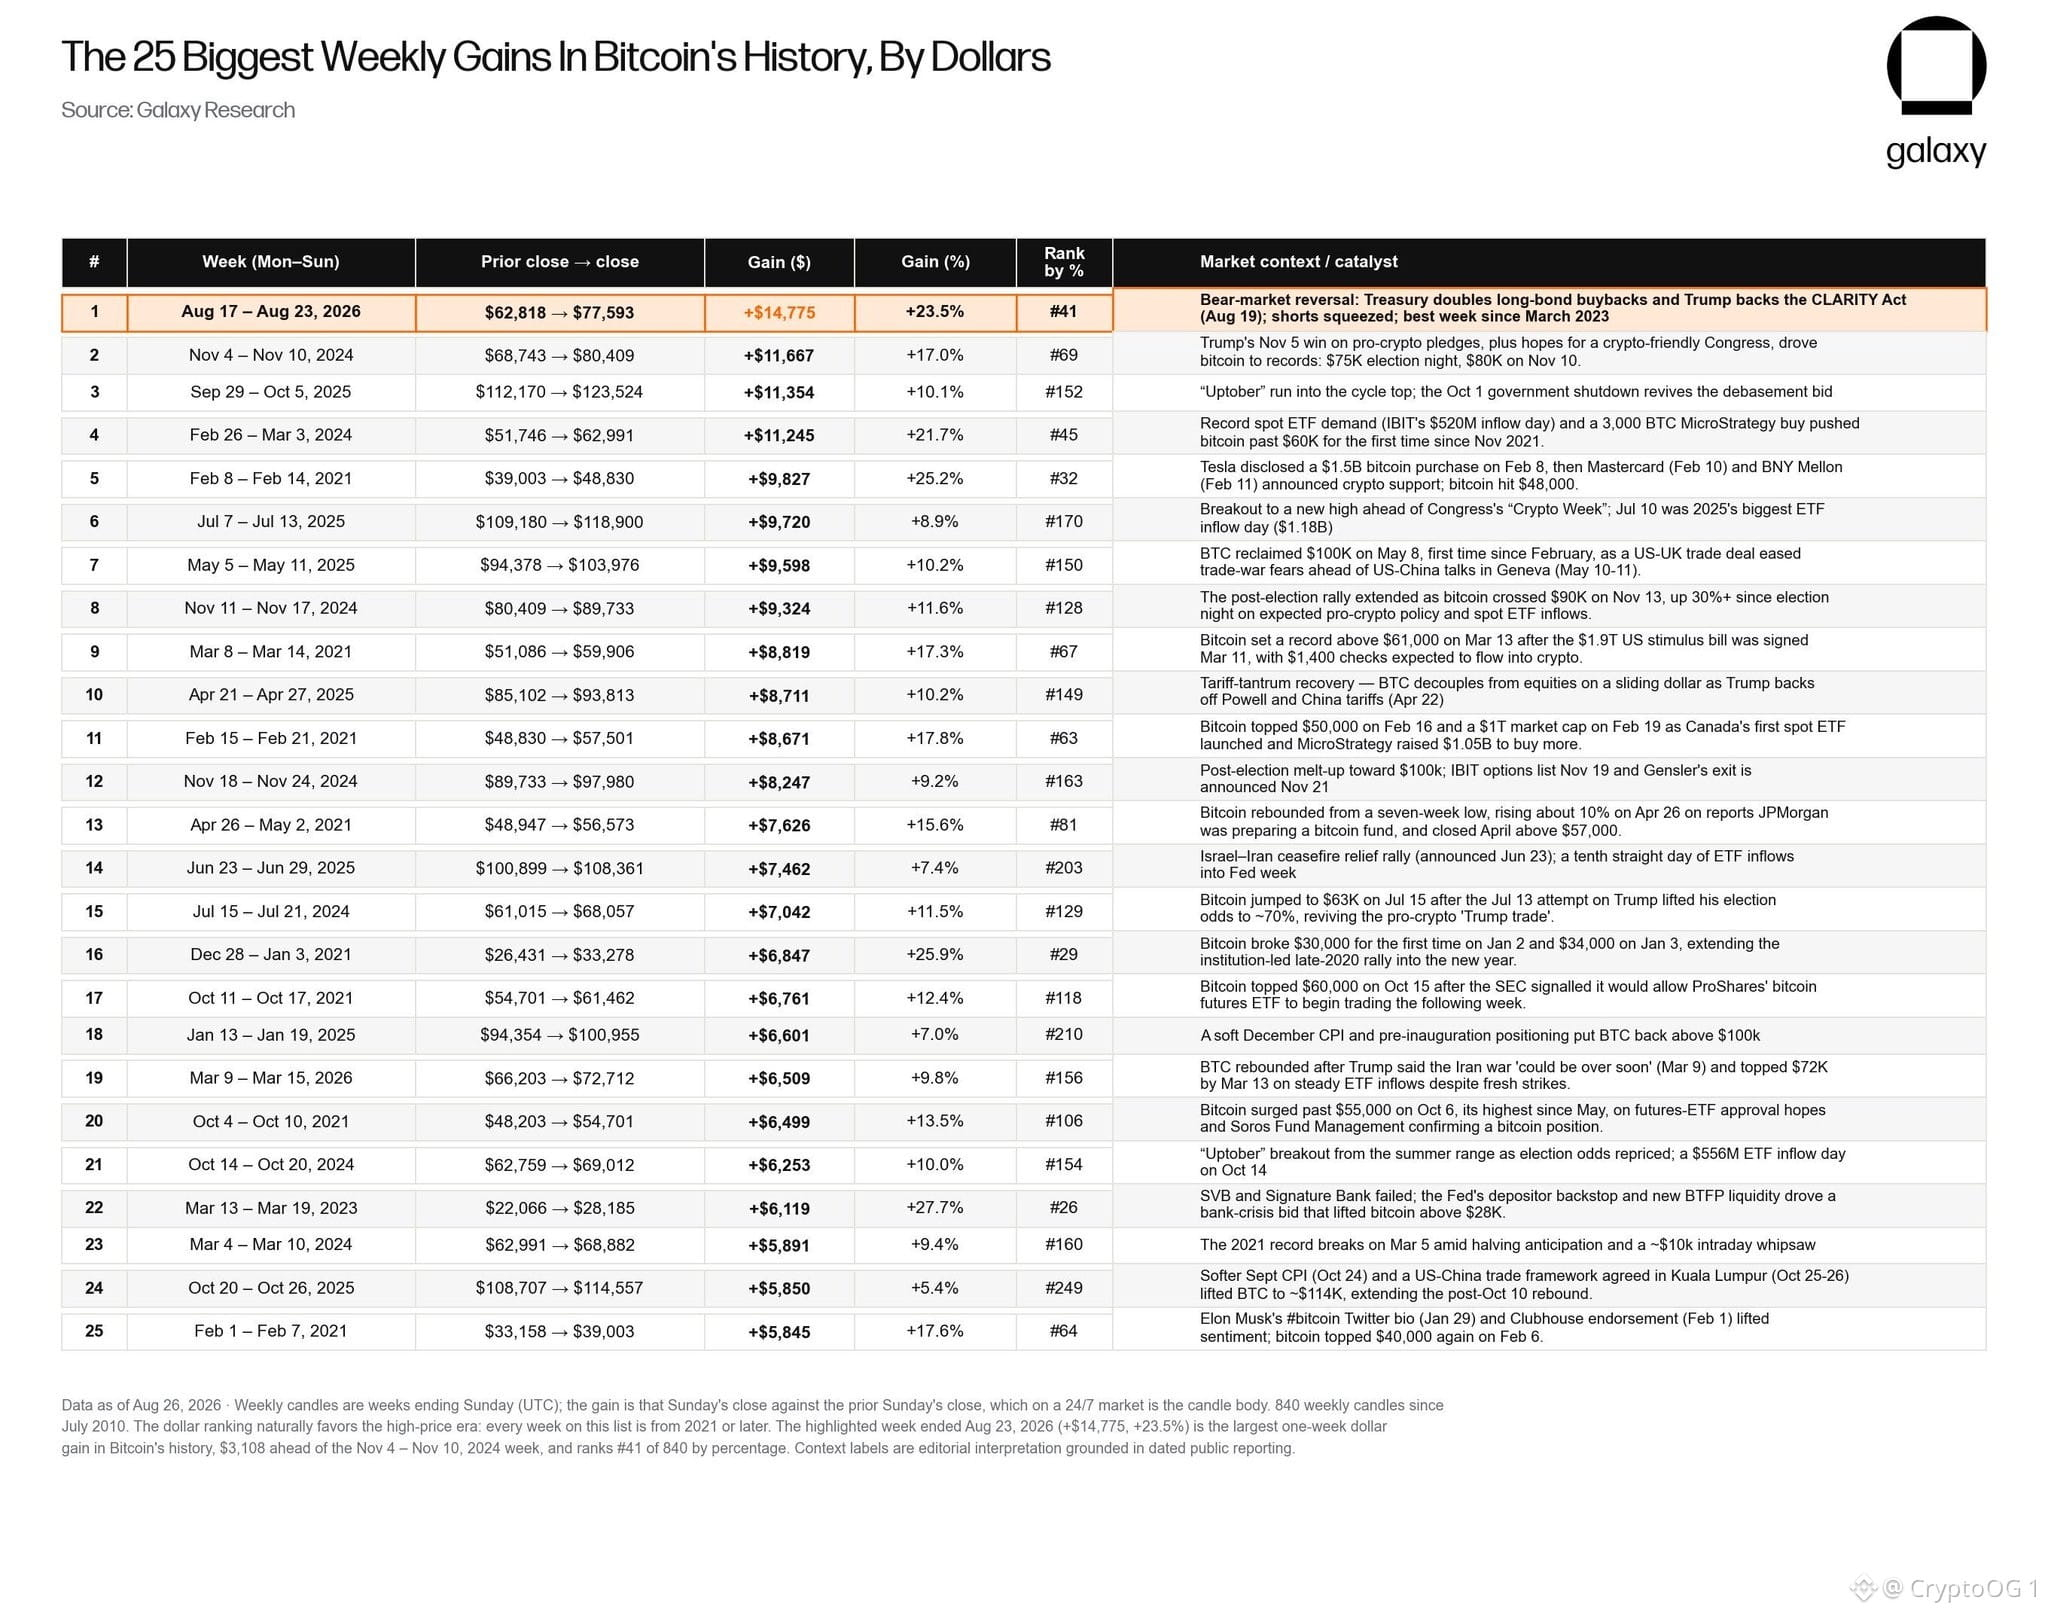
🚨 BITCOIN $BTC JUST MADE HISTORY According to Galaxy Research, $BTC recorded its largest weekly dollar gain ever. It also posted its biggest weekly percentage gain since March 2023. Bitcoin is moving differently this time. The bulls are back. 🟠🚀
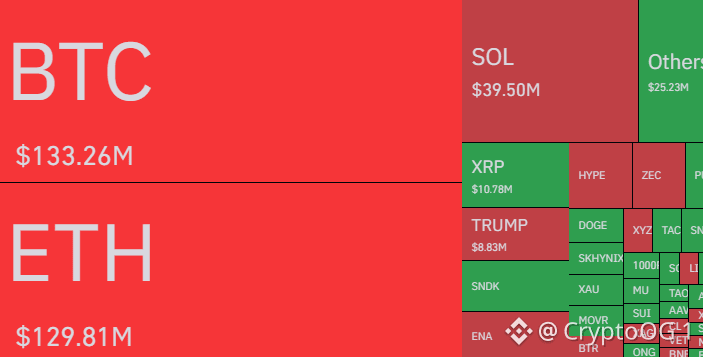
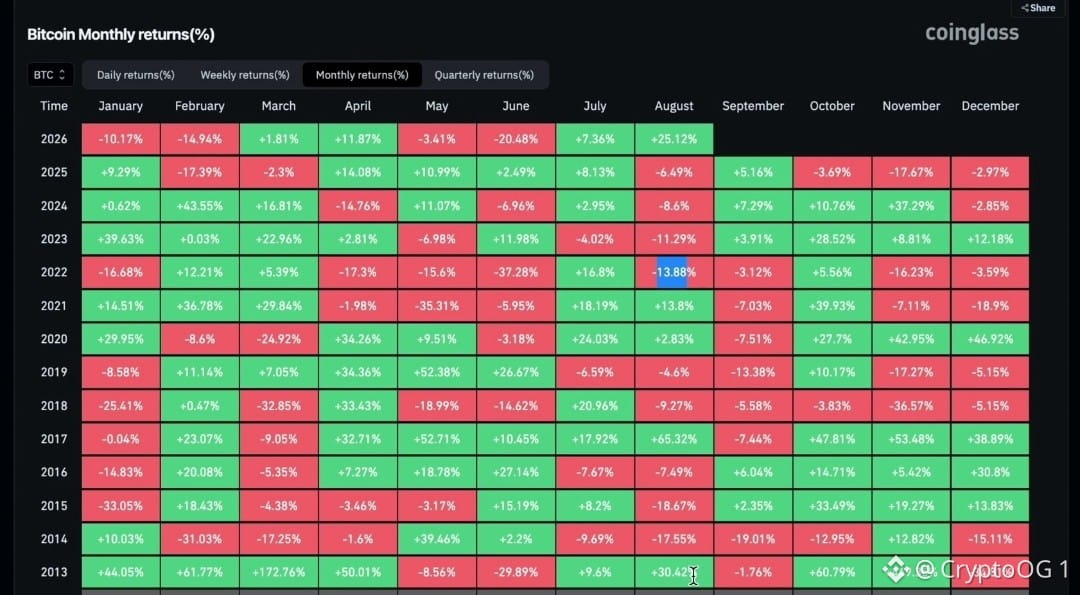
13 years of bad Augusts. Bitcoin just broke the pattern. August has historically been $BTC ’s weakest month, with a median return of -6.99% since 2013. This August bitcoin pumped +25.58%. 4 days left to close it out. From historically the worst month → one of Bitcoin’s strongest. seasonality just got humbled. #BTC Price Analysis#
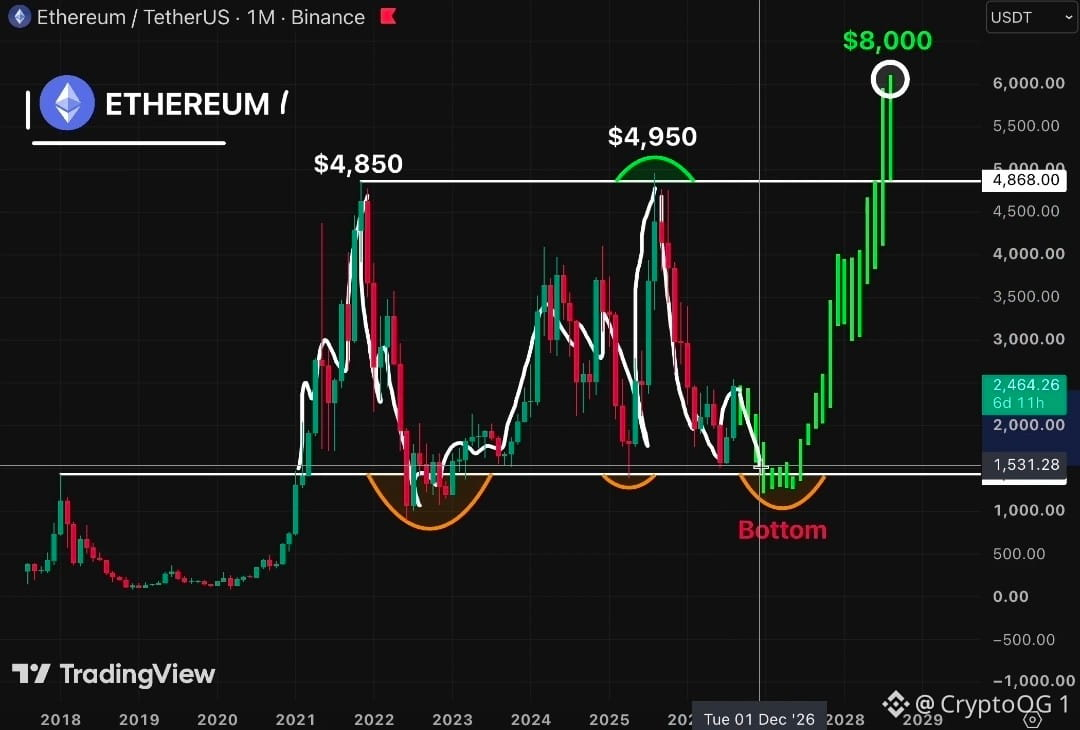
$ETH has been following this model almost perfectly for over 6 years. After the rise from the $2,550 level and the liquidity flow/FVG fill, I expect the next level to be $1,440 → bottom formation From there, I only expect an upward movement toward $8,000 and above levels. Turn on notifications so you don't miss my next market prediction...
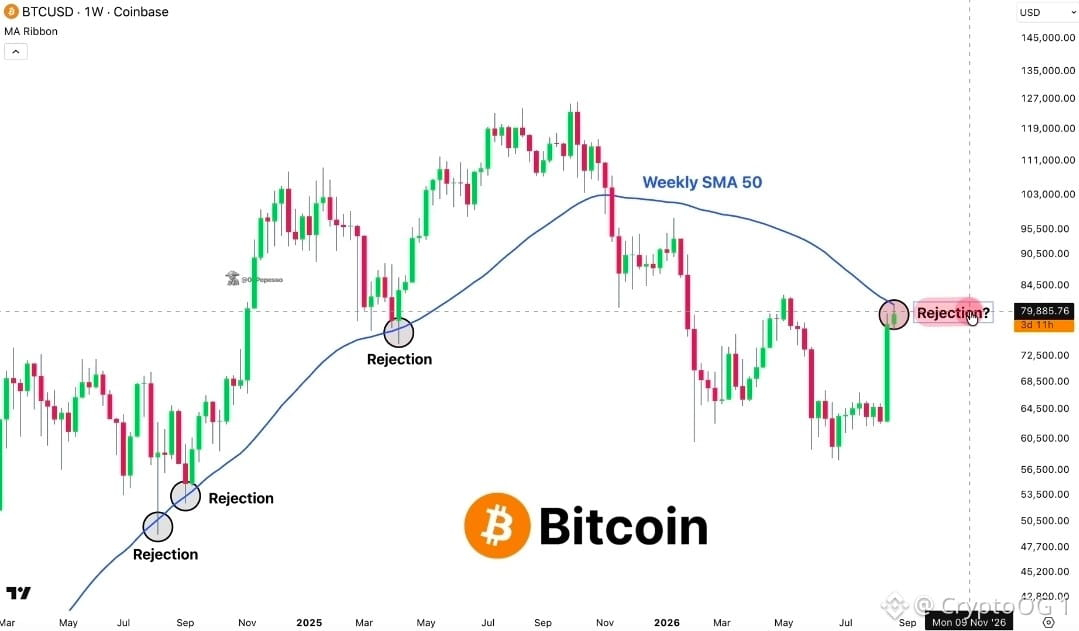
🚨 BITCOIN IS RETESTING THE 50-WEEK MA $BTC is trading right under the 50-week MA resistance Last cycle, every time price retested this exact line, it got rejected and triggered a ~20% impulse move If history repeats here, a 20% rejection points straight to ~$65,000 A clean weekly close above 50 SMA invalidates this rejection setup Follow + notifs on, I will keep you updated
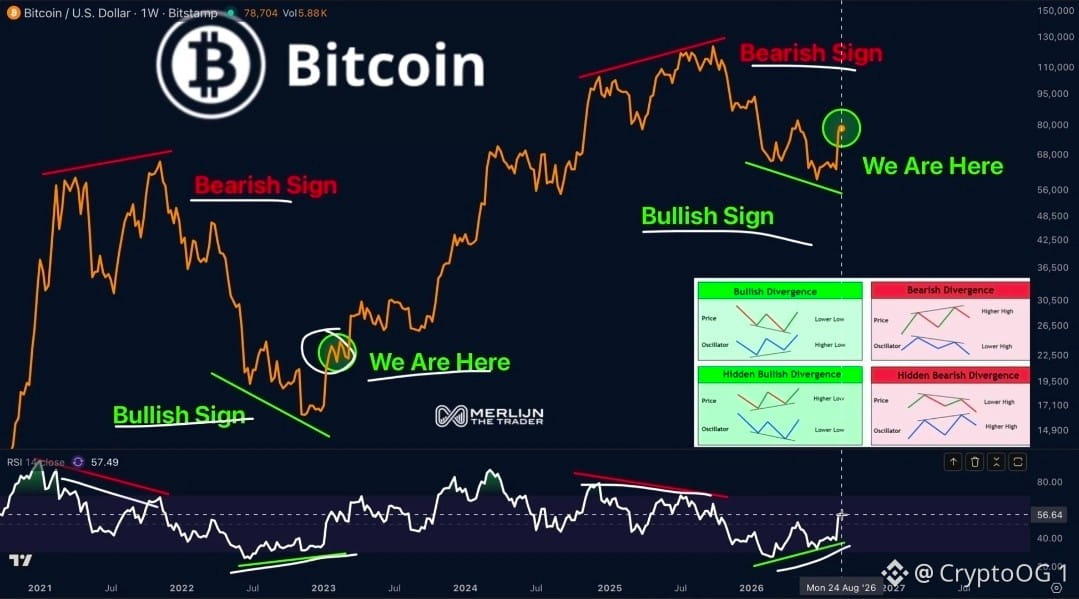
$40,000 BITCOIN $BTC IS NOT COMING. BITCOIN $78,668. Same fractal as 2022: bearish top, bullish divergence, breakout. Then $126,000. My orders are laddered from $75,000 down to $62,500. The lower it goes, the heavier my bids get. Target: $130,000+ Invalidated: $62,000 weekly close. The pullback is your last cheap entry. #BTC Price Analysis#
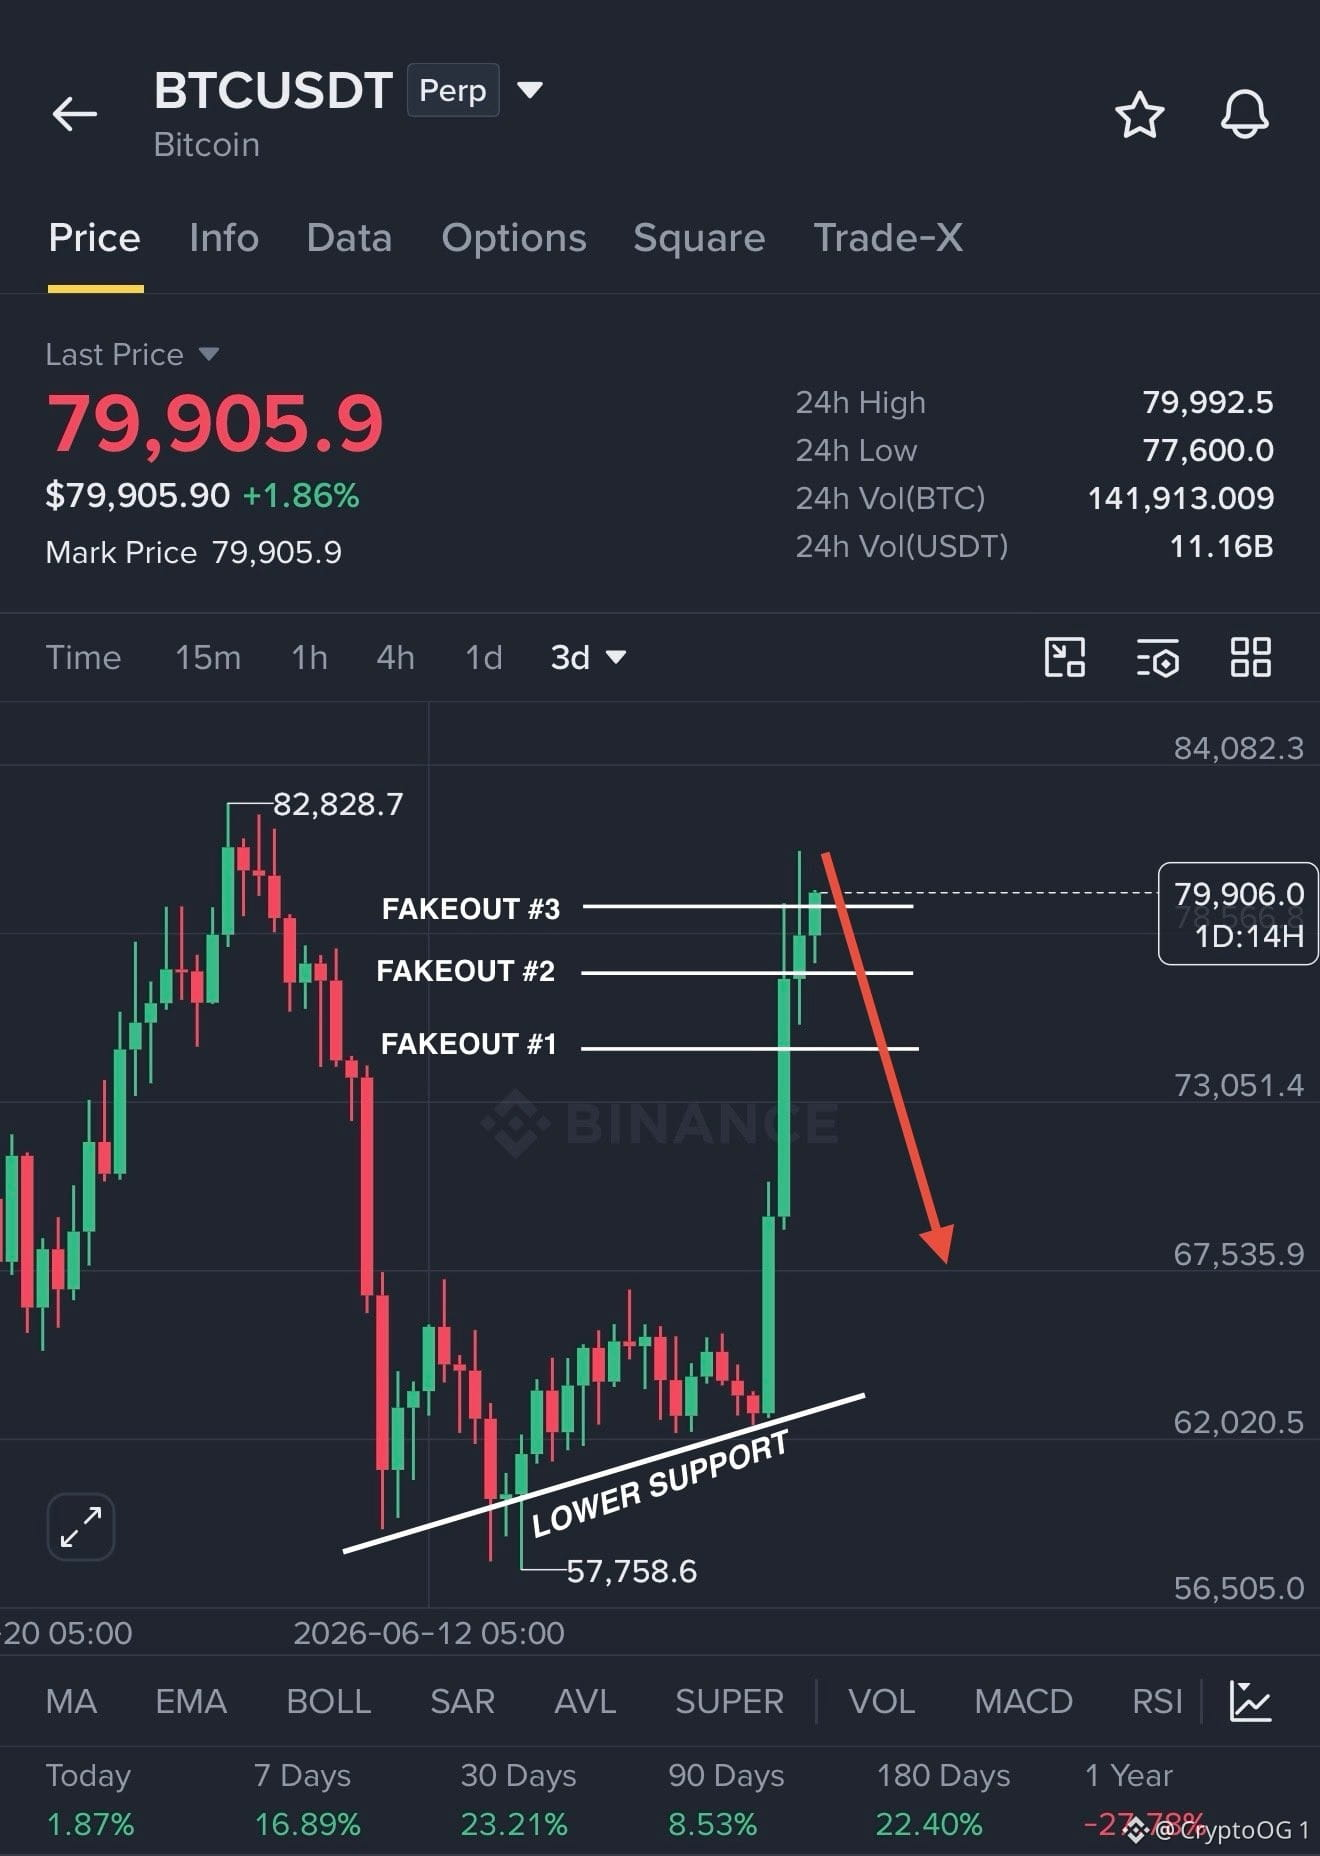
🚨 I told you not to long $BTC around $81K. Bitcoin tried to break $82K and got rejected again. $BTC pump from $67K to $80k in just 1 week was a bull trap. The bottom wasn’t really in. I still think that $BTC will first dump towards $74K then towards $67K area. And if any major bad geopolitical news comes then we can go much down. NFA - DYOR
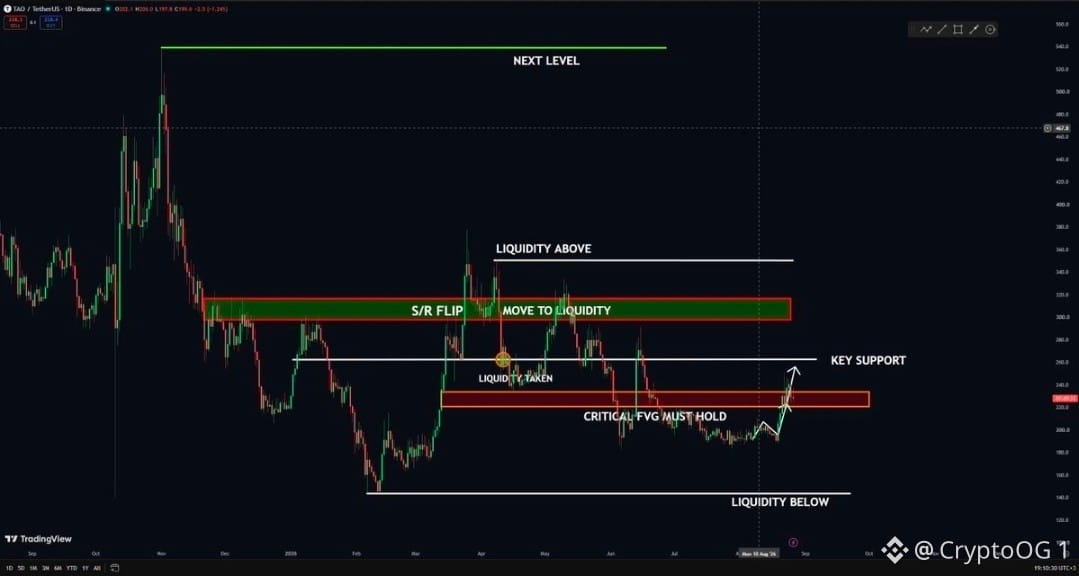
$TAO JUST RECLAIMED THE KEY LEVEL. 🚀 TAO has reclaimed the $220–$230 critical FVG and is now pushing toward the $260 key resistance. The structure is clean: FVG reclaim → $260 test → liquidity above at $350. 👀 If TAO holds this reclaim and breaks $260, the next move could accelerate toward $350+. TAO bulls are back in control. 🔥 #Altcoin Season#
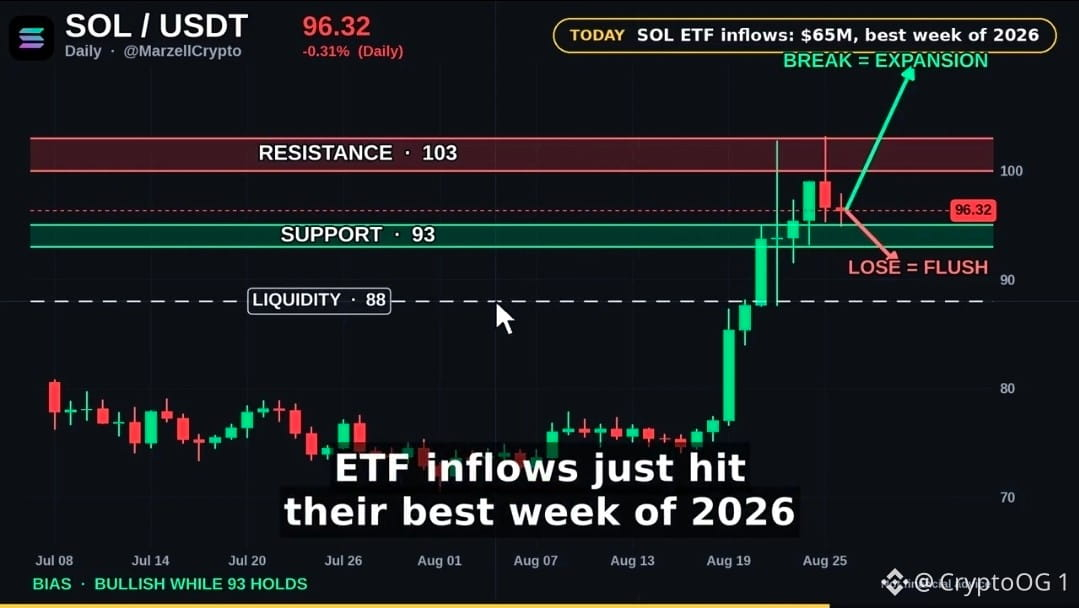
$SOL · 1D $SOL ran 30% in a week and sellers rejected $103 twice in 4 days. 🟢 Break and hold $103, expansion opens toward $110 🔴 Lose $93, liquidity waits at $88 SOL ETF inflows just hit their best week of 2026. Bullish while $93 holds 👀 Not financial advice · #Solana #SOL #Crypto
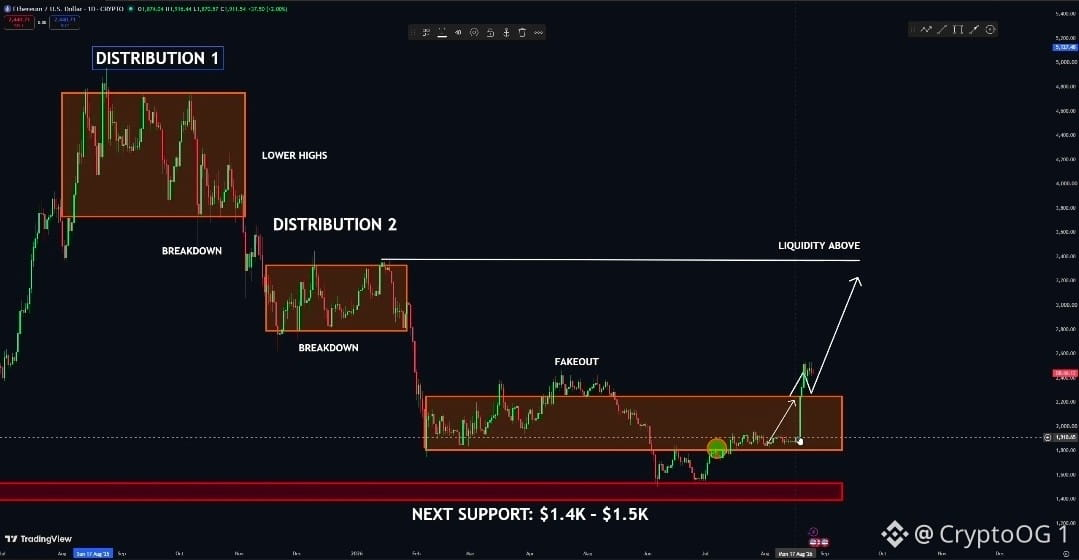
$ETH JUST BROKE OUT OF the Reversal Phase. 🚀 ETH has finally escaped the $2.2K–$2.3K range after months of consolidation. The structure is clear: Distribution → fakeout → reclaim → breakout. Now ETH is pushing toward the $3.4K liquidity above. 👀 Hold this breakout and $3K → $3.4K becomes the obvious path. ETH bulls just took control. 🔥
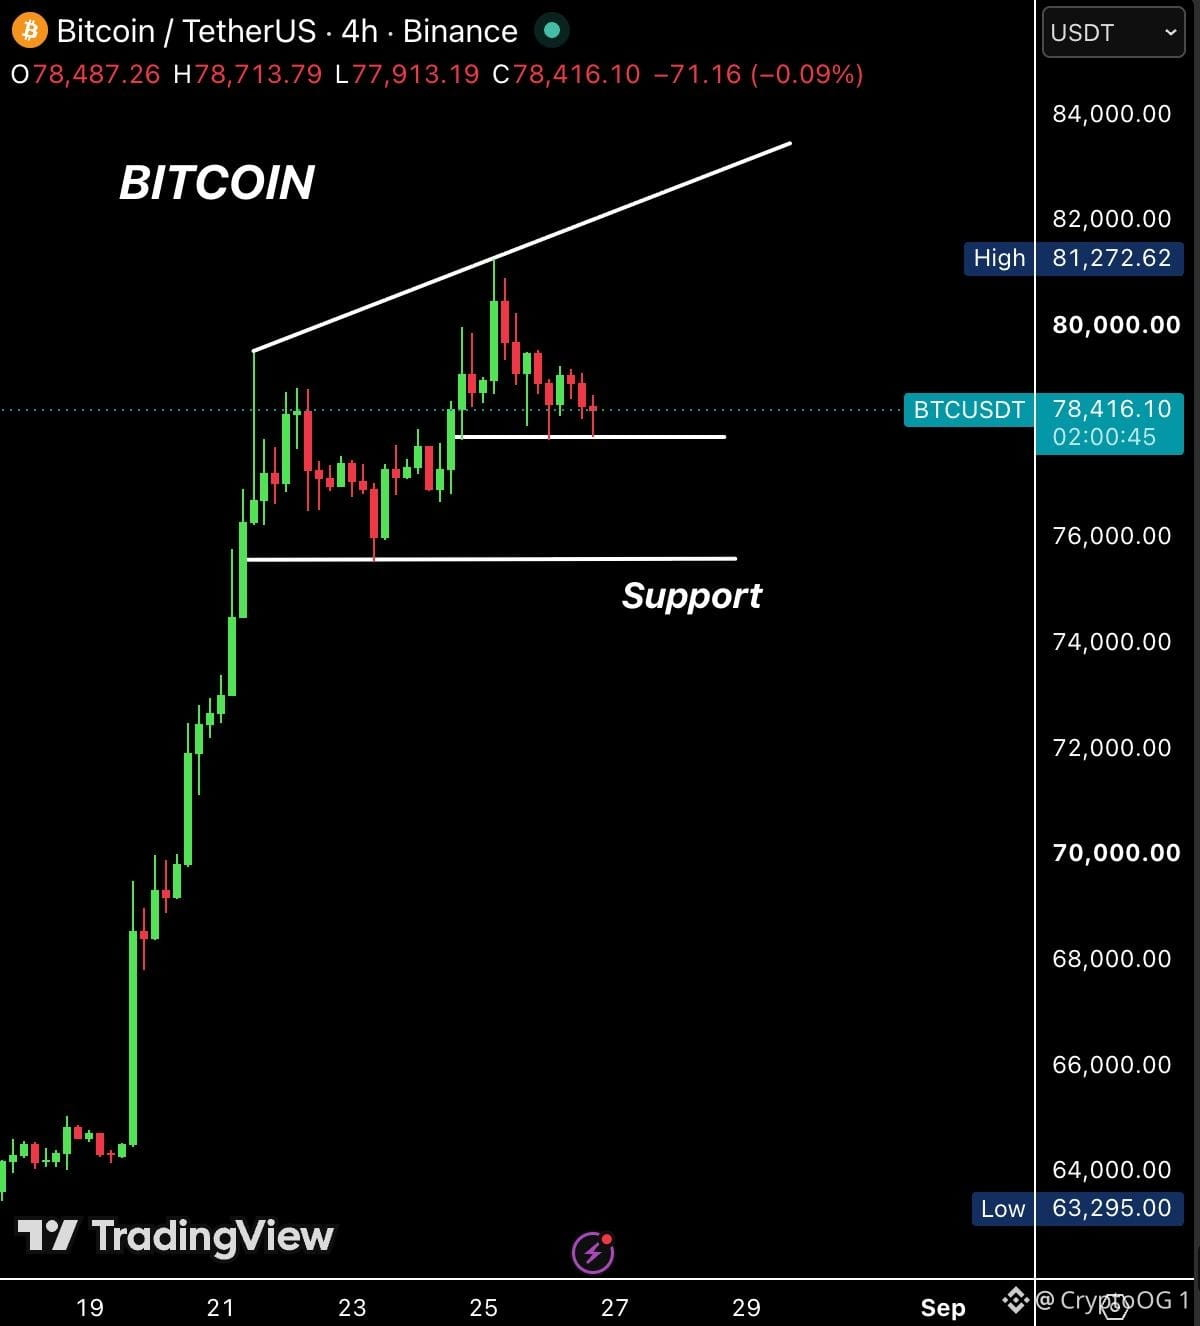
$BTC is consolidating near $78,200 after bouncing $15,000 from $63,300. The chart is still printing higher highs and higher lows. Local support: $77,800 Stronger support: $75,500 - $76,000 Resistance: $81,270, which is also the weekly MA 50 Two paths from here Hold $78,000 and break the trendline → $83,000 is next. Lose $78,000 → $76,000 gets tested before Friday. Jackson Hole is in two days and this range will not last long.
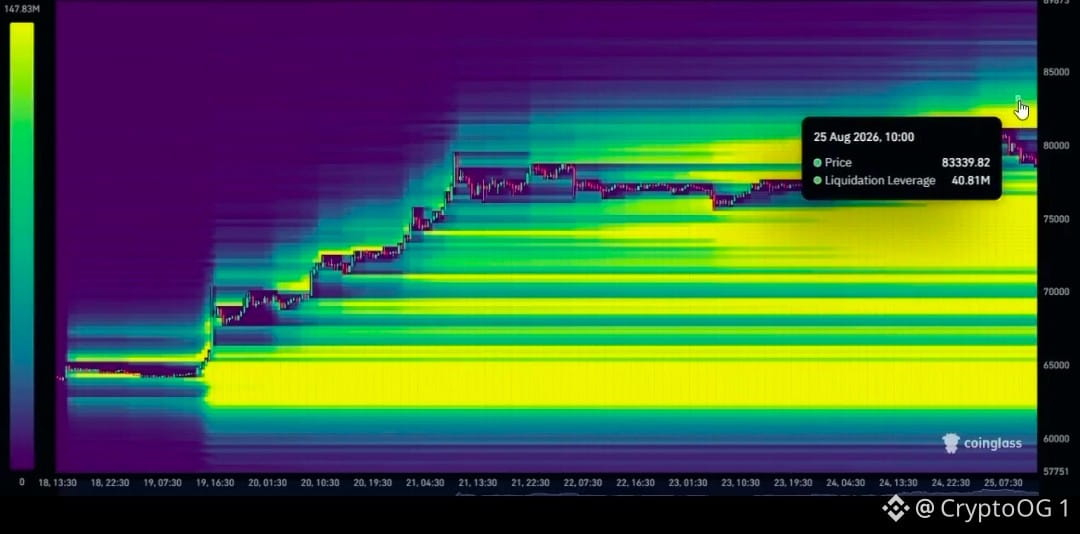
🚨 BITCOIN LIQUIDITY IS HEAVILY STACKED BELOW $BTC has around $9.9B in liquidity sitting between $62K–$76.5K. Meanwhile, only $1.2B sits above between $81K–$83K. The liquidity imbalance is massive. The question is: where does Bitcoin hunt liquidity next? 👀
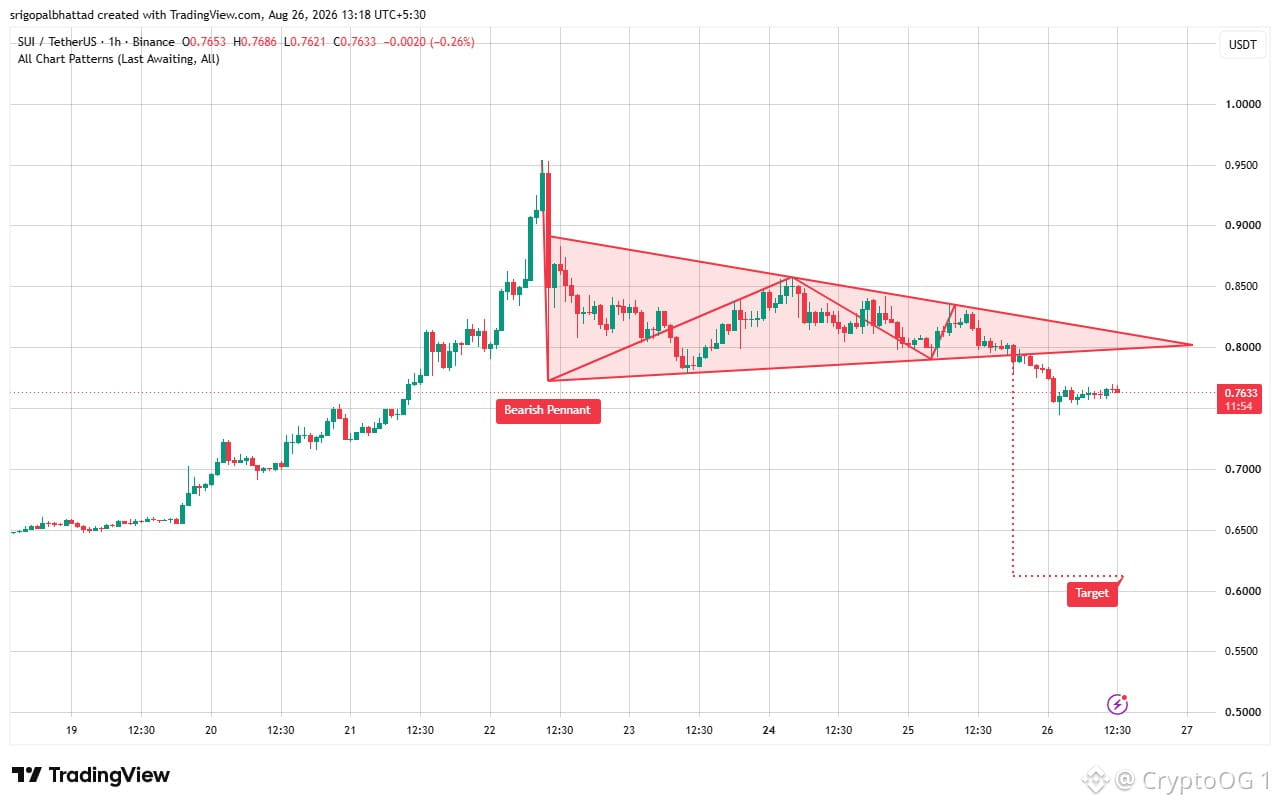
$SUI is forming a bearish pennant 👀 Price broke below the pennant support near $0.80, confirming bearish momentum after the consolidation. If sellers stay in control, the move could extend toward the $0.61 target 📉🔥 Bears have taken control. Bearish sentiment building. #Sui
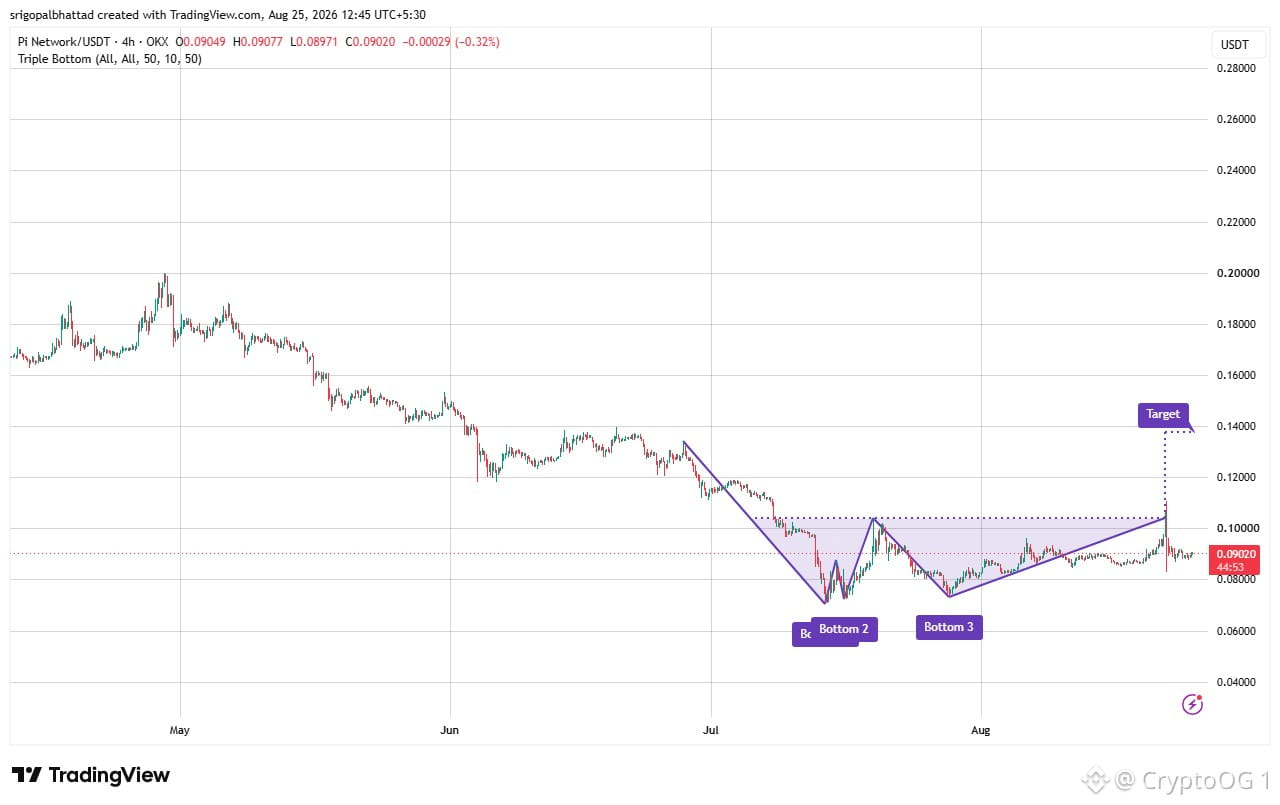
$PI is printing a potential triple-bottom formation 👀📈 Buyers have defended the $0.07–0.08 support zone multiple times, showing strong accumulation and seller exhaustion. Now price is pushing toward the key $0.10–0.105 resistance 🔥 A clean breakout above that zone could confirm the reversal and open the door toward $0.14. Bulls are slowly reclaiming control. Market sentiment: Bullish — breakout watch 👀📈 #Pi #Macro Insights#
Log in to explore more content