
AR _Trader
51k Posts

AR _Trader
Report
Block User
Open Trade
1.4 Years
30 Following
14.0K+ Followers
80.8K+ Liked
Posts
Portfolio
All
Quotes
Live
PINNED
·
--
Bullish
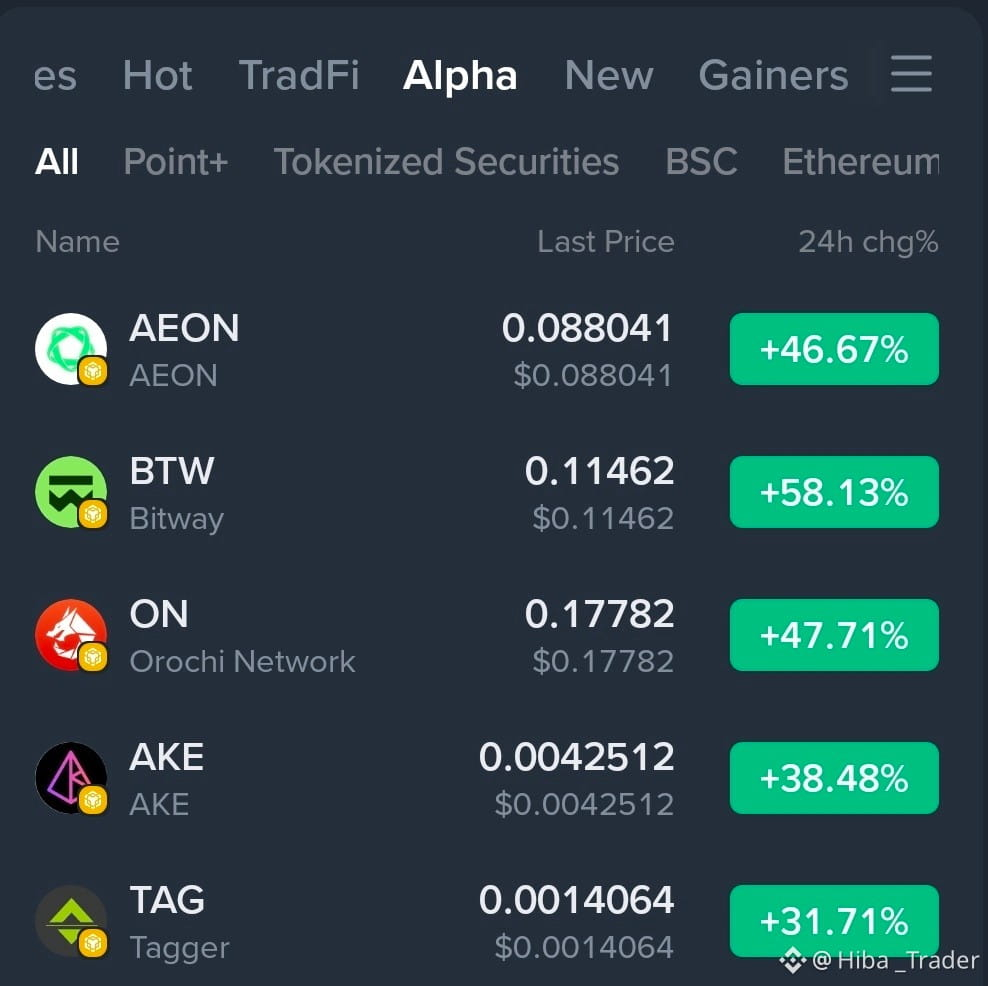
🔥 TOP GAINERS OF THE DAY 🔥
🥇 $BTW — +58.13% 🚀🚀🚀🚀🚀
🥈 #ONDO:
Orochi Network (ON) — +47.71% 🚀🚀🚀🚀⭐
🥉 $AEON — +46.67% 🚀🚀🚀🚀
⭐ $AKE — +38.48% 🚀🚀🚀
📈 #TAG — Watchlist 👀
Market Sentiment: 🟢 Bullish
Momentum Rating: ⭐⭐⭐⭐⭐ (5/5)
This format looks much more eye-catching and engaging for Telegram, X, or other crypto communities.
{future}(BTWUSDT)
{alpha}(560x277add739c6e0477616948357af9e79fe1ec9b80)
{future}(AKEUSDT)
🔥 TOP GAINERS OF THE DAY 🔥
🥇 $BTW — +58.13% 🚀🚀🚀🚀🚀
🥈 #ONDO:
Orochi Network (ON) — +47.71% 🚀🚀🚀🚀⭐
🥉 $AEON — +46.67% 🚀🚀🚀🚀
⭐ $AKE — +38.48% 🚀🚀🚀
📈 #TAG — Watchlist 👀
Market Sentiment: 🟢 Bullish
Momentum Rating: ⭐⭐⭐⭐⭐ (5/5)
This format looks much more eye-catching and engaging for Telegram, X, or other crypto communities.
🥇 $BTW — +58.13% 🚀🚀🚀🚀🚀
🥈 #ONDO:
Orochi Network (ON) — +47.71% 🚀🚀🚀🚀⭐
🥉 $AEON — +46.67% 🚀🚀🚀🚀
⭐ $AKE — +38.48% 🚀🚀🚀
📈 #TAG — Watchlist 👀
Market Sentiment: 🟢 Bullish
Momentum Rating: ⭐⭐⭐⭐⭐ (5/5)
This format looks much more eye-catching and engaging for Telegram, X, or other crypto communities.
2
1
24
1.7k
PINNED
·
--
Bullish
Verified
🔥 #usfiresontankerbreakingiranblockade | ATTENTION TO THE STRICTNESS OF ORMUZ
Reports about an incident in which U.S. forces allegedly opened fire on an oil tanker trying to cross the maritime blockade imposed around Iran, in the context of the Strait of Hormuz crisis.
This episode falls within a much broader military escalation related to U.S. efforts to keep navigation open in the region.
📊 WHAT DOES THIS MEAN?
Regardless of how the conflict evolves, this kind of event usually increases uncertainty in markets.
When a route through which a significant share of the world’s oil transits is threatened, investors begin to monitor closely:
• Oil
• Dollar
• Gold
• Crypto
💬 What do you think? Will this affect global markets?
🔥 #usfiresontankerbreakingiranblockade | ATTENTION TO THE STRICTNESS OF ORMUZ
Reports about an incident in which U.S. forces allegedly opened fire on an oil tanker trying to cross the maritime blockade imposed around Iran, in the context of the Strait of Hormuz crisis.
This episode falls within a much broader military escalation related to U.S. efforts to keep navigation open in the region.
📊 WHAT DOES THIS MEAN?
Regardless of how the conflict evolves, this kind of event usually increases uncertainty in markets.
When a route through which a significant share of the world’s oil transits is threatened, investors begin to monitor closely:
• Oil
• Dollar
• Gold
• Crypto
💬 What do you think? Will this affect global markets?
Reports about an incident in which U.S. forces allegedly opened fire on an oil tanker trying to cross the maritime blockade imposed around Iran, in the context of the Strait of Hormuz crisis.
This episode falls within a much broader military escalation related to U.S. efforts to keep navigation open in the region.
📊 WHAT DOES THIS MEAN?
Regardless of how the conflict evolves, this kind of event usually increases uncertainty in markets.
When a route through which a significant share of the world’s oil transits is threatened, investors begin to monitor closely:
• Oil
• Dollar
• Gold
• Crypto
💬 What do you think? Will this affect global markets?

2
36
24k
·
--
Bullish
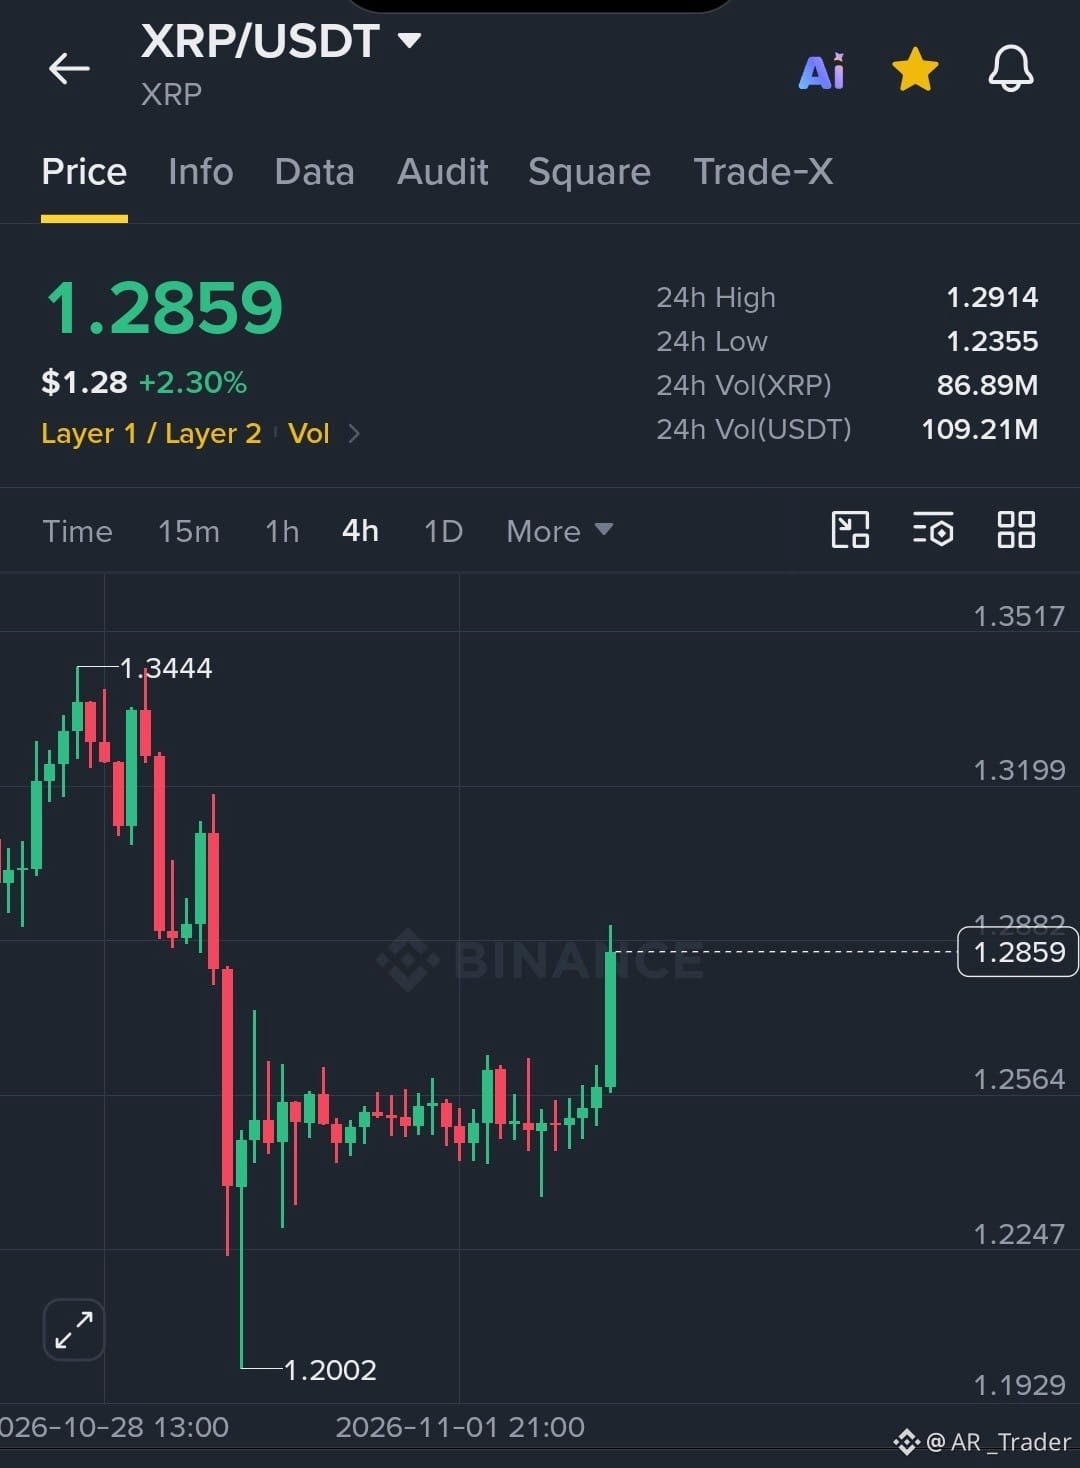
$XRP /USDT Breaks Out of Consolidation With Strong Bullish Momentum
Trade Setup: LONG
Entry Zone: 1.2800–1.2870
TP1: 1.3000
TP2: 1.3200
TP3: 1.3440
SL: 1.2650
Market Setup: The 4-hour chart shows a strong bullish candle breaking above the recent consolidation range near 1.2560. Holding above 1.2800 could support further upside toward the marked resistance levels, while a move below 1.2650 would weaken the setup.
Buy and trade $XRP
{future}(XRPUSDT)
$XRP /USDT Breaks Out of Consolidation With Strong Bullish Momentum
Trade Setup: LONG
Entry Zone: 1.2800–1.2870
TP1: 1.3000
TP2: 1.3200
TP3: 1.3440
SL: 1.2650
Market Setup: The 4-hour chart shows a strong bullish candle breaking above the recent consolidation range near 1.2560. Holding above 1.2800 could support further upside toward the marked resistance levels, while a move below 1.2650 would weaken the setup.
Buy and trade $XRP
Trade Setup: LONG
Entry Zone: 1.2800–1.2870
TP1: 1.3000
TP2: 1.3200
TP3: 1.3440
SL: 1.2650
Market Setup: The 4-hour chart shows a strong bullish candle breaking above the recent consolidation range near 1.2560. Holding above 1.2800 could support further upside toward the marked resistance levels, while a move below 1.2650 would weaken the setup.
Buy and trade $XRP
1
48
·
--
Bullish
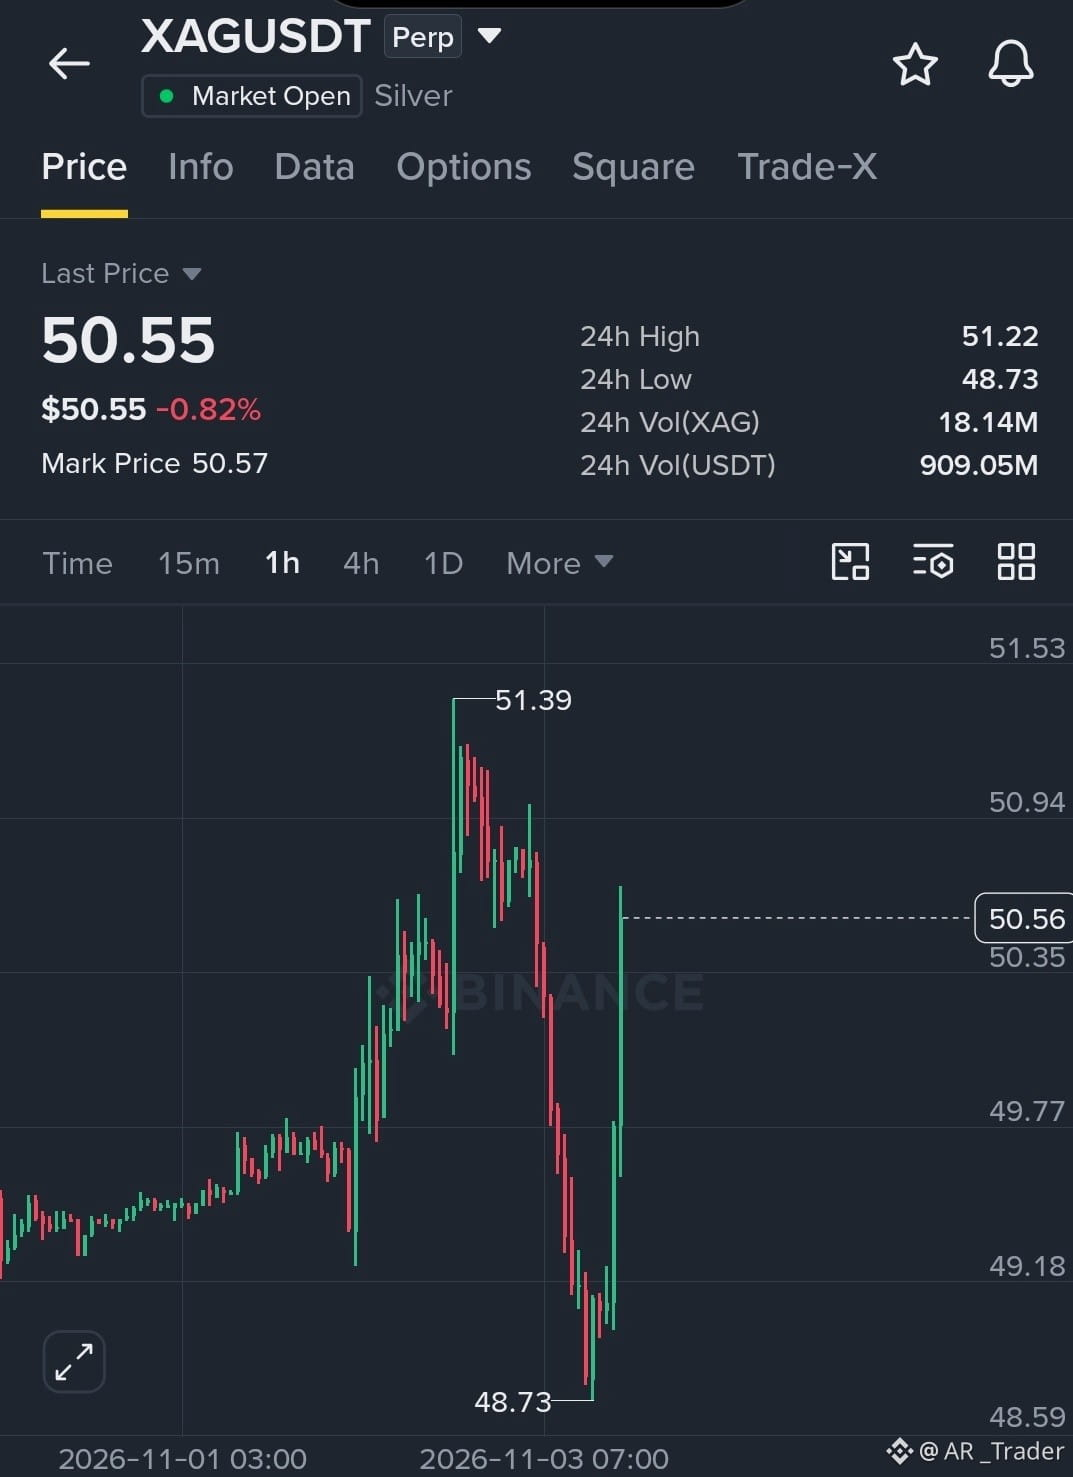
$XAG USDT Rebounds Strongly as Buyers Regain Control
Trade Setup: LONG
Entry Zone: 50.20–50.60
TP1: 50.95
TP2: 51.40
TP3: 52.00
SL: 49.70
Market Setup: The 1-hour chart shows a sharp recovery from 48.73, with strong bullish momentum pushing price back above 50.00. Resistance near 50.95–51.40 is the next key test. A sustained move above this zone could extend the rally, while losing 49.70 invalidates the setup.
Buy and trade $XAG
{future}(XAGUSDT)
$XAG USDT Rebounds Strongly as Buyers Regain Control
Trade Setup: LONG
Entry Zone: 50.20–50.60
TP1: 50.95
TP2: 51.40
TP3: 52.00
SL: 49.70
Market Setup: The 1-hour chart shows a sharp recovery from 48.73, with strong bullish momentum pushing price back above 50.00. Resistance near 50.95–51.40 is the next key test. A sustained move above this zone could extend the rally, while losing 49.70 invalidates the setup.
Buy and trade $XAG
Trade Setup: LONG
Entry Zone: 50.20–50.60
TP1: 50.95
TP2: 51.40
TP3: 52.00
SL: 49.70
Market Setup: The 1-hour chart shows a sharp recovery from 48.73, with strong bullish momentum pushing price back above 50.00. Resistance near 50.95–51.40 is the next key test. A sustained move above this zone could extend the rally, while losing 49.70 invalidates the setup.
Buy and trade $XAG
2
45
·
--
Bullish
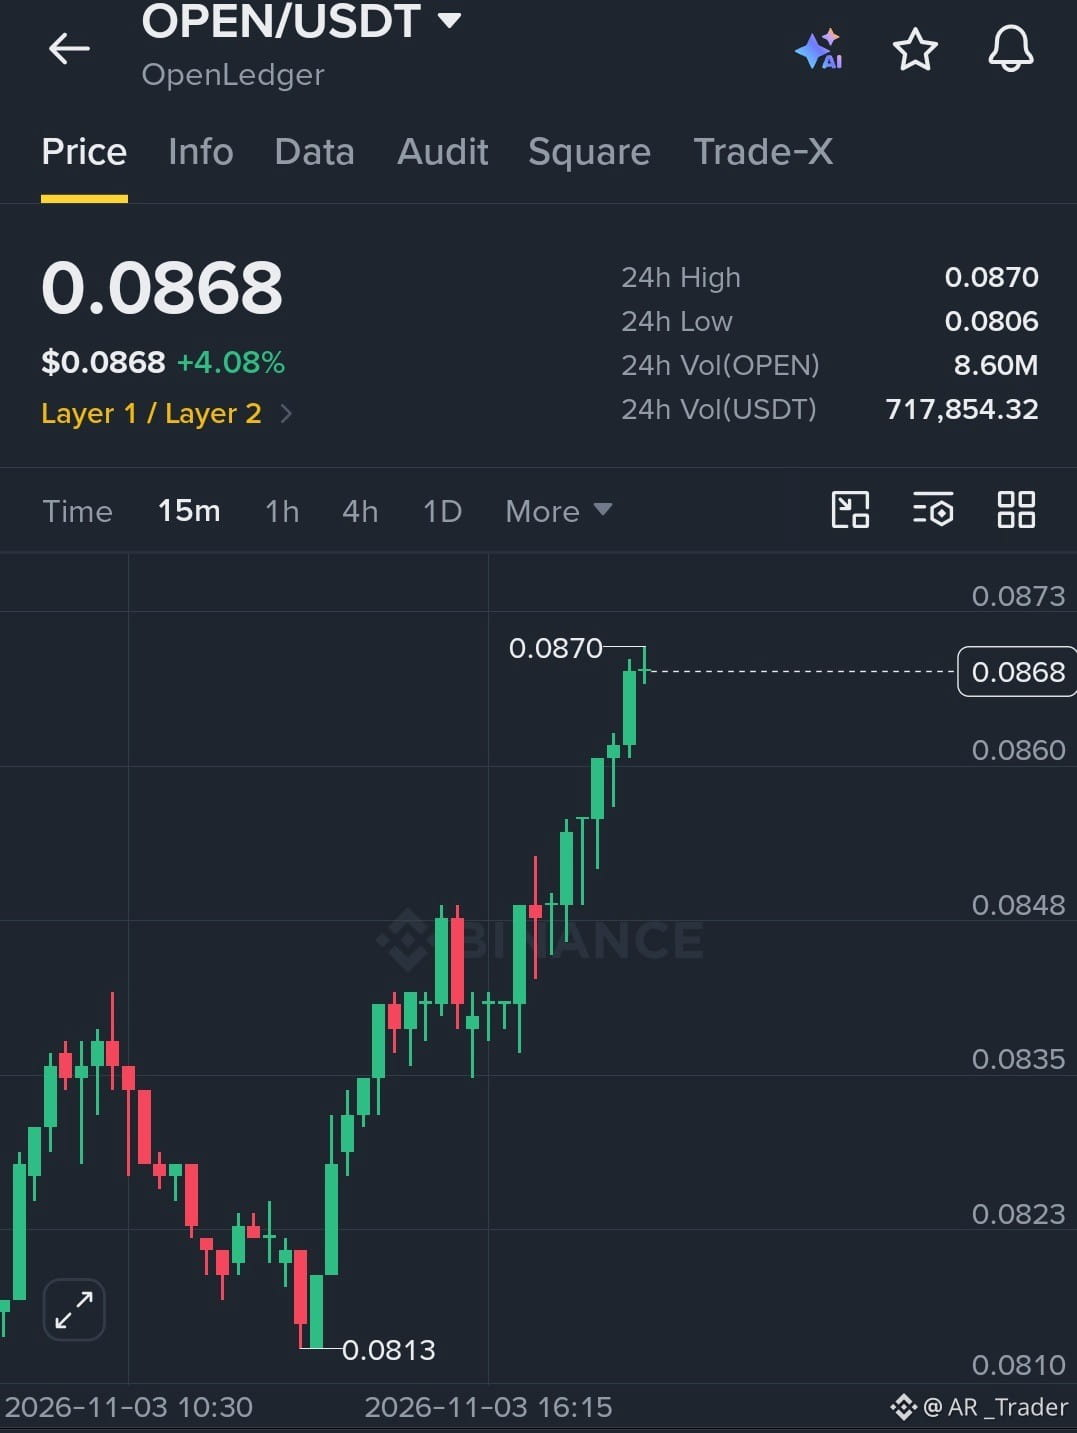
$OPEN /USDT Pushes Toward a Key Resistance Breakout
Trade Setup: LONG
Entry Zone: 0.0858–0.0865
TP1: 0.0875
TP2: 0.0885
TP3: 0.0900
SL: 0.0848
Market Setup: The 15-minute chart shows strong bullish momentum, with consecutive green candles forming higher highs and higher lows. Price is testing resistance near 0.0870; a confirmed breakout could trigger another upward move. Watch for a retest before entry.
Buy and trade $OPEN
{future}(OPENUSDT)
$OPEN /USDT Pushes Toward a Key Resistance Breakout
Trade Setup: LONG
Entry Zone: 0.0858–0.0865
TP1: 0.0875
TP2: 0.0885
TP3: 0.0900
SL: 0.0848
Market Setup: The 15-minute chart shows strong bullish momentum, with consecutive green candles forming higher highs and higher lows. Price is testing resistance near 0.0870; a confirmed breakout could trigger another upward move. Watch for a retest before entry.
Buy and trade $OPEN
Trade Setup: LONG
Entry Zone: 0.0858–0.0865
TP1: 0.0875
TP2: 0.0885
TP3: 0.0900
SL: 0.0848
Market Setup: The 15-minute chart shows strong bullish momentum, with consecutive green candles forming higher highs and higher lows. Price is testing resistance near 0.0870; a confirmed breakout could trigger another upward move. Watch for a retest before entry.
Buy and trade $OPEN
1
24
·
--
Bullish
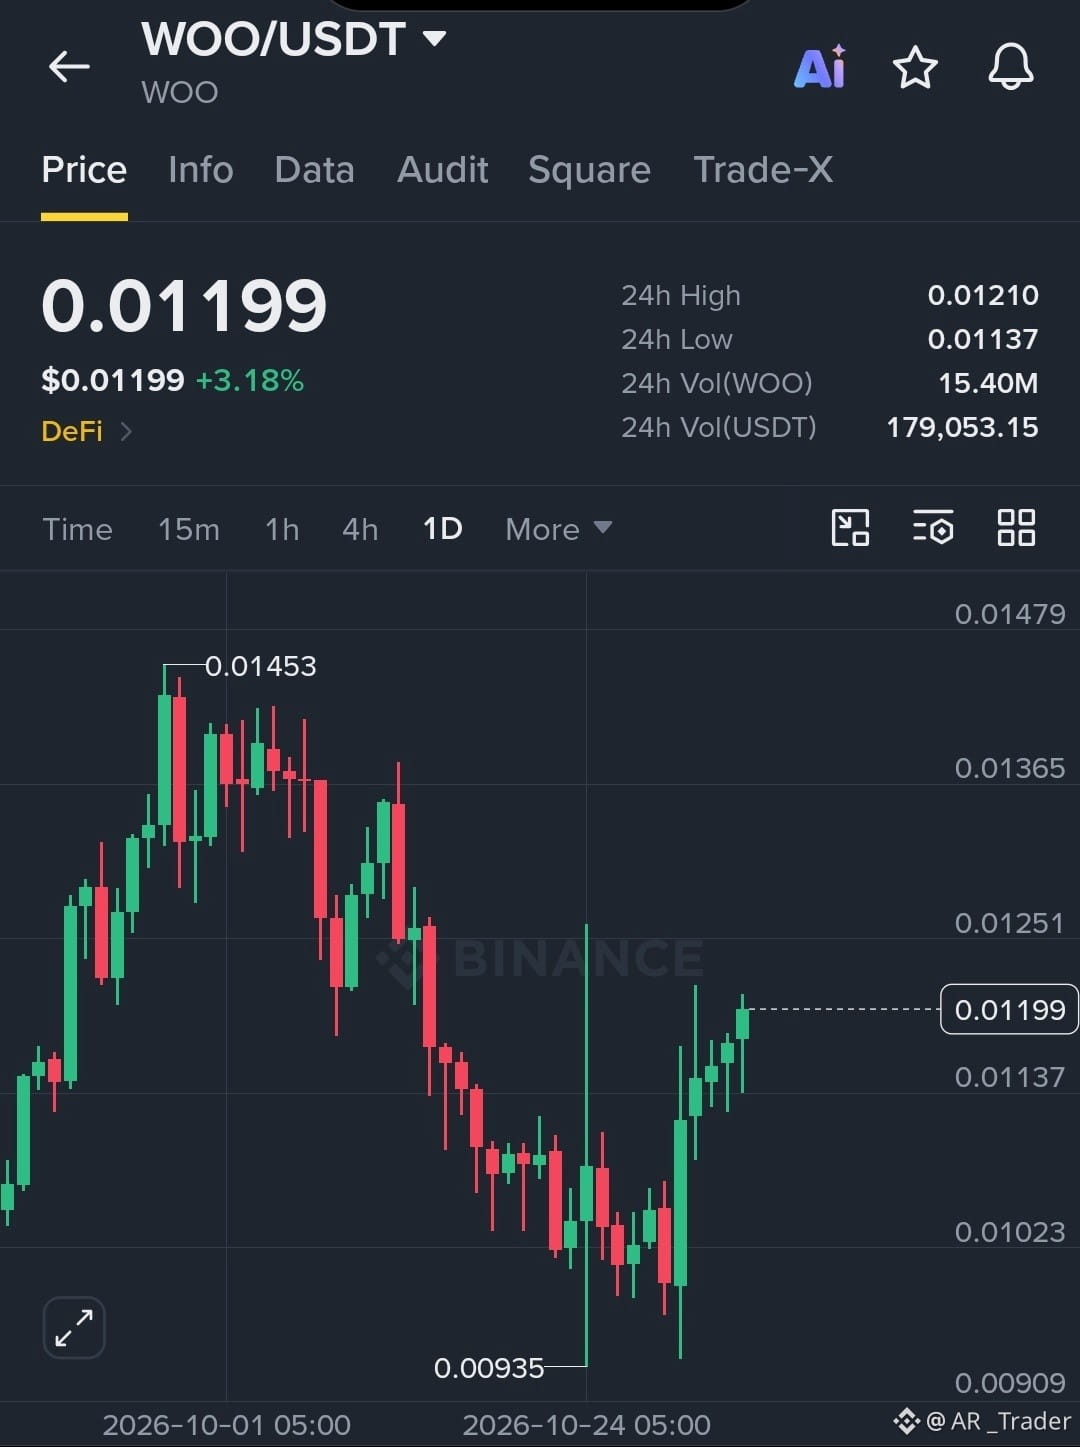
$WOO /USDT Builds Bullish Momentum After a Strong Recovery
Trade Setup: LONG
Entry Zone: 0.01170–0.01200
TP1: 0.01250
TP2: 0.01320
TP3: 0.01400
SL: 0.01120
Market Setup: The daily chart shows a recovery from the 0.00935 support area, with consecutive bullish candles indicating improving buying pressure. A breakout above 0.01210 could open the way toward higher resistance levels. Watch for confirmation before entry.
Buy and trade $WOO
{future}(WOOUSDT)
$WOO /USDT Builds Bullish Momentum After a Strong Recovery
Trade Setup: LONG
Entry Zone: 0.01170–0.01200
TP1: 0.01250
TP2: 0.01320
TP3: 0.01400
SL: 0.01120
Market Setup: The daily chart shows a recovery from the 0.00935 support area, with consecutive bullish candles indicating improving buying pressure. A breakout above 0.01210 could open the way toward higher resistance levels. Watch for confirmation before entry.
Buy and trade $WOO
Trade Setup: LONG
Entry Zone: 0.01170–0.01200
TP1: 0.01250
TP2: 0.01320
TP3: 0.01400
SL: 0.01120
Market Setup: The daily chart shows a recovery from the 0.00935 support area, with consecutive bullish candles indicating improving buying pressure. A breakout above 0.01210 could open the way toward higher resistance levels. Watch for confirmation before entry.
Buy and trade $WOO
1
24
·
--
Bullish
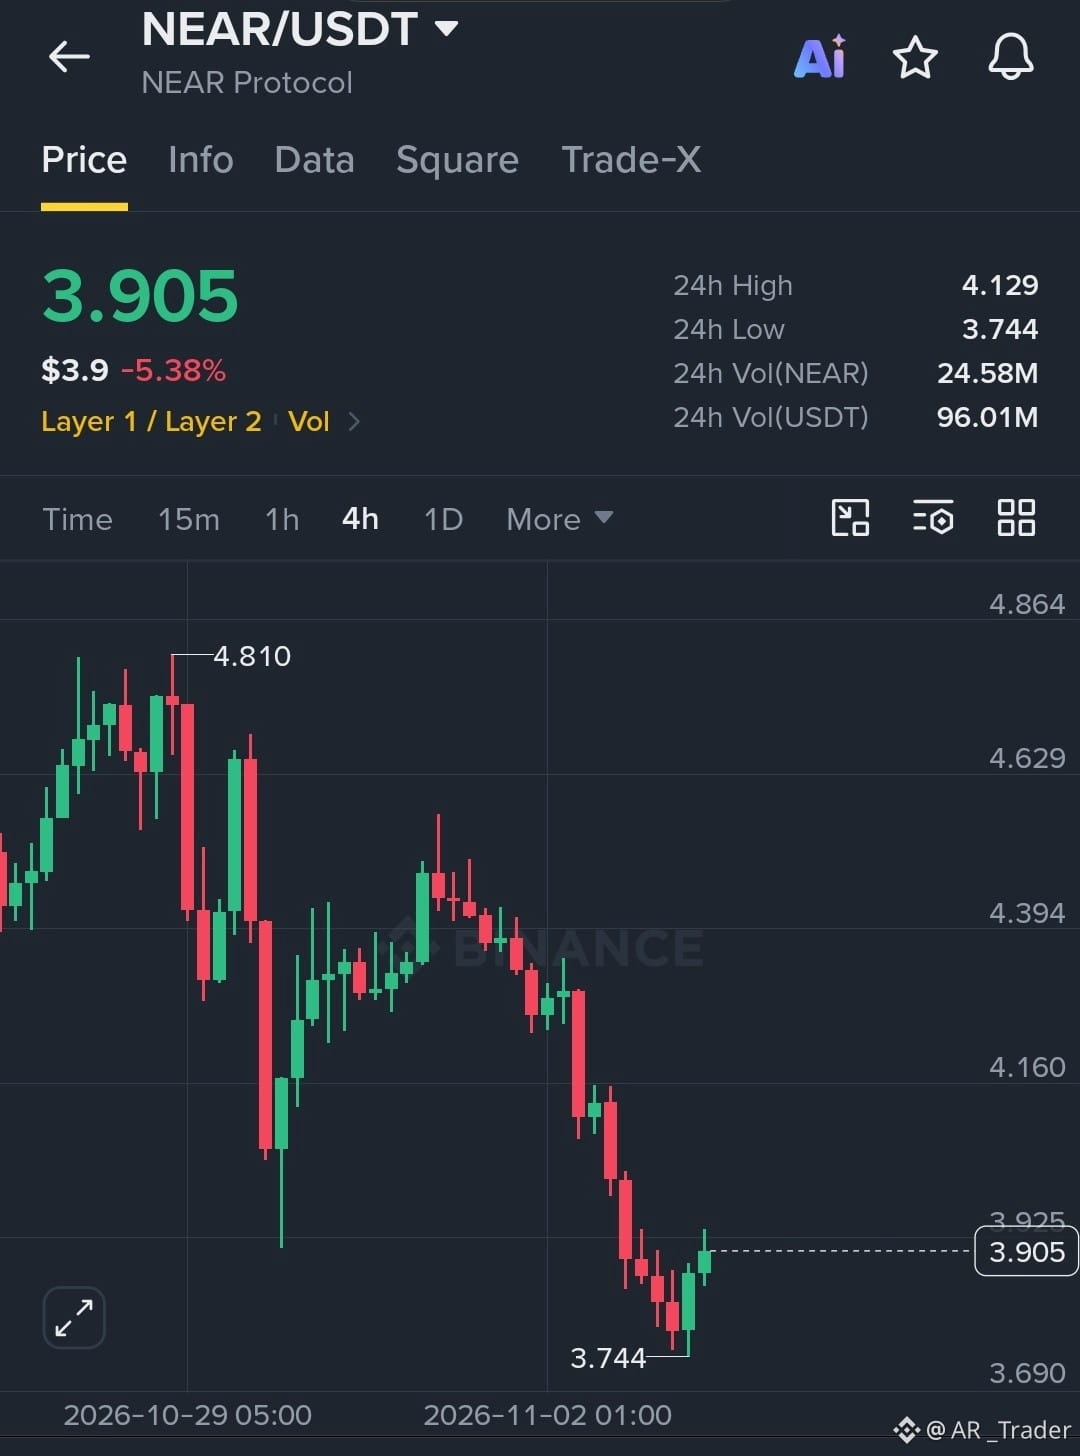
$NEAR /USDT Attempts a Bullish Recovery After Strong Selling Pressure
Trade Setup: LONG
Entry Zone: 3.880–3.920
TP1: 4.000
TP2: 4.100
TP3: 4.220
SL: 3.740
Market Setup: Price is showing an early recovery after bouncing from the 3.744 support zone. A sustained move above 3.925 could strengthen bullish momentum toward higher resistance levels. Watch for confirmation, as the broader 4H trend remains bearish.
{future}(NEARUSDT)
$NEAR /USDT Attempts a Bullish Recovery After Strong Selling Pressure
Trade Setup: LONG
Entry Zone: 3.880–3.920
TP1: 4.000
TP2: 4.100
TP3: 4.220
SL: 3.740
Market Setup: Price is showing an early recovery after bouncing from the 3.744 support zone. A sustained move above 3.925 could strengthen bullish momentum toward higher resistance levels. Watch for confirmation, as the broader 4H trend remains bearish.
Trade Setup: LONG
Entry Zone: 3.880–3.920
TP1: 4.000
TP2: 4.100
TP3: 4.220
SL: 3.740
Market Setup: Price is showing an early recovery after bouncing from the 3.744 support zone. A sustained move above 3.925 could strengthen bullish momentum toward higher resistance levels. Watch for confirmation, as the broader 4H trend remains bearish.
1
12
·
--
Bullish
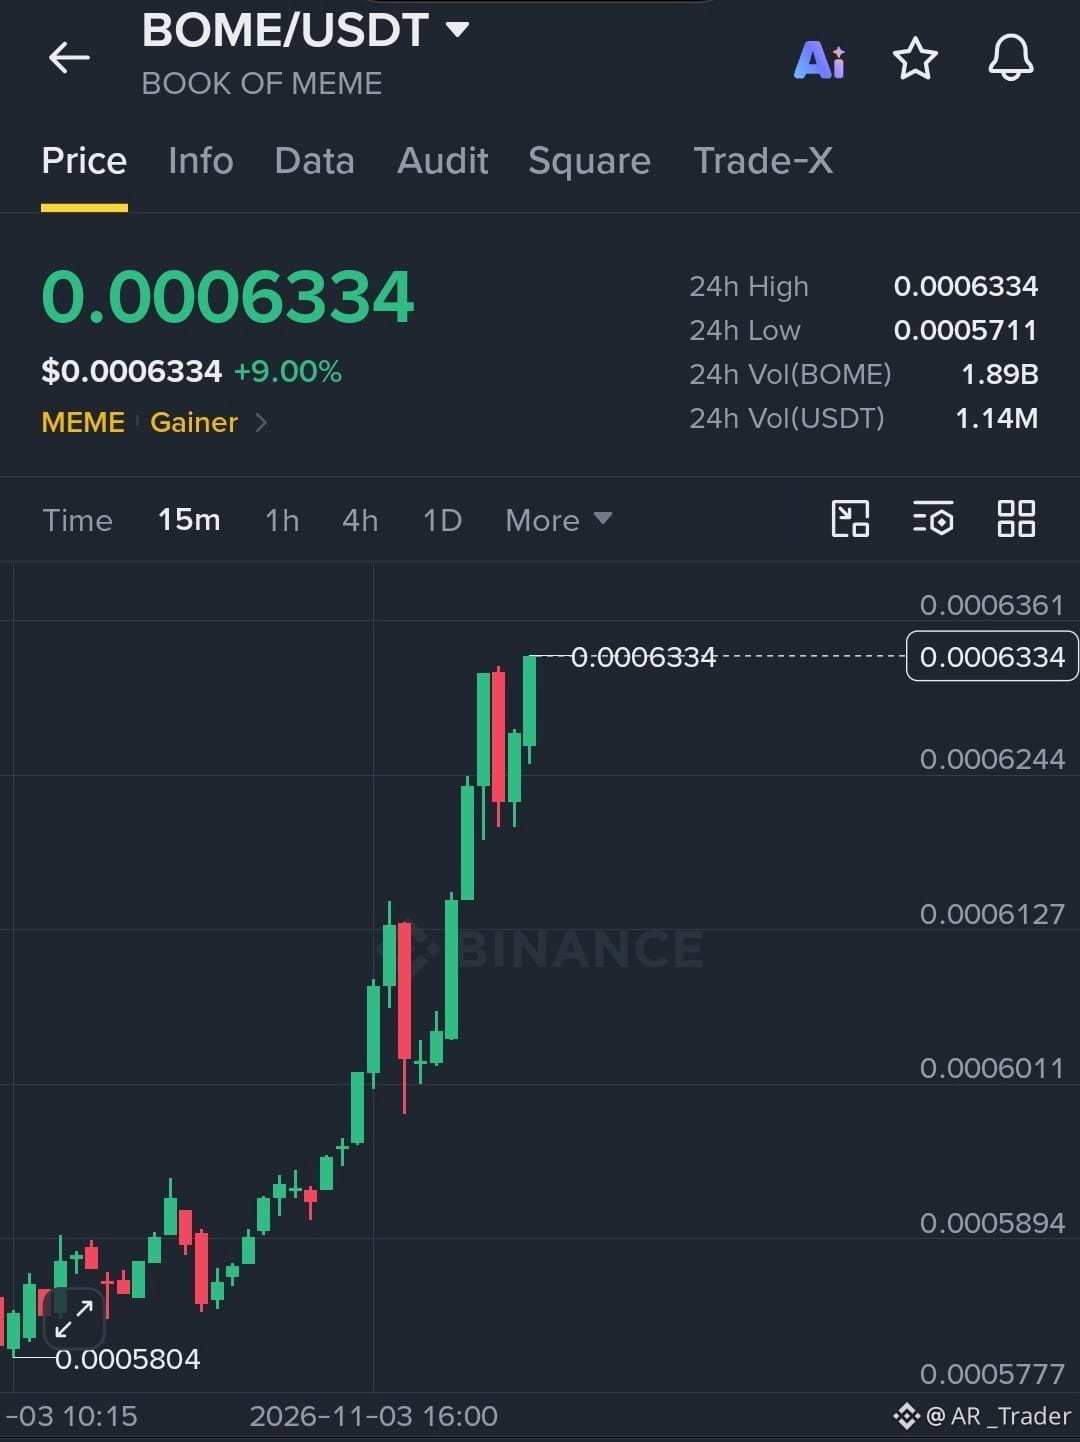
$BOME /USDT Explodes Higher as Bulls Target Another Breakout
Trade Setup: LONG
Entry Zone: 0.0006270–0.0006330
TP1: 0.0006400
TP2: 0.0006500
TP3: 0.0006620
SL: 0.0006180
Market Setup: Strong bullish momentum and consecutive green candles show aggressive buying pressure. A breakout above 0.0006334 could trigger another upward move. Holding above the 0.0006244 support zone is important for continuation.
{future}(BOMEUSDT)
$BOME /USDT Explodes Higher as Bulls Target Another Breakout
Trade Setup: LONG
Entry Zone: 0.0006270–0.0006330
TP1: 0.0006400
TP2: 0.0006500
TP3: 0.0006620
SL: 0.0006180
Market Setup: Strong bullish momentum and consecutive green candles show aggressive buying pressure. A breakout above 0.0006334 could trigger another upward move. Holding above the 0.0006244 support zone is important for continuation.
Trade Setup: LONG
Entry Zone: 0.0006270–0.0006330
TP1: 0.0006400
TP2: 0.0006500
TP3: 0.0006620
SL: 0.0006180
Market Setup: Strong bullish momentum and consecutive green candles show aggressive buying pressure. A breakout above 0.0006334 could trigger another upward move. Holding above the 0.0006244 support zone is important for continuation.
1
18
·
--
Bullish
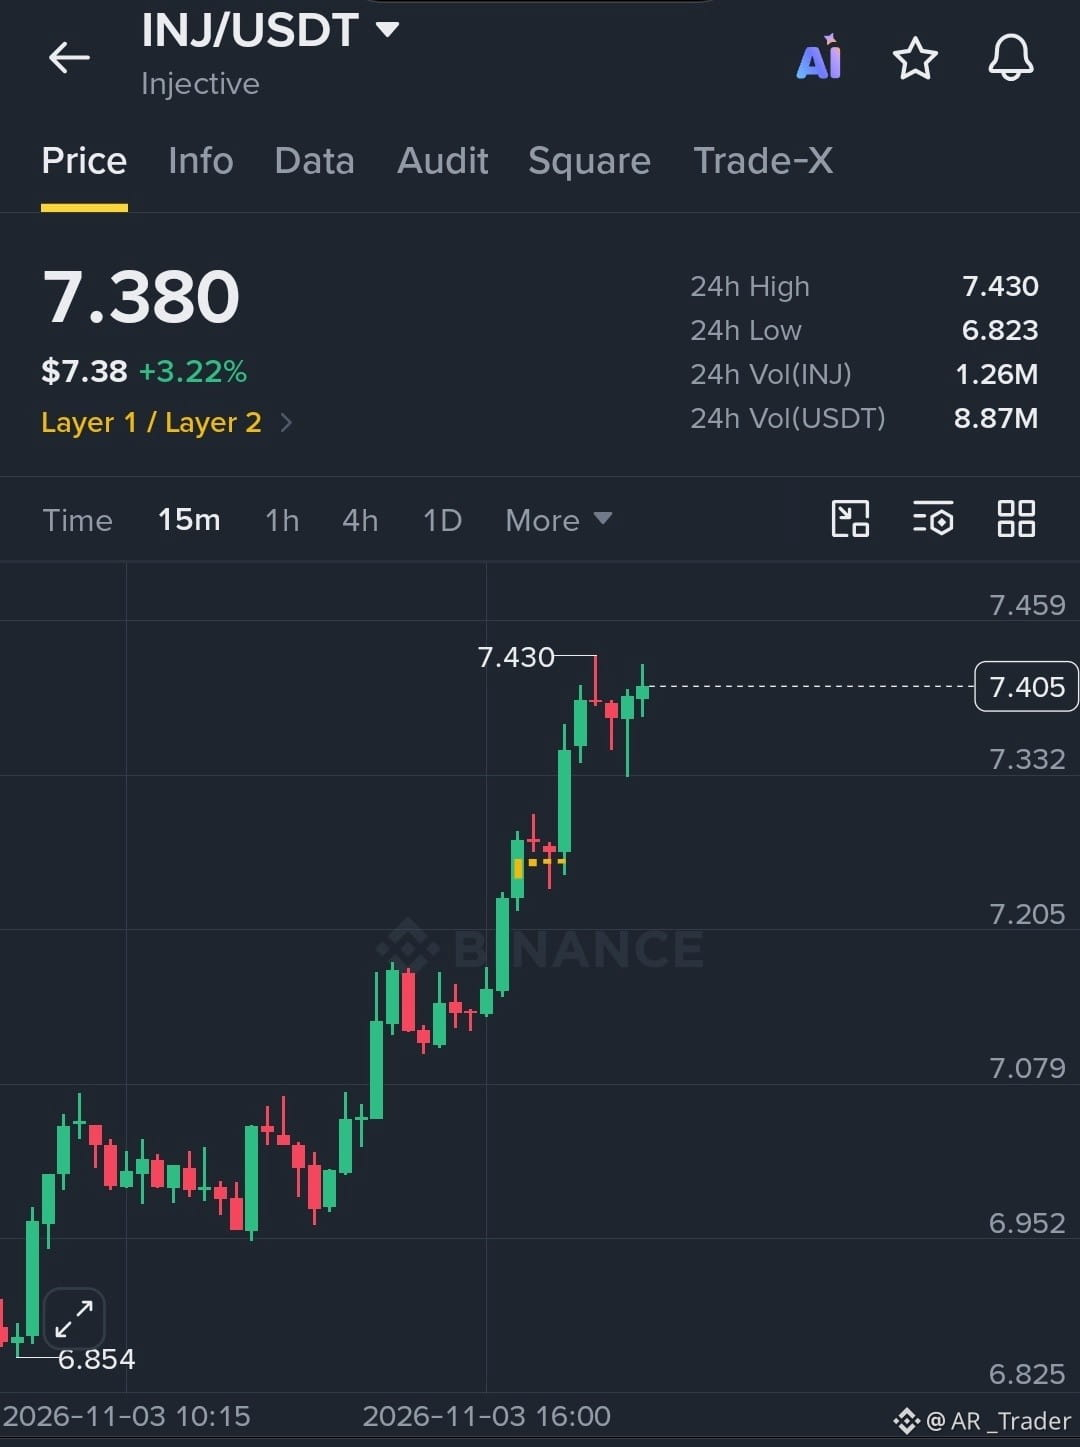
$INJ /USDT Bulls Push Toward a Fresh Breakout as Momentum Strengthens
Trade Setup: LONG
Entry Zone: 7.350–7.400
TP1: 7.480
TP2: 7.550
TP3: 7.650
SL: 7.280
Market Setup: Strong bullish momentum is driving price toward the 7.430 resistance zone. Holding above 7.350 could support another upward move, while a breakout above 7.430 may open the way toward higher targets. Watch for confirmation before entry.
{future}(INJUSDT)
$INJ /USDT Bulls Push Toward a Fresh Breakout as Momentum Strengthens
Trade Setup: LONG
Entry Zone: 7.350–7.400
TP1: 7.480
TP2: 7.550
TP3: 7.650
SL: 7.280
Market Setup: Strong bullish momentum is driving price toward the 7.430 resistance zone. Holding above 7.350 could support another upward move, while a breakout above 7.430 may open the way toward higher targets. Watch for confirmation before entry.
Trade Setup: LONG
Entry Zone: 7.350–7.400
TP1: 7.480
TP2: 7.550
TP3: 7.650
SL: 7.280
Market Setup: Strong bullish momentum is driving price toward the 7.430 resistance zone. Holding above 7.350 could support another upward move, while a breakout above 7.430 may open the way toward higher targets. Watch for confirmation before entry.
1
27
·
--
Bullish
$HOT /USDT Explodes Higher With Strong Bullish Momentum
Trade Setup: LONG
Entry Zone: 0.000510–0.000525
TP1: 0.000550
TP2: 0.000575
TP3: 0.000610
SL: 0.000485
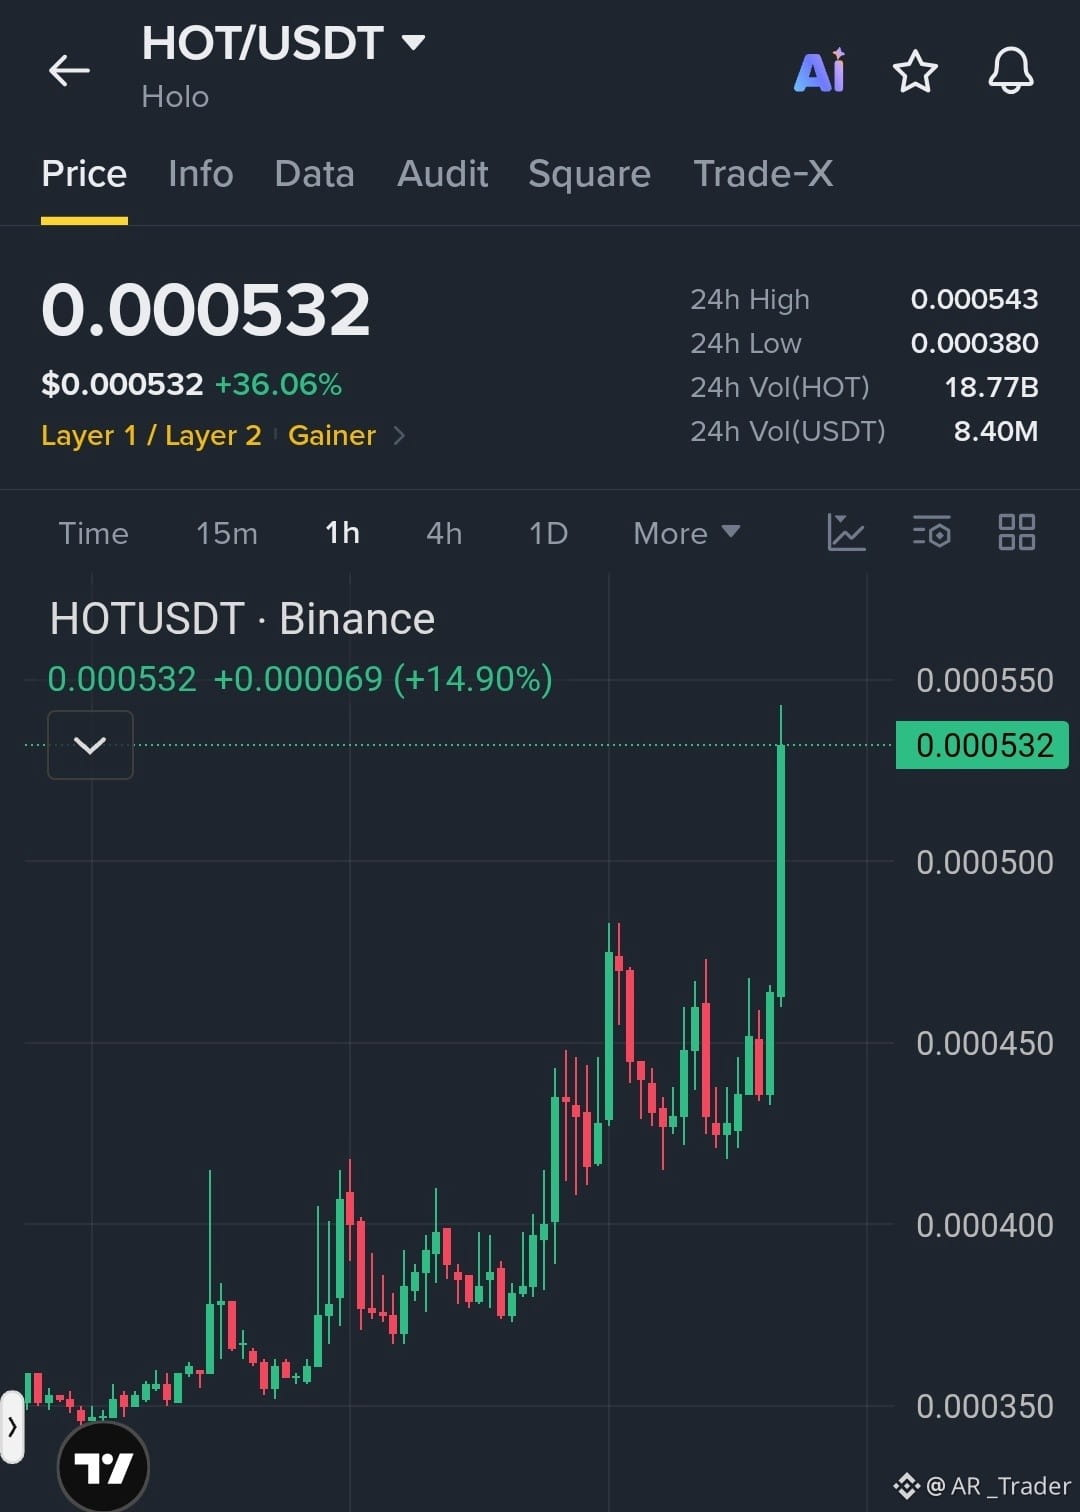
Market Setup: The 1-hour chart shows a powerful bullish breakout with strong buying volume, pushing price toward the 0.000543 resistance area. A confirmed breakout above this level could extend the rally, while a pullback toward the entry zone may offer a better opportunity. Avoid chasing the sharp green candle.
{future}(HOTUSDT)
$HOT /USDT Explodes Higher With Strong Bullish Momentum
Trade Setup: LONG
Entry Zone: 0.000510–0.000525
TP1: 0.000550
TP2: 0.000575
TP3: 0.000610
SL: 0.000485
Market Setup: The 1-hour chart shows a powerful bullish breakout with strong buying volume, pushing price toward the 0.000543 resistance area. A confirmed breakout above this level could extend the rally, while a pullback toward the entry zone may offer a better opportunity. Avoid chasing the sharp green candle.
Trade Setup: LONG
Entry Zone: 0.000510–0.000525
TP1: 0.000550
TP2: 0.000575
TP3: 0.000610
SL: 0.000485
Market Setup: The 1-hour chart shows a powerful bullish breakout with strong buying volume, pushing price toward the 0.000543 resistance area. A confirmed breakout above this level could extend the rally, while a pullback toward the entry zone may offer a better opportunity. Avoid chasing the sharp green candle.
1
59
·
--
Bullish
$BNB /USDT Reclaims Momentum With a Strong Bullish Breakout
Trade Setup: LONG
Entry Zone: 700.00–702.50
TP1: 705.00
TP2: 708.00
TP3: 712.00
SL: 696.50
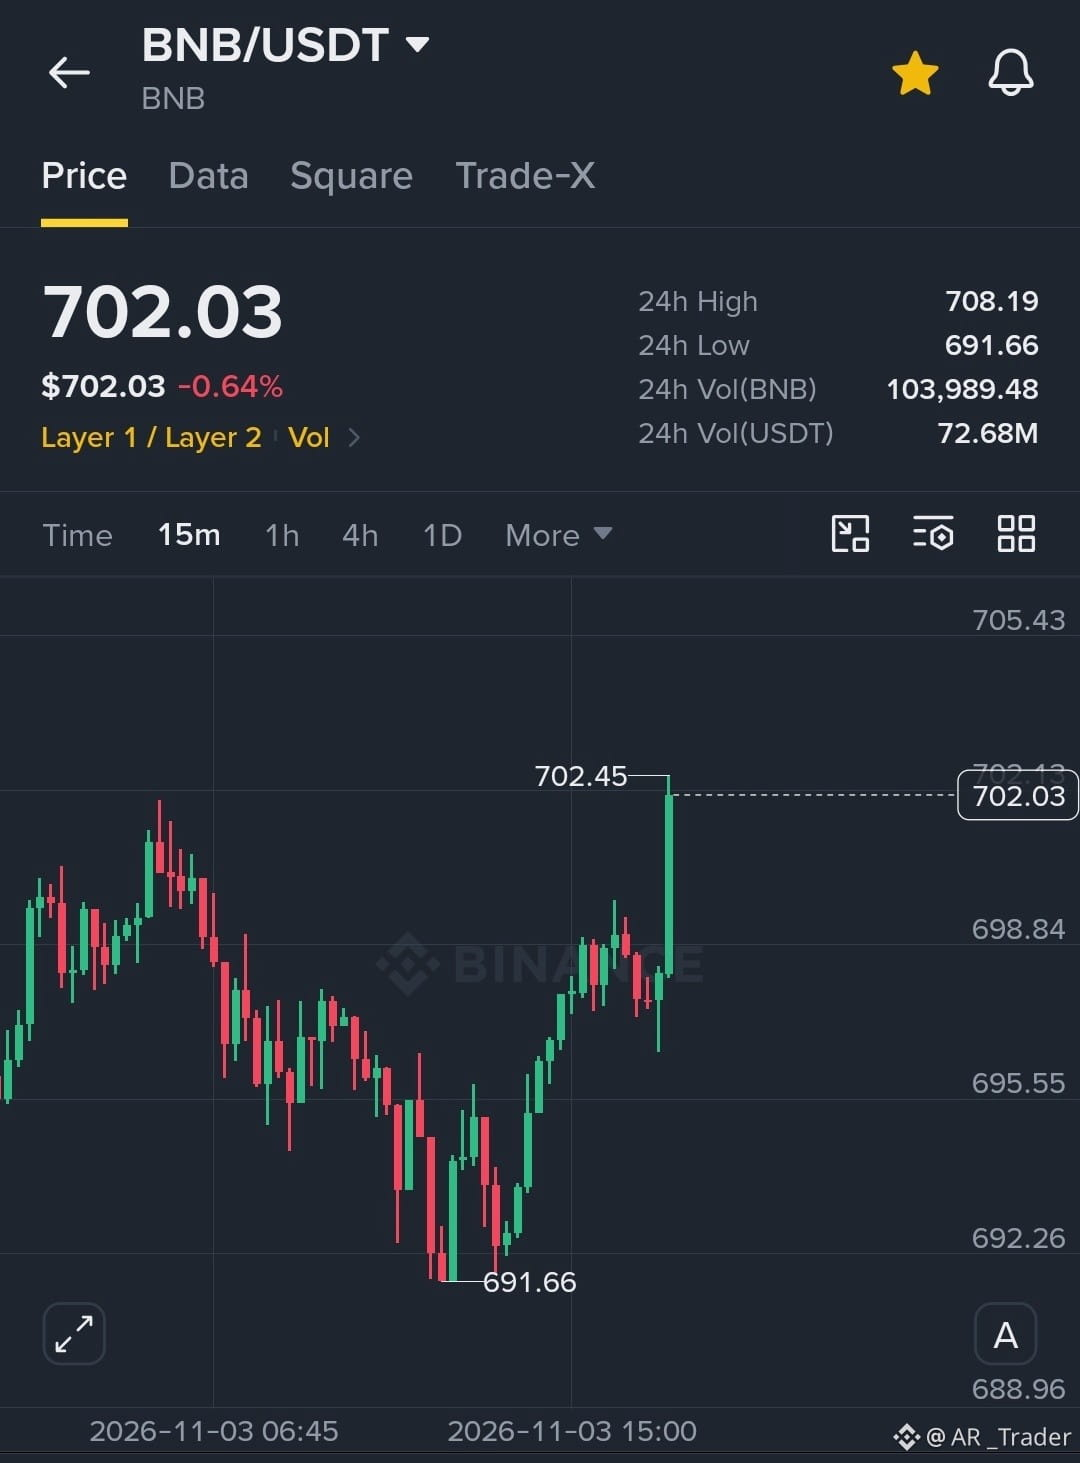
Market Setup: The 15-minute chart shows a strong recovery from 691.66, followed by a powerful bullish candle breaking above recent resistance near 698.80. Holding above 700 could support further upside, while a move back below 698 may weaken the setup.
Buy and trade $BNB
{future}(BNBUSDT)
$BNB /USDT Reclaims Momentum With a Strong Bullish Breakout
Trade Setup: LONG
Entry Zone: 700.00–702.50
TP1: 705.00
TP2: 708.00
TP3: 712.00
SL: 696.50
Market Setup: The 15-minute chart shows a strong recovery from 691.66, followed by a powerful bullish candle breaking above recent resistance near 698.80. Holding above 700 could support further upside, while a move back below 698 may weaken the setup.
Buy and trade $BNB
Trade Setup: LONG
Entry Zone: 700.00–702.50
TP1: 705.00
TP2: 708.00
TP3: 712.00
SL: 696.50
Market Setup: The 15-minute chart shows a strong recovery from 691.66, followed by a powerful bullish candle breaking above recent resistance near 698.80. Holding above 700 could support further upside, while a move back below 698 may weaken the setup.
Buy and trade $BNB
1
107
·
--
Bullish
$HOT /USDT Explodes Higher With Strong Bullish Momentum
Trade Setup: LONG
Entry Zone: 0.000510–0.000525
TP1: 0.000550
TP2: 0.000575
TP3: 0.000610
SL: 0.000485
Market Setup: The 1-hour chart shows a powerful bullish breakout with strong buying volume, pushing price toward the 0.000543 resistance area. A confirmed breakout above this level could extend the rally, while a pullback toward the entry zone may offer a better opportunity. Avoid chasing the sharp green candle.
{spot}(HOTUSDT)
$HOT /USDT Explodes Higher With Strong Bullish Momentum
Trade Setup: LONG
Entry Zone: 0.000510–0.000525
TP1: 0.000550
TP2: 0.000575
TP3: 0.000610
SL: 0.000485
Market Setup: The 1-hour chart shows a powerful bullish breakout with strong buying volume, pushing price toward the 0.000543 resistance area. A confirmed breakout above this level could extend the rally, while a pullback toward the entry zone may offer a better opportunity. Avoid chasing the sharp green candle.
Trade Setup: LONG
Entry Zone: 0.000510–0.000525
TP1: 0.000550
TP2: 0.000575
TP3: 0.000610
SL: 0.000485
Market Setup: The 1-hour chart shows a powerful bullish breakout with strong buying volume, pushing price toward the 0.000543 resistance area. A confirmed breakout above this level could extend the rally, while a pullback toward the entry zone may offer a better opportunity. Avoid chasing the sharp green candle.
1
28
·
--
Bullish
$ACT /USDT Breaks Higher With Strong Bullish Momentum
Trade Setup: LONG
Entry Zone: 0.00875–0.00890
TP1: 0.00905
TP2: 0.00925
TP3: 0.00950
SL: 0.00855
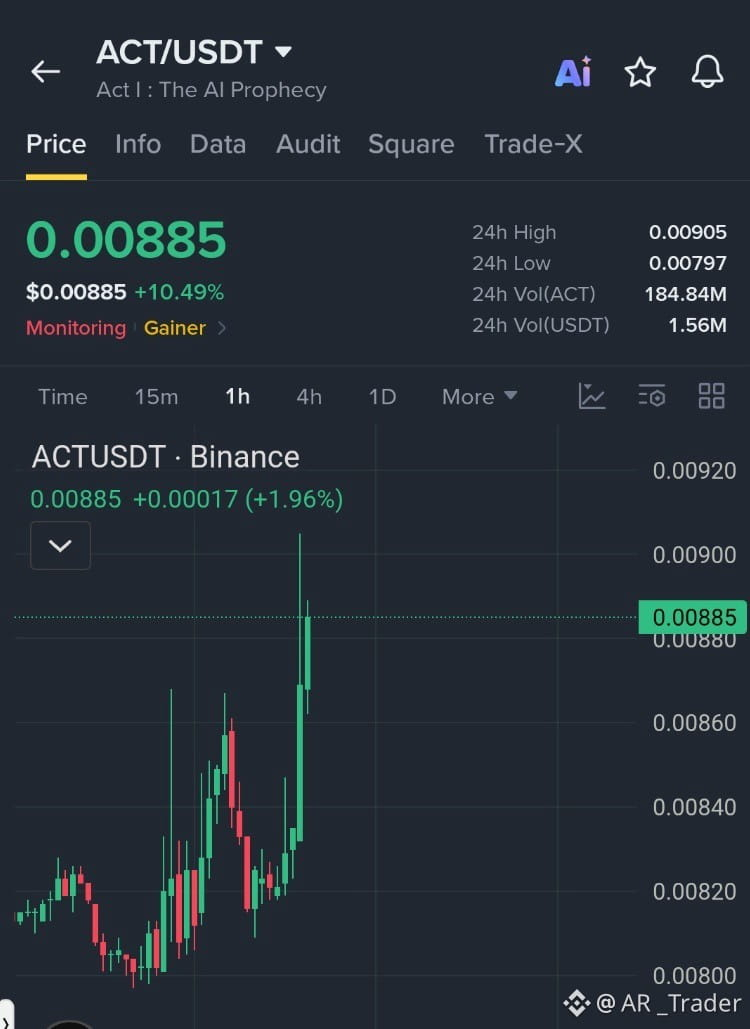
Market Setup: The 1-hour chart shows a strong bullish breakout with powerful buying pressure. Price is approaching resistance near 0.00905; a confirmed move above this level could open the way toward higher targets. Watch for a retest before entry.
Buy and trade $ACT
{future}(ACTUSDT)
$ACT /USDT Breaks Higher With Strong Bullish Momentum
Trade Setup: LONG
Entry Zone: 0.00875–0.00890
TP1: 0.00905
TP2: 0.00925
TP3: 0.00950
SL: 0.00855
Market Setup: The 1-hour chart shows a strong bullish breakout with powerful buying pressure. Price is approaching resistance near 0.00905; a confirmed move above this level could open the way toward higher targets. Watch for a retest before entry.
Buy and trade $ACT
Trade Setup: LONG
Entry Zone: 0.00875–0.00890
TP1: 0.00905
TP2: 0.00925
TP3: 0.00950
SL: 0.00855
Market Setup: The 1-hour chart shows a strong bullish breakout with powerful buying pressure. Price is approaching resistance near 0.00905; a confirmed move above this level could open the way toward higher targets. Watch for a retest before entry.
Buy and trade $ACT
1
49
·
--
Bullish
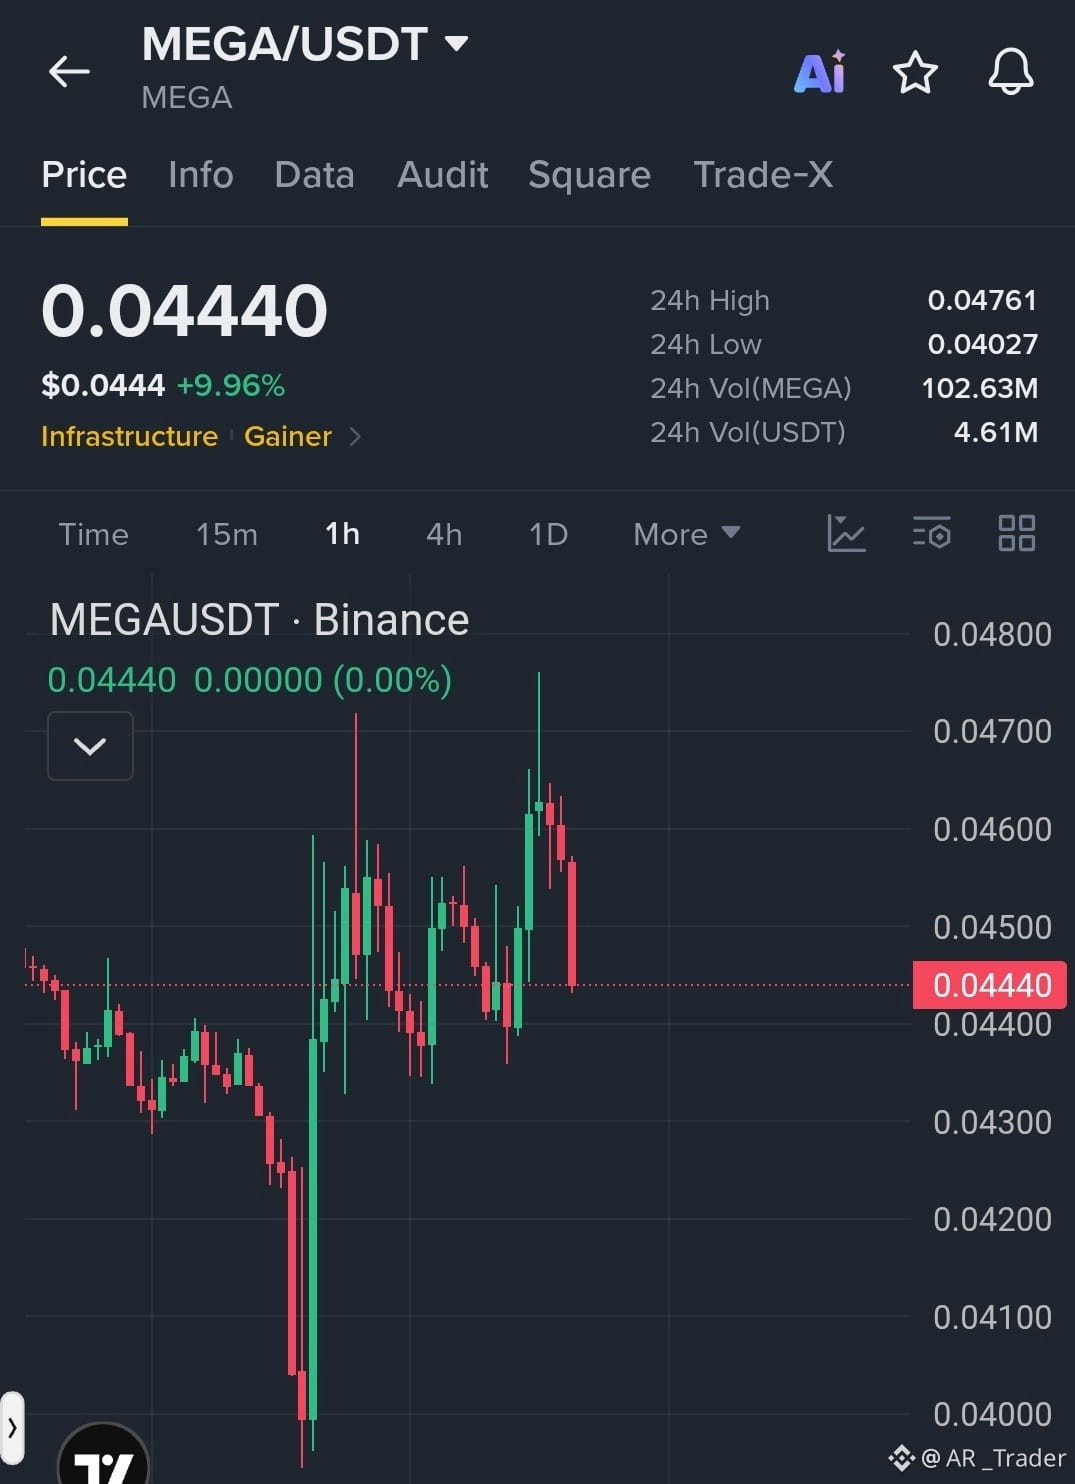
$MEGA /USDT Faces Fresh Selling Pressure After Rejection Near Resistance
Trade Setup: SHORT
Entry Zone: 0.04440–0.04500
TP1: 0.04350
TP2: 0.04250
TP3: 0.04100
SL: 0.04620
Market Setup: The 1-hour chart shows rejection near 0.0460–0.0470, followed by a strong bearish candle. A break below 0.0440 could extend the correction toward lower support levels. Watch for confirmation before entering.
Sell and trade $MEGA
{future}(MEGAUSDT)
$MEGA /USDT Faces Fresh Selling Pressure After Rejection Near Resistance
Trade Setup: SHORT
Entry Zone: 0.04440–0.04500
TP1: 0.04350
TP2: 0.04250
TP3: 0.04100
SL: 0.04620
Market Setup: The 1-hour chart shows rejection near 0.0460–0.0470, followed by a strong bearish candle. A break below 0.0440 could extend the correction toward lower support levels. Watch for confirmation before entering.
Sell and trade $MEGA
Trade Setup: SHORT
Entry Zone: 0.04440–0.04500
TP1: 0.04350
TP2: 0.04250
TP3: 0.04100
SL: 0.04620
Market Setup: The 1-hour chart shows rejection near 0.0460–0.0470, followed by a strong bearish candle. A break below 0.0440 could extend the correction toward lower support levels. Watch for confirmation before entering.
Sell and trade $MEGA
1
34
·
--
Bullish
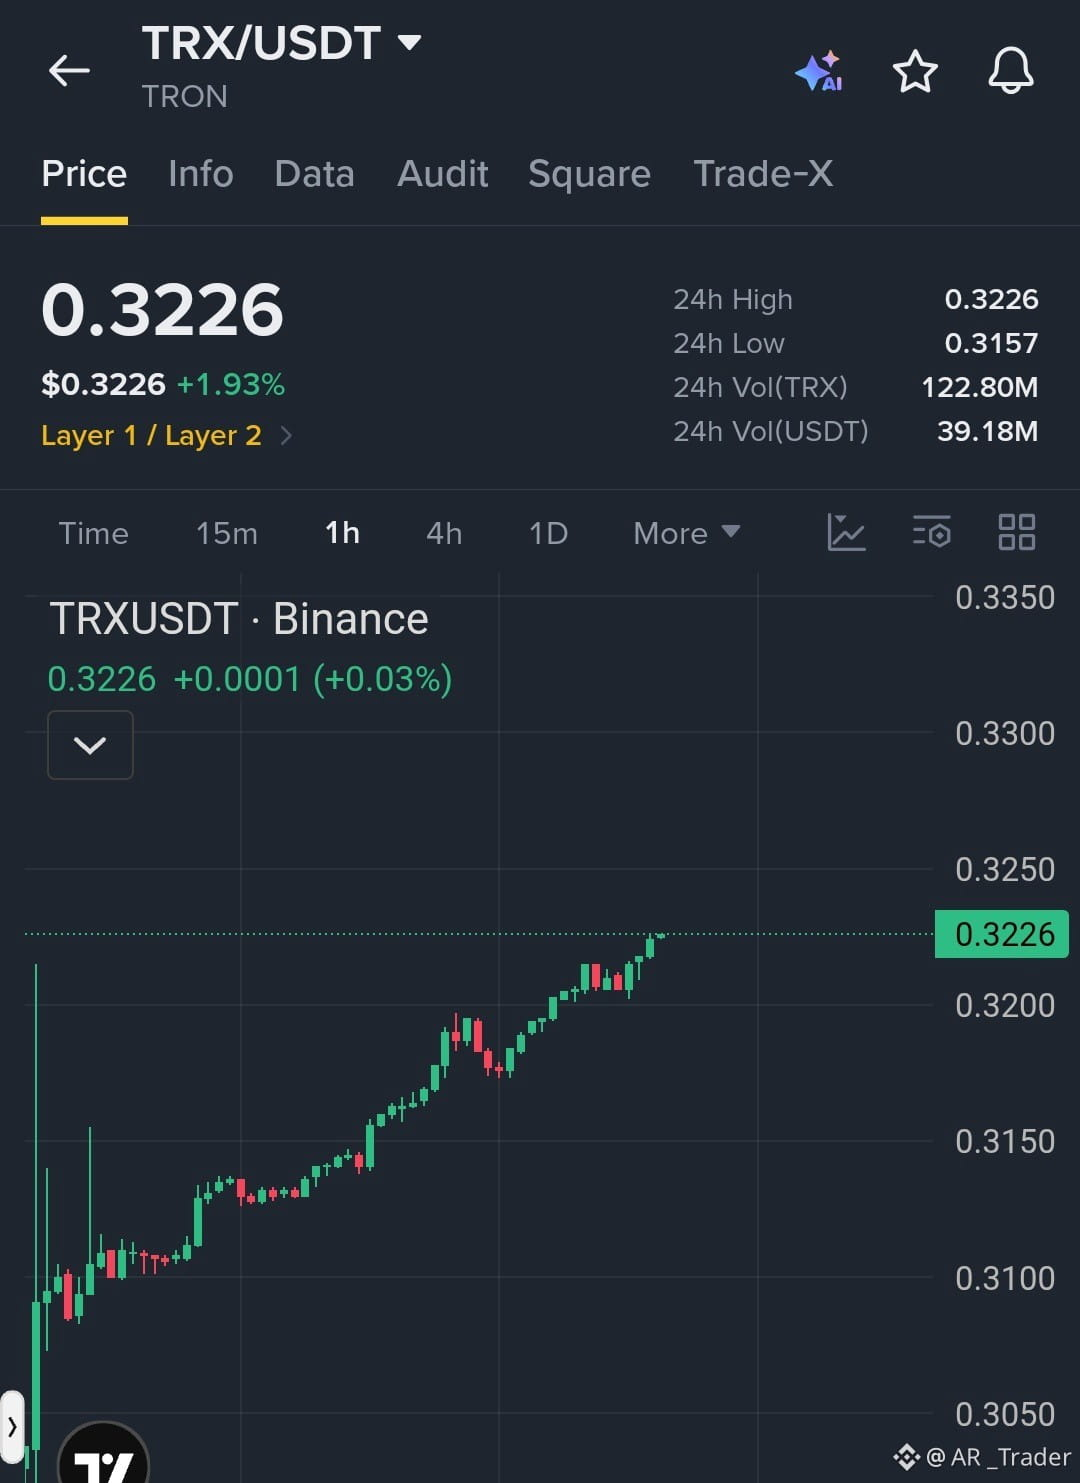
$TRX /USDT Continues Its Strong Climb Toward Higher Resistance
Trade Setup: LONG
Entry Zone: 0.3210–0.3230
TP1: 0.3250
TP2: 0.3280
TP3: 0.3320
SL: 0.3175
Market Setup: The 1-hour chart shows a steady bullish trend with higher highs and higher lows. Price is testing 0.3226 resistance; a clean breakout could extend the rally toward 0.3280 and 0.3320. Watch for a pullback if support near 0.3200 fails.
Buy and trade $TRX
{future}(TRXUSDT)
$TRX /USDT Continues Its Strong Climb Toward Higher Resistance
Trade Setup: LONG
Entry Zone: 0.3210–0.3230
TP1: 0.3250
TP2: 0.3280
TP3: 0.3320
SL: 0.3175
Market Setup: The 1-hour chart shows a steady bullish trend with higher highs and higher lows. Price is testing 0.3226 resistance; a clean breakout could extend the rally toward 0.3280 and 0.3320. Watch for a pullback if support near 0.3200 fails.
Buy and trade $TRX
Trade Setup: LONG
Entry Zone: 0.3210–0.3230
TP1: 0.3250
TP2: 0.3280
TP3: 0.3320
SL: 0.3175
Market Setup: The 1-hour chart shows a steady bullish trend with higher highs and higher lows. Price is testing 0.3226 resistance; a clean breakout could extend the rally toward 0.3280 and 0.3320. Watch for a pullback if support near 0.3200 fails.
Buy and trade $TRX
1
35
·
--
Bullish
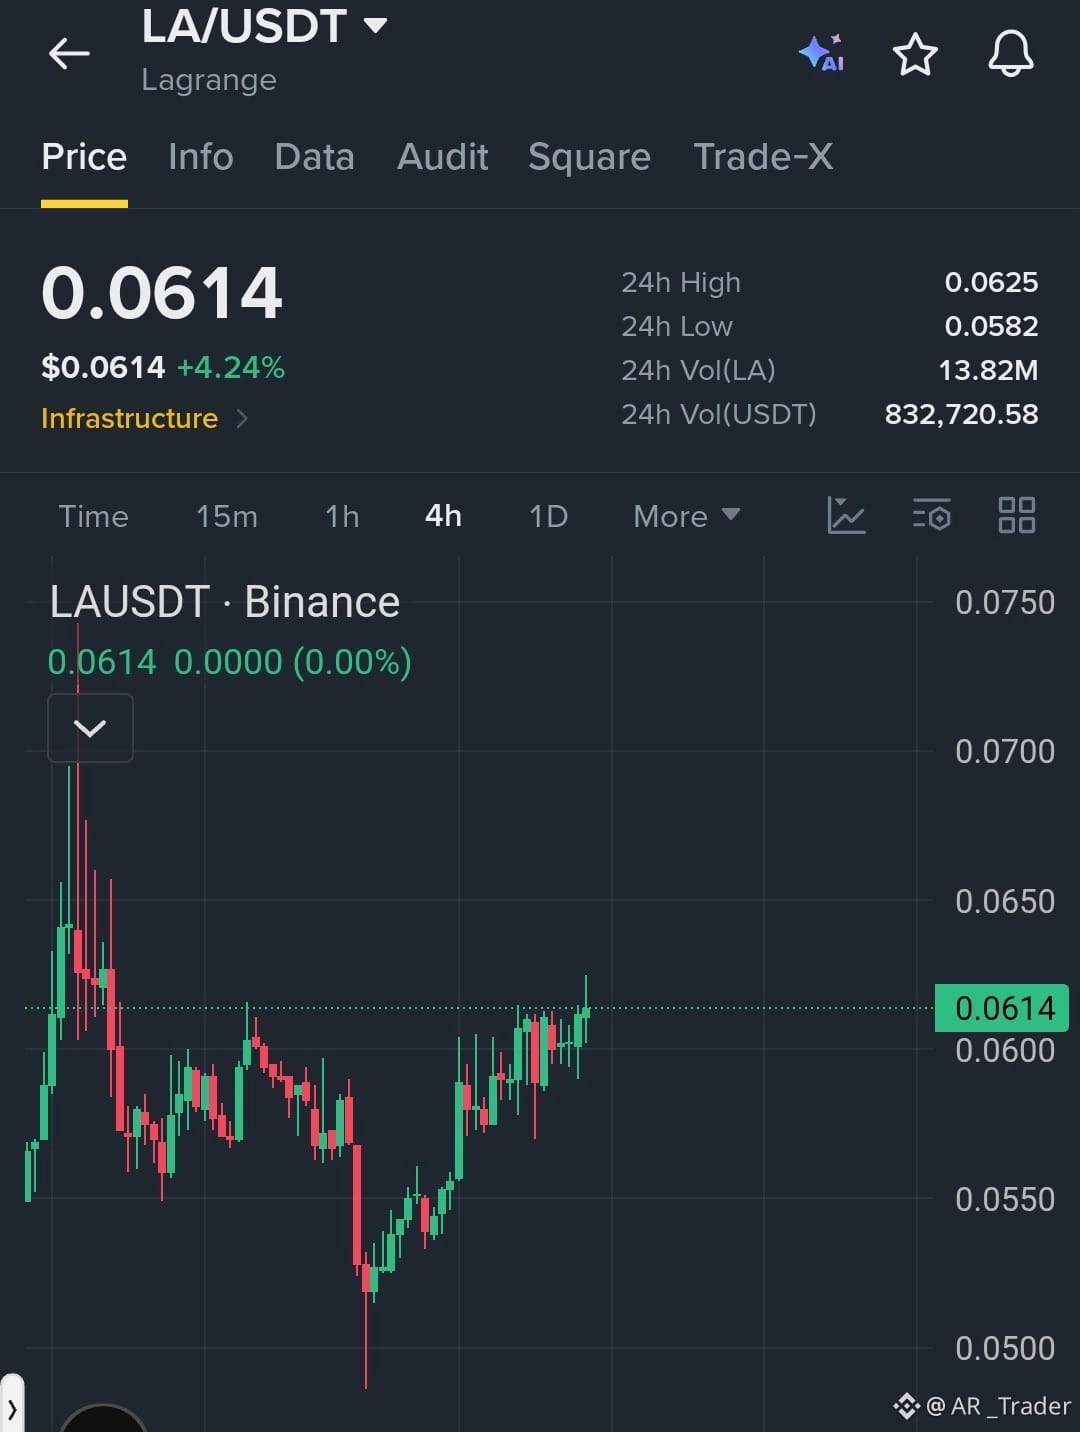
$LA /USDT Builds Bullish Momentum Toward a Key Breakout
Trade Setup: LONG
Entry Zone: 0.0608–0.0615
TP1: 0.0630
TP2: 0.0650
TP3: 0.0680
SL: 0.0580
Market Setup: Price is showing a steady recovery with higher lows after bouncing from the 0.0520 support area. Buyers are testing resistance near 0.0625; a confirmed breakout could push price toward 0.0650 and 0.0680. A move below 0.0580 would weaken the bullish structure.
Buy and trade $LA
{future}(LAUSDT)
$LA /USDT Builds Bullish Momentum Toward a Key Breakout
Trade Setup: LONG
Entry Zone: 0.0608–0.0615
TP1: 0.0630
TP2: 0.0650
TP3: 0.0680
SL: 0.0580
Market Setup: Price is showing a steady recovery with higher lows after bouncing from the 0.0520 support area. Buyers are testing resistance near 0.0625; a confirmed breakout could push price toward 0.0650 and 0.0680. A move below 0.0580 would weaken the bullish structure.
Buy and trade $LA
Trade Setup: LONG
Entry Zone: 0.0608–0.0615
TP1: 0.0630
TP2: 0.0650
TP3: 0.0680
SL: 0.0580
Market Setup: Price is showing a steady recovery with higher lows after bouncing from the 0.0520 support area. Buyers are testing resistance near 0.0625; a confirmed breakout could push price toward 0.0650 and 0.0680. A move below 0.0580 would weaken the bullish structure.
Buy and trade $LA
1
17
·
--
Bullish
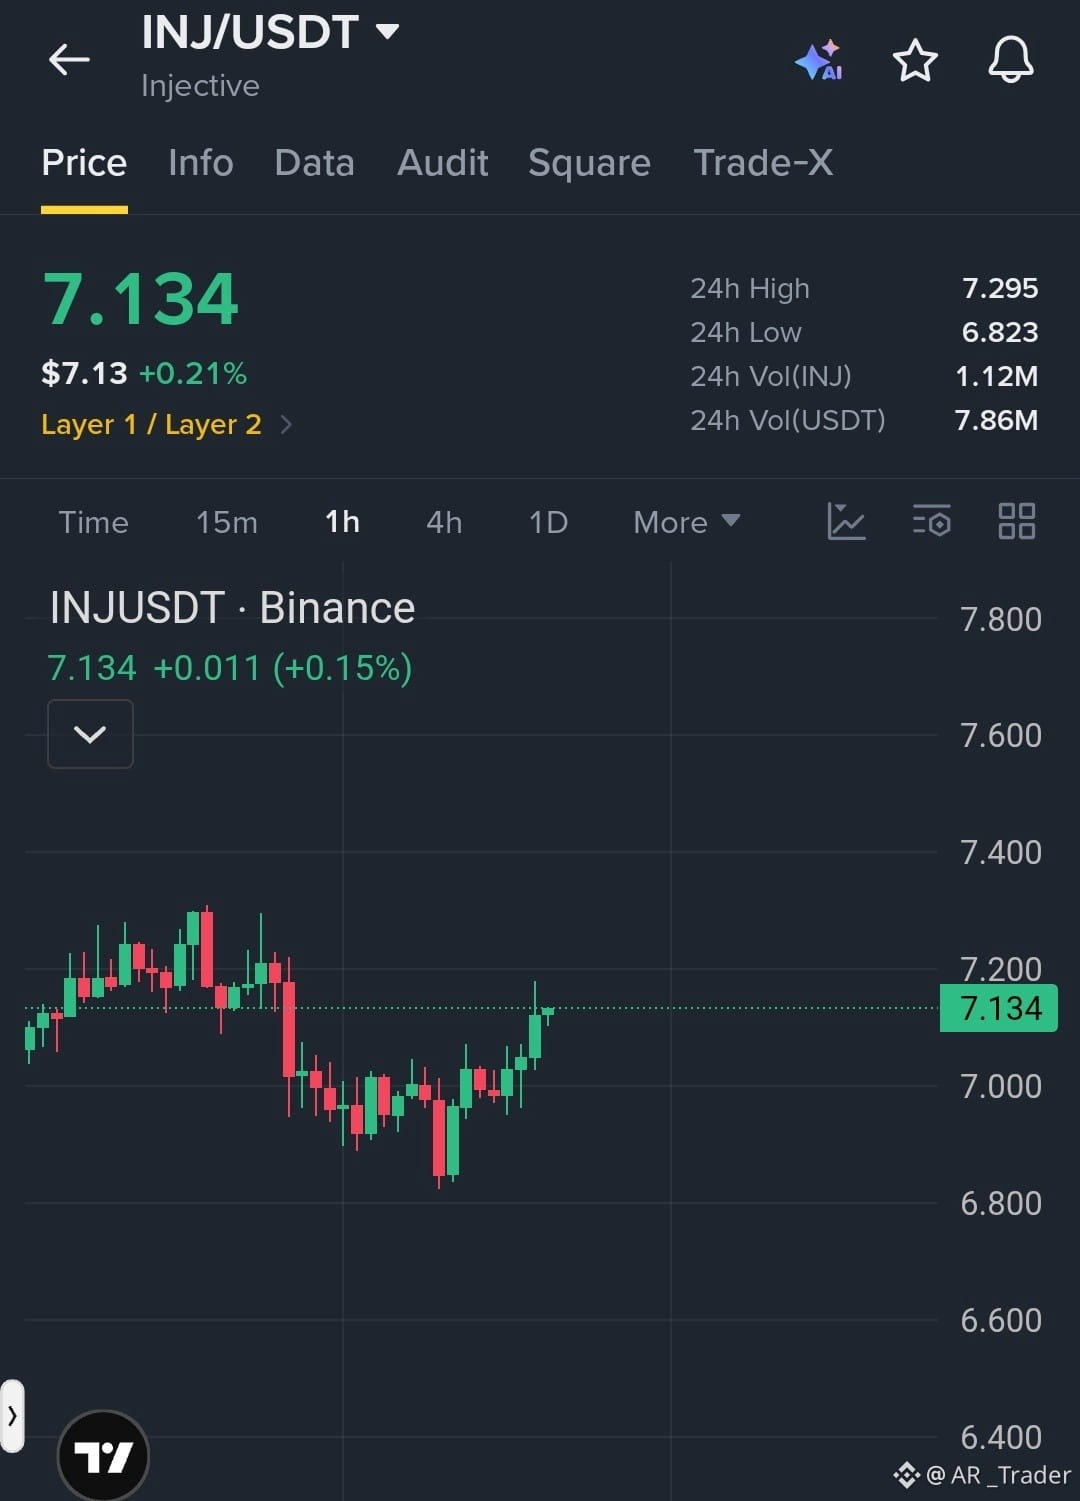
$INJ /USDT Shows Signs of a Bullish Recovery
Trade Setup: LONG
Entry Zone: 7.10–7.16
TP1: 7.25
TP2: 7.40
TP3: 7.60
SL: 6.92
Market Setup: Buyers are regaining control after a rebound from the 6.85–6.90 support area. Price is approaching resistance near 7.20; a confirmed breakout could extend the recovery toward 7.40 and 7.60. Watch for a sustained move above resistance before entry.
Buy and trade $INJ
{future}(INJUSDT)
$INJ /USDT Shows Signs of a Bullish Recovery
Trade Setup: LONG
Entry Zone: 7.10–7.16
TP1: 7.25
TP2: 7.40
TP3: 7.60
SL: 6.92
Market Setup: Buyers are regaining control after a rebound from the 6.85–6.90 support area. Price is approaching resistance near 7.20; a confirmed breakout could extend the recovery toward 7.40 and 7.60. Watch for a sustained move above resistance before entry.
Buy and trade $INJ
Trade Setup: LONG
Entry Zone: 7.10–7.16
TP1: 7.25
TP2: 7.40
TP3: 7.60
SL: 6.92
Market Setup: Buyers are regaining control after a rebound from the 6.85–6.90 support area. Price is approaching resistance near 7.20; a confirmed breakout could extend the recovery toward 7.40 and 7.60. Watch for a sustained move above resistance before entry.
Buy and trade $INJ
1
93
·
--
Bullish
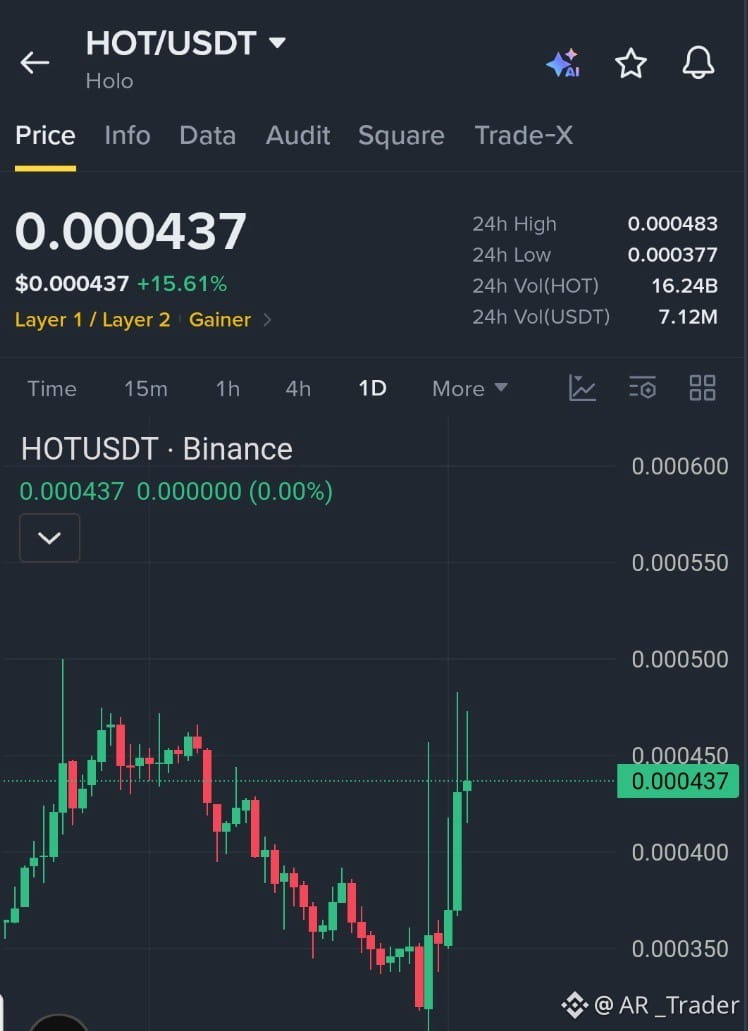
$HOT /USDT Signals Another Potential Bullish Move
Trade Setup: LONG
Entry Zone: 0.000430–0.000440
TP1: 0.000460
TP2: 0.000480
TP3: 0.000520
SL: 0.000405
Market Setup: Strong bullish recovery is visible after the recent downtrend, with buyers pushing price toward the 0.000450 resistance. A confirmed breakout above this level could trigger another upward move, while holding 0.000420 support is important for bullish continuation.
Buy and trade $HOT
{future}(HOTUSDT)
$HOT /USDT Signals Another Potential Bullish Move
Trade Setup: LONG
Entry Zone: 0.000430–0.000440
TP1: 0.000460
TP2: 0.000480
TP3: 0.000520
SL: 0.000405
Market Setup: Strong bullish recovery is visible after the recent downtrend, with buyers pushing price toward the 0.000450 resistance. A confirmed breakout above this level could trigger another upward move, while holding 0.000420 support is important for bullish continuation.
Buy and trade $HOT
Trade Setup: LONG
Entry Zone: 0.000430–0.000440
TP1: 0.000460
TP2: 0.000480
TP3: 0.000520
SL: 0.000405
Market Setup: Strong bullish recovery is visible after the recent downtrend, with buyers pushing price toward the 0.000450 resistance. A confirmed breakout above this level could trigger another upward move, while holding 0.000420 support is important for bullish continuation.
Buy and trade $HOT
1
50
·
--
Bullish
$NOM /USDT Attempts a Bullish Reversal as Buyers Defend Key Support
Trade Setup: LONG
Entry Zone: 0.001495–0.001510
TP1: 0.001550
TP2: 0.001600
TP3: 0.001650
SL: 0.001475á
Market Setup: After a steady decline, price is consolidating near the 0.001480 support zone, showing early signs of recovery. A breakout above 0.001520 could attract fresh buying pressure and push price toward higher resistance levels. Confirmation is key before entry.$NOM
{future}(NOMUSDT)
$NOM /USDT Attempts a Bullish Reversal as Buyers Defend Key Support
Trade Setup: LONG
Entry Zone: 0.001495–0.001510
TP1: 0.001550
TP2: 0.001600
TP3: 0.001650
SL: 0.001475á
Market Setup: After a steady decline, price is consolidating near the 0.001480 support zone, showing early signs of recovery. A breakout above 0.001520 could attract fresh buying pressure and push price toward higher resistance levels. Confirmation is key before entry.$NOM
Trade Setup: LONG
Entry Zone: 0.001495–0.001510
TP1: 0.001550
TP2: 0.001600
TP3: 0.001650
SL: 0.001475á
Market Setup: After a steady decline, price is consolidating near the 0.001480 support zone, showing early signs of recovery. A breakout above 0.001520 could attract fresh buying pressure and push price toward higher resistance levels. Confirmation is key before entry.$NOM
34
·
--
Bullish
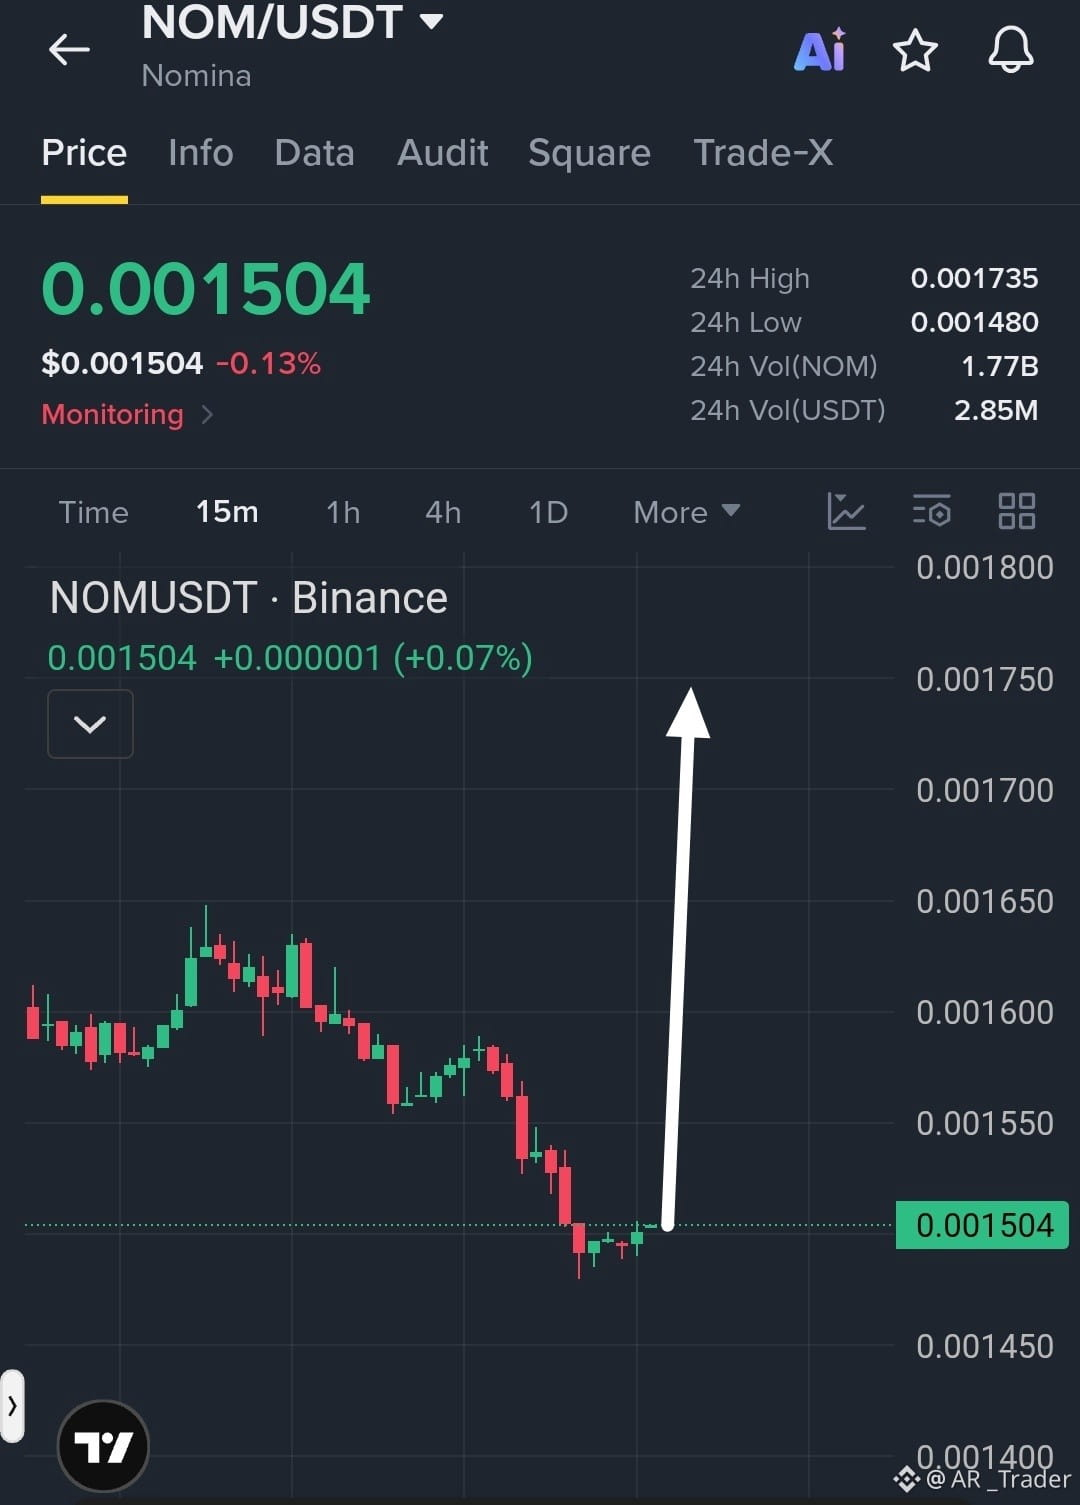
$NOM /USDT Attempts a Bullish Reversal as Buyers Defend Key Support
Trade Setup: LONG
Entry Zone: 0.001495–0.001510
TP1: 0.001550
TP2: 0.001600
TP3: 0.001650
SL: 0.001475
Market Setup: After a steady decline, price is consolidating near the 0.001480 support zone, showing early signs of recovery. A breakout above 0.001520 could attract fresh buying pressure and push price toward higher resistance levels. Confirmation is key before entry.$NOM
{future}(NOMUSDT)
$NOM /USDT Attempts a Bullish Reversal as Buyers Defend Key Support
Trade Setup: LONG
Entry Zone: 0.001495–0.001510
TP1: 0.001550
TP2: 0.001600
TP3: 0.001650
SL: 0.001475
Market Setup: After a steady decline, price is consolidating near the 0.001480 support zone, showing early signs of recovery. A breakout above 0.001520 could attract fresh buying pressure and push price toward higher resistance levels. Confirmation is key before entry.$NOM
Trade Setup: LONG
Entry Zone: 0.001495–0.001510
TP1: 0.001550
TP2: 0.001600
TP3: 0.001650
SL: 0.001475
Market Setup: After a steady decline, price is consolidating near the 0.001480 support zone, showing early signs of recovery. A breakout above 0.001520 could attract fresh buying pressure and push price toward higher resistance levels. Confirmation is key before entry.$NOM
1
37
Log in to explore more content
Join global crypto users on Binance Square
⚡️ Get latest and useful information about crypto.
💬 Trusted by the world’s largest crypto exchange.
👍 Discover real insights from verified creators.
Email / Phone number
Trending Topics
BinanceIncidentReport
2,962 views
177 Discussing
29 October 2026 Binance Security Incident: Initial Findings and Response Update
Binance Blog
·119 Likes
·317.9k views
BinanceReopensWithdrawalsForMoreAssets
91,079 views
1,497 Discussing
BinanceHourlyDepositsExceedWithdrawals
42,724 views
638 Discussing