

King of blockchain baller
974 Posts

King of blockchain baller
Report
Block User
||News Twitter X|| Fundamental and technical analysis|| crypto patterns
Open Trade
High-Frequency Trader
1.7 Years
56 Following
278 Followers
448 Liked
Posts
Portfolio
All
Quotes
·
--
Bullish
$SOL Guys welcome back Moving towards the new High buy now Top Altcoin and gain massive profit 💯 percent Bullish confirm
#PowellRemarks #MarketPullback #BinanceHODLerENSO
$SOL Guys welcome back Moving towards the new High buy now Top Altcoin and gain massive profit 💯 percent Bullish confirm
#PowellRemarks #MarketPullback #BinanceHODLerENSO
#PowellRemarks #MarketPullback #BinanceHODLerENSO
161
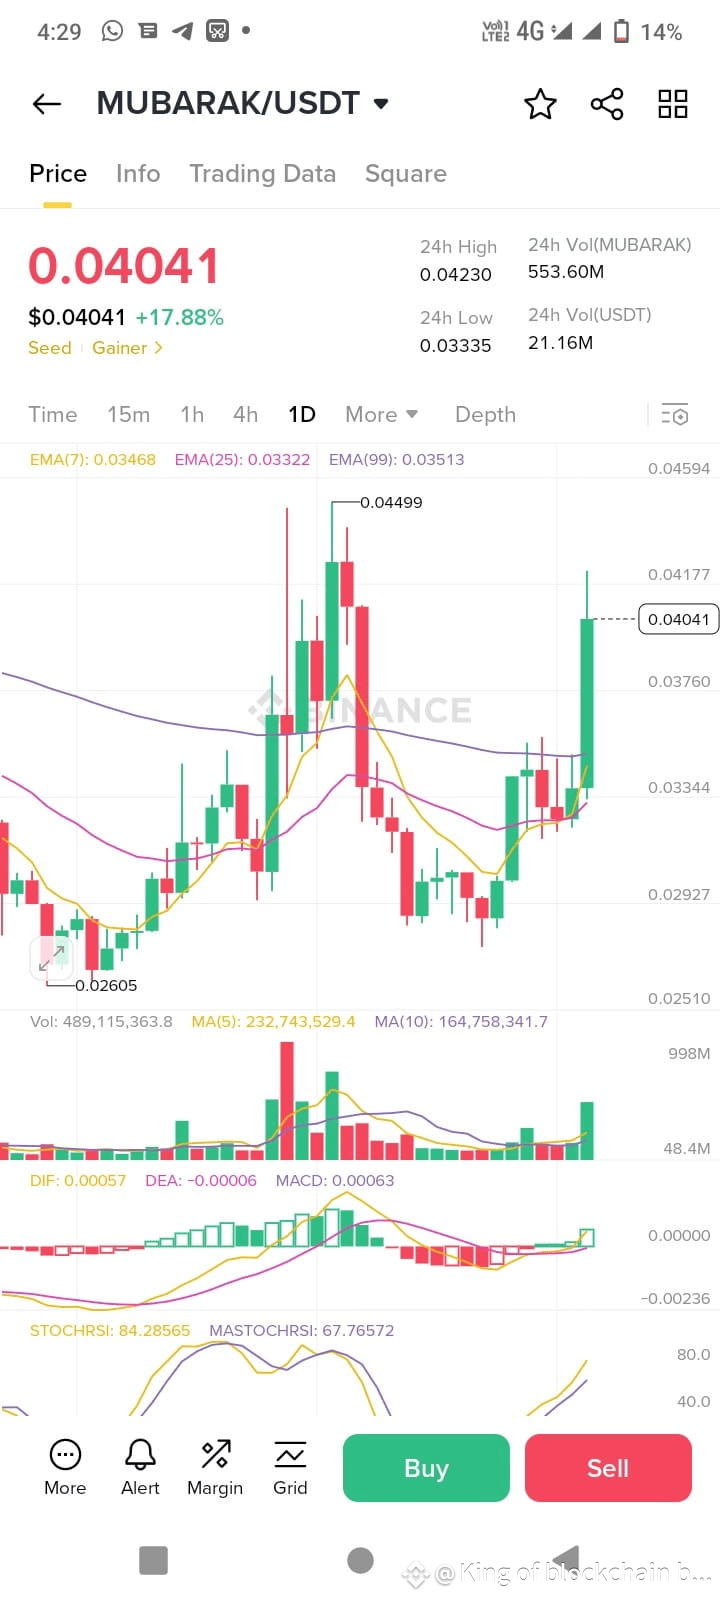
$MUBARAK 📊 Current Data
Price: $0.04041 (+17.88%)
24h High / Low: $0.04230 / $0.03335
EMA(7): 0.03468
EMA(25): 0.03322
EMA(99): 0.03513
MACD: 0.00063 (DIF > DEA → Bullish crossover)
Stoch RSI: 84.28 (overbought
🟩 Entry Zone
Wait for a small retracement near:
Entry Range: $0.0370 – $0.0385
(If it retests EMA(7) or previous breakout area.)
---
🎯 Take Profit Targets
Target Price Level Notes
TP1 $0.0423 Previous 24h high / minor resistance
TP2 $0.0449 Last swing high
TP3 $0.0465 – $0.0480 Major resistance zone (potential breakout zone)
---
🛑 Stop-Loss
SL: $0.0333 (below EMA25 and last swing low)**
---
⚖️ Trade Plan Summary
Entry: $0.0370 – $0.0385
TP1: $0.0423
TP2: $0.0449
TP3: $0.0465+
SL: $0.0333
Risk/Reward: ≈ 1:2.5
Follow me for more accurate signal
#KlinkBinanceTGE #BNBMarketCapThirdLargest #WhaleWatch
198
·
--
Bullish
$TST Buy now for long trade signal massive move strong upward Momentum
Next Target 0.04+
$TST Buy now for long trade signal massive move strong upward Momentum
Next Target 0.04+
Next Target 0.04+
175
·
--
Bullish
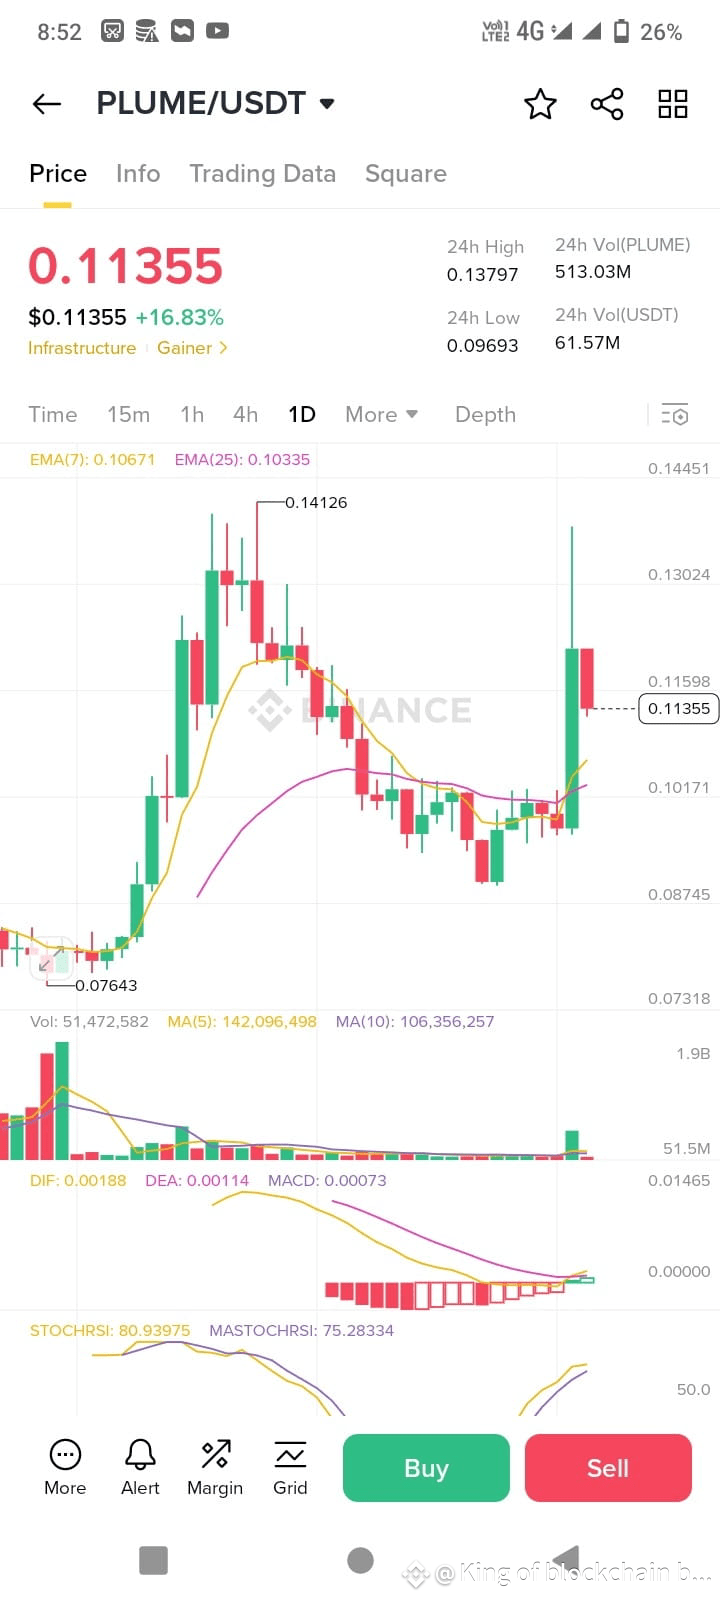
$PLUME
🔹 Current Overview
Price: $0.11355
24h Change: +16.83% 🔥
24h High: $0.13797
24h Low: $0.09693
24h Volume: 513.03M PLUME / 61.57M USDT
🧭 Trade Plan
🎯 Entry Zone
Ideal re-entry: $0.101 – $0.107 (near EMA7/EMA25 support)
Safer re-entry: Wait for confirmation bounce above $0.115
💰 Take Profit (TP) Targets
1. TP1: $0.125 (short-term resistance)
2. TP2: $0.137 – recent high
3. TP3: $0.145 – next major resistance
🛡 Stop Loss
Place SL below support: $0.095
Follow me for more accurate signal
#KlinkBinanceTGE #BNBBreaksATH #WhaleWatch
94
·
--
Bullish
$LISTA Let’s break down the trade setup so you can enter safely and not chase the top 👇
---
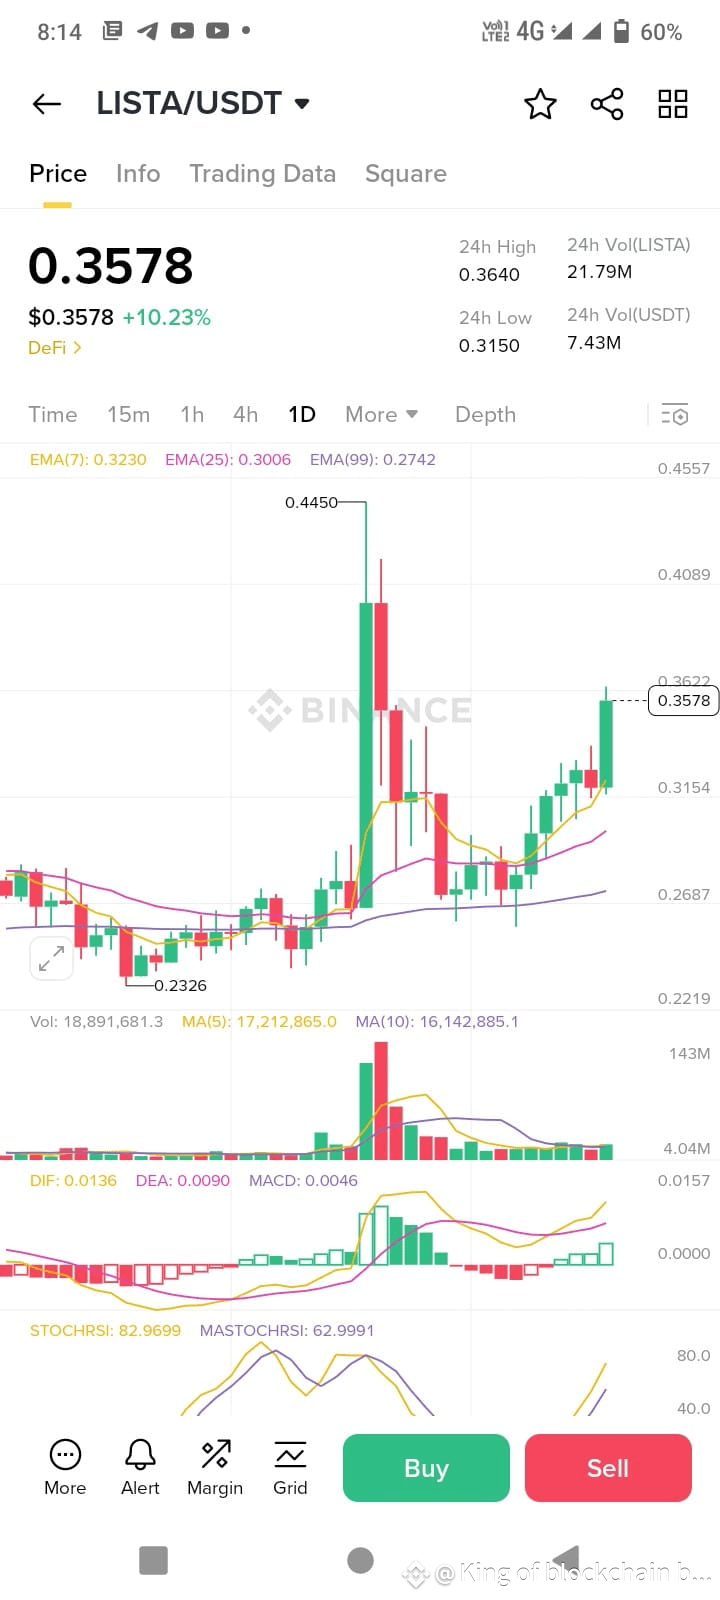
📊 LISTA/USDT Technical Overview
Current Price: $0.3578
Trend: Bullish — strong impulse above previous resistance.
STOCHRSI: 82.9 → overbought, so short-term pullback likely before next leg up.
Volume: Strong (7.43M USDT) — confirms active buyers.
Structure: Breakout and consolidation phase → ideal for buy-on-dip strategy.
---
💸 Trade Plan
🟢 Buy Zone (Entry Area):
$0.342 – $0.350 → best dip-buy zone near support and before next impulse.
If market is stronger, you can scale in from $0.350–$0.357 for partial entry.
🎯 Take Profit (TP) Targets:
TP1: $0.365 — retest of 24h high
TP2: $0.385 — next resistance
TP3: $0.410 — bullish extension if momentum continues
🛑 Stop Loss:
$0.328 → below last consolidation low, to protect from reversal
---
✅ Summary:
Buy: $0.342 – $0.350
TPs: $0.365 / $0.385 / $0.410
Stop-Loss: $0.328
Follow me
#KlinkBinanceTGE #BNBBreaksATH #WhaleWatch
---
📊 LISTA/USDT Technical Overview
Current Price: $0.3578
Trend: Bullish — strong impulse above previous resistance.
STOCHRSI: 82.9 → overbought, so short-term pullback likely before next leg up.
Volume: Strong (7.43M USDT) — confirms active buyers.
Structure: Breakout and consolidation phase → ideal for buy-on-dip strategy.
---
💸 Trade Plan
🟢 Buy Zone (Entry Area):
$0.342 – $0.350 → best dip-buy zone near support and before next impulse.
If market is stronger, you can scale in from $0.350–$0.357 for partial entry.
🎯 Take Profit (TP) Targets:
TP1: $0.365 — retest of 24h high
TP2: $0.385 — next resistance
TP3: $0.410 — bullish extension if momentum continues
🛑 Stop Loss:
$0.328 → below last consolidation low, to protect from reversal
---
✅ Summary:
Buy: $0.342 – $0.350
TPs: $0.365 / $0.385 / $0.410
Stop-Loss: $0.328
Follow me
#KlinkBinanceTGE #BNBBreaksATH #WhaleWatch
1
180
·
--
Bullish
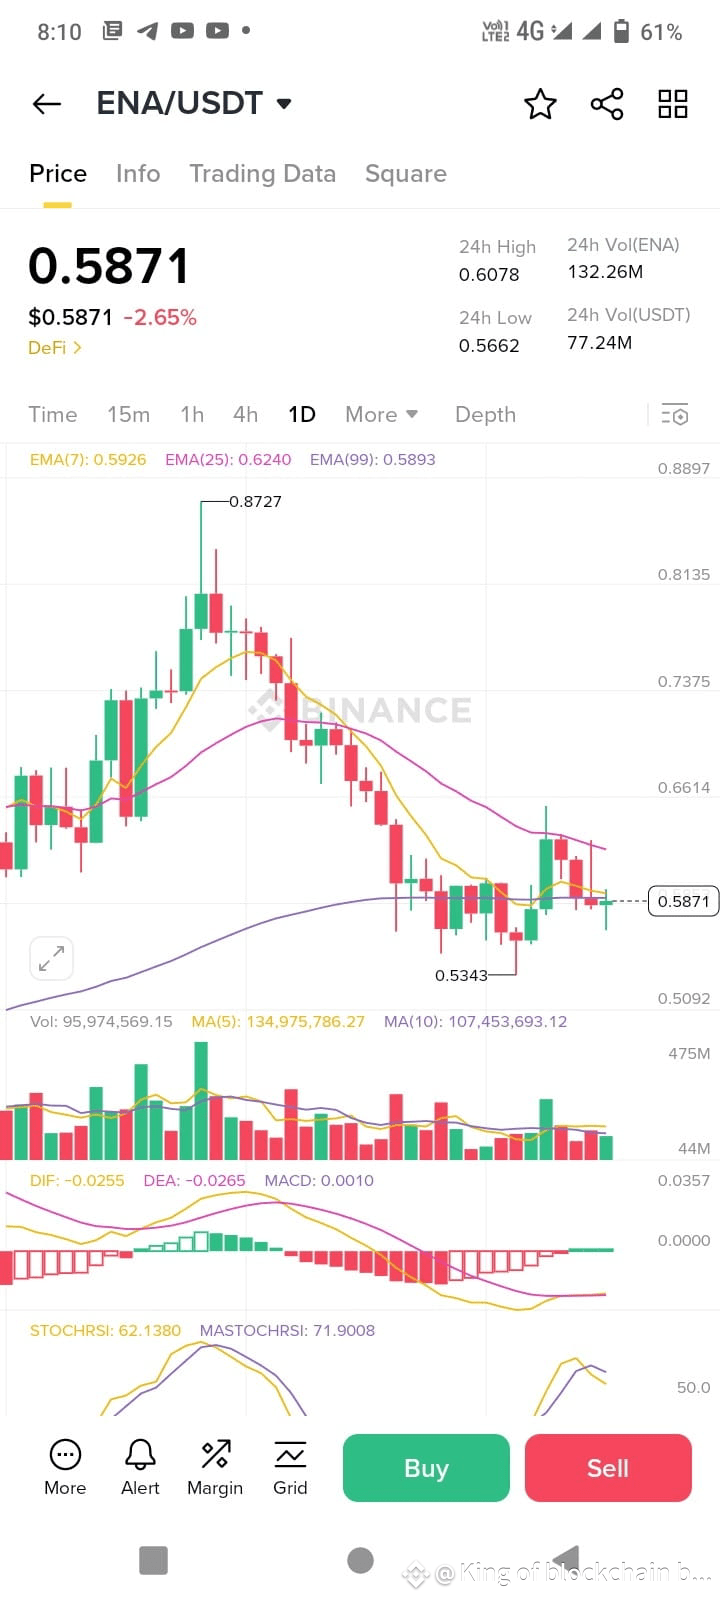
$ENA ⚖️ Market Sentiment
Right now, ENA is trying to find support, but it’s not showing strong reversal confirmation yet.
The best play is wait for a bullish breakout above the EMA levels before entering long.
---
💰 Trade Plan (for swing traders)
🟢 Buy Zone (if it stabilizes):
$0.570 – $0.585 → safe entry area if price holds above $0.566 and starts showing green candles.
🎯 Take Profit (TP) Targets:
TP1: $0.605 (short-term rebound)
TP2: $0.635 (EMA resistance zone)
TP3: $0.670 (trend reversal confirmation zone)
🛑 Stop Loss:
$0.555 → below recent low for protection.
---
⚠️ If Downtrend Continues:
If ENA breaks below $0.566, expect further drop toward $0.540 – $0.520 before next support.
That’s a no-trade zone unless you’re shorting.
---
✅ Summary:
Buy Zone: $0.570 – $0.585
TPs: $0.605 / $0.635 / $0.670
Stop Loss: $0.555
Follow me
#KlinkBinanceTGE #BNBBreaksATH #WhaleWatch #WhaleWatch
183
·
--
Bullish
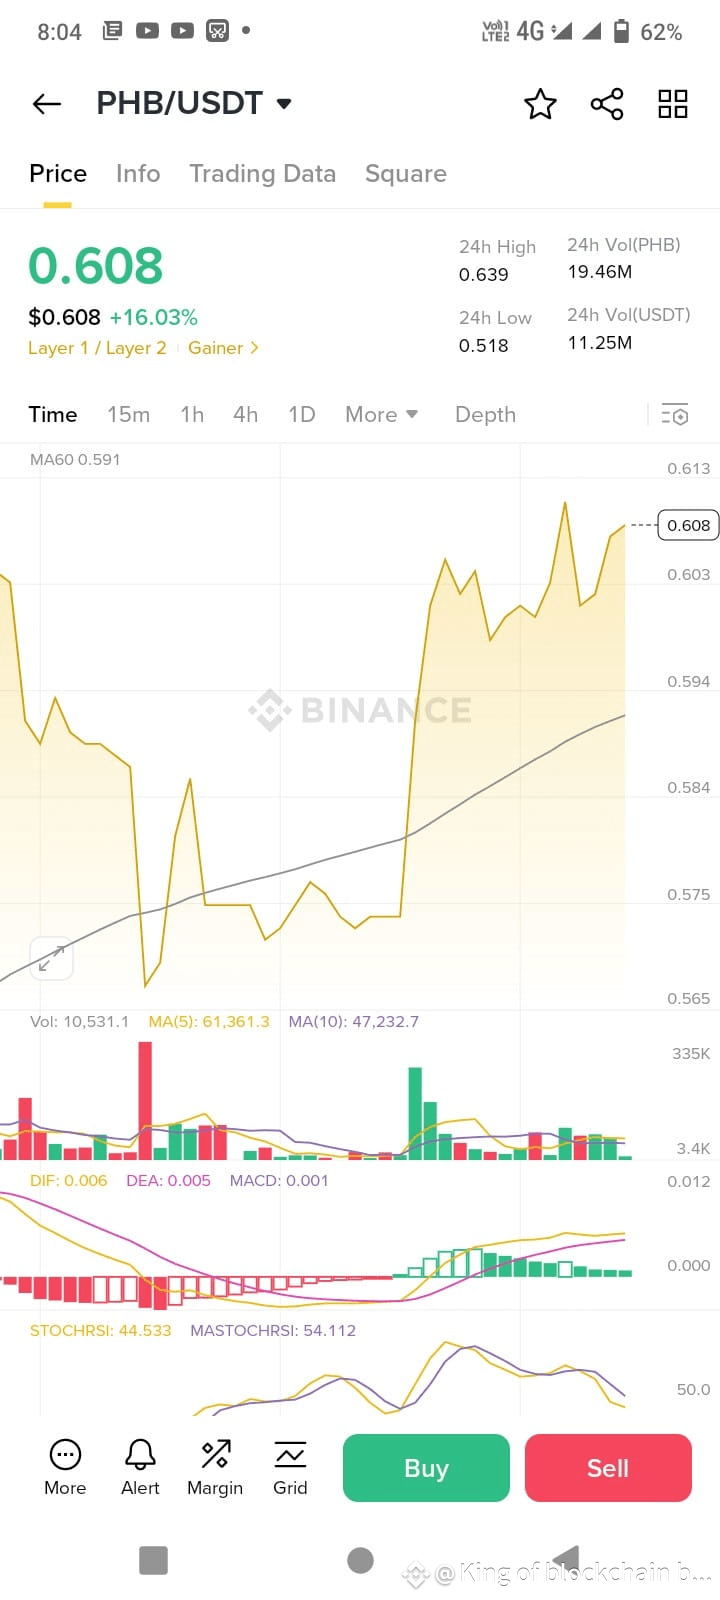
$PHB Here’s the clean PHB/USDT trade setup for today 🔥
💸 Buy Zone (Entry Area)
Buy between: $0.600 – $0.615
↳ This is the pullback zone near short-term support and just above the MA60 ($0.591).
🎯 Take Profit (TP) Targets
TP1: $0.640 — test of recent high
TP2: $0.670 — next resistance level
TP3: $0.720 — bullish extension target if breakout continues
🛑 Stop-Loss
$0.575 — below MA60 and last swing low to protect capital
---
✅ Summary:
Entry: $0.600–$0.615
Take Profit: $0.640 / $0.670 / $0.720
Stop Loss: $0.575
Would you like me to mark these zones visually on a chart for clarity (buy/TP/SL levels)?
Follow me
#KlinkBinanceTGE #BNBBreaksATH
119
·
--
Bullish
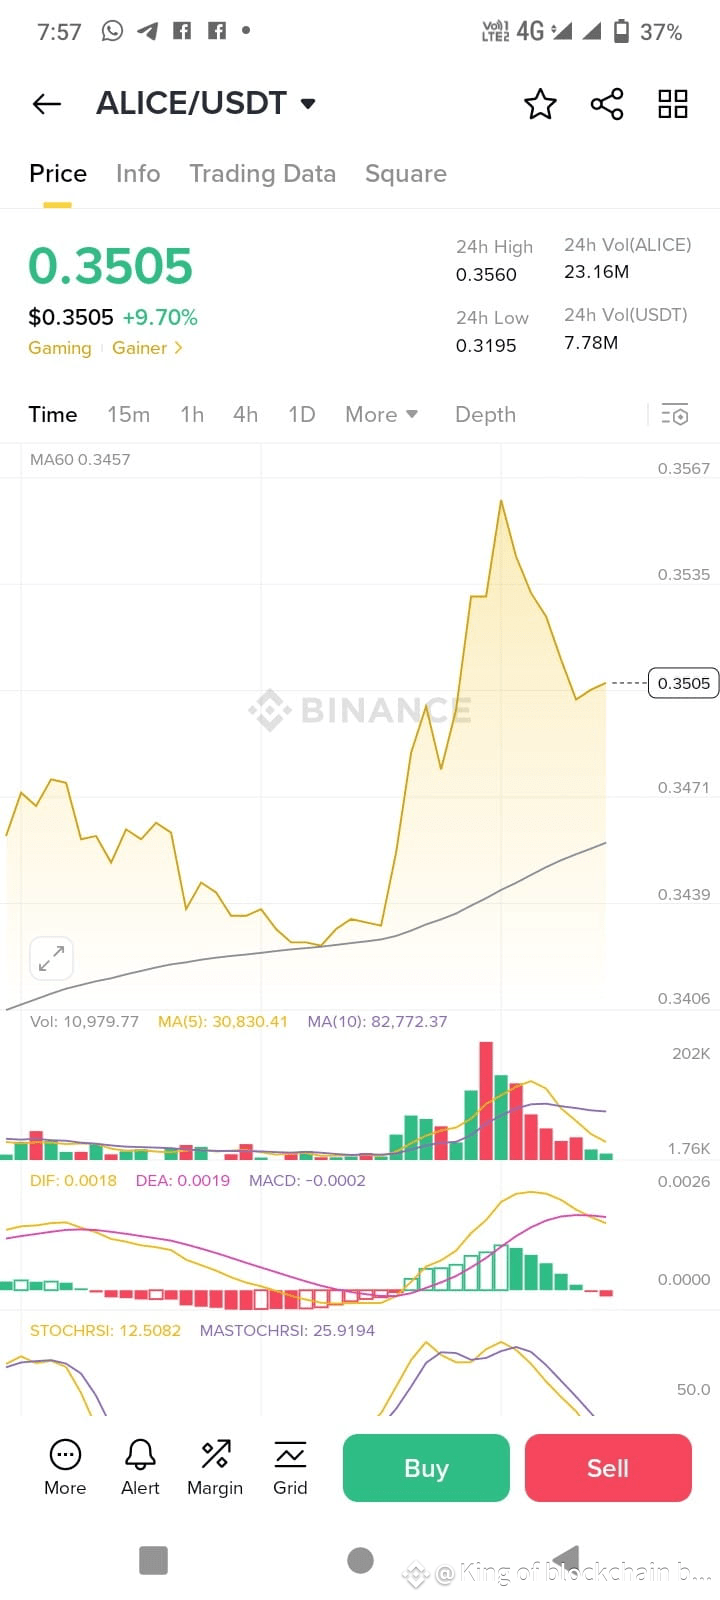
$ALICE Let's break down the ALICE/USDT chart setup 👇
---
📊 Market Overview
Price: $0.3505 (+9.70%)
24h High: $0.3560
24h Low: $0.3195
MA60: 0.3457 → ✅ Price is above MA60, confirming short-term bullish trend.
Volume: Increasing — showing buying interest in the recent move up.
---
🔍 Indicator Analysis
1. MACD
DIF: 0.0018
DEA: 0.0019
MACD: -0.0002
➡️ The MACD lines are very close, showing that bearish momentum is almost gone.
If DIF crosses above DEA, we’ll see a bullish crossover, confirming a new uptrend continuation.
---
3. Volume & Price Action
Recent volume spike during the push from $0.319 → $0.356 confirms strong buying.
Current pullback seems healthy consolidation, not a reversal (as price is above MA60).
---
🎯 Take-Profit Targets
1. TP1: $0.3560 (recent high — quick scalp)
2. TP2: $0.3640 (next resistance zone)
3. TP3: $0.3720 (strong resistance if momentum builds)
🛑 Stop-Loss
Below $0.3390 (below recent structure and MA60)
Follow me
#BTCBreaksATH #GoldHitsRecordHigh #BNBBreaksATH
$SOL
{spot}(SOLUSDT)
$ALICE Let's break down the ALICE/USDT chart setup 👇
---
📊 Market Overview
Price: $0.3505 (+9.70%)
24h High: $0.3560
24h Low: $0.3195
MA60: 0.3457 → ✅ Price is above MA60, confirming short-term bullish trend.
Volume: Increasing — showing buying interest in the recent move up.
---
🔍 Indicator Analysis
1. MACD
DIF: 0.0018
DEA: 0.0019
MACD: -0.0002
➡️ The MACD lines are very close, showing that bearish momentum is almost gone.
If DIF crosses above DEA, we’ll see a bullish crossover, confirming a new uptrend continuation.
---
3. Volume & Price Action
Recent volume spike during the push from $0.319 → $0.356 confirms strong buying.
Current pullback seems healthy consolidation, not a reversal (as price is above MA60).
---
🎯 Take-Profit Targets
1. TP1: $0.3560 (recent high — quick scalp)
2. TP2: $0.3640 (next resistance zone)
3. TP3: $0.3720 (strong resistance if momentum builds)
🛑 Stop-Loss
Below $0.3390 (below recent structure and MA60)
Follow me
#BTCBreaksATH #GoldHitsRecordHigh #BNBBreaksATH
$SOL
---
📊 Market Overview
Price: $0.3505 (+9.70%)
24h High: $0.3560
24h Low: $0.3195
MA60: 0.3457 → ✅ Price is above MA60, confirming short-term bullish trend.
Volume: Increasing — showing buying interest in the recent move up.
---
🔍 Indicator Analysis
1. MACD
DIF: 0.0018
DEA: 0.0019
MACD: -0.0002
➡️ The MACD lines are very close, showing that bearish momentum is almost gone.
If DIF crosses above DEA, we’ll see a bullish crossover, confirming a new uptrend continuation.
---
3. Volume & Price Action
Recent volume spike during the push from $0.319 → $0.356 confirms strong buying.
Current pullback seems healthy consolidation, not a reversal (as price is above MA60).
---
🎯 Take-Profit Targets
1. TP1: $0.3560 (recent high — quick scalp)
2. TP2: $0.3640 (next resistance zone)
3. TP3: $0.3720 (strong resistance if momentum builds)
🛑 Stop-Loss
Below $0.3390 (below recent structure and MA60)
Follow me
#BTCBreaksATH #GoldHitsRecordHigh #BNBBreaksATH
$SOL
235
·
--
Bullish
$XRP
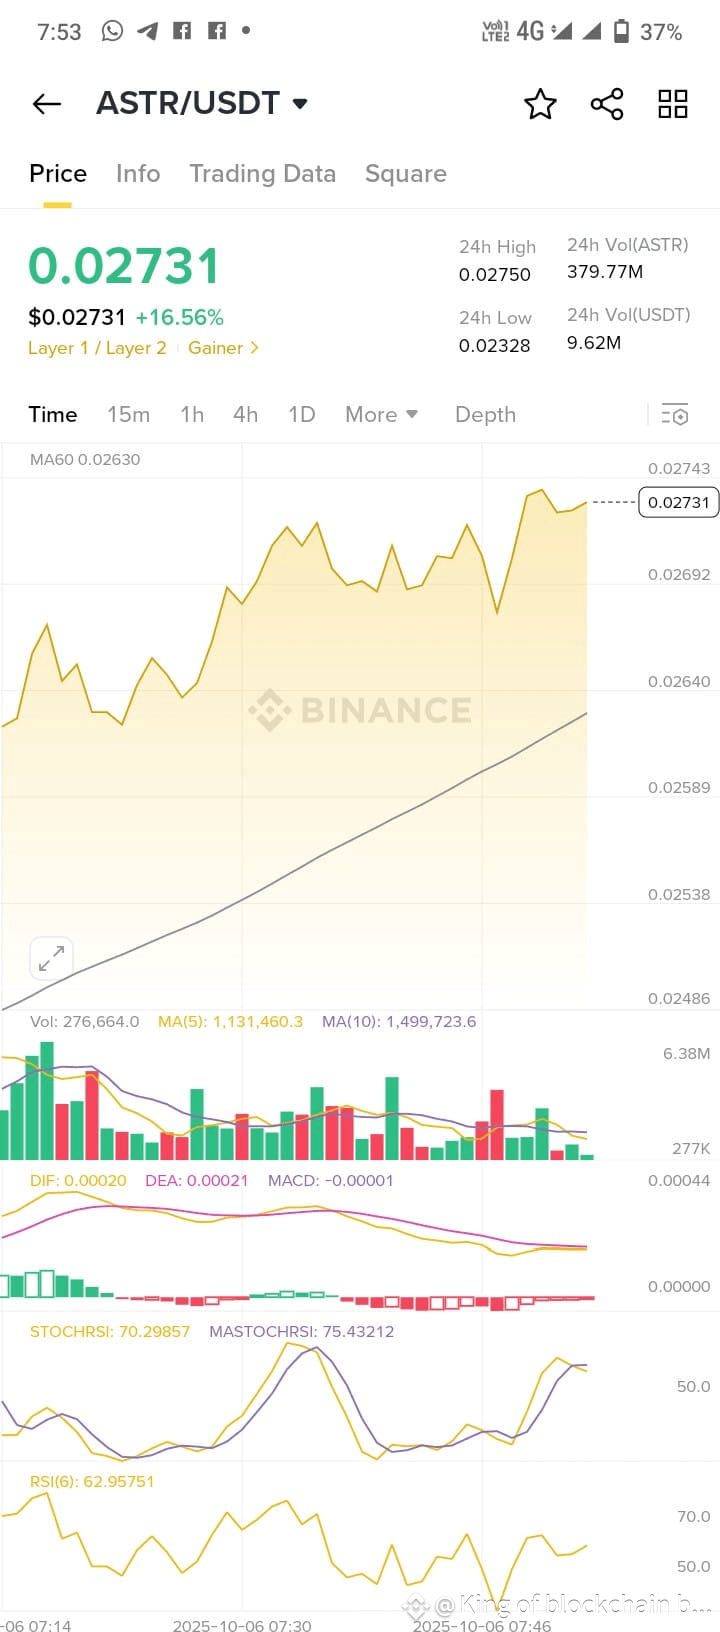
$ASTR Let's analyze the ASTR/USDT chart you provided 👇
📊 Current Overview
Price: $0.02731 (+16.56%)
24h High: $0.02750
24h Low: $0.02328
MA60: 0.02630 → ✅ Price is above MA60 (bullish confirmation)
Volume: Increasing, showing strong market participation.
---
🔍 Indicator Breakdown
1. MACD
DIF: 0.00020
DEA: 0.00021
MACD: -0.00001
➡️ Slightly negative but flattening — suggests the bearish pressure is fading and a potential bullish crossover may form soon.
2. RSI (6): 62.95
➡️ RSI is near 63 — bullish but not overbought. Indicates continued buying strength, still room to rise before entering overbought (>70).
3. Stoch RSI
STOCHRSI: 70.30
MASTOCHRSI: 75.43
➡️ In the upper neutral zone, showing moderate bullish momentum. Could push higher if volume remains strong.
---
📈 Trend & Momentum
Price above MA60 = clear uptrend.
RSI and Stoch RSI both rising = momentum confirmation.
Volume supports the move (no sign of exhaustion yet).
---
🎯 Trade Plan
✅ Entry Zone (Buy Range):
$0.02650 – $0.02700
Wait for a small pullback near the support or MA60 area before entering.
🎯 Take-Profit Targets:
1. TP1: $0.02800 (short-term resistance)
2. TP2: $0.02920 (recent swing high)
3. TP3: $0.03000 (psychological level)
🛑 Stop-Loss:
Below $0.02580 (just under MA60)
---
⚠️ Tips
If MACD crosses bullish (DIF > DEA), it can confirm a strong next leg upward.
If RSI >70, start locking partial profits — it will enter overbought territory.
Watch BTC trend; if BTC stays stable or rises, ASTR could continue its uptrend.
Follow me for more accurate signal
#BTCBreaksATH #GoldHitsRecordHigh #MarketUptober
$XRP
{spot}(XRPUSDT)
$XRP
$ASTR Let's analyze the ASTR/USDT chart you provided 👇
📊 Current Overview
Price: $0.02731 (+16.56%)
24h High: $0.02750
24h Low: $0.02328
MA60: 0.02630 → ✅ Price is above MA60 (bullish confirmation)
Volume: Increasing, showing strong market participation.
---
🔍 Indicator Breakdown
1. MACD
DIF: 0.00020
DEA: 0.00021
MACD: -0.00001
➡️ Slightly negative but flattening — suggests the bearish pressure is fading and a potential bullish crossover may form soon.
2. RSI (6): 62.95
➡️ RSI is near 63 — bullish but not overbought. Indicates continued buying strength, still room to rise before entering overbought (>70).
3. Stoch RSI
STOCHRSI: 70.30
MASTOCHRSI: 75.43
➡️ In the upper neutral zone, showing moderate bullish momentum. Could push higher if volume remains strong.
---
📈 Trend & Momentum
Price above MA60 = clear uptrend.
RSI and Stoch RSI both rising = momentum confirmation.
Volume supports the move (no sign of exhaustion yet).
---
🎯 Trade Plan
✅ Entry Zone (Buy Range):
$0.02650 – $0.02700
Wait for a small pullback near the support or MA60 area before entering.
🎯 Take-Profit Targets:
1. TP1: $0.02800 (short-term resistance)
2. TP2: $0.02920 (recent swing high)
3. TP3: $0.03000 (psychological level)
🛑 Stop-Loss:
Below $0.02580 (just under MA60)
---
⚠️ Tips
If MACD crosses bullish (DIF > DEA), it can confirm a strong next leg upward.
If RSI >70, start locking partial profits — it will enter overbought territory.
Watch BTC trend; if BTC stays stable or rises, ASTR could continue its uptrend.
Follow me for more accurate signal
#BTCBreaksATH #GoldHitsRecordHigh #MarketUptober
$XRP
1
345
·
--
Bullish
$XRP
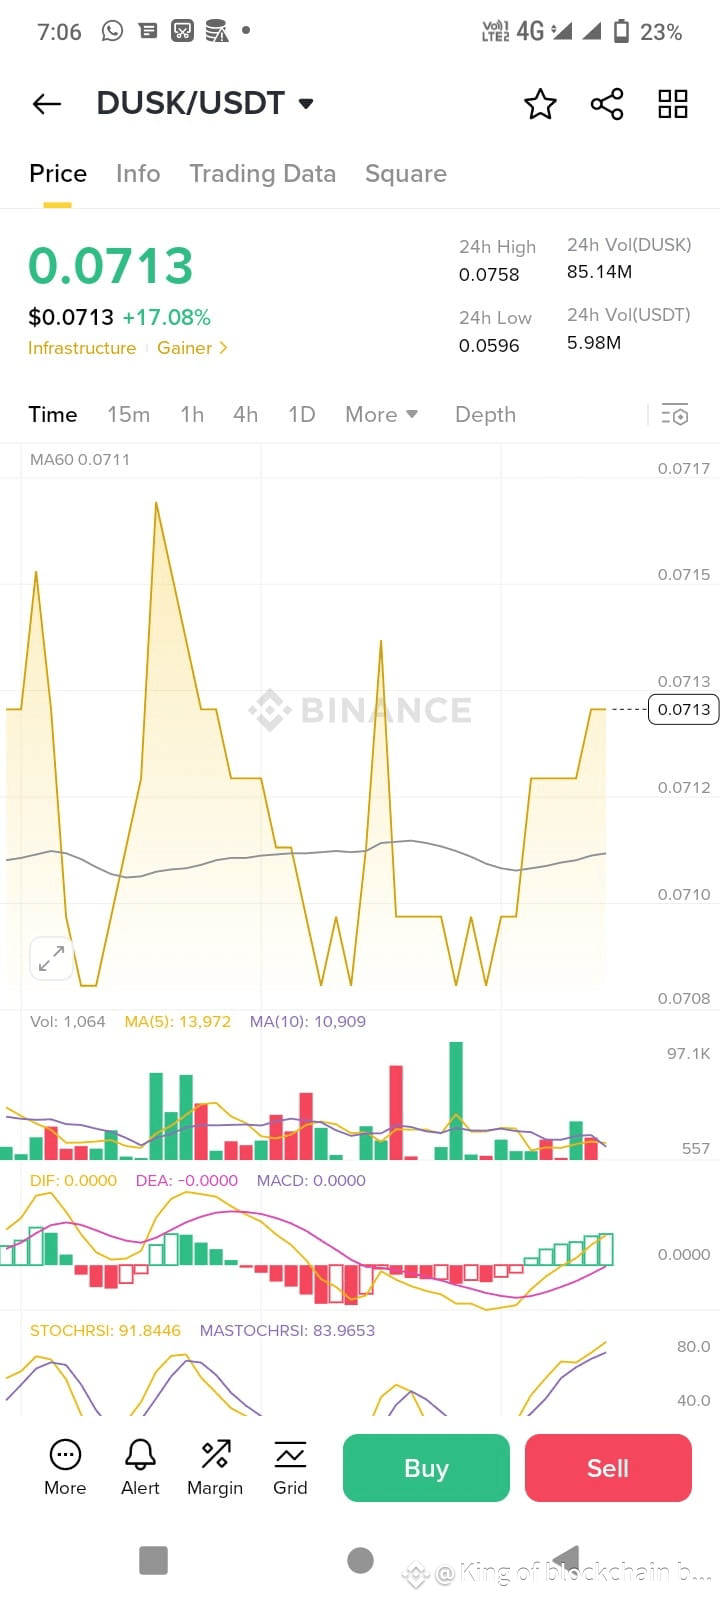
$DUSK Let's analyze the DUSK/USDT chart you shared 👇
---
📊 Market Overview
Current Price: $0.0713
24h Change: +17.08% 🔥 (strong bullish momentum)
24h High / Low: 0.0758 / 0.0596
24h Volume: 85.14M DUSK (good liquidity, strong interest)
---
🧭 Technical Indicators
1. Moving Averages (MA)
MA60: 0.0711 — current price slightly above MA60, indicating short-term bullish momentum.
MA(5) & MA(10): Short-term MAs are trending upward → confirmation of near-term buying strength.
2. MACD
MACD: 0.0000
DIF & DEA: very close, starting to flatten near the zero line, suggesting a potential bullish crossover forming soon — a good early buy signal.
3. Stochastic RSI
STOCHRSI: 91.84
MASTOCHRSI: 83.96
→ Both are in overbought territory (>80), meaning a short-term pullback or consolidation is possible before another leg up.
---
💡 Trade Setup Plan
Action Zone Comment
Entry (Buy) $0.0690 – $0.0710 Small dip expected; good accumulation zone
Target 1 (TP1) $0.0758 Test of recent high
Target 2 (TP2) $0.0795 – $0.0800 Next resistance zone
Stop Loss (SL) $0.0660 Below recent support & MA lines
---
🧠 Summary
Trend: Bullish
Momentum: Strong but slightly overheated (RSI > 90)
Short-Term Plan: Wait for minor retracement to $0.069–0.071 range, then buy.
Risk Management: Use tight stop below $0.066 to protect capital.
Follow me
#BTCBreaksATH #BNBBreaksATH #BinanceHODLer2Z #MarketUptober
$XRP
{spot}(XRPUSDT)
$XRP
$DUSK Let's analyze the DUSK/USDT chart you shared 👇
---
📊 Market Overview
Current Price: $0.0713
24h Change: +17.08% 🔥 (strong bullish momentum)
24h High / Low: 0.0758 / 0.0596
24h Volume: 85.14M DUSK (good liquidity, strong interest)
---
🧭 Technical Indicators
1. Moving Averages (MA)
MA60: 0.0711 — current price slightly above MA60, indicating short-term bullish momentum.
MA(5) & MA(10): Short-term MAs are trending upward → confirmation of near-term buying strength.
2. MACD
MACD: 0.0000
DIF & DEA: very close, starting to flatten near the zero line, suggesting a potential bullish crossover forming soon — a good early buy signal.
3. Stochastic RSI
STOCHRSI: 91.84
MASTOCHRSI: 83.96
→ Both are in overbought territory (>80), meaning a short-term pullback or consolidation is possible before another leg up.
---
💡 Trade Setup Plan
Action Zone Comment
Entry (Buy) $0.0690 – $0.0710 Small dip expected; good accumulation zone
Target 1 (TP1) $0.0758 Test of recent high
Target 2 (TP2) $0.0795 – $0.0800 Next resistance zone
Stop Loss (SL) $0.0660 Below recent support & MA lines
---
🧠 Summary
Trend: Bullish
Momentum: Strong but slightly overheated (RSI > 90)
Short-Term Plan: Wait for minor retracement to $0.069–0.071 range, then buy.
Risk Management: Use tight stop below $0.066 to protect capital.
Follow me
#BTCBreaksATH #BNBBreaksATH #BinanceHODLer2Z #MarketUptober
$XRP
102
·
--
Bullish
$REZ buy now this token huge pump incoming
Strong upward Momentum chart's shows signs of Bullish confirmed
$REZ pumping hard today
Follow me
#BTCBreaksATH #BNBBreaksATH
$REZ buy now this token huge pump incoming
Strong upward Momentum chart's shows signs of Bullish confirmed
$REZ pumping hard today
Follow me
#BTCBreaksATH #BNBBreaksATH
Strong upward Momentum chart's shows signs of Bullish confirmed
$REZ pumping hard today
Follow me
#BTCBreaksATH #BNBBreaksATH
76
·
--
Bullish
$TUT Booom big congratulations to everyone who's pick my call You can check ✔️My night post
Hit my target 🎯 successfully
Follow me
#BTCBreaksATH #BNBBreaksATH #BinanceHODLer2Z
$TUT Booom big congratulations to everyone who's pick my call You can check ✔️My night post
Hit my target 🎯 successfully
Follow me
#BTCBreaksATH #BNBBreaksATH #BinanceHODLer2Z
Hit my target 🎯 successfully
Follow me
#BTCBreaksATH #BNBBreaksATH #BinanceHODLer2Z
130
·
--
Bullish
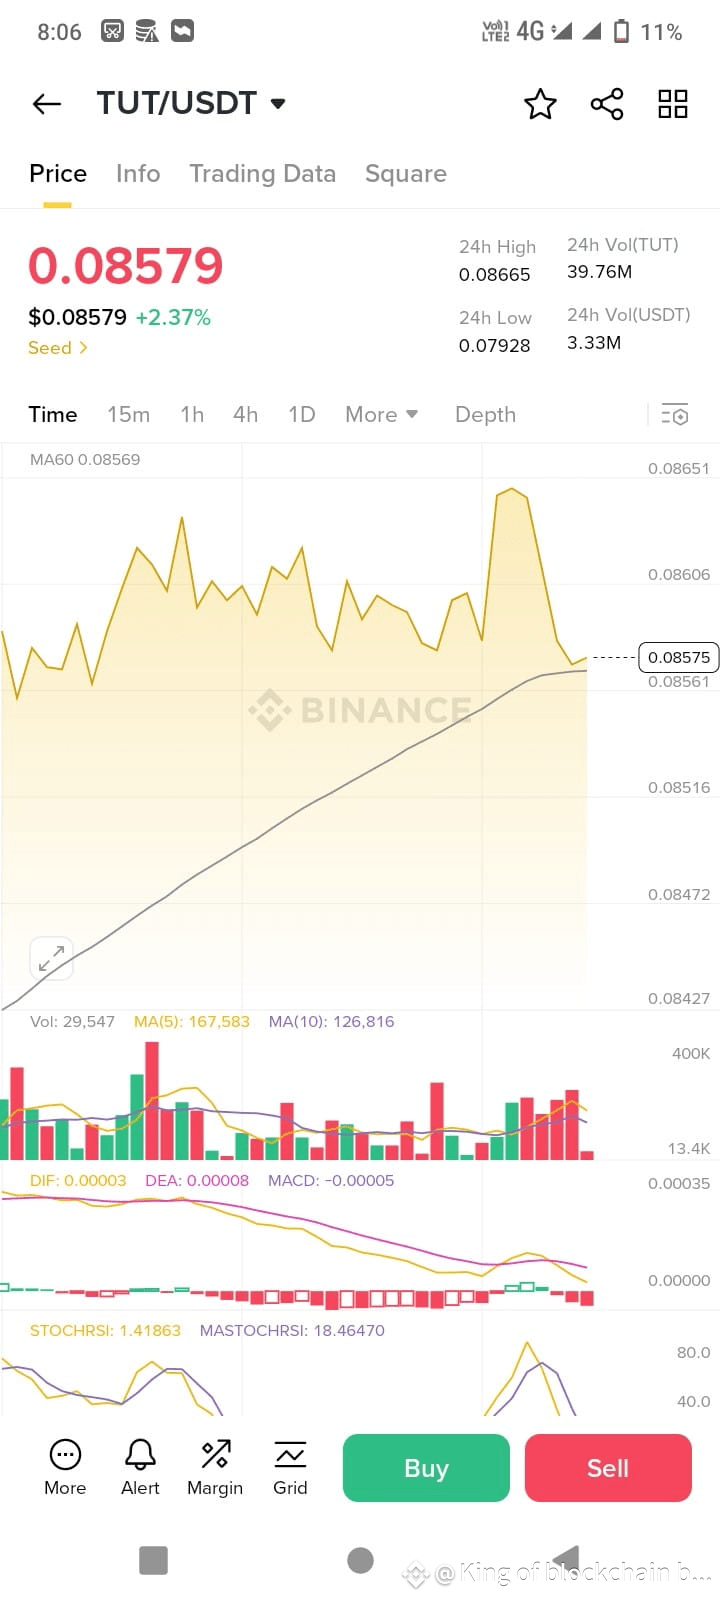
$TUT Let’s analyze your TUT/USDT chart step by step 👇
---
📊 Current Market Overview
Price: $0.08579 (+2.37%)
24h High: $0.08665
24h Low: $0.07928
MA60: 0.08569 — Price is just above MA60, indicating short-term support.
24h Volume (TUT): 39.76M — decent activity.
---
🔍 Indicator Breakdown
1️⃣ MACD (Momentum)
DIF: 0.00003
DEA: 0.00008
MACD: -0.00005
👉 The MACD line (DIF) is slightly below the signal (DEA), showing weak bearish momentum, but very close to a possible bullish crossover.
➡️ Suggests consolidation or early reversal signs.
---
2️⃣ Stoch RSI (Overbought/Oversold)
STOCHRSI: 1.41863
MASTOCHRSI: 18.46470
👉 These values are very low (<20) → indicates oversold conditions.
➡️ This means buyers may soon step in, and a bounce up could occur soon.
---
3️⃣ Moving Averages
MA(5): 0.0856
MA(10): 0.0857
MA(60): 0.08569
👉 The short-term and mid-term averages are close to each other, suggesting the price is at a decision point.
If it breaks above 0.0865, a bullish move can start.
If it drops below 0.0845, a short-term correction may continue.
---
💰 Trade Plan (Scalp or Short-Term Swing)
🟩 Entry Zone (Buy):
Between $0.0850 – $0.0856
Confirm entry if StochRSI crosses upward from below 20 and volume increases.
🎯 Take Profit Targets:
1. **TP1
Follow me
#BTC125Next? #BNBBreaksATH #BinanceHODLer2Z
---
📊 Current Market Overview
Price: $0.08579 (+2.37%)
24h High: $0.08665
24h Low: $0.07928
MA60: 0.08569 — Price is just above MA60, indicating short-term support.
24h Volume (TUT): 39.76M — decent activity.
---
🔍 Indicator Breakdown
1️⃣ MACD (Momentum)
DIF: 0.00003
DEA: 0.00008
MACD: -0.00005
👉 The MACD line (DIF) is slightly below the signal (DEA), showing weak bearish momentum, but very close to a possible bullish crossover.
➡️ Suggests consolidation or early reversal signs.
---
2️⃣ Stoch RSI (Overbought/Oversold)
STOCHRSI: 1.41863
MASTOCHRSI: 18.46470
👉 These values are very low (<20) → indicates oversold conditions.
➡️ This means buyers may soon step in, and a bounce up could occur soon.
---
3️⃣ Moving Averages
MA(5): 0.0856
MA(10): 0.0857
MA(60): 0.08569
👉 The short-term and mid-term averages are close to each other, suggesting the price is at a decision point.
If it breaks above 0.0865, a bullish move can start.
If it drops below 0.0845, a short-term correction may continue.
---
💰 Trade Plan (Scalp or Short-Term Swing)
🟩 Entry Zone (Buy):
Between $0.0850 – $0.0856
Confirm entry if StochRSI crosses upward from below 20 and volume increases.
🎯 Take Profit Targets:
1. **TP1
Follow me
#BTC125Next? #BNBBreaksATH #BinanceHODLer2Z
103
·
--
Bullish
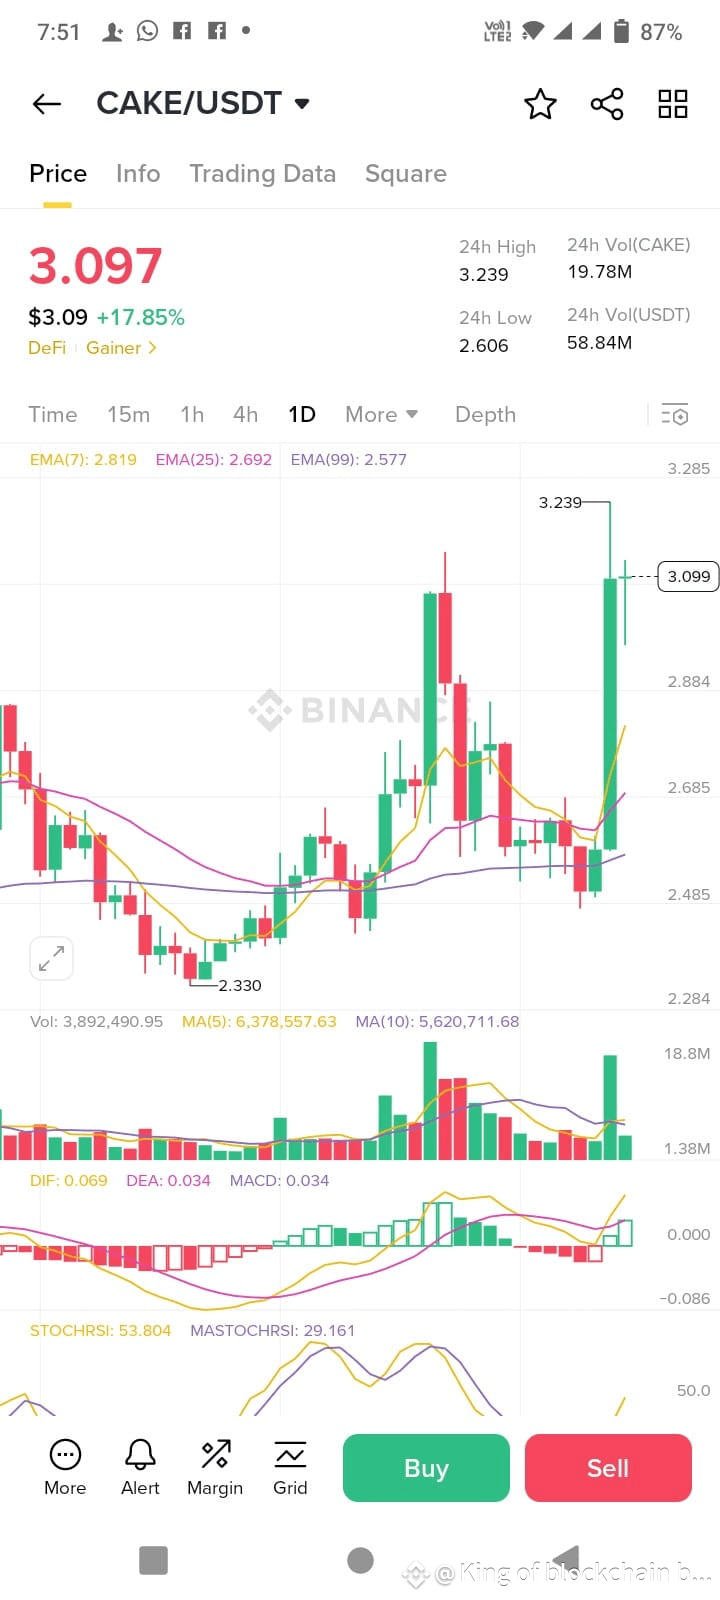
$CAKE Alright, let’s analyze CAKE/USDT (1D chart) carefully 📊
---
🔎 Chart Breakdown
Price: $3.097 (+17.85%)
24h Range: $2.606 – $3.239
EMA Levels:
EMA(7): 2.819 ✅ Price above (short-term bullish)
EMA(25): 2.692 ✅ Price above (mid-term bullish)
EMA(99): 2.577 ✅ Price above (long-term bullish)
👉 This alignment (7 > 25 > 99) confirms trend reversal to bullish.
MACD:
DIF: 0.069, DEA: 0.034 → Histogram positive at 0.034 → Bullish momentum increasing.
Stoch RSI:
Stoch RSI: 53.8, MA Stoch RSI: 29.1 → Mid-zone, not overbought → still room to push higher.
Volume: Spike in buying volume = confirms breakout.
---
📊 Trade Plan
Entry Zone (Buy):
Ideal re-entry on pullback: $2.90 – $2.95
Aggressive entry: $3.05 – $3.10 (current breakout zone).
Take Profit Targets (TP):
1. TP1: $3.30 – $3.35 (short-term resistance, yesterday’s high)
2. TP2: $3.60 (next resistance area)
3. TP3: $4.00 (psychological + strong resistance)
Stop Loss (SL):
Conservative: $2.75 (below EMA25 support)
Aggressive: $2.60 (24h low).
---
Follow me
#BNBBreaksATH #BTCReclaims120K #BinanceHODLer2Z
$BNB
{spot}(BNBUSDT)
$SOL
{spot}(SOLUSDT)
$CAKE Alright, let’s analyze CAKE/USDT (1D chart) carefully 📊
---
🔎 Chart Breakdown
Price: $3.097 (+17.85%)
24h Range: $2.606 – $3.239
EMA Levels:
EMA(7): 2.819 ✅ Price above (short-term bullish)
EMA(25): 2.692 ✅ Price above (mid-term bullish)
EMA(99): 2.577 ✅ Price above (long-term bullish)
👉 This alignment (7 > 25 > 99) confirms trend reversal to bullish.
MACD:
DIF: 0.069, DEA: 0.034 → Histogram positive at 0.034 → Bullish momentum increasing.
Stoch RSI:
Stoch RSI: 53.8, MA Stoch RSI: 29.1 → Mid-zone, not overbought → still room to push higher.
Volume: Spike in buying volume = confirms breakout.
---
📊 Trade Plan
Entry Zone (Buy):
Ideal re-entry on pullback: $2.90 – $2.95
Aggressive entry: $3.05 – $3.10 (current breakout zone).
Take Profit Targets (TP):
1. TP1: $3.30 – $3.35 (short-term resistance, yesterday’s high)
2. TP2: $3.60 (next resistance area)
3. TP3: $4.00 (psychological + strong resistance)
Stop Loss (SL):
Conservative: $2.75 (below EMA25 support)
Aggressive: $2.60 (24h low).
---
Follow me
#BNBBreaksATH #BTCReclaims120K #BinanceHODLer2Z
$BNB
$SOL
---
🔎 Chart Breakdown
Price: $3.097 (+17.85%)
24h Range: $2.606 – $3.239
EMA Levels:
EMA(7): 2.819 ✅ Price above (short-term bullish)
EMA(25): 2.692 ✅ Price above (mid-term bullish)
EMA(99): 2.577 ✅ Price above (long-term bullish)
👉 This alignment (7 > 25 > 99) confirms trend reversal to bullish.
MACD:
DIF: 0.069, DEA: 0.034 → Histogram positive at 0.034 → Bullish momentum increasing.
Stoch RSI:
Stoch RSI: 53.8, MA Stoch RSI: 29.1 → Mid-zone, not overbought → still room to push higher.
Volume: Spike in buying volume = confirms breakout.
---
📊 Trade Plan
Entry Zone (Buy):
Ideal re-entry on pullback: $2.90 – $2.95
Aggressive entry: $3.05 – $3.10 (current breakout zone).
Take Profit Targets (TP):
1. TP1: $3.30 – $3.35 (short-term resistance, yesterday’s high)
2. TP2: $3.60 (next resistance area)
3. TP3: $4.00 (psychological + strong resistance)
Stop Loss (SL):
Conservative: $2.75 (below EMA25 support)
Aggressive: $2.60 (24h low).
---
Follow me
#BNBBreaksATH #BTCReclaims120K #BinanceHODLer2Z
$BNB
$SOL
182
·
--
Bullish
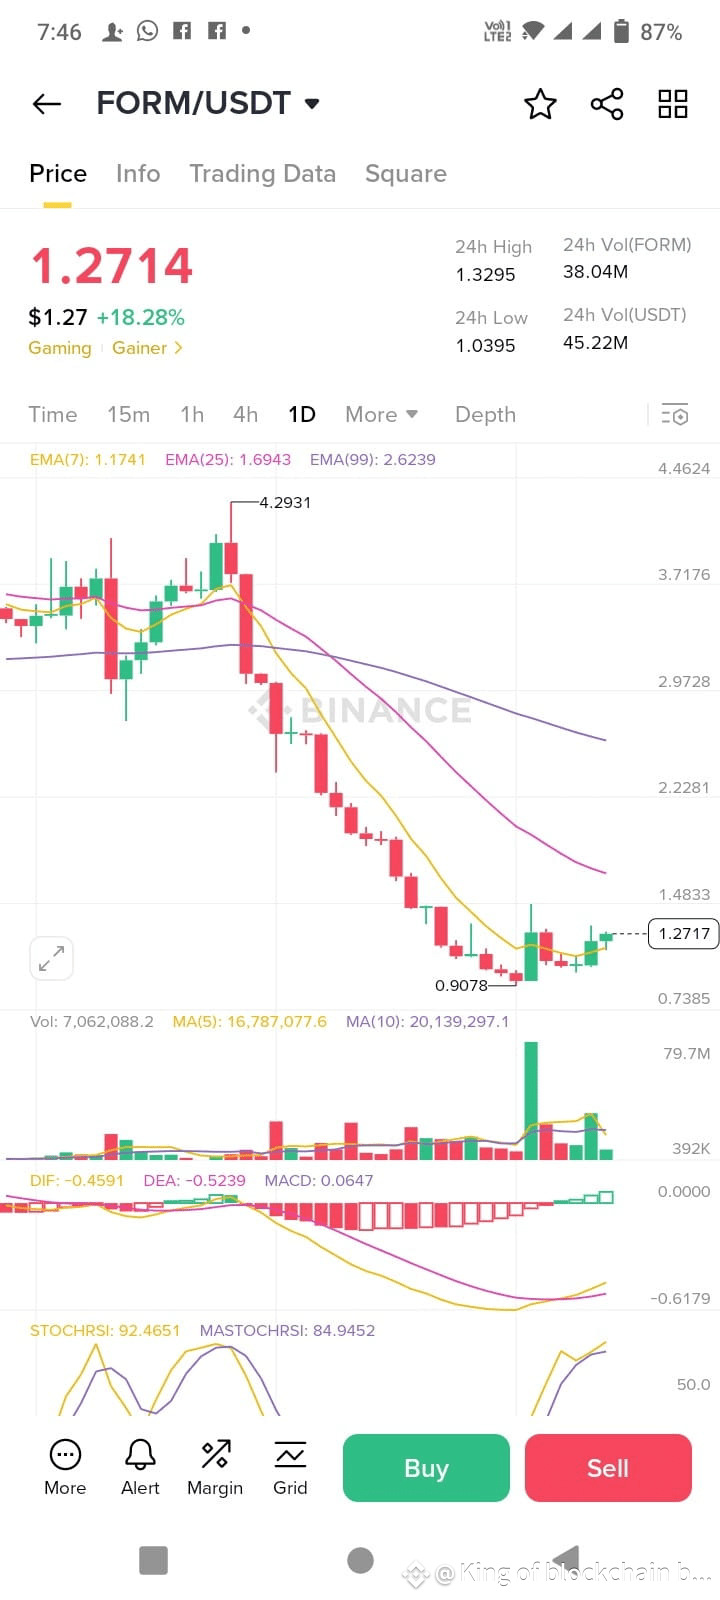
$FORM Got it 👍 let’s analyze this FORM/USDT (1D chart).
🔎 Chart Breakdown
Price: $1.2714 (+18.28%)
24h Range: High $1.3295 – Low $1.0395
EMA levels:
EMA(7): 1.1741 → Price trading above (short-term bullish)
EMA(25): 1.6943 → Still below (mid-term resistance)
EMA(99): 2.6239 → Far above (long-term resistance)
MACD:
DIF: -0.4591, DEA: -0.5239, MACD histogram positive (0.0647) → Bullish crossover forming.
Stoch RSI:
Stoch RSI: 92.46, MA Stoch RSI: 84.94 → Overbought zone (possible short-term pullback risk).
Volume: Strong buying volume compared to the last few candles → demand increasing.
---
📊 Trade Plan
Entry Zone (Buy):
Between $1.15 – $1.20 (near EMA(7) support & small retracement area).
Take Profit Targets (TP):
1. TP1: $1.40 (recent resistance zone)
2. TP2: $1.70 (EMA25 resistance)
3. TP3: $2.20 – $2.30 (next strong resistance)
Stop Loss (SL):
Below $1.05 (24h low & key support).
---
⚠️ Risk Notes
RSI being overbought suggests it might retest $1.15 before continuation.
Mid-term trend still bearish (below EMA25 & EMA99), so treat this as a short-term rebound trade until higher confirmations.
👉 Best play: Buy dips near $1.15–1.20, book profits gradually at resistance levels.
Follow me
#BNBBreaksATH #BTCReclaims120K
$BTC
{spot}(BTCUSDT)
$OP
{spot}(OPUSDT)
$FORM Got it 👍 let’s analyze this FORM/USDT (1D chart).
🔎 Chart Breakdown
Price: $1.2714 (+18.28%)
24h Range: High $1.3295 – Low $1.0395
EMA levels:
EMA(7): 1.1741 → Price trading above (short-term bullish)
EMA(25): 1.6943 → Still below (mid-term resistance)
EMA(99): 2.6239 → Far above (long-term resistance)
MACD:
DIF: -0.4591, DEA: -0.5239, MACD histogram positive (0.0647) → Bullish crossover forming.
Stoch RSI:
Stoch RSI: 92.46, MA Stoch RSI: 84.94 → Overbought zone (possible short-term pullback risk).
Volume: Strong buying volume compared to the last few candles → demand increasing.
---
📊 Trade Plan
Entry Zone (Buy):
Between $1.15 – $1.20 (near EMA(7) support & small retracement area).
Take Profit Targets (TP):
1. TP1: $1.40 (recent resistance zone)
2. TP2: $1.70 (EMA25 resistance)
3. TP3: $2.20 – $2.30 (next strong resistance)
Stop Loss (SL):
Below $1.05 (24h low & key support).
---
⚠️ Risk Notes
RSI being overbought suggests it might retest $1.15 before continuation.
Mid-term trend still bearish (below EMA25 & EMA99), so treat this as a short-term rebound trade until higher confirmations.
👉 Best play: Buy dips near $1.15–1.20, book profits gradually at resistance levels.
Follow me
#BNBBreaksATH #BTCReclaims120K
$BTC
$OP
517
·
--
Bullish
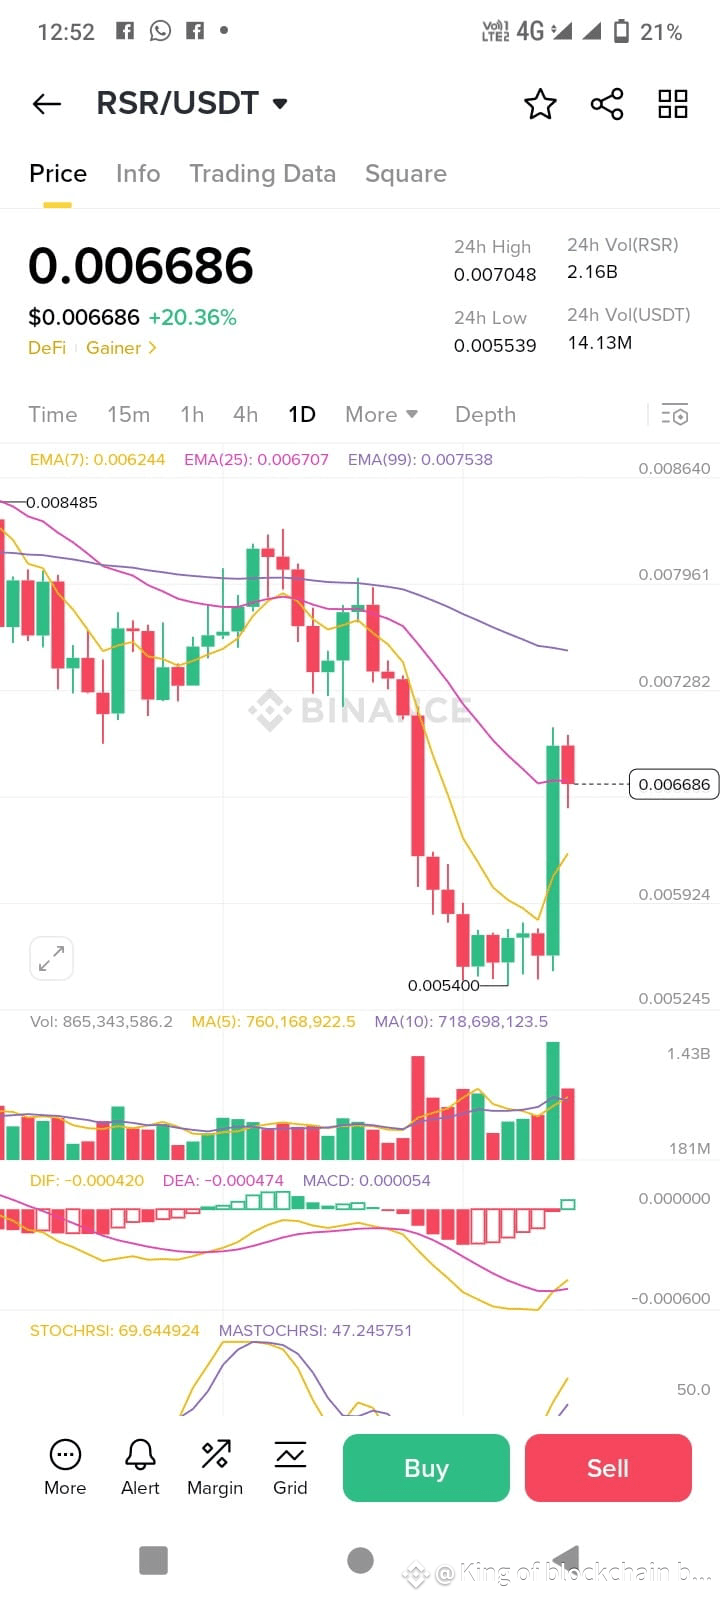
$RSR Got it 👍 Let’s build a trade plan for RSR/USDT based on RSI/Stoch RSI + market structure:
---
📊 Current Situation
Stoch RSI: 69.6 → bullish momentum but not extreme.
MA Stoch RSI: 47.2 → momentum still climbing.
Price likely in an uptrend with moderate strength.
---
🎯 Trade Plan (Short-Term Swing)
Entry Zone (Buy Levels):
$0.00480 – $0.00495 → Safe pullback entry near short-term support.
If aggressive, partial entry can also be taken at current price levels if trend continues upward.
Take Profit Targets:
TP1: $0.00525 (first resistance, scalpers can exit here).
TP2: $0.00550 (next resistance zone, ~10–12% upside).
TP3: $0.00585 (extended target if momentum stays strong).
Stop-Loss:
Below $0.00465 (break of support & momentum shift).
---
⚖️ Risk/Reward
Risk per trade: ~3–4%
Reward potential: 8–15% depending on which TP you use.
Ratio: 2–3R, which is solid.
---
🔥 In summary:
Buy dips near $0.0048 – 0.00495.
Take profit at $0.00525 / $0.00550 / $0.00585.
Stop-loss $0.00465.
Follow me for more accurate signal
#BinanceHODLer2Z #MarketUptober #Token2049Singapore
---
📊 Current Situation
Stoch RSI: 69.6 → bullish momentum but not extreme.
MA Stoch RSI: 47.2 → momentum still climbing.
Price likely in an uptrend with moderate strength.
---
🎯 Trade Plan (Short-Term Swing)
Entry Zone (Buy Levels):
$0.00480 – $0.00495 → Safe pullback entry near short-term support.
If aggressive, partial entry can also be taken at current price levels if trend continues upward.
Take Profit Targets:
TP1: $0.00525 (first resistance, scalpers can exit here).
TP2: $0.00550 (next resistance zone, ~10–12% upside).
TP3: $0.00585 (extended target if momentum stays strong).
Stop-Loss:
Below $0.00465 (break of support & momentum shift).
---
⚖️ Risk/Reward
Risk per trade: ~3–4%
Reward potential: 8–15% depending on which TP you use.
Ratio: 2–3R, which is solid.
---
🔥 In summary:
Buy dips near $0.0048 – 0.00495.
Take profit at $0.00525 / $0.00550 / $0.00585.
Stop-loss $0.00465.
Follow me for more accurate signal
#BinanceHODLer2Z #MarketUptober #Token2049Singapore
1
251
·
--
Bullish
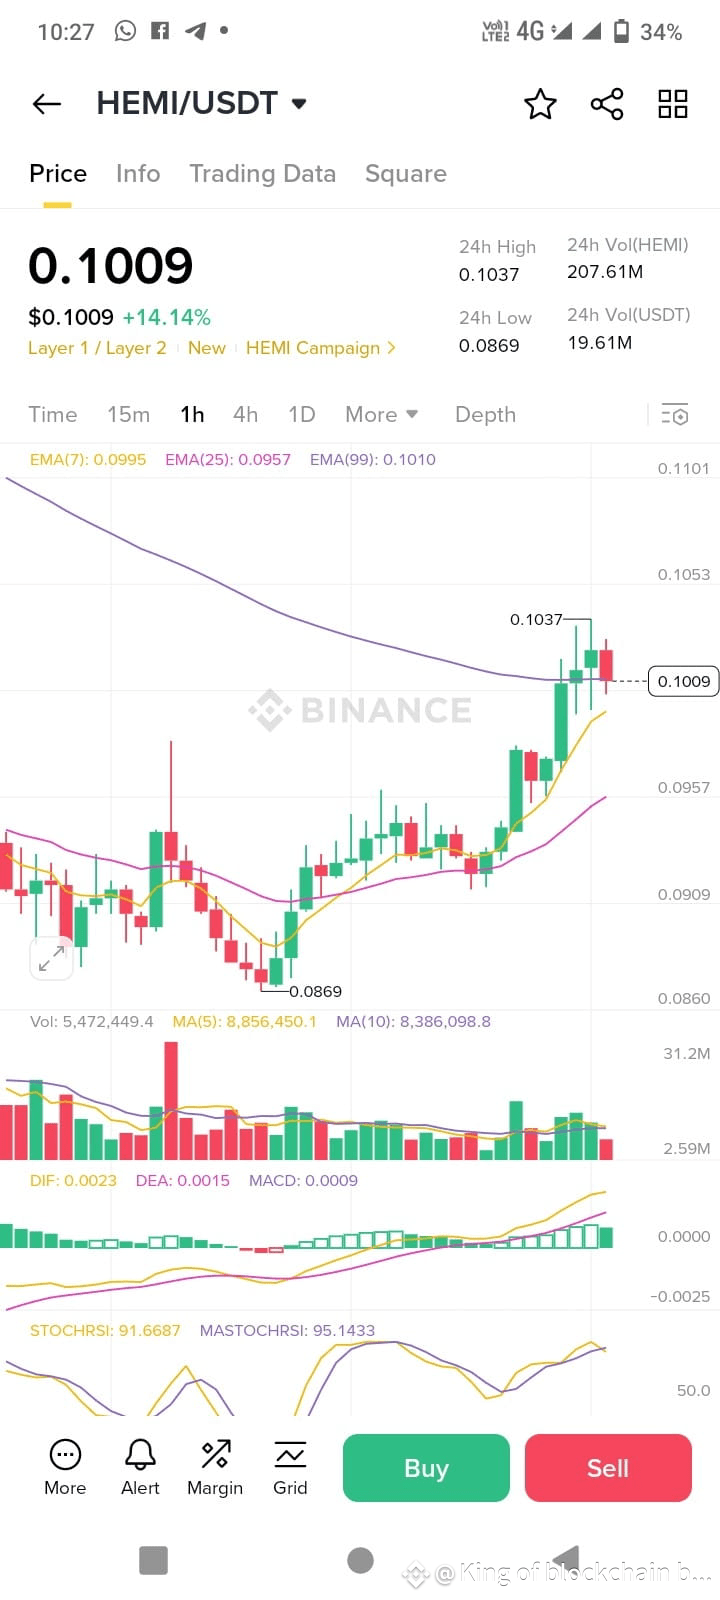
$HEMI Got it 👍 let’s build a clean HEMI/USDT trade plan based on the current setup.
---
📌 HEMI/USDT Trade Setup
✅ Entry Zone
$0.094 – $0.096 → Safer re-entry if price pulls back to support.
Aggressive entry: $0.099 – $0.101 (current area, but riskier since it’s near overbought).
🎯 Take-Profit (TP) Levels
TP1: $0.108 → first resistance, quick profit.
TP2: $0.112 → stronger resistance, partial exit.
TP3: $0.118 → stretch target if momentum continues.
🛑 Stop-Loss (SL)
$0.089 → below key support.
Keeps risk limited if the bullish trend breaks down.
📊 Risk–Reward Example
Entry: $0.095
SL: $0.089 (–6%)
TP2: $0.112 (+17%)
Risk–Reward ≈ 1:3 → solid setup ✅
Follow me for more accurate signal
#BinanceHODLer2Z #MarketUptober #USGovShutdown
$SOL
{spot}(SOLUSDT)
$HEMI Got it 👍 let’s build a clean HEMI/USDT trade plan based on the current setup.
---
📌 HEMI/USDT Trade Setup
✅ Entry Zone
$0.094 – $0.096 → Safer re-entry if price pulls back to support.
Aggressive entry: $0.099 – $0.101 (current area, but riskier since it’s near overbought).
🎯 Take-Profit (TP) Levels
TP1: $0.108 → first resistance, quick profit.
TP2: $0.112 → stronger resistance, partial exit.
TP3: $0.118 → stretch target if momentum continues.
🛑 Stop-Loss (SL)
$0.089 → below key support.
Keeps risk limited if the bullish trend breaks down.
📊 Risk–Reward Example
Entry: $0.095
SL: $0.089 (–6%)
TP2: $0.112 (+17%)
Risk–Reward ≈ 1:3 → solid setup ✅
Follow me for more accurate signal
#BinanceHODLer2Z #MarketUptober #USGovShutdown
$SOL
210
·
--
Bullish
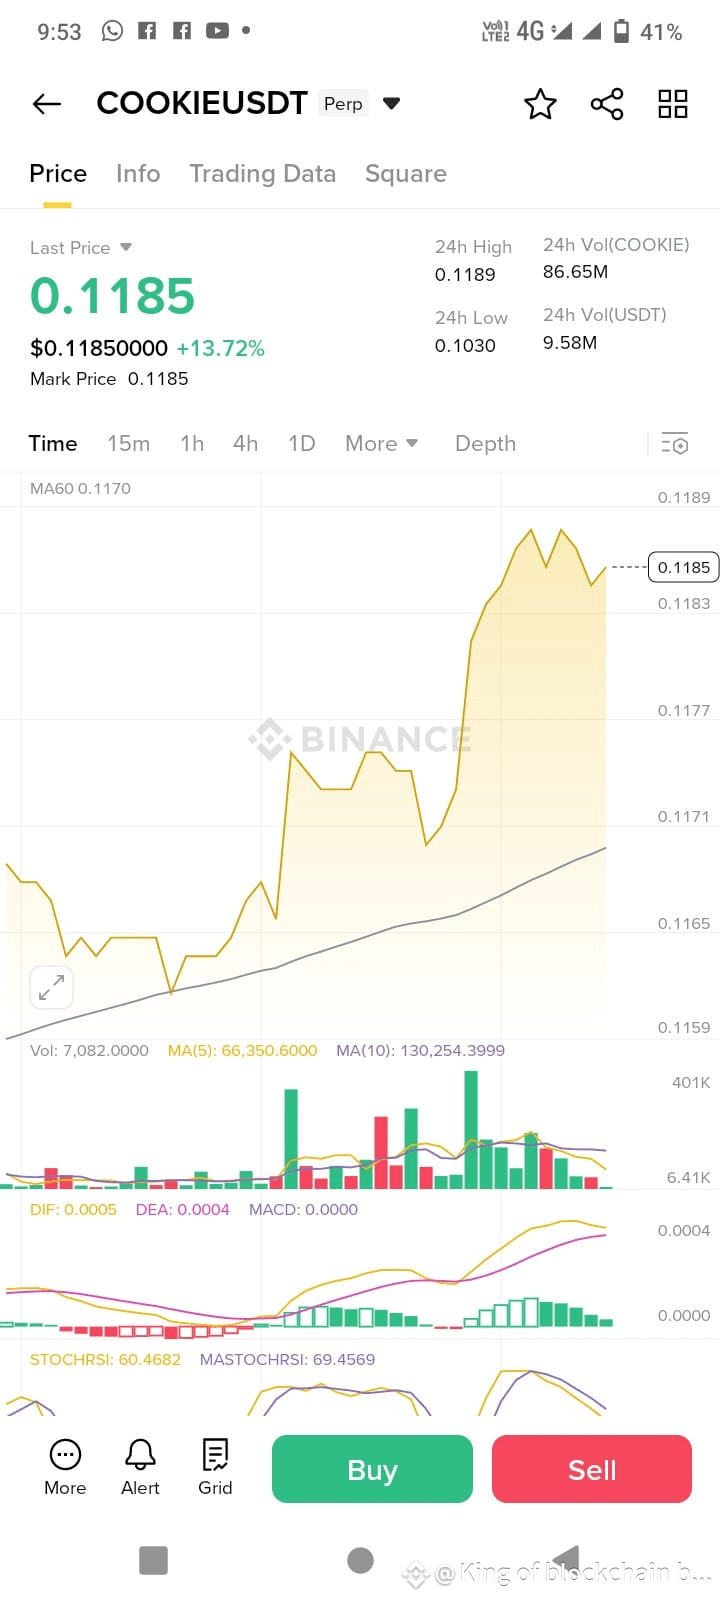
$COOKIE 📌 COOKIE/USDT Trading Plan
1. Entry Zone (Buy-in):
Aggressive entry: 0.1160 – 0.1180 (current range, near breakout).
Safer entry: 0.1100 – 0.1120 (if price dips/retests support).
2. Stop-Loss (Risk Control):
Place SL around 0.1060 (below recent support).
This protects from a sudden dump.
3. Take-Profit Targets (Sell Zones):
TP1: 0.1250 (first resistance)
TP2: 0.1320 (next resistance zone)
TP3: 0.1400 (strong take-profit level if pump continues)
4. Strategy:
If you buy now (0.116–0.118), sell partial at 0.125, then ride the rest toward higher levels.
If price dumps to 0.110–0.112, that’s a better low-risk entry for swing trade.
---
⚖️ Risk/Reward Example
Entry: 0.116
SL: 0.106 (−8%)
TP1: 0.125 (+7.7%)
TP2: 0.132 (+13.8%)
TP3: 0.140 (+20.6%)
That’s a 1:2 to 1:3 RR ratio, which is solid ✅.
---Follow me for more accurate signal
#BinanceHODLer2Z #MarketUptober #USGovShutdown #Token2049Singapore
178
·
--
Bullish
$PROVE Boooom Big congratulations to everyone who's pick my call my target hit successfully
You can ✅🎉🥫 check my previous post
Follow me for more accurate signal
#BinanceHODLer2Z #MarketUptober #USGovShutdown
$PROVE Boooom Big congratulations to everyone who's pick my call my target hit successfully
You can ✅🎉🥫 check my previous post
Follow me for more accurate signal
#BinanceHODLer2Z #MarketUptober #USGovShutdown
You can ✅🎉🥫 check my previous post
Follow me for more accurate signal
#BinanceHODLer2Z #MarketUptober #USGovShutdown
235
·
--
Bullish
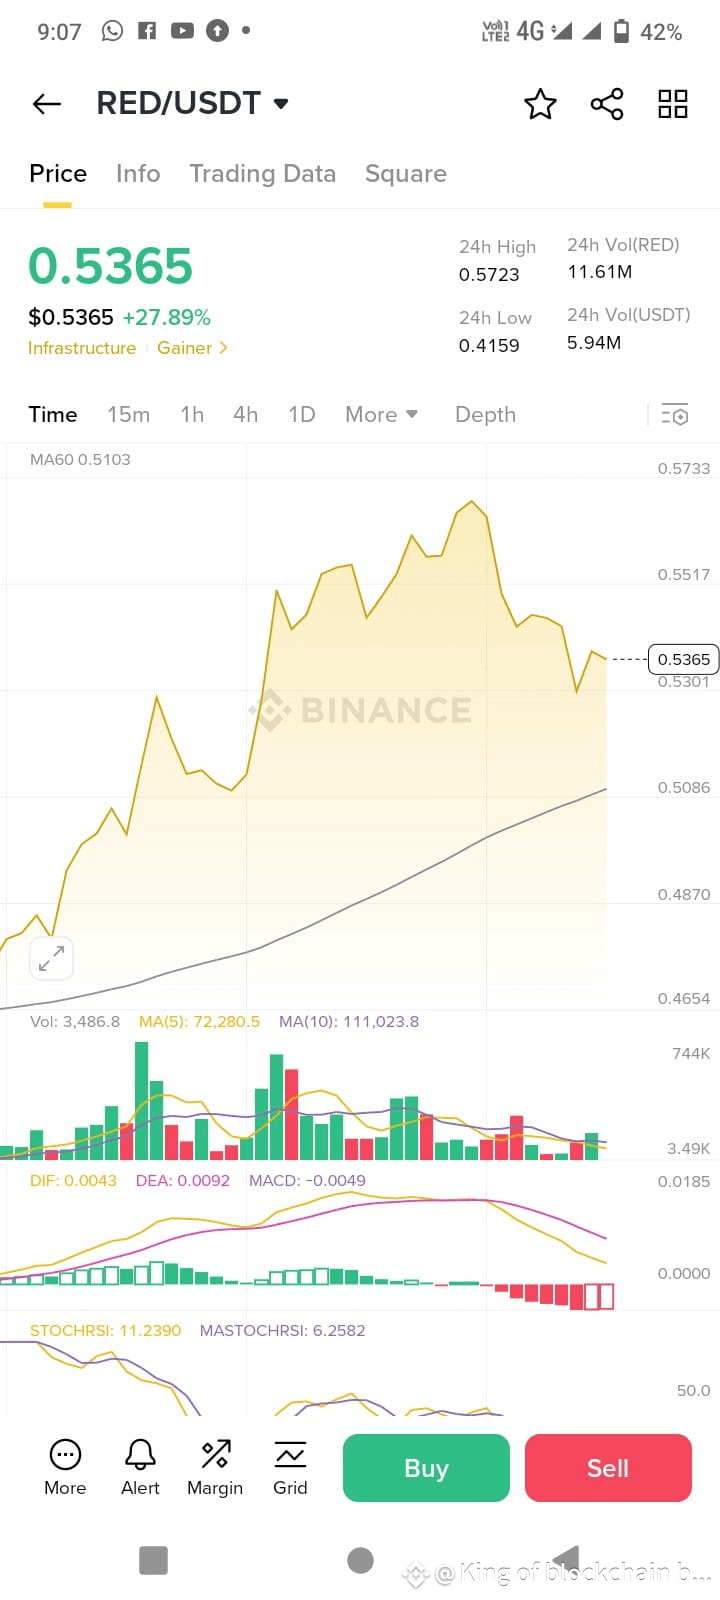
$RED RED/USDT is definitely looking strong on the price action side with that +27% pump 🚀, but there are some mixed signals:
✅ Bullish signs:
Big % gain and strong volume → showing momentum.
Price near the 24h high, indicating buyers are in control.
⚠️ Caution signs:
MACD negative (-0.0049) → momentum might not be fully confirmed, could be a fakeout pump.
Big moves like this often face pullbacks once early buyers take profits.
👉 Possible plays:
1. Scalp/Short-term trade – Enter on a small pullback around $0.50–0.52 and aim for a retest of $0.57–0.60.
2. Wait & watch – If it fails to break $0.57 with volume, a correction to $0.47–0.45 is likely.
3. Set a tight stop-loss – If trading long, keep SL around $0.48 to protect from a sharp dump.
Follow me for more accurate signal
#BinanceHODLer2Z #MarketUptober
31
Log in to explore more content
Join global crypto users on Binance Square
⚡️ Get latest and useful information about crypto.
💬 Trusted by the world’s largest crypto exchange.
👍 Discover real insights from verified creators.
Email / Phone number
Trending Topics
UniswapA16zSeekDeFiExemptionFromIllinoisCryptoTax
23,670 views
737 Discussing
#CryptoTax 🚨 CRYPTO MARKET & REGULATORY UPDATE #HKDollarStablecoinHKDAPToLaunchOnSolana
#uniswapa16zseekdefiexemptionfromillinoiscryptotax UNISWAP, a16z & DeFi Education Fund Challenge Illinois Crypto Tax Rules
October 30, 2026 | Market Volatility & Industry Developments
📊 1. MARKET SNAPSHOT
Crypto markets are showing mixed signals, with selected assets posting sharp gains while several major cryptocurrencies remain under pressure.
📈 Top reported gainers
SOPH: +60.81% — $0.00238
BEAMX: +37.94% — $0.004701
SKDDB: +16.81% — $9.38
📉 Notable reported losers
INTWUSDT: −61.09% — $6.72
AKEUSDT: −31.47% — $0.013989
SNXXUSDT: −30.71% — $6.43
🔎 Major crypto assets under pressure
DOGE: −5.06%
PEPE: −4.91%
SUI: −4.83%
NEAR: −3.28%
XRP: −3.13%
Uniswap Labs, Andreessen Horowitz (a16z), and the DeFi Education Fund (DEF) are pushing for exemptions from Illinois’
#Uniswap #a16z #DeFi #CryptoRegulation #Illinois # #Web3 #BinanceSquare
#HKDollarStablecoinHKDAPToLaunchOnSolana #HKDAP #Stablecoin #CryptoNews #Blockchain #DeFi #DigitalPayments
⚖️ 3. UNISWAP, a16z & ILLINOIS CRYPTO TAX RULES
Uniswap Labs, Andreessen Horowitz (a16z), and the DeFi Education Fund are associated with efforts to seek exemptions proposed Illinois crypto tax requirements.
The debate highlights a key question: How should tax-reporting obligations apply to decentralized that may not operate like traditional financial intermediaries?
The outcome could influence DeFi compliance, developer obligations, and the future regulatory environment.
#BinanceSquare #CryptoNews #HKDAP #Stablecoin #Uniswap #a16z #DeFi #CryptoTax
CHASEPA SULUXù
·2 Likes
·171 views
HKDollarStablecoinHKDAPToLaunchOnSolana
18,102 views
465 Discussing
$1.5BInLeveragedCryptoBetsLiquidated
38,739 views
244 Discussing