
BitcoinGuide
80 Posts

BitcoinGuide
Report
Block User
I've been working as a chart analyst at TradingView for 10 years. You can check "Bitcoin" entry prices, target prices, stop-loss and trading paths in real time daily on a 30-minute candle chart. You'll be the experience a new world. Thank you.
0 Following
2 Followers
1 Liked
Posts
All
Videos
·
--
[September 11 Bitcoin chart analysis]
BTCUSD 30Min Chart
*My analysis is optimized for TradingView.
If you press the replay button, you can check real-time movements.
-Long position strategy-
At the bottom left, I have maintained the strategy for the long position entry point of $76,999.4 (marked with a purple finger), which was established on September 10th.
The CPI data release is scheduled for 9:30 shortly.
*Long position strategy regarding the upper "Purple Finger 1" zone:
1) After confirming a touch of the "Purple Finger 1" zone at $78,360.4:
Long position entry at $77,743.5 (red finger); stop-loss if the purple support line is breached.
2) First target for the long position at $79,558.7 ->
Subsequent targets for the weekend: "Good" followed by "Great."
- If the strategy succeeds, the $78.9K level can be used for re-entering a long position.
3) If the price drops directly without touching the "Purple Finger 1" zone:
Long position entry at the lower "Zone 2" ($76,748.2); stop-loss if the purple support line is breached.
- For those currently holding the $76.9K long position, you may apply the same stop-loss rule (exit if the purple support line is breached).
- If the purple support line breaks, the price moves to the "Bottom" zone (the final support line of the rising channel).
- Although not visible on the chart, there is potential downside room down to $74.9K below that level.
Please use this analysis solely for reference and planning purposes.
I hope you trade safely by adhering to your principles and using stop-loss orders.
I post the analysis results as a Comment every day.
Thank you.
(You can find the link on my profile.)
- Click Follow to receive faster information every day.
- Check the results using the replay button on TradingView.
#BTC Price Analysis# #BNBChain# #BTC100K #Altcoin Season# $USDT $ETH $XRP $SOL $BTC
[September 11 Bitcoin chart analysis]
BTCUSD 30Min Chart
*My analysis is optimized for TradingView.
If you press the replay button, you can check real-time movements.
-Long position strategy-
At the bottom left, I have maintained the strategy for the long position entry point of $76,999.4 (marked with a purple finger), which was established on September 10th.
The CPI data release is scheduled for 9:30 shortly.
*Long position strategy regarding the upper "Purple Finger 1" zone:
1) After confirming a touch of the "Purple Finger 1" zone at $78,360.4:
Long position entry at $77,743.5 (red finger); stop-loss if the purple support line is breached.
2) First target for the long position at $79,558.7 ->
Subsequent targets for the weekend: "Good" followed by "Great."
- If the strategy succeeds, the $78.9K level can be used for re-entering a long position.
3) If the price drops directly without touching the "Purple Finger 1" zone:
Long position entry at the lower "Zone 2" ($76,748.2); stop-loss if the purple support line is breached.
- For those currently holding the $76.9K long position, you may apply the same stop-loss rule (exit if the purple support line is breached).
- If the purple support line breaks, the price moves to the "Bottom" zone (the final support line of the rising channel).
- Although not visible on the chart, there is potential downside room down to $74.9K below that level.
Please use this analysis solely for reference and planning purposes.
I hope you trade safely by adhering to your principles and using stop-loss orders.
I post the analysis results as a Comment every day.
Thank you.
(You can find the link on my profile.)
- Click Follow to receive faster information every day.
- Check the results using the replay button on TradingView.
#BTC Price Analysis# #BNBChain# #BTC100K #Altcoin Season# $USDT $ETH $XRP $SOL $BTC
BTCUSD 30Min Chart
*My analysis is optimized for TradingView.
If you press the replay button, you can check real-time movements.
-Long position strategy-
At the bottom left, I have maintained the strategy for the long position entry point of $76,999.4 (marked with a purple finger), which was established on September 10th.
The CPI data release is scheduled for 9:30 shortly.
*Long position strategy regarding the upper "Purple Finger 1" zone:
1) After confirming a touch of the "Purple Finger 1" zone at $78,360.4:
Long position entry at $77,743.5 (red finger); stop-loss if the purple support line is breached.
2) First target for the long position at $79,558.7 ->
Subsequent targets for the weekend: "Good" followed by "Great."
- If the strategy succeeds, the $78.9K level can be used for re-entering a long position.
3) If the price drops directly without touching the "Purple Finger 1" zone:
Long position entry at the lower "Zone 2" ($76,748.2); stop-loss if the purple support line is breached.
- For those currently holding the $76.9K long position, you may apply the same stop-loss rule (exit if the purple support line is breached).
- If the purple support line breaks, the price moves to the "Bottom" zone (the final support line of the rising channel).
- Although not visible on the chart, there is potential downside room down to $74.9K below that level.
Please use this analysis solely for reference and planning purposes.
I hope you trade safely by adhering to your principles and using stop-loss orders.
I post the analysis results as a Comment every day.
Thank you.
(You can find the link on my profile.)
- Click Follow to receive faster information every day.
- Check the results using the replay button on TradingView.
#BTC Price Analysis# #BNBChain# #BTC100K #Altcoin Season# $USDT $ETH $XRP $SOL $BTC

59
·
--
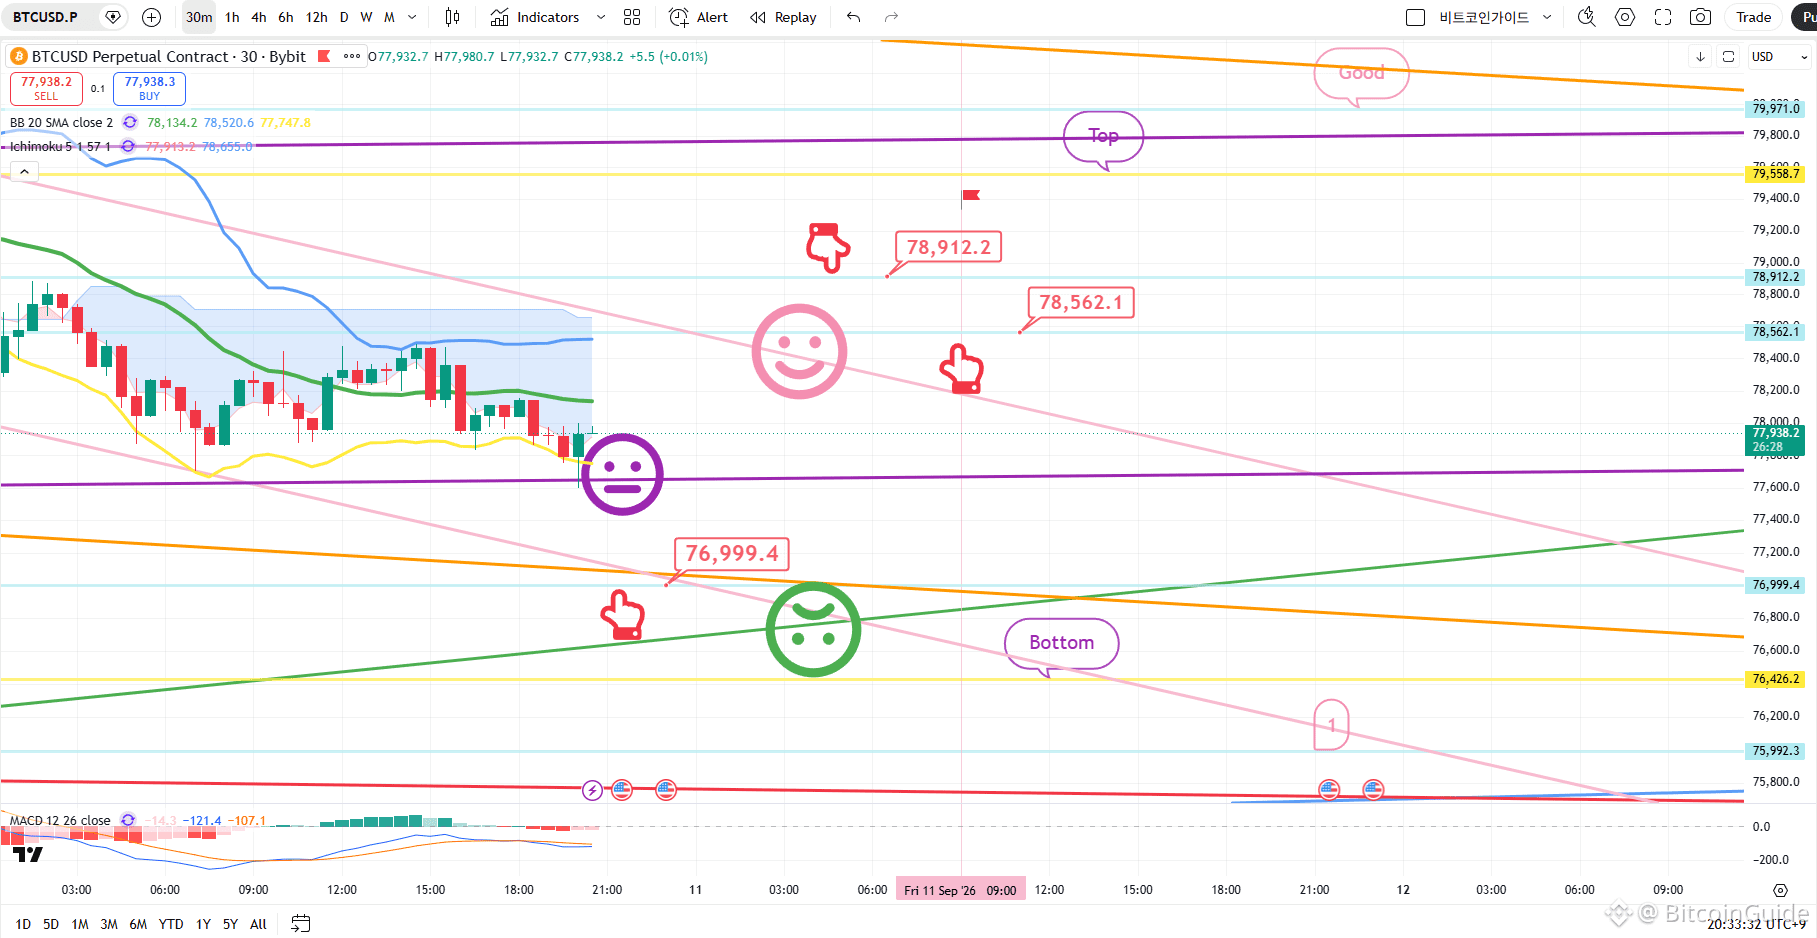
[September 10 Bitcoin chart analysis]
BTCUSD 30Min Chart
*My analysis is optimized for TradingView.
If you press the replay button, you can check real-time movements.
-Long position strategy-
*If the price follows the path indicated by the red arrow:
Long position strategy
1) Long entry zone: $76,999.4 / Stop-loss: If the price breaks below the green support line
2) Long position 1st target: $78,912.2 -> Subsequent targets: 'Top' and then 'Good'
- If the strategy succeeds, the $78.5K level (marked by the red arrow) can be used as a re-entry zone for long positions.
- If the price breaks below the green support line,
the rising channel will be invalidated, and it may take a long time for the price to rise again.
- Currently, the Nasdaq is showing a MACD "death cross" on the 12-hour chart,
so there is a high probability of sideways movement.
If the price holds above the purple support line, the market may close with an upward-drifting sideways trend.
If it breaks below the green support line, the price could drop toward the 'Bottom' level marked below
-> potentially extending down to the '1' zone.
I post the analysis results as a Comment every day.
Thank you.
(You can find the link on my profile.)
- Click Follow to receive faster information every day.
- Check the results using the replay button on TradingView.
#BTC Price Analysis# #Altcoin Season# #Crypto# $USDT $BTC $ETH
[September 10 Bitcoin chart analysis]
BTCUSD 30Min Chart
*My analysis is optimized for TradingView.
If you press the replay button, you can check real-time movements.
-Long position strategy-
*If the price follows the path indicated by the red arrow:
Long position strategy
1) Long entry zone: $76,999.4 / Stop-loss: If the price breaks below the green support line
2) Long position 1st target: $78,912.2 -> Subsequent targets: 'Top' and then 'Good'
- If the strategy succeeds, the $78.5K level (marked by the red arrow) can be used as a re-entry zone for long positions.
- If the price breaks below the green support line,
the rising channel will be invalidated, and it may take a long time for the price to rise again.
- Currently, the Nasdaq is showing a MACD "death cross" on the 12-hour chart,
so there is a high probability of sideways movement.
If the price holds above the purple support line, the market may close with an upward-drifting sideways trend.
If it breaks below the green support line, the price could drop toward the 'Bottom' level marked below
-> potentially extending down to the '1' zone.
I post the analysis results as a Comment every day.
Thank you.
(You can find the link on my profile.)
- Click Follow to receive faster information every day.
- Check the results using the replay button on TradingView.
#BTC Price Analysis# #Altcoin Season# #Crypto# $USDT $BTC $ETH
BTCUSD 30Min Chart
*My analysis is optimized for TradingView.
If you press the replay button, you can check real-time movements.
-Long position strategy-
*If the price follows the path indicated by the red arrow:
Long position strategy
1) Long entry zone: $76,999.4 / Stop-loss: If the price breaks below the green support line
2) Long position 1st target: $78,912.2 -> Subsequent targets: 'Top' and then 'Good'
- If the strategy succeeds, the $78.5K level (marked by the red arrow) can be used as a re-entry zone for long positions.
- If the price breaks below the green support line,
the rising channel will be invalidated, and it may take a long time for the price to rise again.
- Currently, the Nasdaq is showing a MACD "death cross" on the 12-hour chart,
so there is a high probability of sideways movement.
If the price holds above the purple support line, the market may close with an upward-drifting sideways trend.
If it breaks below the green support line, the price could drop toward the 'Bottom' level marked below
-> potentially extending down to the '1' zone.
I post the analysis results as a Comment every day.
Thank you.
(You can find the link on my profile.)
- Click Follow to receive faster information every day.
- Check the results using the replay button on TradingView.
#BTC Price Analysis# #Altcoin Season# #Crypto# $USDT $BTC $ETH
69
·
--
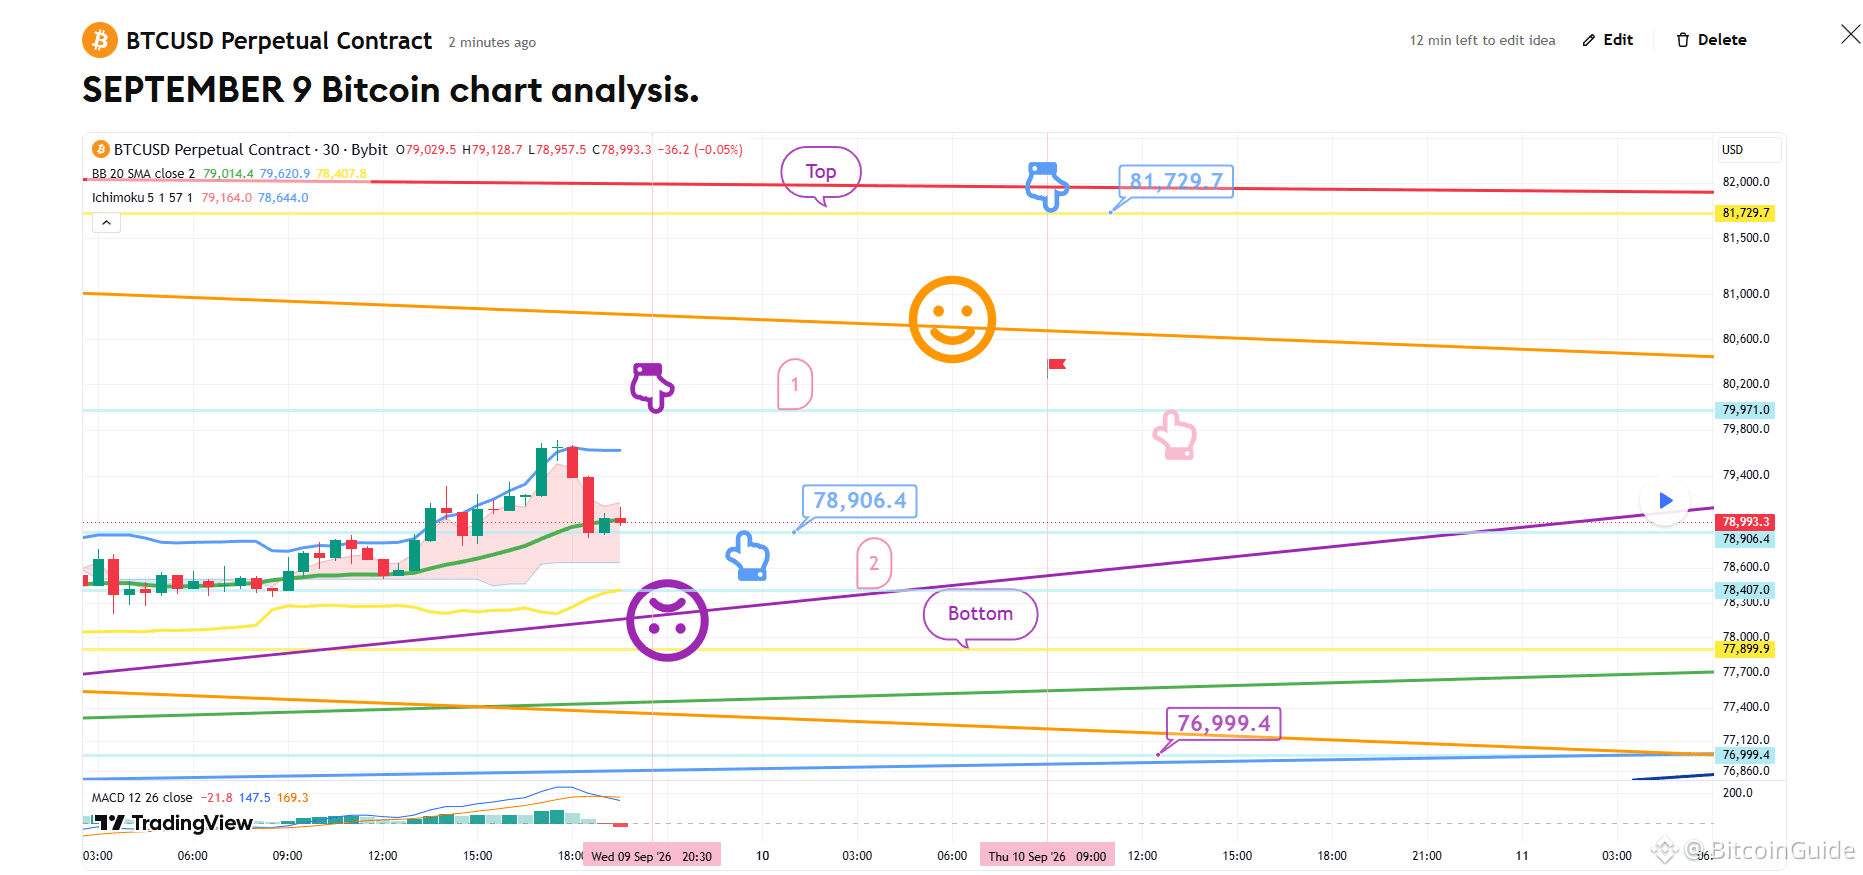
[September 9 Bitcoin chart analysis]
*My analysis is optimized for TradingView.
If you press the replay button, you can check real-time movements.
This is the Bitcoin 30-minute chart.
Since the overall medium-term pattern has broken down,
we may see significant volatility in both directions.
*A neutral strategy (trading both directions)
applied around the "Purple Finger 1" zone at the top:
1) After confirming a touch of the Purple Finger 1 zone at $79,791 (consider a short position),
look to enter a long position at the lower level marked by the light blue finger ($78,906.4).
/ Stop-loss if the purple support line is breached.
2) Switch to a short position at $81,729.7 / Stop-loss if the red resistance line is broken.
This also serves as the final zone to re-enter a long position.
3) If the price drops immediately without touching the 1 zone at the top,
the "Zone 2" level at $78.4K is the final waiting point for a long position.
The stop-loss condition (if the purple support line is breached) remains the same.
Once the purple support line is breached,
the price could drop to the "Bottom" level marked below—potentially as low as $76.9K—
so please exercise caution.
If the light blue support line at $76.9K is broken,
the medium-term bullish channel will be invalidated, which is unfavorable for long positions.
I post the analysis results as a Comment every day.
Thank you.
(You can find the link on my profile.)
- Click Follow to receive faster information every day.
- Check the results using the replay button on TradingView.
#Crypto# #BTC Price Analysis# #Altcoin Season# #BNBChain# #ㅠㅆ
[September 9 Bitcoin chart analysis]
*My analysis is optimized for TradingView.
If you press the replay button, you can check real-time movements.
This is the Bitcoin 30-minute chart.
Since the overall medium-term pattern has broken down,
we may see significant volatility in both directions.
*A neutral strategy (trading both directions)
applied around the "Purple Finger 1" zone at the top:
1) After confirming a touch of the Purple Finger 1 zone at $79,791 (consider a short position),
look to enter a long position at the lower level marked by the light blue finger ($78,906.4).
/ Stop-loss if the purple support line is breached.
2) Switch to a short position at $81,729.7 / Stop-loss if the red resistance line is broken.
This also serves as the final zone to re-enter a long position.
3) If the price drops immediately without touching the 1 zone at the top,
the "Zone 2" level at $78.4K is the final waiting point for a long position.
The stop-loss condition (if the purple support line is breached) remains the same.
Once the purple support line is breached,
the price could drop to the "Bottom" level marked below—potentially as low as $76.9K—
so please exercise caution.
If the light blue support line at $76.9K is broken,
the medium-term bullish channel will be invalidated, which is unfavorable for long positions.
I post the analysis results as a Comment every day.
Thank you.
(You can find the link on my profile.)
- Click Follow to receive faster information every day.
- Check the results using the replay button on TradingView.
#Crypto# #BTC Price Analysis# #Altcoin Season# #BNBChain# #ㅠㅆ
*My analysis is optimized for TradingView.
If you press the replay button, you can check real-time movements.
This is the Bitcoin 30-minute chart.
Since the overall medium-term pattern has broken down,
we may see significant volatility in both directions.
*A neutral strategy (trading both directions)
applied around the "Purple Finger 1" zone at the top:
1) After confirming a touch of the Purple Finger 1 zone at $79,791 (consider a short position),
look to enter a long position at the lower level marked by the light blue finger ($78,906.4).
/ Stop-loss if the purple support line is breached.
2) Switch to a short position at $81,729.7 / Stop-loss if the red resistance line is broken.
This also serves as the final zone to re-enter a long position.
3) If the price drops immediately without touching the 1 zone at the top,
the "Zone 2" level at $78.4K is the final waiting point for a long position.
The stop-loss condition (if the purple support line is breached) remains the same.
Once the purple support line is breached,
the price could drop to the "Bottom" level marked below—potentially as low as $76.9K—
so please exercise caution.
If the light blue support line at $76.9K is broken,
the medium-term bullish channel will be invalidated, which is unfavorable for long positions.
I post the analysis results as a Comment every day.
Thank you.
(You can find the link on my profile.)
- Click Follow to receive faster information every day.
- Check the results using the replay button on TradingView.
#Crypto# #BTC Price Analysis# #Altcoin Season# #BNBChain# #ㅠㅆ
56
·
--
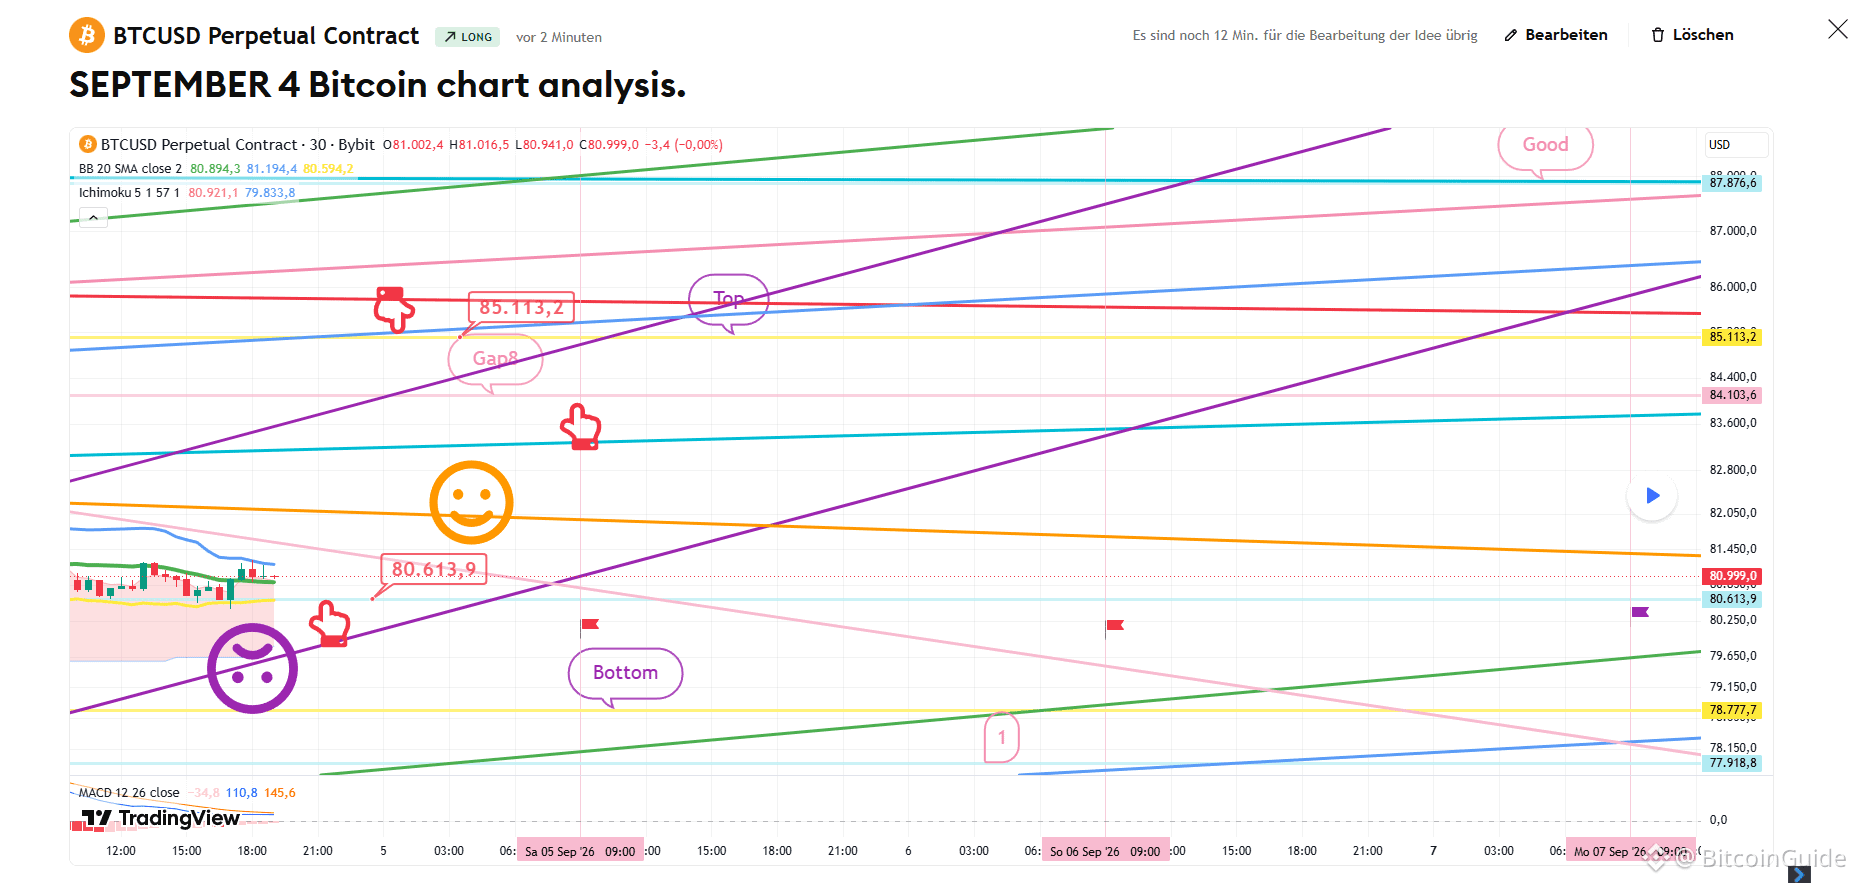
[September 4 Bitcoin chart analysis]
BTCUSD 30Min Chart
*My analysis is optimized for TradingView.
If you press the replay button, you can check real-time movements.
-Long position strategy-
*If the price follows the path indicated by the red arrow:
Long position strategy
1) Long entry zone: $80,613.9 / Stop-loss: If the purple support line is breached
2) 1st target: $85,113.2 -> 2nd target: The "Good" zone (valid through the weekend)
If the strategy succeeds, the "Gap 8" zone can be used for re-entering a long position.
- The "Good" zone is the most critical resistance level this month.
A strong breakout above this zone could lead to a powerful continuation of the uptrend.
If the purple support line is breached,
please be aware that the price could drop to the "Bottom" level
or as low as "Zone 1" (marked at the bottom).
The MACD on the 2-hour chart is currently showing a "dead cross,"
so please keep in mind that the price might move sideways today when managing your trades.
Please treat this analysis as a reference only.
I post the analysis results as a Comment every day.
Thank you.
(You can find the link on my profile.)
- Click Follow to receive faster information every day.
- Check the results using the replay button on TradingView.
#BTC100K #Macro Insights# #Altcoin Season# #BTCCharts# $USDT $TRX $BTC $ETH
[September 4 Bitcoin chart analysis]
BTCUSD 30Min Chart
*My analysis is optimized for TradingView.
If you press the replay button, you can check real-time movements.
-Long position strategy-
*If the price follows the path indicated by the red arrow:
Long position strategy
1) Long entry zone: $80,613.9 / Stop-loss: If the purple support line is breached
2) 1st target: $85,113.2 -> 2nd target: The "Good" zone (valid through the weekend)
If the strategy succeeds, the "Gap 8" zone can be used for re-entering a long position.
- The "Good" zone is the most critical resistance level this month.
A strong breakout above this zone could lead to a powerful continuation of the uptrend.
If the purple support line is breached,
please be aware that the price could drop to the "Bottom" level
or as low as "Zone 1" (marked at the bottom).
The MACD on the 2-hour chart is currently showing a "dead cross,"
so please keep in mind that the price might move sideways today when managing your trades.
Please treat this analysis as a reference only.
I post the analysis results as a Comment every day.
Thank you.
(You can find the link on my profile.)
- Click Follow to receive faster information every day.
- Check the results using the replay button on TradingView.
#BTC100K #Macro Insights# #Altcoin Season# #BTCCharts# $USDT $TRX $BTC $ETH
BTCUSD 30Min Chart
*My analysis is optimized for TradingView.
If you press the replay button, you can check real-time movements.
-Long position strategy-
*If the price follows the path indicated by the red arrow:
Long position strategy
1) Long entry zone: $80,613.9 / Stop-loss: If the purple support line is breached
2) 1st target: $85,113.2 -> 2nd target: The "Good" zone (valid through the weekend)
If the strategy succeeds, the "Gap 8" zone can be used for re-entering a long position.
- The "Good" zone is the most critical resistance level this month.
A strong breakout above this zone could lead to a powerful continuation of the uptrend.
If the purple support line is breached,
please be aware that the price could drop to the "Bottom" level
or as low as "Zone 1" (marked at the bottom).
The MACD on the 2-hour chart is currently showing a "dead cross,"
so please keep in mind that the price might move sideways today when managing your trades.
Please treat this analysis as a reference only.
I post the analysis results as a Comment every day.
Thank you.
(You can find the link on my profile.)
- Click Follow to receive faster information every day.
- Check the results using the replay button on TradingView.
#BTC100K #Macro Insights# #Altcoin Season# #BTCCharts# $USDT $TRX $BTC $ETH
68
·
--
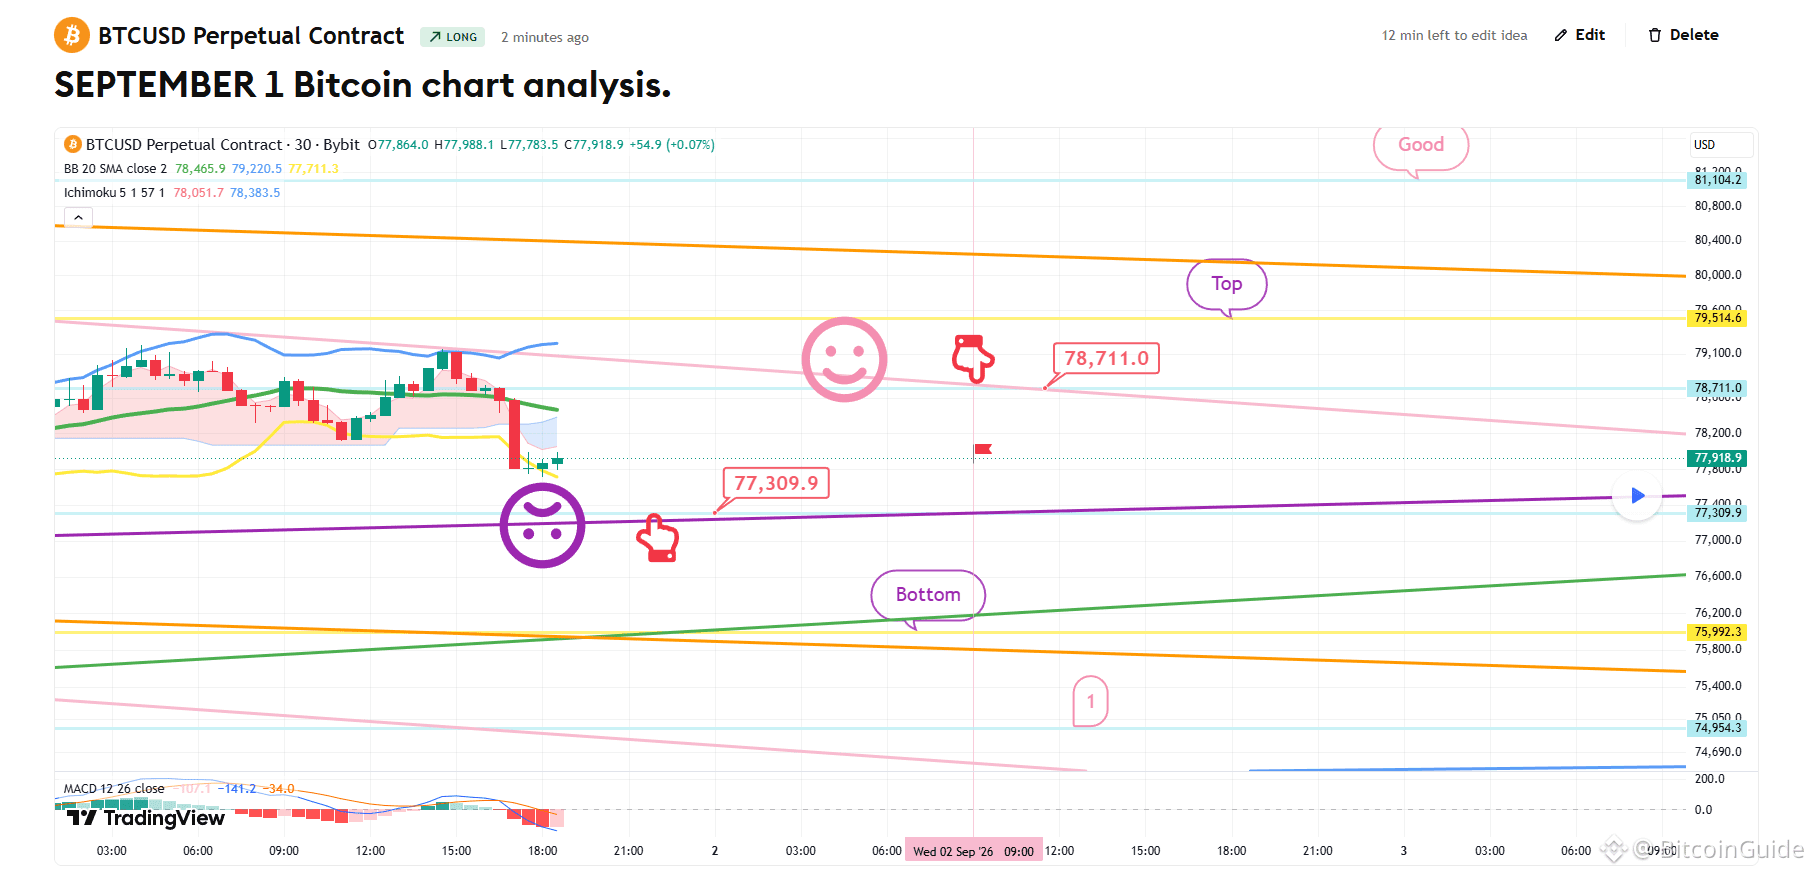
[SEPTEMBER 1 Bitcoin chart analysis]
BTCUSD 30Min Chart
*My analysis is optimized for TradingView.
If you press the replay button, you can check real-time movements.
-Long position strategy-
This is the Bitcoin 30-minute chart.
A MACD Dead Cross is currently in progress on the daily chart.
Caution is required as this position has the potential for a sharp decline.
I have developed a strategy based on a sideways market that maintains the channel.
*Long Position Strategy based on the movement path of the red finger
1) Entry point for the long position at $77,309.9 / Stop loss if the purple support line is broken
2) 1st target for the long position at $78,711 -> Target prices in the order of Top, Good
While the overall trend suggests the Bottom zone is likely,
I proceeded with the strategy based on the Nasdaq's movements.
If the Bottom is broken, the possibility of reaching Zone 1 remains open.
I post the analysis results as a Comment every day.
Thank you.
(You can find the link on my profile.)
- Click Follow to receive faster information every day.
- Check the results using the replay button on TradingView.
#BTC Price Analysis# #Altcoin Season# #BTC100K #XRP $ETH $USDT $BTC $GOLD
[SEPTEMBER 1 Bitcoin chart analysis]
BTCUSD 30Min Chart
*My analysis is optimized for TradingView.
If you press the replay button, you can check real-time movements.
-Long position strategy-
This is the Bitcoin 30-minute chart.
A MACD Dead Cross is currently in progress on the daily chart.
Caution is required as this position has the potential for a sharp decline.
I have developed a strategy based on a sideways market that maintains the channel.
*Long Position Strategy based on the movement path of the red finger
1) Entry point for the long position at $77,309.9 / Stop loss if the purple support line is broken
2) 1st target for the long position at $78,711 -> Target prices in the order of Top, Good
While the overall trend suggests the Bottom zone is likely,
I proceeded with the strategy based on the Nasdaq's movements.
If the Bottom is broken, the possibility of reaching Zone 1 remains open.
I post the analysis results as a Comment every day.
Thank you.
(You can find the link on my profile.)
- Click Follow to receive faster information every day.
- Check the results using the replay button on TradingView.
#BTC Price Analysis# #Altcoin Season# #BTC100K #XRP $ETH $USDT $BTC $GOLD
BTCUSD 30Min Chart
*My analysis is optimized for TradingView.
If you press the replay button, you can check real-time movements.
-Long position strategy-
This is the Bitcoin 30-minute chart.
A MACD Dead Cross is currently in progress on the daily chart.
Caution is required as this position has the potential for a sharp decline.
I have developed a strategy based on a sideways market that maintains the channel.
*Long Position Strategy based on the movement path of the red finger
1) Entry point for the long position at $77,309.9 / Stop loss if the purple support line is broken
2) 1st target for the long position at $78,711 -> Target prices in the order of Top, Good
While the overall trend suggests the Bottom zone is likely,
I proceeded with the strategy based on the Nasdaq's movements.
If the Bottom is broken, the possibility of reaching Zone 1 remains open.
I post the analysis results as a Comment every day.
Thank you.
(You can find the link on my profile.)
- Click Follow to receive faster information every day.
- Check the results using the replay button on TradingView.
#BTC Price Analysis# #Altcoin Season# #BTC100K #XRP $ETH $USDT $BTC $GOLD
79
·
--
[August 28 Bitcoin chart analysis]
BTCUSD 30Min Chart
*My analysis is optimized for TradingView.
If you press the replay button, you can check real-time movements.
-Long position strategy-
This is the Bitcoin 30-minute chart.
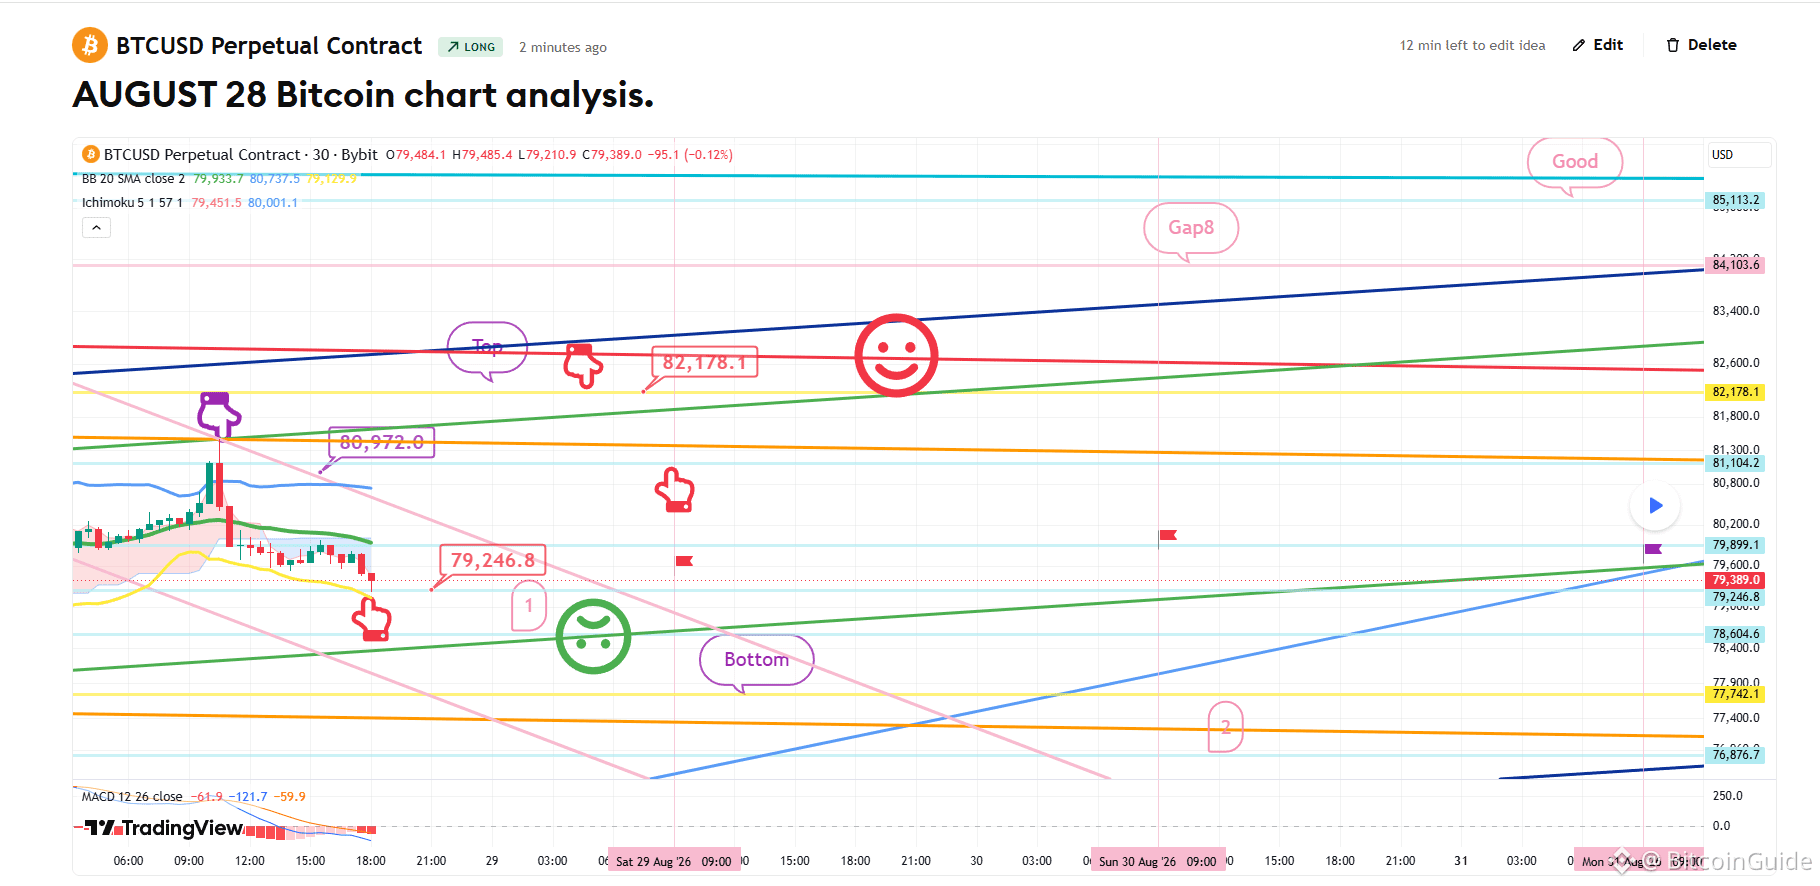
In the top left corner, I connected the last short position entry point at $80,792 with the purple finger.
The reason the correction is stronger than expected following the previous high renewal is that the mid-term pattern was broken as it touched the center line of the 6-hour Bollinger Bands on the 26th, which I explained last time.
Since the correction is strong, I assumed some of you may have quickly switched to long positions, so I operated aggressively.
*Chase buy and long position strategy when following the red finger's movement path.
1) $79,246.8 Long position entry point / Stop loss if the green support line is broken.
It could fall to zone 1 below, which I consider the safest entry point for a long position. 2) $82,178.1 Long Position 1st Target -> Target price in the maximum "Good" zone during the weekend
If the strategy is successful, the red finger at $80.9K is the zone to utilize for re-entry into the long position.
Please be cautious, as the bottom line (Bottom) opens up to zone 2 once it breaks below the green support line.
I post the analysis results as a Comment every day.
Thank you.
(You can find the link on my profile.)
- Click Follow to receive faster information every day.
- Check the results using the replay button on TradingView.
#BTC100K #Altcoin Season# #BTC Price Analysis# #Crypto $USDT $BTC $ETH $XRP
[August 28 Bitcoin chart analysis]
BTCUSD 30Min Chart
*My analysis is optimized for TradingView.
If you press the replay button, you can check real-time movements.
-Long position strategy-
This is the Bitcoin 30-minute chart.
In the top left corner, I connected the last short position entry point at $80,792 with the purple finger.
The reason the correction is stronger than expected following the previous high renewal is that the mid-term pattern was broken as it touched the center line of the 6-hour Bollinger Bands on the 26th, which I explained last time.
Since the correction is strong, I assumed some of you may have quickly switched to long positions, so I operated aggressively.
*Chase buy and long position strategy when following the red finger's movement path.
1) $79,246.8 Long position entry point / Stop loss if the green support line is broken.
It could fall to zone 1 below, which I consider the safest entry point for a long position. 2) $82,178.1 Long Position 1st Target -> Target price in the maximum "Good" zone during the weekend
If the strategy is successful, the red finger at $80.9K is the zone to utilize for re-entry into the long position.
Please be cautious, as the bottom line (Bottom) opens up to zone 2 once it breaks below the green support line.
I post the analysis results as a Comment every day.
Thank you.
(You can find the link on my profile.)
- Click Follow to receive faster information every day.
- Check the results using the replay button on TradingView.
#BTC100K #Altcoin Season# #BTC Price Analysis# #Crypto $USDT $BTC $ETH $XRP
BTCUSD 30Min Chart
*My analysis is optimized for TradingView.
If you press the replay button, you can check real-time movements.
-Long position strategy-
This is the Bitcoin 30-minute chart.
In the top left corner, I connected the last short position entry point at $80,792 with the purple finger.
The reason the correction is stronger than expected following the previous high renewal is that the mid-term pattern was broken as it touched the center line of the 6-hour Bollinger Bands on the 26th, which I explained last time.
Since the correction is strong, I assumed some of you may have quickly switched to long positions, so I operated aggressively.
*Chase buy and long position strategy when following the red finger's movement path.
1) $79,246.8 Long position entry point / Stop loss if the green support line is broken.
It could fall to zone 1 below, which I consider the safest entry point for a long position. 2) $82,178.1 Long Position 1st Target -> Target price in the maximum "Good" zone during the weekend
If the strategy is successful, the red finger at $80.9K is the zone to utilize for re-entry into the long position.
Please be cautious, as the bottom line (Bottom) opens up to zone 2 once it breaks below the green support line.
I post the analysis results as a Comment every day.
Thank you.
(You can find the link on my profile.)
- Click Follow to receive faster information every day.
- Check the results using the replay button on TradingView.
#BTC100K #Altcoin Season# #BTC Price Analysis# #Crypto $USDT $BTC $ETH $XRP
64
·
--
[August 26 Bitcoin chart analysis]
BTCUSD 30Min Chart
*My analysis is optimized for TradingView.
If you press the replay button, you can check real-time movements.
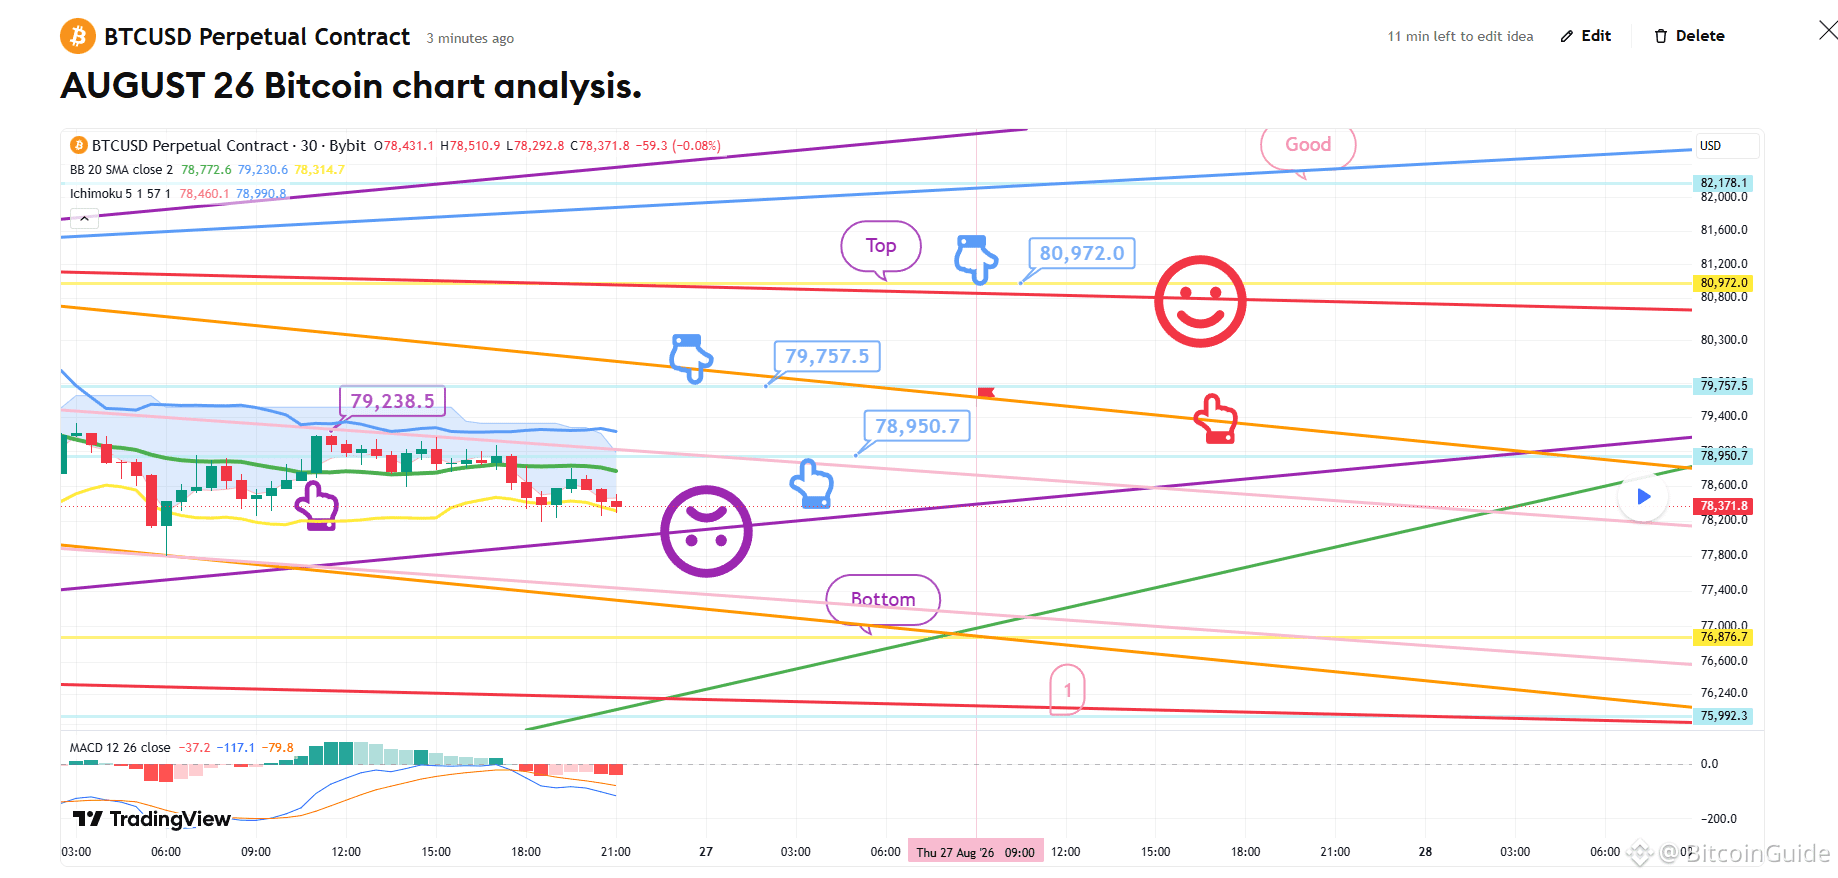
-On the left, marked by the purple finger, I have connected the strategy exactly as it was at the entry point of the long position entered on the 25th, 79.2K.
A MACD Dead Cross is currently in progress on the 12-hour chart.
*Based on the movement path of the light blue finger:
Short -> Long -> Short Two-way Neutral Strategy
1) Short position entry point at $79,757.5 / Stop loss upon breakout of the orange resistance line
2) Switch to long position at $78,950.7 / Stop loss upon breakout of the purple support line
(Same stop loss applies to those maintaining the long position at 79.2K)
3) Switch to short position at $80,972 / Stop loss upon breakout of the red resistance line
This is the zone to utilize for re-entering the long position at 79.7K from tomorrow onwards.
- If the price reaches the "Good" zone today,
you do not need to operate a short position,
and there is a very high possibility of sideways movement today.
Please exercise caution, as a break below the purple support line could lead to a decline to the bottom -> up to Zone 1.
I post the analysis results as a Comment every day.
Thank you.
(You can find the link on my profile.)
- Click Follow to receive faster information every day.
- Check the results using the replay button on TradingView.
#BTC100K #Altcoin Season# #ETH #BTC Price Analysis# $CRYPTO $GOLD $XRP $BTC
[August 26 Bitcoin chart analysis]
BTCUSD 30Min Chart
*My analysis is optimized for TradingView.
If you press the replay button, you can check real-time movements.
-On the left, marked by the purple finger, I have connected the strategy exactly as it was at the entry point of the long position entered on the 25th, 79.2K.
A MACD Dead Cross is currently in progress on the 12-hour chart.
*Based on the movement path of the light blue finger:
Short -> Long -> Short Two-way Neutral Strategy
1) Short position entry point at $79,757.5 / Stop loss upon breakout of the orange resistance line
2) Switch to long position at $78,950.7 / Stop loss upon breakout of the purple support line
(Same stop loss applies to those maintaining the long position at 79.2K)
3) Switch to short position at $80,972 / Stop loss upon breakout of the red resistance line
This is the zone to utilize for re-entering the long position at 79.7K from tomorrow onwards.
- If the price reaches the "Good" zone today,
you do not need to operate a short position,
and there is a very high possibility of sideways movement today.
Please exercise caution, as a break below the purple support line could lead to a decline to the bottom -> up to Zone 1.
I post the analysis results as a Comment every day.
Thank you.
(You can find the link on my profile.)
- Click Follow to receive faster information every day.
- Check the results using the replay button on TradingView.
#BTC100K #Altcoin Season# #ETH #BTC Price Analysis# $CRYPTO $GOLD $XRP $BTC
BTCUSD 30Min Chart
*My analysis is optimized for TradingView.
If you press the replay button, you can check real-time movements.
-On the left, marked by the purple finger, I have connected the strategy exactly as it was at the entry point of the long position entered on the 25th, 79.2K.
A MACD Dead Cross is currently in progress on the 12-hour chart.
*Based on the movement path of the light blue finger:
Short -> Long -> Short Two-way Neutral Strategy
1) Short position entry point at $79,757.5 / Stop loss upon breakout of the orange resistance line
2) Switch to long position at $78,950.7 / Stop loss upon breakout of the purple support line
(Same stop loss applies to those maintaining the long position at 79.2K)
3) Switch to short position at $80,972 / Stop loss upon breakout of the red resistance line
This is the zone to utilize for re-entering the long position at 79.7K from tomorrow onwards.
- If the price reaches the "Good" zone today,
you do not need to operate a short position,
and there is a very high possibility of sideways movement today.
Please exercise caution, as a break below the purple support line could lead to a decline to the bottom -> up to Zone 1.
I post the analysis results as a Comment every day.
Thank you.
(You can find the link on my profile.)
- Click Follow to receive faster information every day.
- Check the results using the replay button on TradingView.
#BTC100K #Altcoin Season# #ETH #BTC Price Analysis# $CRYPTO $GOLD $XRP $BTC
71
·
--
[August 25 Bitcoin chart analysis]
BTCUSD 30Min Chart
*My analysis is optimized for TradingView.
If you press the replay button, you can check real-time movements.
-Long position strategy-
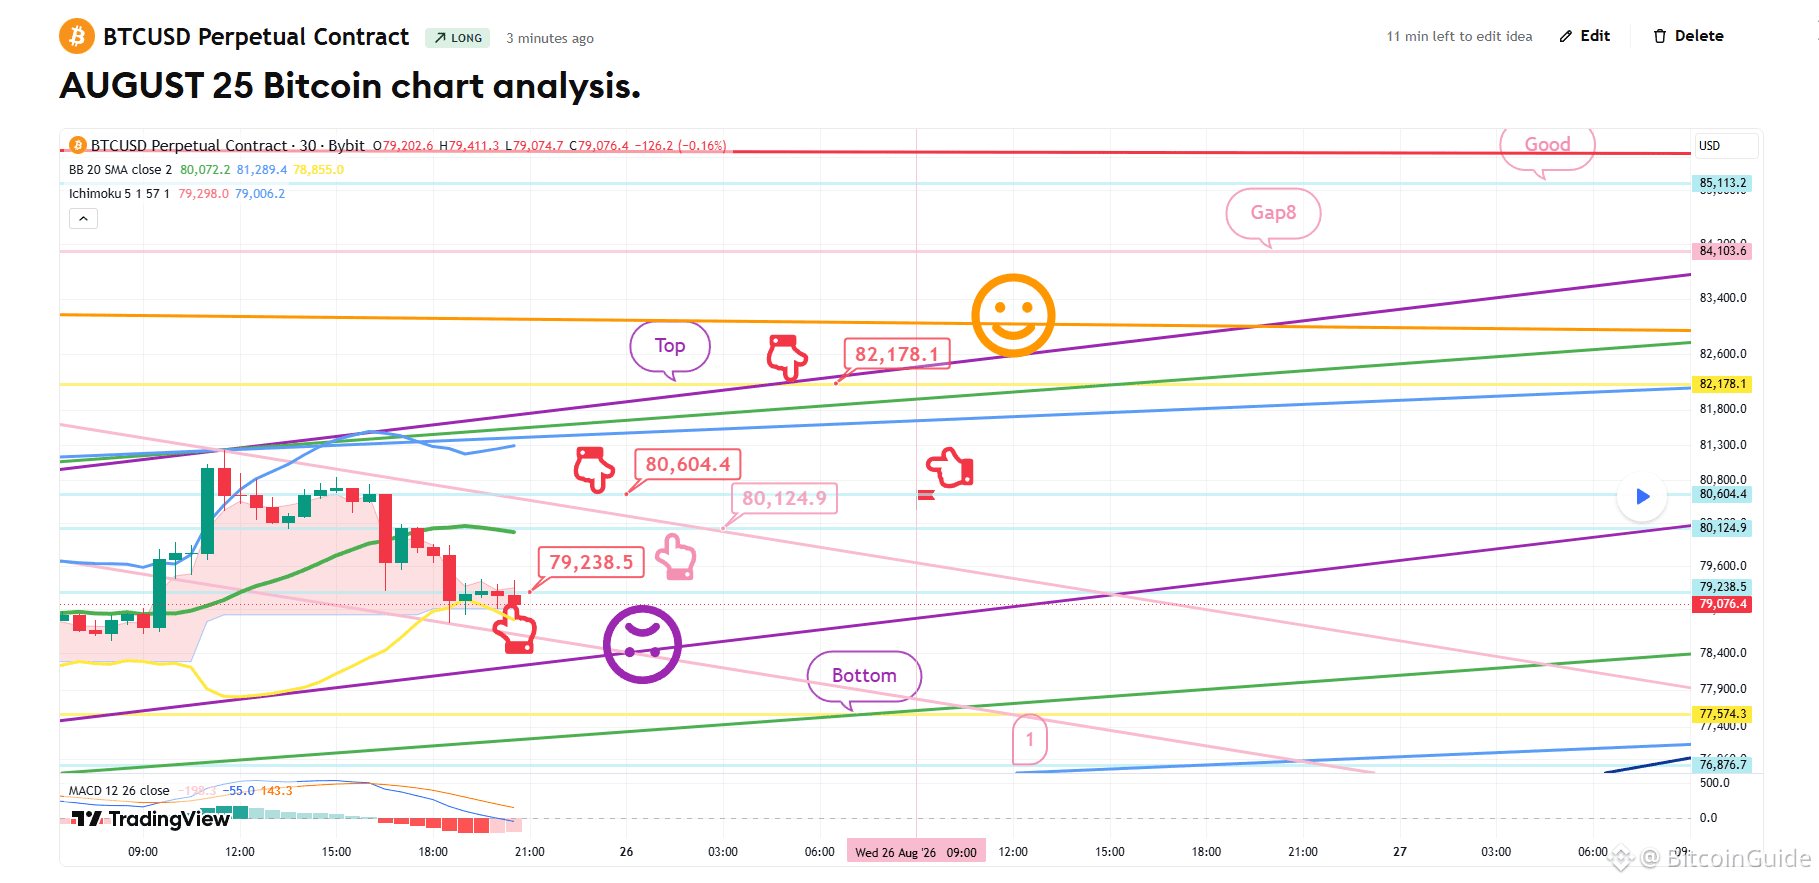
This is the Bitcoin 30-minute chart.
There is a Nasdaq indicator release at 11:00.
*Long Position Strategy based on the movement path of the red finger
1) Buy at $79,238.5 / Stop loss if broken below the purple support line
2) 1st target for the long position at the $82,178.1 Top zone -> Target prices in order of Gap 8 and Good
- If broken below the purple support line
Please be careful as the price could fall to the Bottom zone indicated at the bottom -> up to zone 1.
I post the analysis results as a Comment every day.
Thank you.
(You can find the link on my profile.)
- Click Follow to receive faster information every day.
- Check the results using the replay button on TradingView.
#BTC Price Analysis# #Altcoin Season# #Bitcoin #Crypto# $XRP $ETH $BTC $USDT
[August 25 Bitcoin chart analysis]
BTCUSD 30Min Chart
*My analysis is optimized for TradingView.
If you press the replay button, you can check real-time movements.
-Long position strategy-
This is the Bitcoin 30-minute chart.
There is a Nasdaq indicator release at 11:00.
*Long Position Strategy based on the movement path of the red finger
1) Buy at $79,238.5 / Stop loss if broken below the purple support line
2) 1st target for the long position at the $82,178.1 Top zone -> Target prices in order of Gap 8 and Good
- If broken below the purple support line
Please be careful as the price could fall to the Bottom zone indicated at the bottom -> up to zone 1.
I post the analysis results as a Comment every day.
Thank you.
(You can find the link on my profile.)
- Click Follow to receive faster information every day.
- Check the results using the replay button on TradingView.
#BTC Price Analysis# #Altcoin Season# #Bitcoin #Crypto# $XRP $ETH $BTC $USDT
BTCUSD 30Min Chart
*My analysis is optimized for TradingView.
If you press the replay button, you can check real-time movements.
-Long position strategy-
This is the Bitcoin 30-minute chart.
There is a Nasdaq indicator release at 11:00.
*Long Position Strategy based on the movement path of the red finger
1) Buy at $79,238.5 / Stop loss if broken below the purple support line
2) 1st target for the long position at the $82,178.1 Top zone -> Target prices in order of Gap 8 and Good
- If broken below the purple support line
Please be careful as the price could fall to the Bottom zone indicated at the bottom -> up to zone 1.
I post the analysis results as a Comment every day.
Thank you.
(You can find the link on my profile.)
- Click Follow to receive faster information every day.
- Check the results using the replay button on TradingView.
#BTC Price Analysis# #Altcoin Season# #Bitcoin #Crypto# $XRP $ETH $BTC $USDT
93
·
--
[August 13 Bitcoin chart analysis]
BTCUSD 30Min Chart
*My analysis is optimized for TradingView.
If you press the replay button, you can check real-time movements.
-Long position strategy-
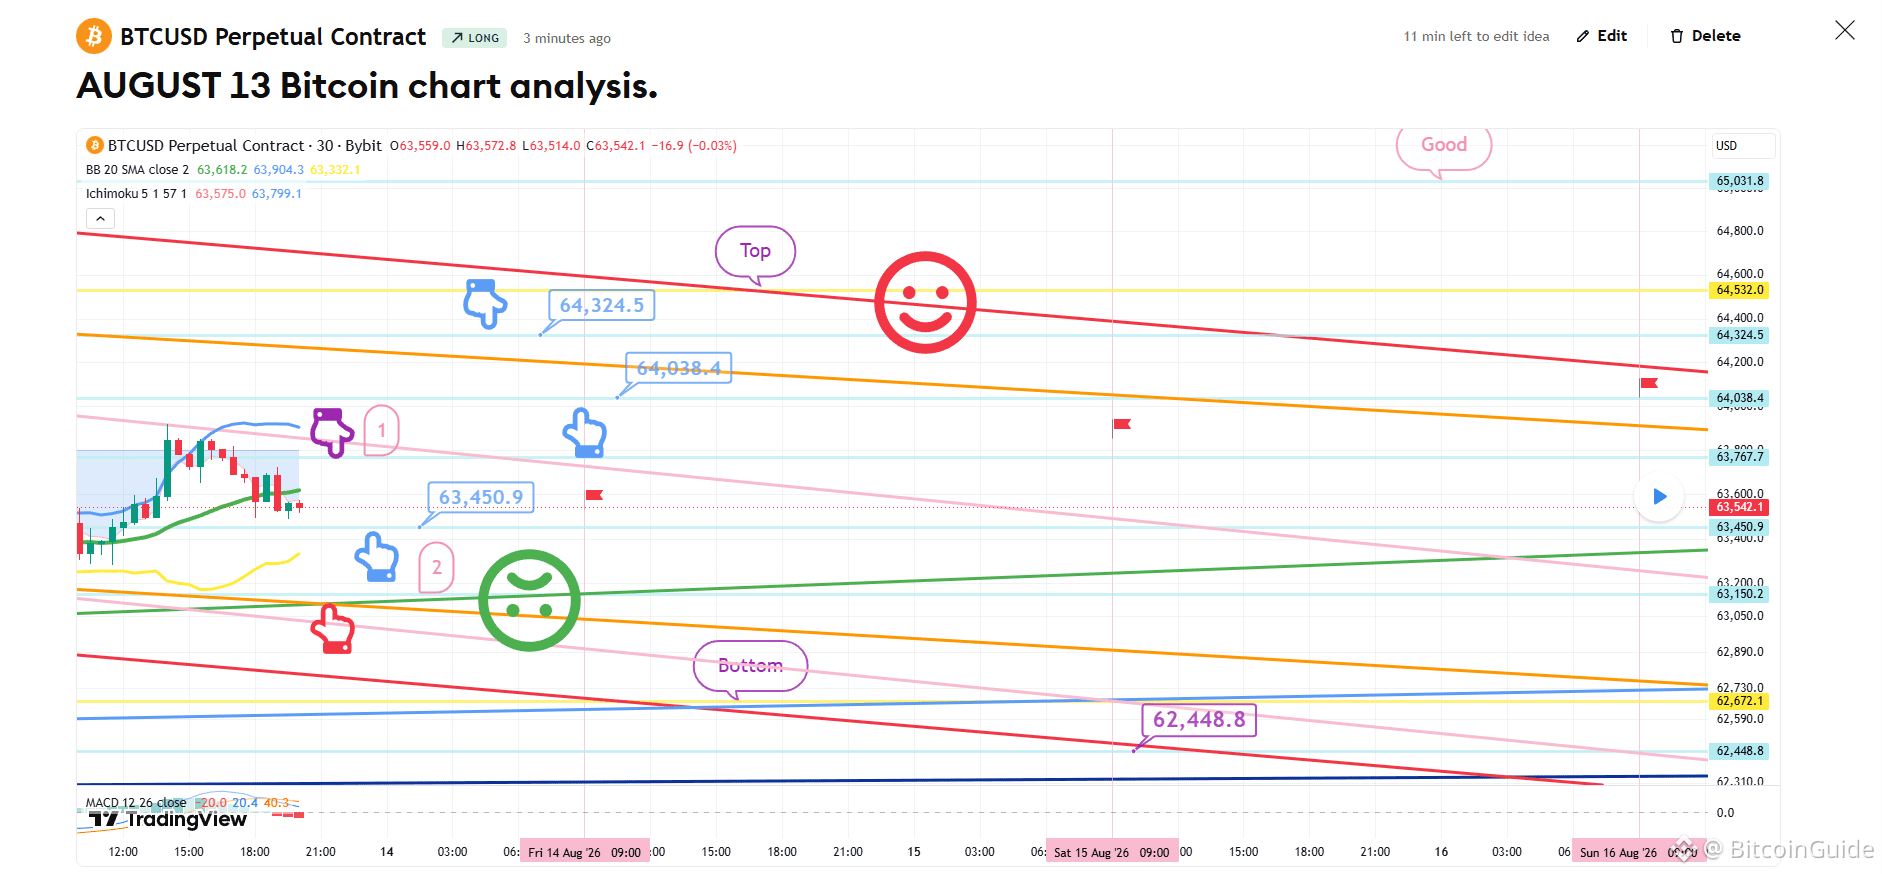
As for the Nasdaq, due to the MACD dead cross on the 12-hour chart,
it appears highly likely that it will trade sideways until tomorrow.
*Long Position Strategy (Around the time of the purple finger touch 1 at the top)
1) After confirming the touch of $63.7K in the purple finger zone 1,
the entry point for the long position is $63,450.9 (light blue finger) / Stop loss if the green support line is broken.
2) $64,324.5 is the first target for the long position -> Target prices in the order of Top, Good.
- If the target price of $64.3K is reached, use the $64,038.4 range to re-enter the long position.
3) If the price fails to touch zone 1 and drops immediately:
The entry point for the long position is $63,150.2 in the red finger zone 2 at the bottom / Stop loss if the green support line is broken -> Remaining target prices remain the same.
- The Bottom zone at the bottom is a mid-term uptrend line, so
it is not advisable if it breaks, as further declines could occur.
The limit is open up to a maximum of $62,448.8.
Please use my analysis posts merely as a reference and for practical purposes.
I hope you operate safely by strictly adhering to trading principles and stop-loss orders.
I post the analysis results as a Comment every day.
Thank you.
(You can find the link on my profile.)
- Click Follow to receive faster information every day.
- Check the results using the replay button on TradingView.
#Crypto #BTC100K #Altcoin Season# #BTC Price Analysis# $ETH $USDT $BTC $USDT
[August 13 Bitcoin chart analysis]
BTCUSD 30Min Chart
*My analysis is optimized for TradingView.
If you press the replay button, you can check real-time movements.
-Long position strategy-
As for the Nasdaq, due to the MACD dead cross on the 12-hour chart,
it appears highly likely that it will trade sideways until tomorrow.
*Long Position Strategy (Around the time of the purple finger touch 1 at the top)
1) After confirming the touch of $63.7K in the purple finger zone 1,
the entry point for the long position is $63,450.9 (light blue finger) / Stop loss if the green support line is broken.
2) $64,324.5 is the first target for the long position -> Target prices in the order of Top, Good.
- If the target price of $64.3K is reached, use the $64,038.4 range to re-enter the long position.
3) If the price fails to touch zone 1 and drops immediately:
The entry point for the long position is $63,150.2 in the red finger zone 2 at the bottom / Stop loss if the green support line is broken -> Remaining target prices remain the same.
- The Bottom zone at the bottom is a mid-term uptrend line, so
it is not advisable if it breaks, as further declines could occur.
The limit is open up to a maximum of $62,448.8.
Please use my analysis posts merely as a reference and for practical purposes.
I hope you operate safely by strictly adhering to trading principles and stop-loss orders.
I post the analysis results as a Comment every day.
Thank you.
(You can find the link on my profile.)
- Click Follow to receive faster information every day.
- Check the results using the replay button on TradingView.
#Crypto #BTC100K #Altcoin Season# #BTC Price Analysis# $ETH $USDT $BTC $USDT
BTCUSD 30Min Chart
*My analysis is optimized for TradingView.
If you press the replay button, you can check real-time movements.
-Long position strategy-
As for the Nasdaq, due to the MACD dead cross on the 12-hour chart,
it appears highly likely that it will trade sideways until tomorrow.
*Long Position Strategy (Around the time of the purple finger touch 1 at the top)
1) After confirming the touch of $63.7K in the purple finger zone 1,
the entry point for the long position is $63,450.9 (light blue finger) / Stop loss if the green support line is broken.
2) $64,324.5 is the first target for the long position -> Target prices in the order of Top, Good.
- If the target price of $64.3K is reached, use the $64,038.4 range to re-enter the long position.
3) If the price fails to touch zone 1 and drops immediately:
The entry point for the long position is $63,150.2 in the red finger zone 2 at the bottom / Stop loss if the green support line is broken -> Remaining target prices remain the same.
- The Bottom zone at the bottom is a mid-term uptrend line, so
it is not advisable if it breaks, as further declines could occur.
The limit is open up to a maximum of $62,448.8.
Please use my analysis posts merely as a reference and for practical purposes.
I hope you operate safely by strictly adhering to trading principles and stop-loss orders.
I post the analysis results as a Comment every day.
Thank you.
(You can find the link on my profile.)
- Click Follow to receive faster information every day.
- Check the results using the replay button on TradingView.
#Crypto #BTC100K #Altcoin Season# #BTC Price Analysis# $ETH $USDT $BTC $USDT
86
·
--
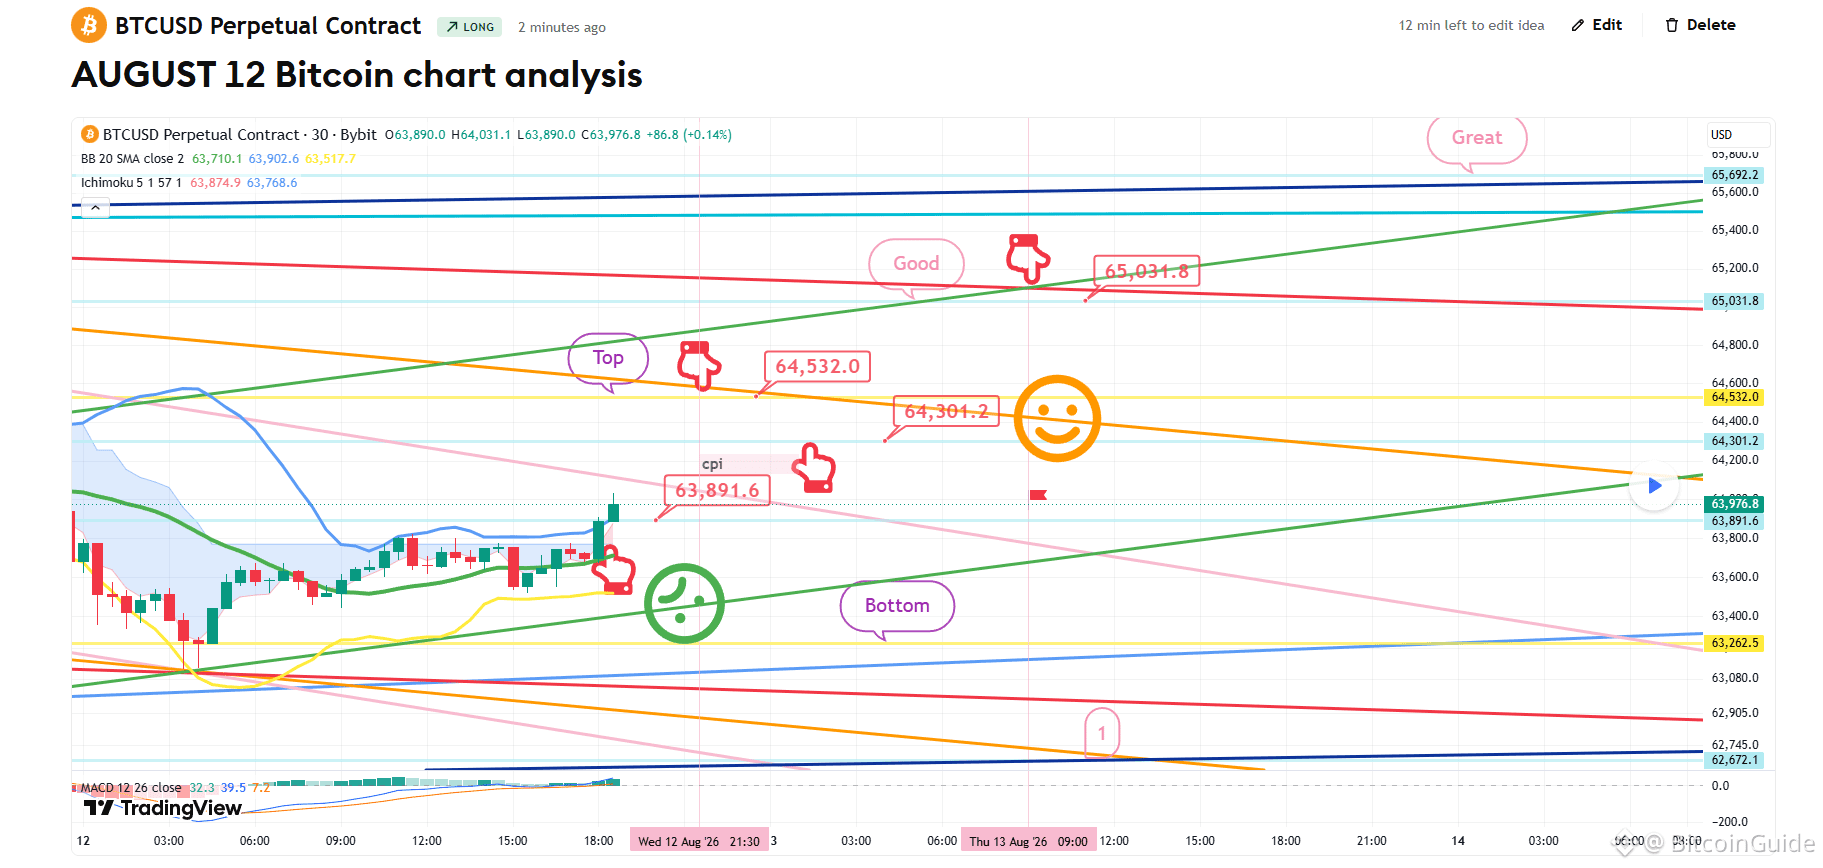
[August 12 Bitcoin chart analysis]
BTCUSD 30Min Chart
*My analysis is optimized for TradingView.
If you press the replay button, you can check real-time movements.
-Long position strategy-
The CPI indicator will be released shortly at 9:30.
*This is a long position strategy to chase the price following the movement path of the red finger.
1) Entry point for the long position at $63,891.6 / Stop loss if the green support line is broken.
2) 1st target for the long position at $64,532 -> Good 2nd target.
- If the strategy is successful, use the 64.3K range to re-enter the long position.
- Final target price for the Great range after tomorrow.
If the green support line is broken,
Please be careful as the bottom is open up to the 1st zone.
Given the recent participation rate and the hot weather, if a stop loss occurs today, I will take a break from posting analysis articles this week.
I post the analysis results as a Comment every day.
Thank you.
(You can find the link on my profile.)
- Click Follow to receive faster information every day.
- Check the results using the replay button on TradingView.
#BTC100K #Altcoin Season# #BTC Price Analysis# #BNBChain# $BTC $ETH $USDT $ALT $XRP
[August 12 Bitcoin chart analysis]
BTCUSD 30Min Chart
*My analysis is optimized for TradingView.
If you press the replay button, you can check real-time movements.
-Long position strategy-
The CPI indicator will be released shortly at 9:30.
*This is a long position strategy to chase the price following the movement path of the red finger.
1) Entry point for the long position at $63,891.6 / Stop loss if the green support line is broken.
2) 1st target for the long position at $64,532 -> Good 2nd target.
- If the strategy is successful, use the 64.3K range to re-enter the long position.
- Final target price for the Great range after tomorrow.
If the green support line is broken,
Please be careful as the bottom is open up to the 1st zone.
Given the recent participation rate and the hot weather, if a stop loss occurs today, I will take a break from posting analysis articles this week.
I post the analysis results as a Comment every day.
Thank you.
(You can find the link on my profile.)
- Click Follow to receive faster information every day.
- Check the results using the replay button on TradingView.
#BTC100K #Altcoin Season# #BTC Price Analysis# #BNBChain# $BTC $ETH $USDT $ALT $XRP
BTCUSD 30Min Chart
*My analysis is optimized for TradingView.
If you press the replay button, you can check real-time movements.
-Long position strategy-
The CPI indicator will be released shortly at 9:30.
*This is a long position strategy to chase the price following the movement path of the red finger.
1) Entry point for the long position at $63,891.6 / Stop loss if the green support line is broken.
2) 1st target for the long position at $64,532 -> Good 2nd target.
- If the strategy is successful, use the 64.3K range to re-enter the long position.
- Final target price for the Great range after tomorrow.
If the green support line is broken,
Please be careful as the bottom is open up to the 1st zone.
Given the recent participation rate and the hot weather, if a stop loss occurs today, I will take a break from posting analysis articles this week.
I post the analysis results as a Comment every day.
Thank you.
(You can find the link on my profile.)
- Click Follow to receive faster information every day.
- Check the results using the replay button on TradingView.
#BTC100K #Altcoin Season# #BTC Price Analysis# #BNBChain# $BTC $ETH $USDT $ALT $XRP
75
·
--
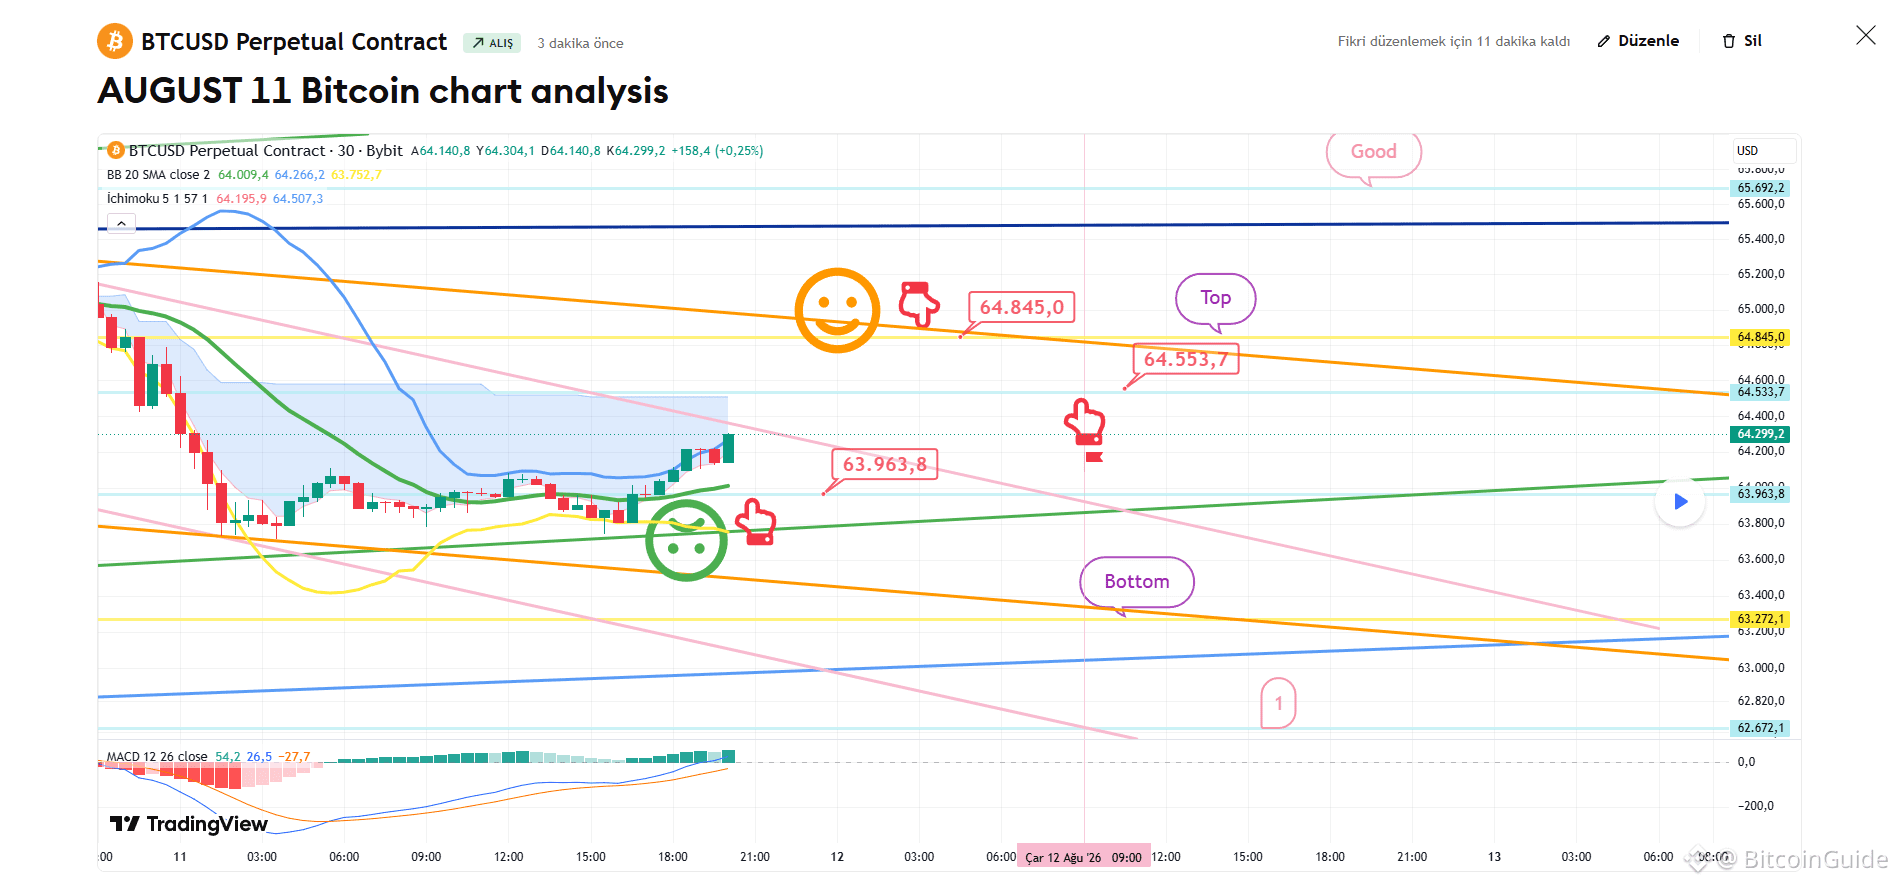
[August 11 Bitcoin chart analysis]
BTCUSD 30Min Chart
*My analysis is optimized for TradingView.
If you press the replay button, you can check real-time movements.
-Long position strategy-
Currently, a MACD Dead Cross is in progress on the 12-hour and daily charts.
From this point on, it is the optimal entry zone for a short position.
*This is a long position strategy when following the movement path indicated by the red finger.
1) $63,963.8 Long position entry zone / Stop loss if broken below the green support line
2) $64,845 Long position 1st target -> Good 2nd target
- If the strategy is successful, $64.5K serves as a re-entry zone for the long position.
- Once the "Good" zone is touched, the MACD Dead Cross on the daily chart is ignored.
Please be cautious, as the area below the green support line opens up to the Bottom -> up to Zone 1.
I post the analysis results as a Comment every day.
Thank you.
(You can find the link on my profile.)
- Click Follow to receive faster information every day.
- Check the results using the replay button on TradingView.
#BTC Price Analysis# #Crypto #Altcoin Season# #BTC100K $USDT $BTC $GOLD $XRP $ETH
[August 11 Bitcoin chart analysis]
BTCUSD 30Min Chart
*My analysis is optimized for TradingView.
If you press the replay button, you can check real-time movements.
-Long position strategy-
Currently, a MACD Dead Cross is in progress on the 12-hour and daily charts.
From this point on, it is the optimal entry zone for a short position.
*This is a long position strategy when following the movement path indicated by the red finger.
1) $63,963.8 Long position entry zone / Stop loss if broken below the green support line
2) $64,845 Long position 1st target -> Good 2nd target
- If the strategy is successful, $64.5K serves as a re-entry zone for the long position.
- Once the "Good" zone is touched, the MACD Dead Cross on the daily chart is ignored.
Please be cautious, as the area below the green support line opens up to the Bottom -> up to Zone 1.
I post the analysis results as a Comment every day.
Thank you.
(You can find the link on my profile.)
- Click Follow to receive faster information every day.
- Check the results using the replay button on TradingView.
#BTC Price Analysis# #Crypto #Altcoin Season# #BTC100K $USDT $BTC $GOLD $XRP $ETH
BTCUSD 30Min Chart
*My analysis is optimized for TradingView.
If you press the replay button, you can check real-time movements.
-Long position strategy-
Currently, a MACD Dead Cross is in progress on the 12-hour and daily charts.
From this point on, it is the optimal entry zone for a short position.
*This is a long position strategy when following the movement path indicated by the red finger.
1) $63,963.8 Long position entry zone / Stop loss if broken below the green support line
2) $64,845 Long position 1st target -> Good 2nd target
- If the strategy is successful, $64.5K serves as a re-entry zone for the long position.
- Once the "Good" zone is touched, the MACD Dead Cross on the daily chart is ignored.
Please be cautious, as the area below the green support line opens up to the Bottom -> up to Zone 1.
I post the analysis results as a Comment every day.
Thank you.
(You can find the link on my profile.)
- Click Follow to receive faster information every day.
- Check the results using the replay button on TradingView.
#BTC Price Analysis# #Crypto #Altcoin Season# #BTC100K $USDT $BTC $GOLD $XRP $ETH
72
·
--
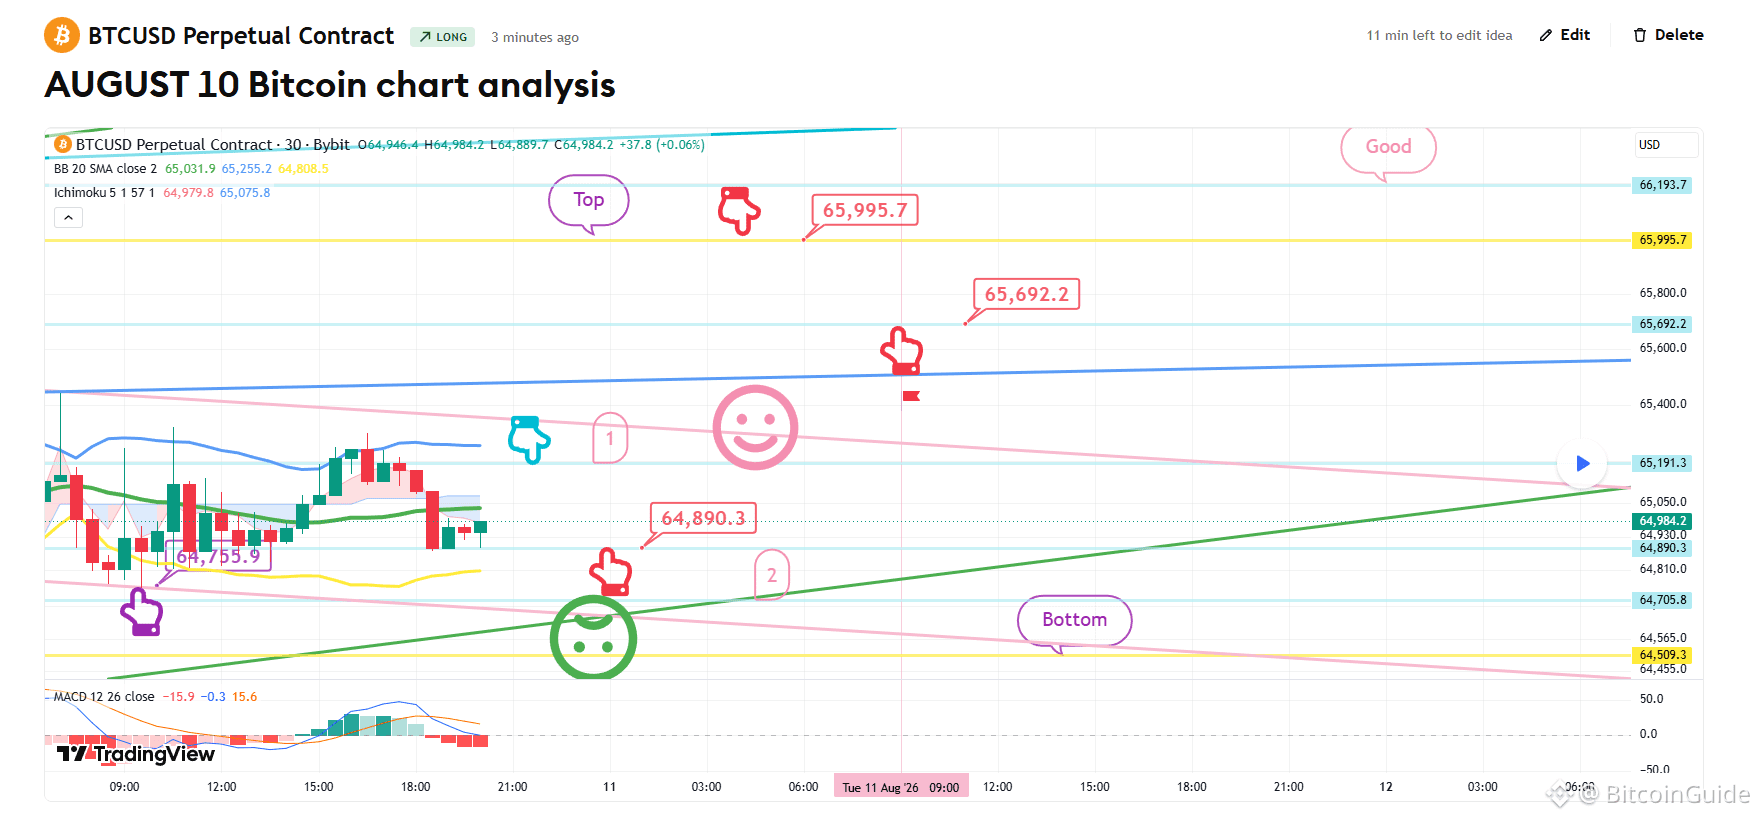
[August 10 Bitcoin chart analysis]
BTCUSD 30Min Chart
*My analysis is optimized for TradingView.
If you press the replay button, you can check real-time movements.
-Long position strategy-
In the bottom left, I have connected the strategy exactly to the entry point of 64.7K for the long position entered on August 7th, indicated by the purple finger.
*The long position strategy is shown before and after touching the teal zone number 1 at the top.
1) After confirming the touch of Zone 1 (Teal Finger), enter a short position.
/ Switch to a long position at $64,890.3 (Red Finger) / Stop loss if the green support line is broken.
2) $65,995.7 Long Position 1st Target -> Good 2nd Target Price.
- If the strategy is successful, use the 65.6K range to re-enter the long position.
3) If it drops immediately without touching Zone 1 at the top,
enter the long position at Zone 2 ($64,705.8) at the bottom.
/ Stop loss if the green support line is broken.
- Please be careful, as if the green support line is broken, it could fall to the Bottom zone at the bottom.
- Based on the pattern, it must rise immediately without touching Zone 2 to safely maintain the uptrend.
I post the analysis results as a Comment every day.
Thank you.
(You can find the link on my profile.)
- Click Follow to receive faster information every day.
- Check the results using the replay button on TradingView.
#Bitcoin #BTC100K #Crypto #Altcoin Season# $USDT $GOLD $QQQX $BTC
[August 10 Bitcoin chart analysis]
BTCUSD 30Min Chart
*My analysis is optimized for TradingView.
If you press the replay button, you can check real-time movements.
-Long position strategy-
In the bottom left, I have connected the strategy exactly to the entry point of 64.7K for the long position entered on August 7th, indicated by the purple finger.
*The long position strategy is shown before and after touching the teal zone number 1 at the top.
1) After confirming the touch of Zone 1 (Teal Finger), enter a short position.
/ Switch to a long position at $64,890.3 (Red Finger) / Stop loss if the green support line is broken.
2) $65,995.7 Long Position 1st Target -> Good 2nd Target Price.
- If the strategy is successful, use the 65.6K range to re-enter the long position.
3) If it drops immediately without touching Zone 1 at the top,
enter the long position at Zone 2 ($64,705.8) at the bottom.
/ Stop loss if the green support line is broken.
- Please be careful, as if the green support line is broken, it could fall to the Bottom zone at the bottom.
- Based on the pattern, it must rise immediately without touching Zone 2 to safely maintain the uptrend.
I post the analysis results as a Comment every day.
Thank you.
(You can find the link on my profile.)
- Click Follow to receive faster information every day.
- Check the results using the replay button on TradingView.
#Bitcoin #BTC100K #Crypto #Altcoin Season# $USDT $GOLD $QQQX $BTC
BTCUSD 30Min Chart
*My analysis is optimized for TradingView.
If you press the replay button, you can check real-time movements.
-Long position strategy-
In the bottom left, I have connected the strategy exactly to the entry point of 64.7K for the long position entered on August 7th, indicated by the purple finger.
*The long position strategy is shown before and after touching the teal zone number 1 at the top.
1) After confirming the touch of Zone 1 (Teal Finger), enter a short position.
/ Switch to a long position at $64,890.3 (Red Finger) / Stop loss if the green support line is broken.
2) $65,995.7 Long Position 1st Target -> Good 2nd Target Price.
- If the strategy is successful, use the 65.6K range to re-enter the long position.
3) If it drops immediately without touching Zone 1 at the top,
enter the long position at Zone 2 ($64,705.8) at the bottom.
/ Stop loss if the green support line is broken.
- Please be careful, as if the green support line is broken, it could fall to the Bottom zone at the bottom.
- Based on the pattern, it must rise immediately without touching Zone 2 to safely maintain the uptrend.
I post the analysis results as a Comment every day.
Thank you.
(You can find the link on my profile.)
- Click Follow to receive faster information every day.
- Check the results using the replay button on TradingView.
#Bitcoin #BTC100K #Crypto #Altcoin Season# $USDT $GOLD $QQQX $BTC
77
·
--
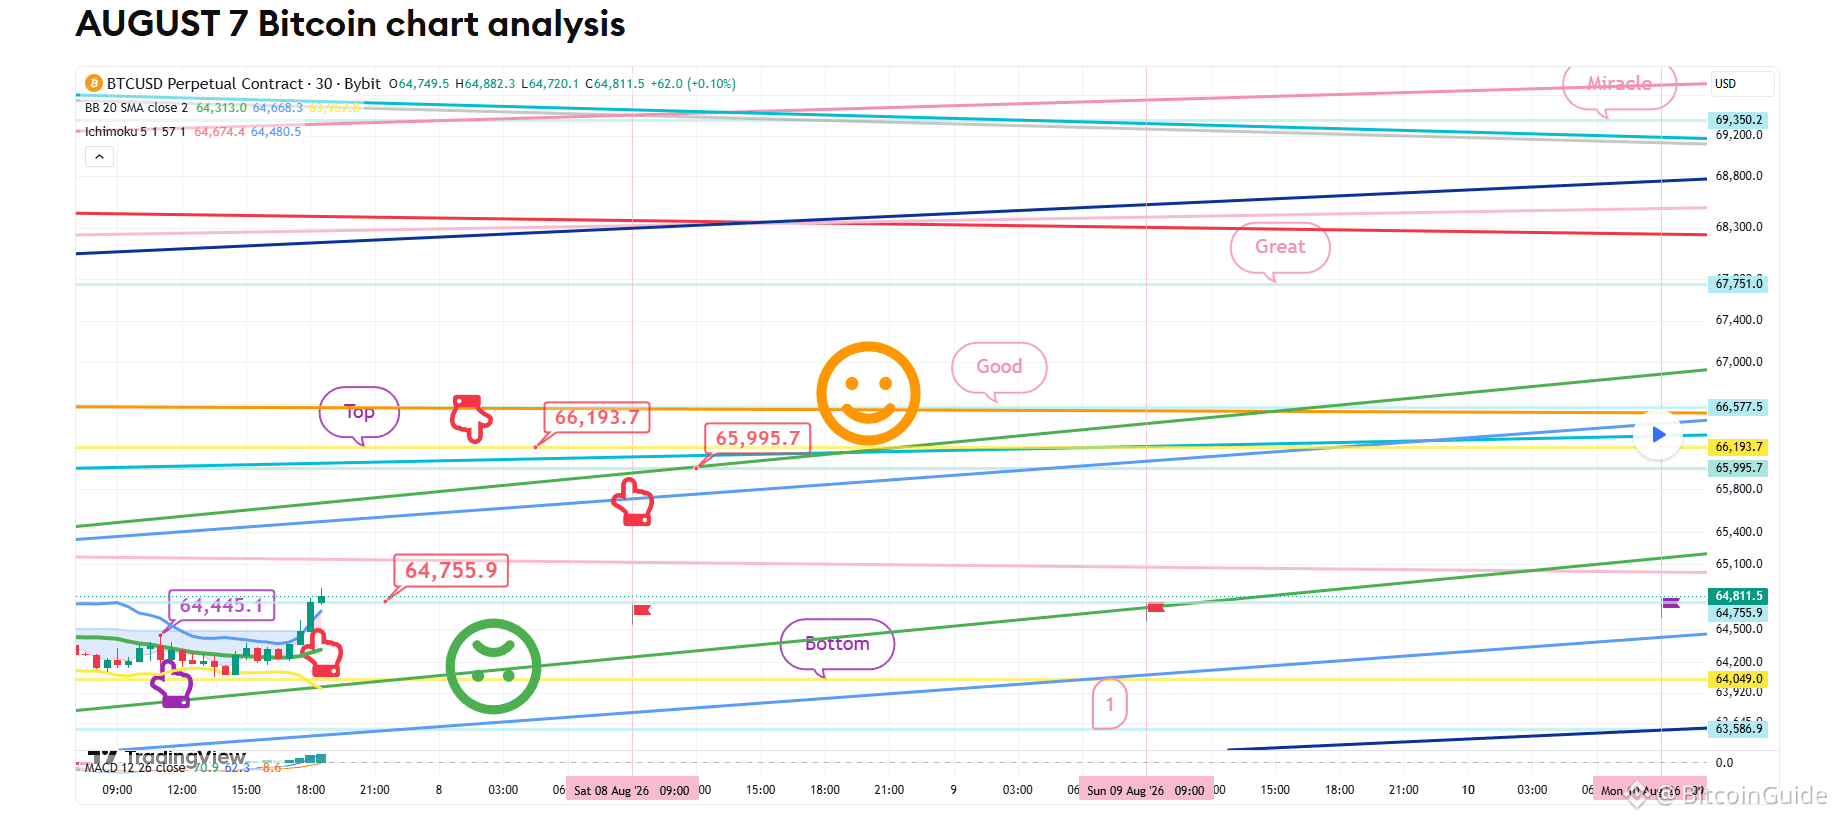
[August 7 Bitcoin chart analysis]
BTCUSD 30Min Chart
*My analysis is optimized for TradingView.
If you press the replay button, you can check real-time movements.
-Long position strategy-
*Chase buy long position strategy following the red finger's movement path
1) Chase buy at $64,755.9 / Stop loss if broken below the green support line
2) $66,193.7 long position 1st target -> Miracle final target price by the weekend
- If it breaks through the Miracle level, an uptrend will begin starting next week.
- For those maintaining long positions at 64.4K, the green support line stop loss remains the same.
- 65.9K is a zone to utilize for re-entering long positions.
From the point of breaking below the green support line, the price may fall to the Bottom -> Zone 1 indicated at the bottom.
I post the analysis results as a Comment every day.
Thank you.
(You can find the link on my profile.)
- Click Follow to receive faster information every day.
- Check the results using the replay button on TradingView.
#Bitcoin #BTC100K #BTC Price Analysis# #Crypto $ALT $USDT $BTC $XRP $ETH
[August 7 Bitcoin chart analysis]
BTCUSD 30Min Chart
*My analysis is optimized for TradingView.
If you press the replay button, you can check real-time movements.
-Long position strategy-
*Chase buy long position strategy following the red finger's movement path
1) Chase buy at $64,755.9 / Stop loss if broken below the green support line
2) $66,193.7 long position 1st target -> Miracle final target price by the weekend
- If it breaks through the Miracle level, an uptrend will begin starting next week.
- For those maintaining long positions at 64.4K, the green support line stop loss remains the same.
- 65.9K is a zone to utilize for re-entering long positions.
From the point of breaking below the green support line, the price may fall to the Bottom -> Zone 1 indicated at the bottom.
I post the analysis results as a Comment every day.
Thank you.
(You can find the link on my profile.)
- Click Follow to receive faster information every day.
- Check the results using the replay button on TradingView.
#Bitcoin #BTC100K #BTC Price Analysis# #Crypto $ALT $USDT $BTC $XRP $ETH
BTCUSD 30Min Chart
*My analysis is optimized for TradingView.
If you press the replay button, you can check real-time movements.
-Long position strategy-
*Chase buy long position strategy following the red finger's movement path
1) Chase buy at $64,755.9 / Stop loss if broken below the green support line
2) $66,193.7 long position 1st target -> Miracle final target price by the weekend
- If it breaks through the Miracle level, an uptrend will begin starting next week.
- For those maintaining long positions at 64.4K, the green support line stop loss remains the same.
- 65.9K is a zone to utilize for re-entering long positions.
From the point of breaking below the green support line, the price may fall to the Bottom -> Zone 1 indicated at the bottom.
I post the analysis results as a Comment every day.
Thank you.
(You can find the link on my profile.)
- Click Follow to receive faster information every day.
- Check the results using the replay button on TradingView.
#Bitcoin #BTC100K #BTC Price Analysis# #Crypto $ALT $USDT $BTC $XRP $ETH
70
·
--
[August 6 Bitcoin chart analysis]
BTCUSD 30Min Chart
*My analysis is optimized for TradingView.
If you press the replay button, you can check real-time movements.
-Long position strategy-
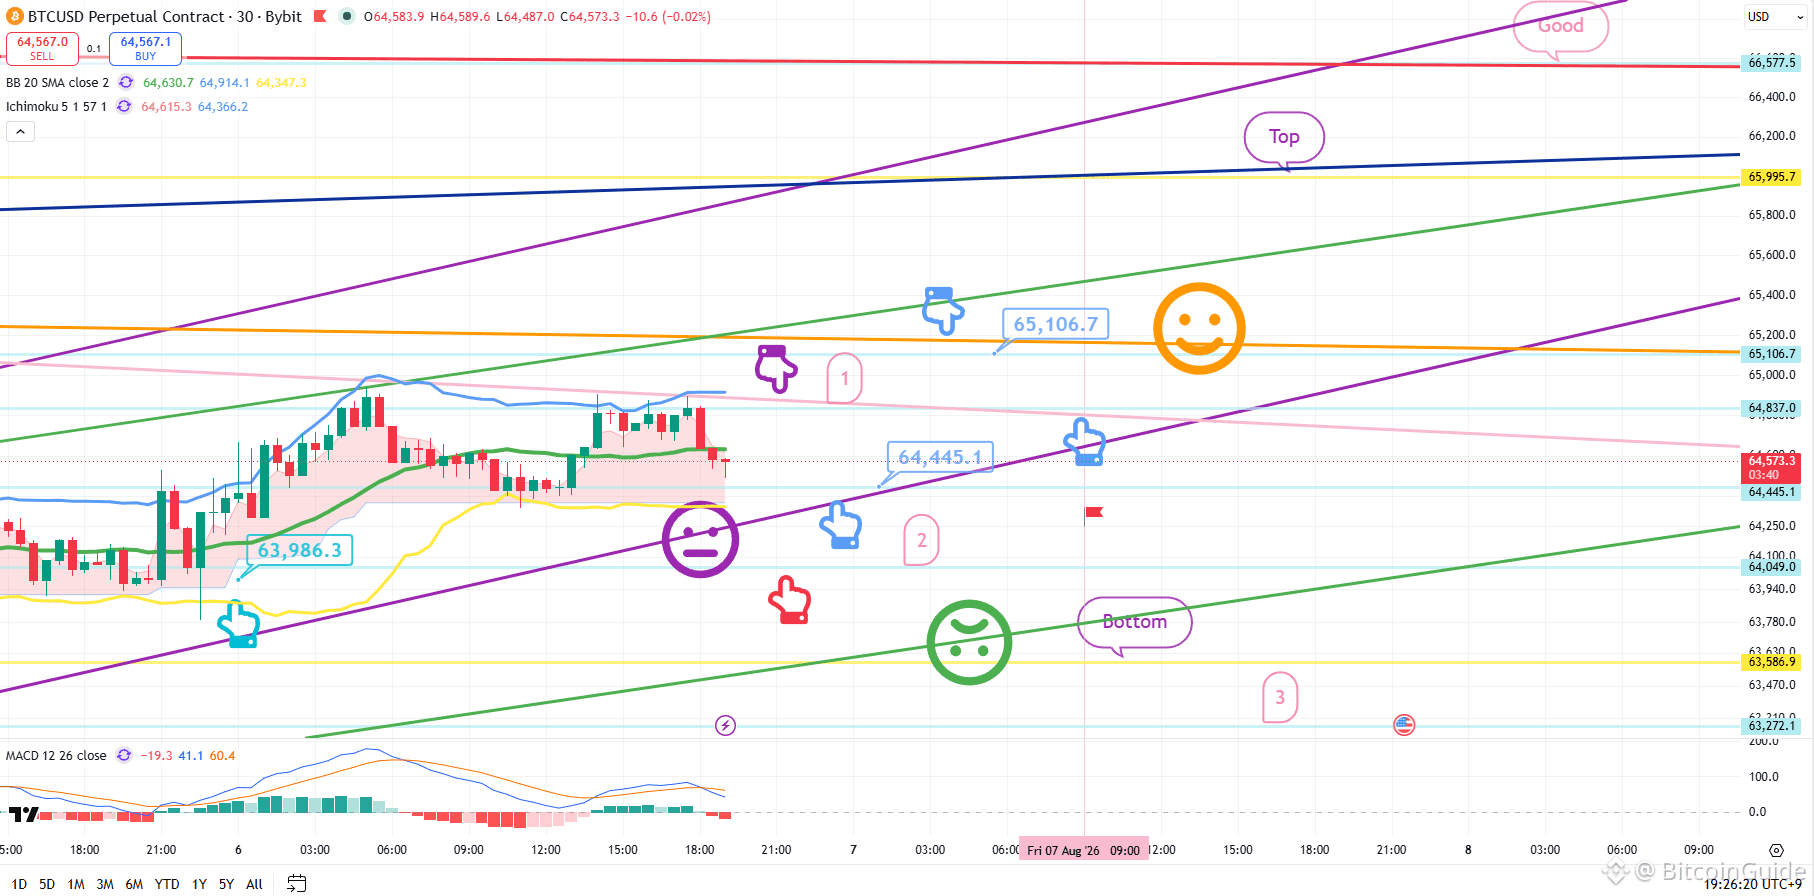
In the bottom left, marked in turquoise, the strategy was maintained after entering the long position at $63,986.3 on August 5th.
*The strategy was maintained as is. *Long Position Strategy Before and After Touching Zone 1 (Purple Finger) at the Top
1) Purple Finger Zone 1: 64.8K Short Position Entry Zone
/ Stop Loss upon breaking the orange resistance line
2) Switch to Long Position at $64445.1 / Stop Loss upon breaking the purple support line
3) $65106.7 Long Position 1st Target -> Top 2nd Target Price
- If the strategy is successful, Zone 1 serves as a re-entry zone for the Long Position.
4) If the price fails to touch Zone 1 (Purple Finger) at the top and drops immediately:
Red Finger Zone 2 (Red Finger) at the bottom: $64049 Long Position Entry Zone / Stop Loss upon breaking the green support line
- The stop loss is the same for those currently holding a Long Position at 63.9K.
- Please be cautious, as the possibility of falling to the 3rd zone is open if the bottom zone is broken.
Please pay close attention to the real-time movements of the NASDAQ.
(Gold is surging on its own.)
I post the analysis results as a Comment every day.
Thank you.
(You can find the link on my profile.)
- Click Follow to receive faster information every day.
- Check the results using the replay button on TradingView.
#Bitcoin #BTC Price Analysis# #Crypto #Altcoin Season# $ETH $USDT $XRP $BTC
[August 6 Bitcoin chart analysis]
BTCUSD 30Min Chart
*My analysis is optimized for TradingView.
If you press the replay button, you can check real-time movements.
-Long position strategy-
In the bottom left, marked in turquoise, the strategy was maintained after entering the long position at $63,986.3 on August 5th.
*The strategy was maintained as is. *Long Position Strategy Before and After Touching Zone 1 (Purple Finger) at the Top
1) Purple Finger Zone 1: 64.8K Short Position Entry Zone
/ Stop Loss upon breaking the orange resistance line
2) Switch to Long Position at $64445.1 / Stop Loss upon breaking the purple support line
3) $65106.7 Long Position 1st Target -> Top 2nd Target Price
- If the strategy is successful, Zone 1 serves as a re-entry zone for the Long Position.
4) If the price fails to touch Zone 1 (Purple Finger) at the top and drops immediately:
Red Finger Zone 2 (Red Finger) at the bottom: $64049 Long Position Entry Zone / Stop Loss upon breaking the green support line
- The stop loss is the same for those currently holding a Long Position at 63.9K.
- Please be cautious, as the possibility of falling to the 3rd zone is open if the bottom zone is broken.
Please pay close attention to the real-time movements of the NASDAQ.
(Gold is surging on its own.)
I post the analysis results as a Comment every day.
Thank you.
(You can find the link on my profile.)
- Click Follow to receive faster information every day.
- Check the results using the replay button on TradingView.
#Bitcoin #BTC Price Analysis# #Crypto #Altcoin Season# $ETH $USDT $XRP $BTC
BTCUSD 30Min Chart
*My analysis is optimized for TradingView.
If you press the replay button, you can check real-time movements.
-Long position strategy-
In the bottom left, marked in turquoise, the strategy was maintained after entering the long position at $63,986.3 on August 5th.
*The strategy was maintained as is. *Long Position Strategy Before and After Touching Zone 1 (Purple Finger) at the Top
1) Purple Finger Zone 1: 64.8K Short Position Entry Zone
/ Stop Loss upon breaking the orange resistance line
2) Switch to Long Position at $64445.1 / Stop Loss upon breaking the purple support line
3) $65106.7 Long Position 1st Target -> Top 2nd Target Price
- If the strategy is successful, Zone 1 serves as a re-entry zone for the Long Position.
4) If the price fails to touch Zone 1 (Purple Finger) at the top and drops immediately:
Red Finger Zone 2 (Red Finger) at the bottom: $64049 Long Position Entry Zone / Stop Loss upon breaking the green support line
- The stop loss is the same for those currently holding a Long Position at 63.9K.
- Please be cautious, as the possibility of falling to the 3rd zone is open if the bottom zone is broken.
Please pay close attention to the real-time movements of the NASDAQ.
(Gold is surging on its own.)
I post the analysis results as a Comment every day.
Thank you.
(You can find the link on my profile.)
- Click Follow to receive faster information every day.
- Check the results using the replay button on TradingView.
#Bitcoin #BTC Price Analysis# #Crypto #Altcoin Season# $ETH $USDT $XRP $BTC
72
·
--
[August 5 Bitcoin chart analysis]
BTCUSD 30Min Chart
*My analysis is optimized for TradingView.
If you press the replay button, you can check real-time movements.
-Long position strategy-
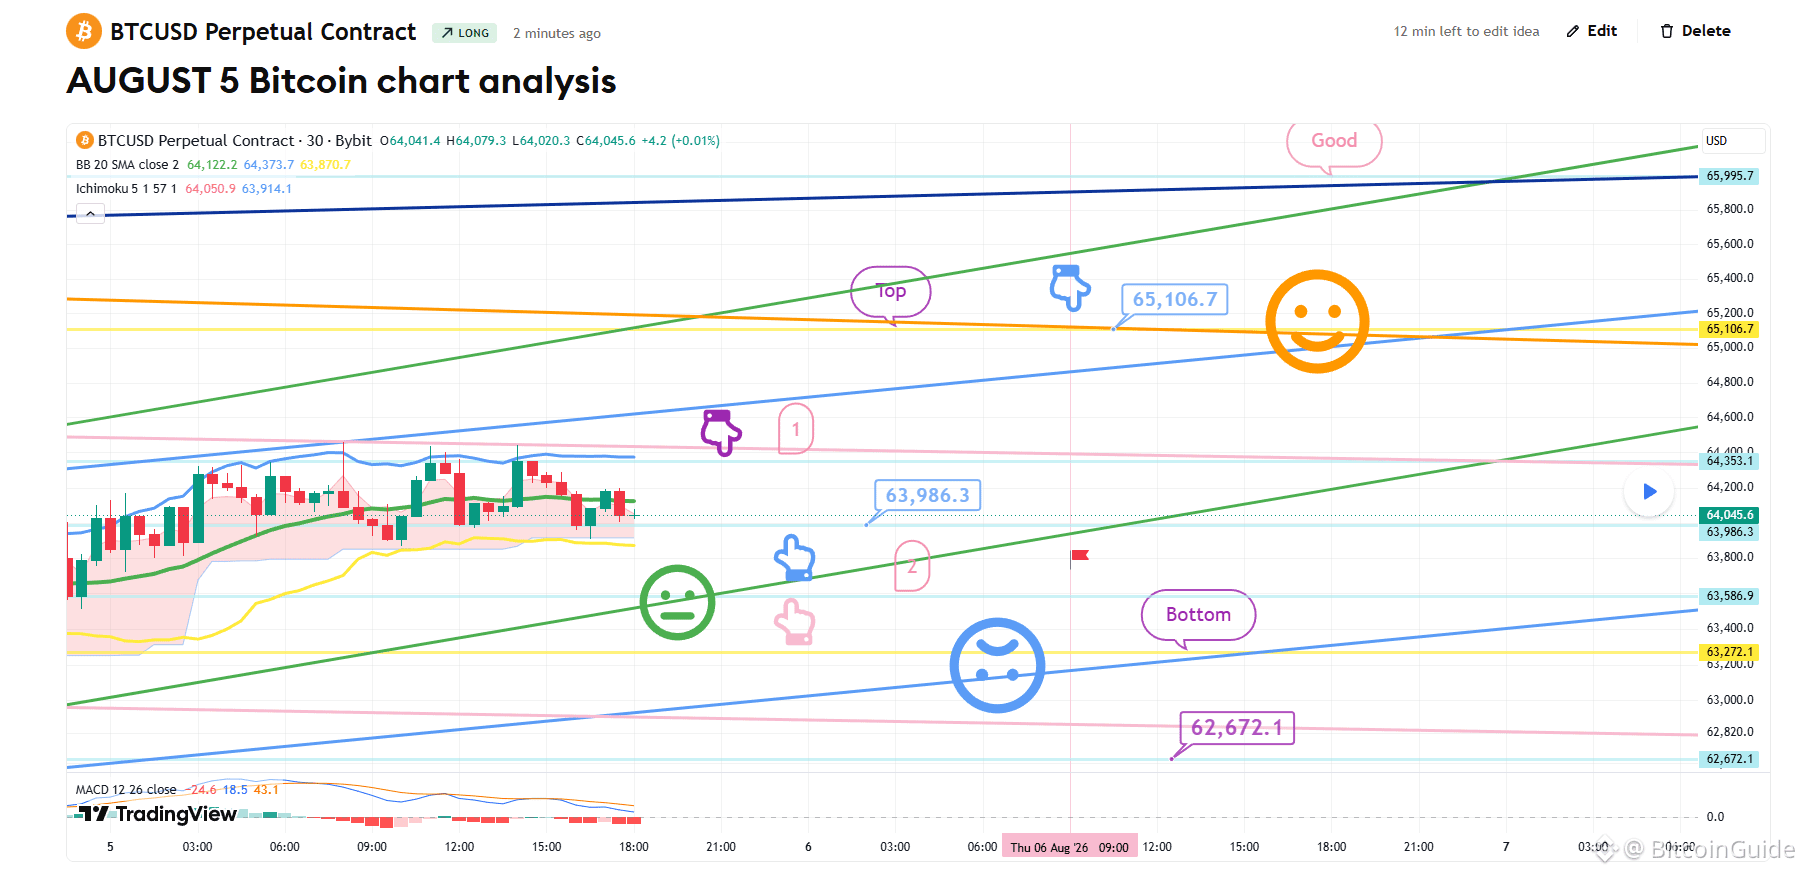
*Long Position Strategy: Before and after touching the purple finger zone 1 at the top
1) After touching the purple finger zone 1 (Autonomous Short): Switch to a long position at $63,986.3 / Stop loss if broken below the green support line
2) $65,106.7 Long Position 1st Target -> Good 2nd Target
- If it drops immediately without touching the purple finger:
Enter a long position at zone 2 at the bottom, $63,586.9
/ Stop loss if broken below the light blue support line
Please be careful, as the price opens up to $62,672.1 at the very bottom from the point of breaking the bottom zone.
I post the analysis results as a Comment every day.
Thank you.
(You can find the link on my profile.)
- Click Follow to receive faster information every day.
- Check the results using the replay button on TradingView.
#Bitcoin #BTC Price Analysis# #Crypto #Altcoin Season# $ETH $GOLD $BTC $QQQX
[August 5 Bitcoin chart analysis]
BTCUSD 30Min Chart
*My analysis is optimized for TradingView.
If you press the replay button, you can check real-time movements.
-Long position strategy-
*Long Position Strategy: Before and after touching the purple finger zone 1 at the top
1) After touching the purple finger zone 1 (Autonomous Short): Switch to a long position at $63,986.3 / Stop loss if broken below the green support line
2) $65,106.7 Long Position 1st Target -> Good 2nd Target
- If it drops immediately without touching the purple finger:
Enter a long position at zone 2 at the bottom, $63,586.9
/ Stop loss if broken below the light blue support line
Please be careful, as the price opens up to $62,672.1 at the very bottom from the point of breaking the bottom zone.
I post the analysis results as a Comment every day.
Thank you.
(You can find the link on my profile.)
- Click Follow to receive faster information every day.
- Check the results using the replay button on TradingView.
#Bitcoin #BTC Price Analysis# #Crypto #Altcoin Season# $ETH $GOLD $BTC $QQQX
BTCUSD 30Min Chart
*My analysis is optimized for TradingView.
If you press the replay button, you can check real-time movements.
-Long position strategy-
*Long Position Strategy: Before and after touching the purple finger zone 1 at the top
1) After touching the purple finger zone 1 (Autonomous Short): Switch to a long position at $63,986.3 / Stop loss if broken below the green support line
2) $65,106.7 Long Position 1st Target -> Good 2nd Target
- If it drops immediately without touching the purple finger:
Enter a long position at zone 2 at the bottom, $63,586.9
/ Stop loss if broken below the light blue support line
Please be careful, as the price opens up to $62,672.1 at the very bottom from the point of breaking the bottom zone.
I post the analysis results as a Comment every day.
Thank you.
(You can find the link on my profile.)
- Click Follow to receive faster information every day.
- Check the results using the replay button on TradingView.
#Bitcoin #BTC Price Analysis# #Crypto #Altcoin Season# $ETH $GOLD $BTC $QQQX
71
·
--
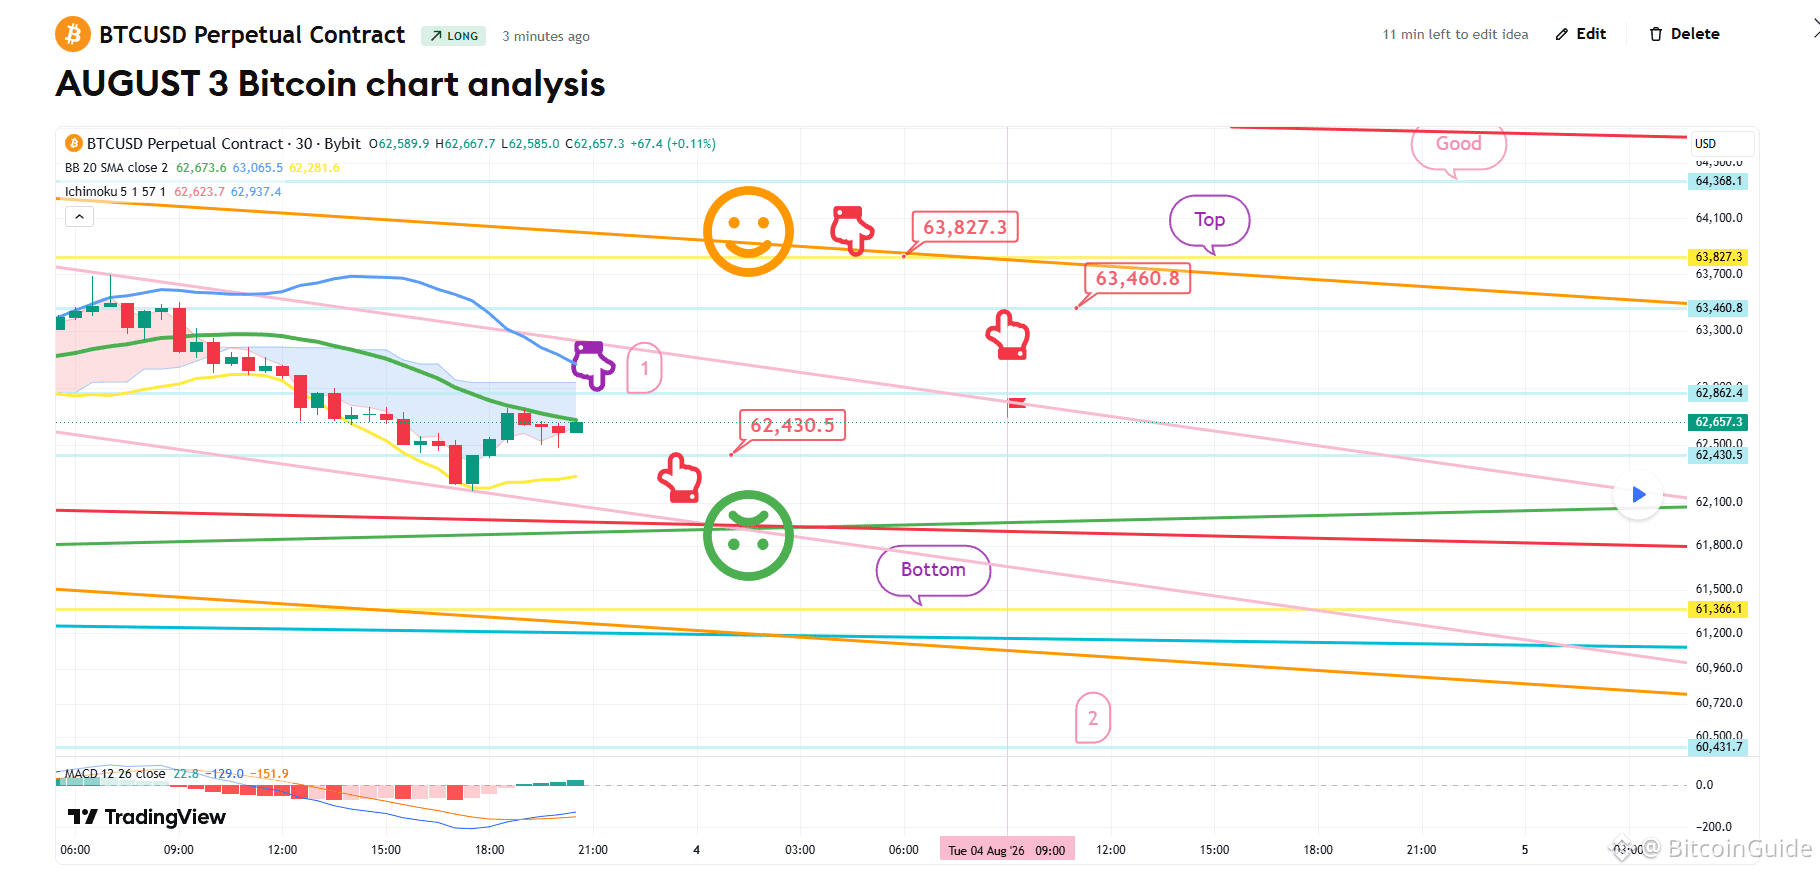
[AUGUST 3 Bitcoin chart analysis] BTCUSD 30Min Chart *My analysis is optimized for TradingView. If you press the replay button, you can check real-time movements. *Long Position Strategy after confirming the touch of the purple finger at Zone 1 1) After confirming the touch of the purple finger at Zone 1 at 62.8K 62,430.5 USD: Entry point for long position / Stop loss if broken below the green support line 2) 63,827.3 USD: Target price for long position -> Final target price in the Good zone Even if it does not touch Zone 1 at the top, if it does not break below the green support line today, it can continue to rise. However, please be cautious, as the market is open from the bottom to Zone 2 once the green support line is broken. I post the analysis results as a Comment every day. Thank you. (You can find the link on my profile.) - Click Follow to receive faster information every day. - Check the results using the replay button on TradingView. #BTC Price Analysis# #Crypto #USDT #Altcoin Season# $BTC $ETH $XRP
[AUGUST 3 Bitcoin chart analysis] BTCUSD 30Min Chart *My analysis is optimized for TradingView. If you press the replay button, you can check real-time movements. *Long Position Strategy after confirming the touch of the purple finger at Zone 1 1) After confirming the touch of the purple finger at Zone 1 at 62.8K 62,430.5 USD: Entry point for long position / Stop loss if broken below the green support line 2) 63,827.3 USD: Target price for long position -> Final target price in the Good zone Even if it does not touch Zone 1 at the top, if it does not break below the green support line today, it can continue to rise. However, please be cautious, as the market is open from the bottom to Zone 2 once the green support line is broken. I post the analysis results as a Comment every day. Thank you. (You can find the link on my profile.) - Click Follow to receive faster information every day. - Check the results using the replay button on TradingView. #BTC Price Analysis# #Crypto #USDT #Altcoin Season# $BTC $ETH $XRP
55
·
--
[July 31 Bitcoin chart analysis]
BTCUSD 30Min Chart
*My analysis is optimized for TradingView.
If you press the replay button, you can check real-time movements.
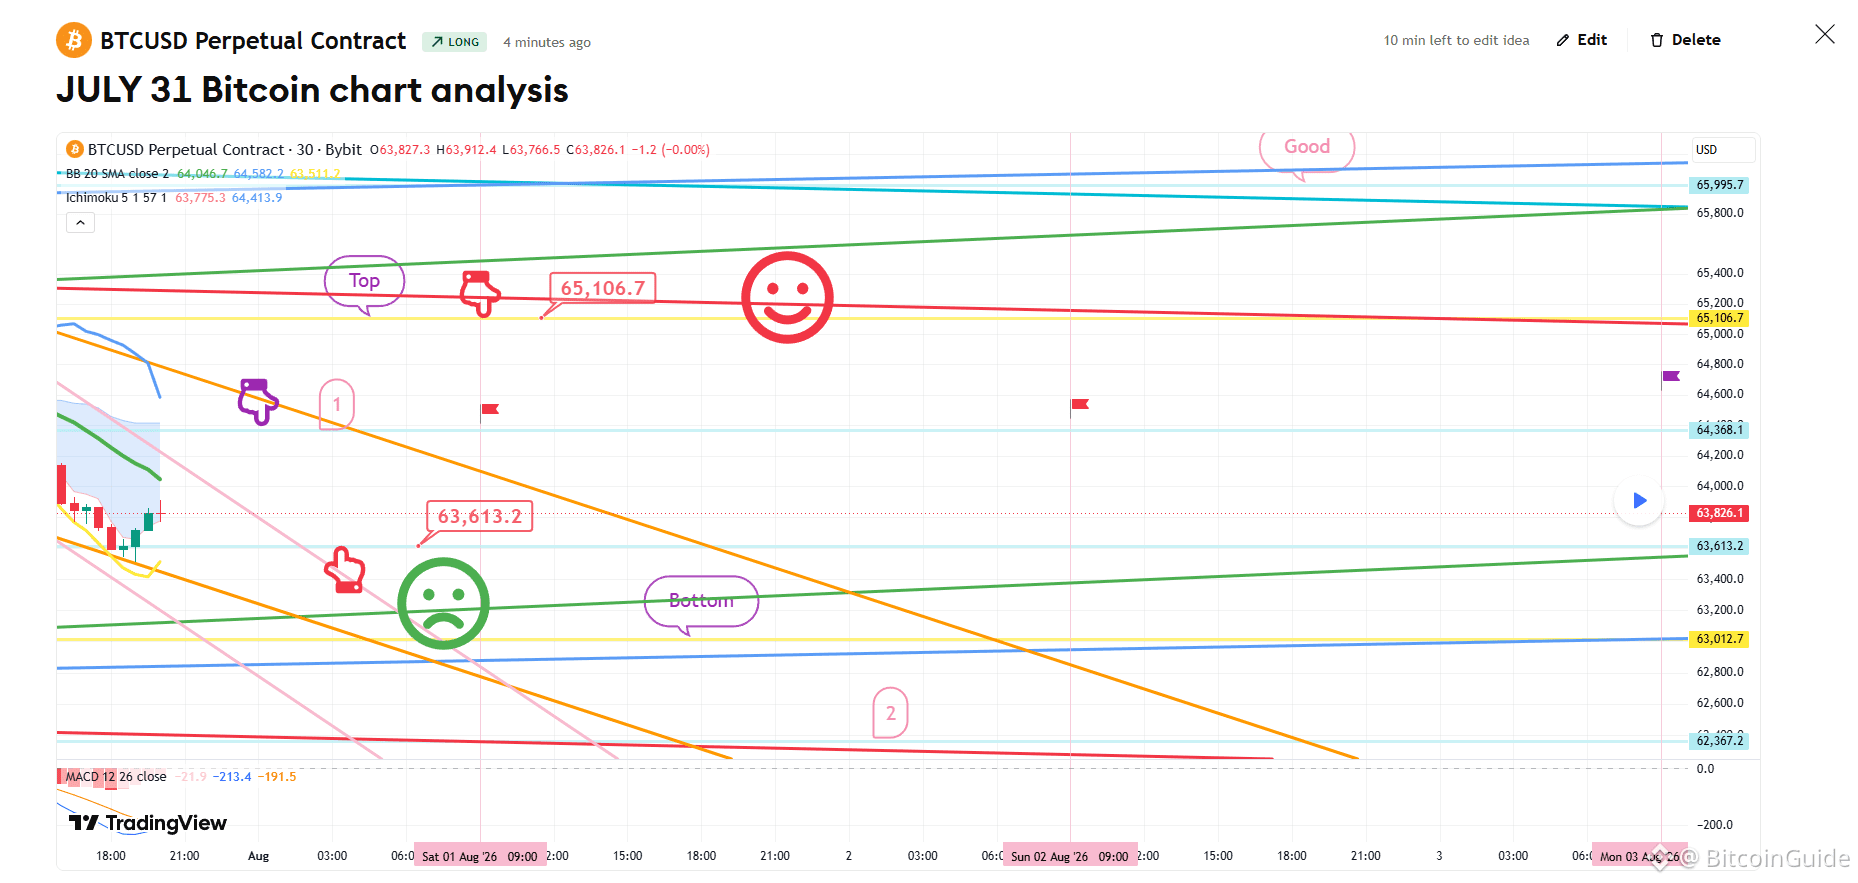
*Long Position Strategy based on the movement path of the red finger
1) After confirming the purple finger touches the top once (Short at your discretion)
$63,613.2 is the entry point for the long position / Stop loss if the green support line is broken
2) $65,106.7 is the 1st target for the long position -> Good 2nd target price
- If it drops immediately without touching zone 1, place a final long position at Bottom / Stop loss if broken by the light blue support line
If the blue support line is broken
Bottom at the bottom -> Please be careful as it could drop up to zone 2.
I post the analysis results as a Comment every day.
Thank you.
(You can find the link on my profile.)
- Click Follow to receive faster information every day.
- Check the results using the replay button on TradingView.
#BTC Price Analysis# #Altcoin Season# #Crypto# #USDT $ETH $BTC $XRP $ALT
[July 31 Bitcoin chart analysis]
BTCUSD 30Min Chart
*My analysis is optimized for TradingView.
If you press the replay button, you can check real-time movements.
*Long Position Strategy based on the movement path of the red finger
1) After confirming the purple finger touches the top once (Short at your discretion)
$63,613.2 is the entry point for the long position / Stop loss if the green support line is broken
2) $65,106.7 is the 1st target for the long position -> Good 2nd target price
- If it drops immediately without touching zone 1, place a final long position at Bottom / Stop loss if broken by the light blue support line
If the blue support line is broken
Bottom at the bottom -> Please be careful as it could drop up to zone 2.
I post the analysis results as a Comment every day.
Thank you.
(You can find the link on my profile.)
- Click Follow to receive faster information every day.
- Check the results using the replay button on TradingView.
#BTC Price Analysis# #Altcoin Season# #Crypto# #USDT $ETH $BTC $XRP $ALT
BTCUSD 30Min Chart
*My analysis is optimized for TradingView.
If you press the replay button, you can check real-time movements.
*Long Position Strategy based on the movement path of the red finger
1) After confirming the purple finger touches the top once (Short at your discretion)
$63,613.2 is the entry point for the long position / Stop loss if the green support line is broken
2) $65,106.7 is the 1st target for the long position -> Good 2nd target price
- If it drops immediately without touching zone 1, place a final long position at Bottom / Stop loss if broken by the light blue support line
If the blue support line is broken
Bottom at the bottom -> Please be careful as it could drop up to zone 2.
I post the analysis results as a Comment every day.
Thank you.
(You can find the link on my profile.)
- Click Follow to receive faster information every day.
- Check the results using the replay button on TradingView.
#BTC Price Analysis# #Altcoin Season# #Crypto# #USDT $ETH $BTC $XRP $ALT

62
·
--
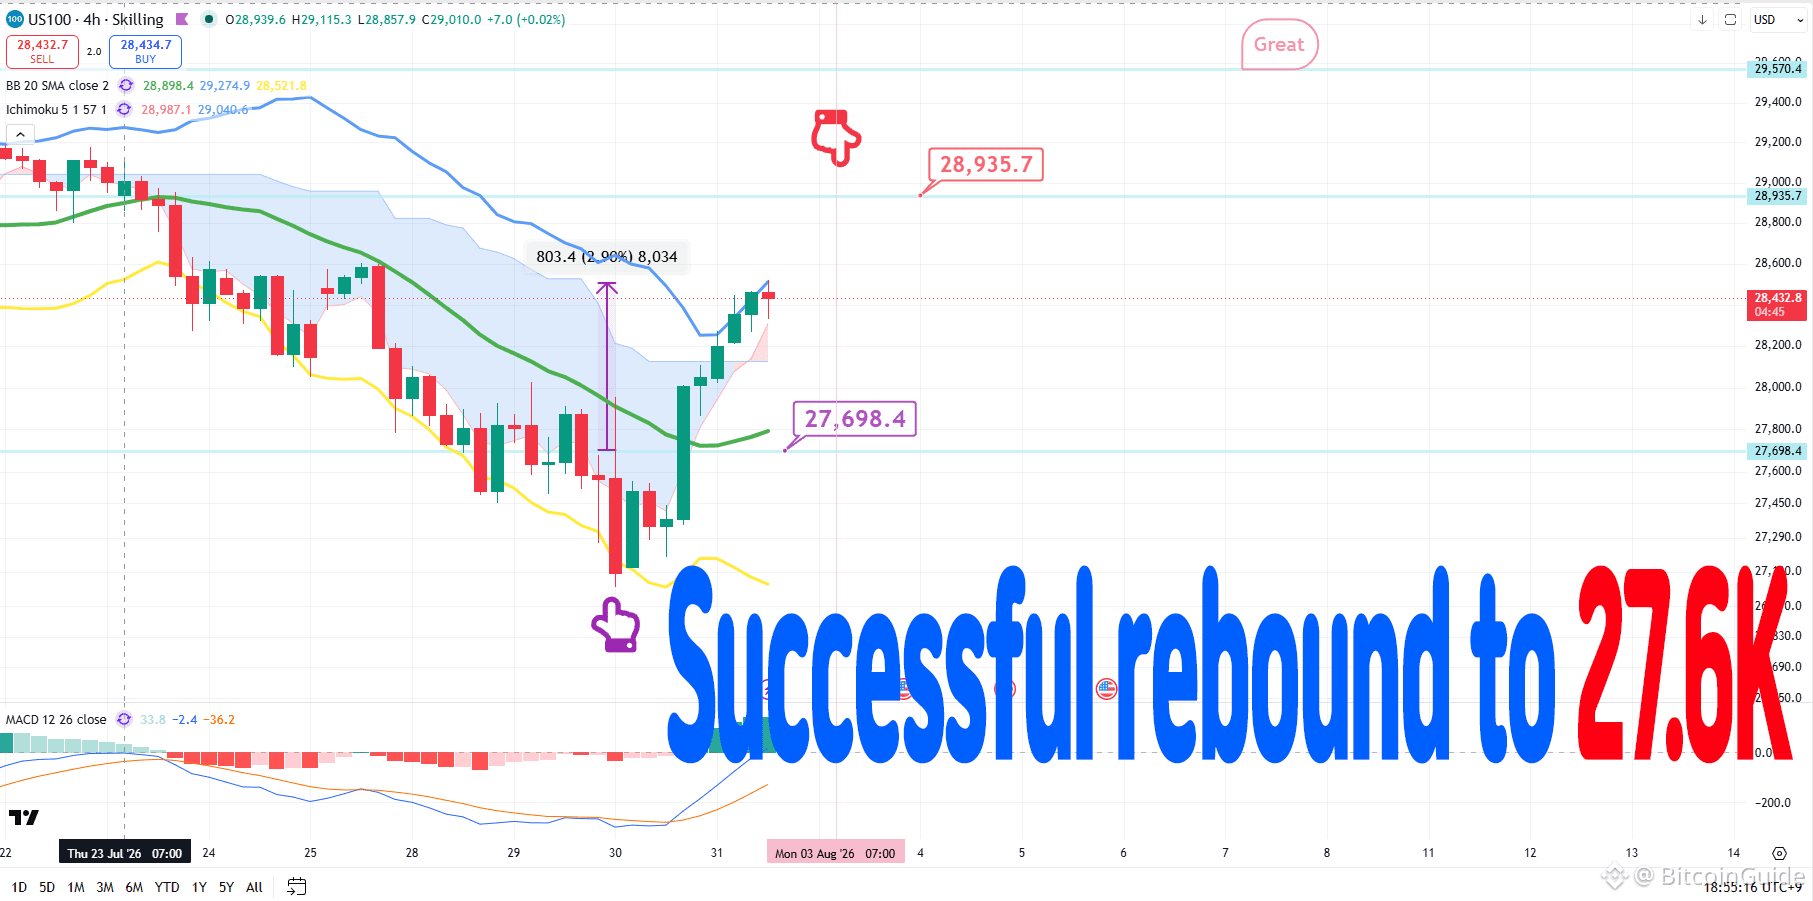
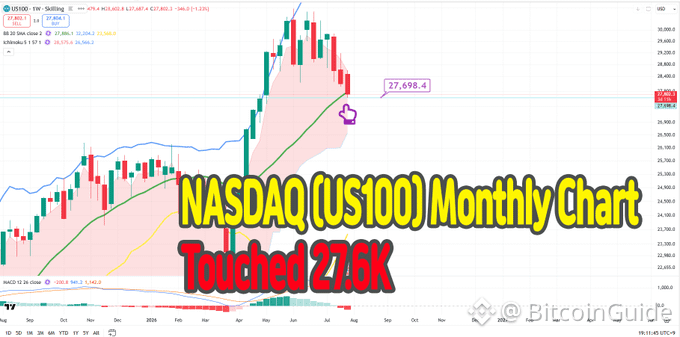
https://x.com/BitcoinGuide_TM/status/2083130886091055580?s=20 Successful rebound to 27.6K ->Current price 28.5K Please pay attention to the target price at the top. The stronger the rise today, the more it connects to an uptrend. Then what about Bitcoin?? #BTC Price Analysis# #Altcoin Season# #BTC100K $BTC $USDT $CRYPTO
https://x.com/BitcoinGuide_TM/status/2083130886091055580?s=20 Successful rebound to 27.6K ->Current price 28.5K Please pay attention to the target price at the top. The stronger the rise today, the more it connects to an uptrend. Then what about Bitcoin?? #BTC Price Analysis# #Altcoin Season# #BTC100K $BTC $USDT $CRYPTO
63
·
--
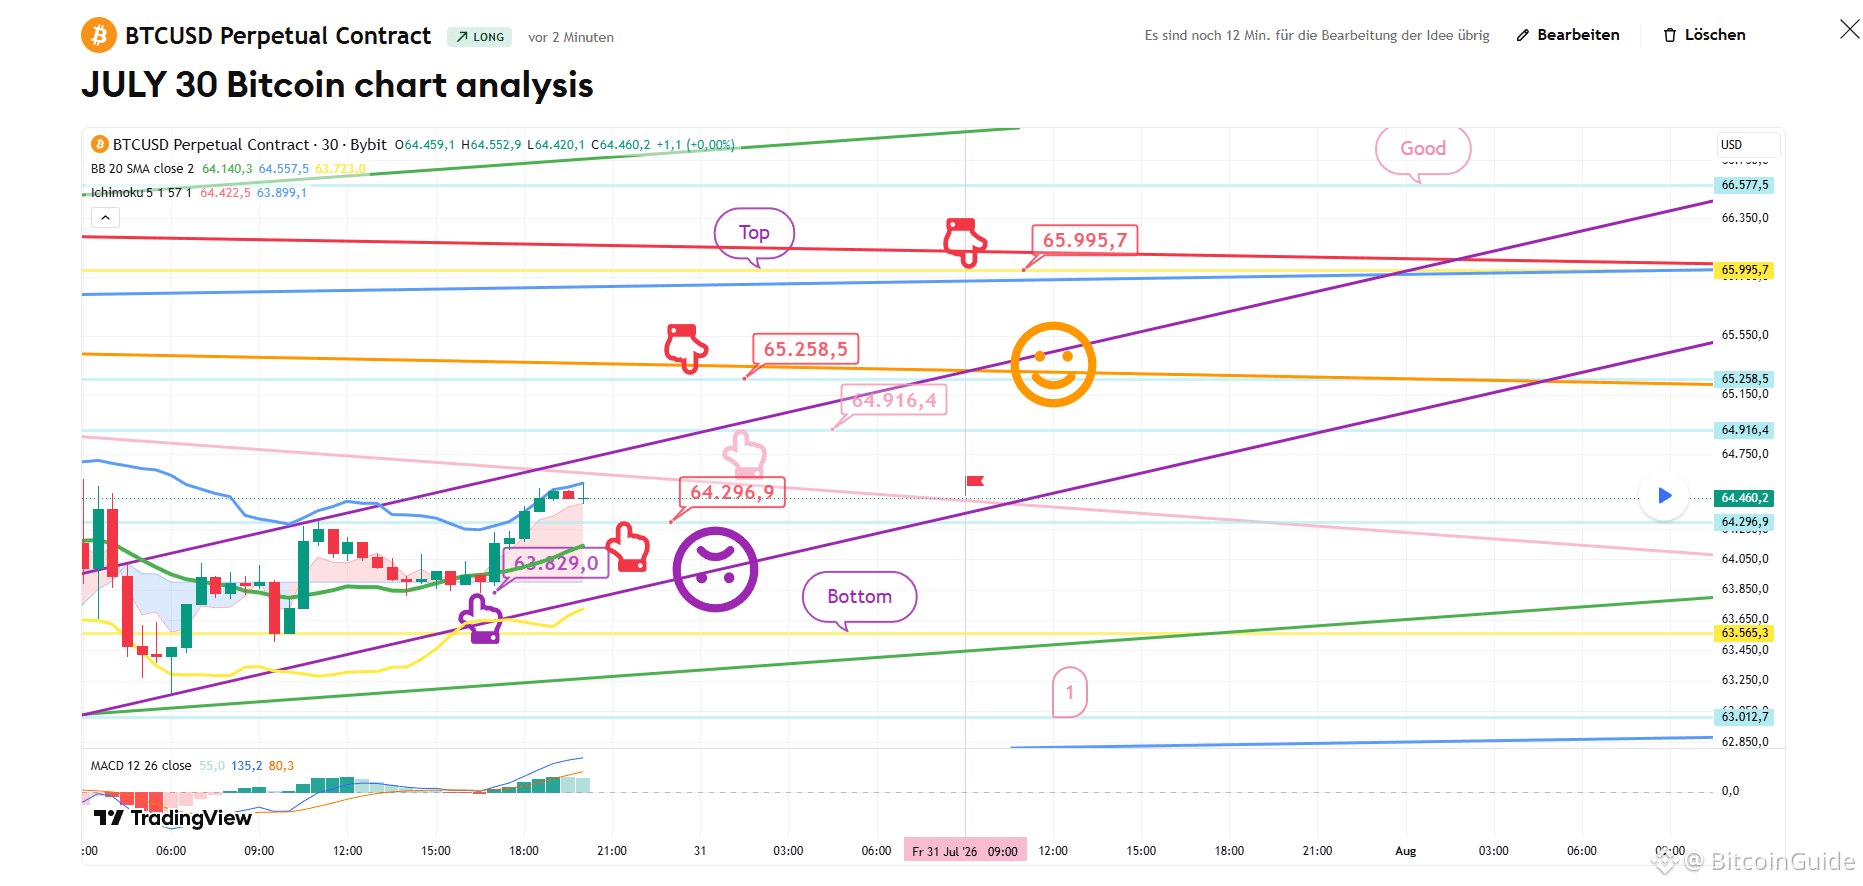
[July 30 Bitcoin chart analysis]
BTCUSD 30Min Chart
*My analysis is optimized for TradingView.
If you press the replay button, you can check real-time movements.
-Long position strategy-
In the bottom left, I have connected today's strategy by linking the long position entry point of $63,829—where I entered on the 29th (indicated by the purple finger) —exactly as it is.
*Long Position Strategy based on the red finger's movement path
1) $64,296.9 Long Position Entry Point / Stop Loss if the purple support line is broken
2) $65,258.5 Long Position 1st Target -> Target prices in the order of Top, Good
If the purple support line is broken, the price could fall to the Bottom zone at the bottom.
The green support line Bottom zone is a safe zone; if it is broken, the price could drop to a maximum of Zone 1.
Please use my analysis post merely as a reference and for practical application.
I post the analysis results as a Comment every day.
Thank you.
(You can find the link on my profile.)
- Click Follow to receive faster information every day.
- Check the results using the replay button on TradingView.
#BTC100K #Crypto #Altcoin Season# #USDT #BTC Price Analysis# $ETH $XRP $BTC $GOLD
[July 30 Bitcoin chart analysis]
BTCUSD 30Min Chart
*My analysis is optimized for TradingView.
If you press the replay button, you can check real-time movements.
-Long position strategy-
In the bottom left, I have connected today's strategy by linking the long position entry point of $63,829—where I entered on the 29th (indicated by the purple finger) —exactly as it is.
*Long Position Strategy based on the red finger's movement path
1) $64,296.9 Long Position Entry Point / Stop Loss if the purple support line is broken
2) $65,258.5 Long Position 1st Target -> Target prices in the order of Top, Good
If the purple support line is broken, the price could fall to the Bottom zone at the bottom.
The green support line Bottom zone is a safe zone; if it is broken, the price could drop to a maximum of Zone 1.
Please use my analysis post merely as a reference and for practical application.
I post the analysis results as a Comment every day.
Thank you.
(You can find the link on my profile.)
- Click Follow to receive faster information every day.
- Check the results using the replay button on TradingView.
#BTC100K #Crypto #Altcoin Season# #USDT #BTC Price Analysis# $ETH $XRP $BTC $GOLD
BTCUSD 30Min Chart
*My analysis is optimized for TradingView.
If you press the replay button, you can check real-time movements.
-Long position strategy-
In the bottom left, I have connected today's strategy by linking the long position entry point of $63,829—where I entered on the 29th (indicated by the purple finger) —exactly as it is.
*Long Position Strategy based on the red finger's movement path
1) $64,296.9 Long Position Entry Point / Stop Loss if the purple support line is broken
2) $65,258.5 Long Position 1st Target -> Target prices in the order of Top, Good
If the purple support line is broken, the price could fall to the Bottom zone at the bottom.
The green support line Bottom zone is a safe zone; if it is broken, the price could drop to a maximum of Zone 1.
Please use my analysis post merely as a reference and for practical application.
I post the analysis results as a Comment every day.
Thank you.
(You can find the link on my profile.)
- Click Follow to receive faster information every day.
- Check the results using the replay button on TradingView.
#BTC100K #Crypto #Altcoin Season# #USDT #BTC Price Analysis# $ETH $XRP $BTC $GOLD
75
·
--
[July 29 Bitcoin chart analysis]
BTCUSD 30Min Chart
*My analysis is optimized for TradingView.
If you press the replay button, you can check real-time movements.
-Long position strategy-
This is the Bitcoin 30-minute chart.
The US FOMC indicators will be released shortly at 3 PM.
The Nasdaq has touched a major support line.
*Long Position Strategy based on the movement path of the red finger
1) Entry point for a long position at $63,829 / Stop loss if the green support line is broken.
2) 1st target for a long position at $65,120.5 -> 2nd target at the top zone of $65,995.7.
If the green support line is broken,
it could fall to the bottom -> up to zone 1 at most.
Zone 1 is today's major rebound zone.
Looking at the Nasdaq's movement based on short-term patterns,
an upward-sloping sideways market is expected,
and if it breaks below the previous low, it could lead to a mid-to-long-term decline.
I post the analysis results as a Comment every day.
Thank you.
(You can find the link on my profile.)
- Click Follow to receive faster information every day.
- Check the results using the replay button on TradingView.
#Bitcoin #BTC100K #Crypto #Altcoin Season# #BTC Price Analysis# $USDT $ALT $BTC $GOLD
[July 29 Bitcoin chart analysis]
BTCUSD 30Min Chart
*My analysis is optimized for TradingView.
If you press the replay button, you can check real-time movements.
-Long position strategy-
This is the Bitcoin 30-minute chart.
The US FOMC indicators will be released shortly at 3 PM.
The Nasdaq has touched a major support line.
*Long Position Strategy based on the movement path of the red finger
1) Entry point for a long position at $63,829 / Stop loss if the green support line is broken.
2) 1st target for a long position at $65,120.5 -> 2nd target at the top zone of $65,995.7.
If the green support line is broken,
it could fall to the bottom -> up to zone 1 at most.
Zone 1 is today's major rebound zone.
Looking at the Nasdaq's movement based on short-term patterns,
an upward-sloping sideways market is expected,
and if it breaks below the previous low, it could lead to a mid-to-long-term decline.
I post the analysis results as a Comment every day.
Thank you.
(You can find the link on my profile.)
- Click Follow to receive faster information every day.
- Check the results using the replay button on TradingView.
#Bitcoin #BTC100K #Crypto #Altcoin Season# #BTC Price Analysis# $USDT $ALT $BTC $GOLD
BTCUSD 30Min Chart
*My analysis is optimized for TradingView.
If you press the replay button, you can check real-time movements.
-Long position strategy-
This is the Bitcoin 30-minute chart.
The US FOMC indicators will be released shortly at 3 PM.
The Nasdaq has touched a major support line.
*Long Position Strategy based on the movement path of the red finger
1) Entry point for a long position at $63,829 / Stop loss if the green support line is broken.
2) 1st target for a long position at $65,120.5 -> 2nd target at the top zone of $65,995.7.
If the green support line is broken,
it could fall to the bottom -> up to zone 1 at most.
Zone 1 is today's major rebound zone.
Looking at the Nasdaq's movement based on short-term patterns,
an upward-sloping sideways market is expected,
and if it breaks below the previous low, it could lead to a mid-to-long-term decline.
I post the analysis results as a Comment every day.
Thank you.
(You can find the link on my profile.)
- Click Follow to receive faster information every day.
- Check the results using the replay button on TradingView.
#Bitcoin #BTC100K #Crypto #Altcoin Season# #BTC Price Analysis# $USDT $ALT $BTC $GOLD
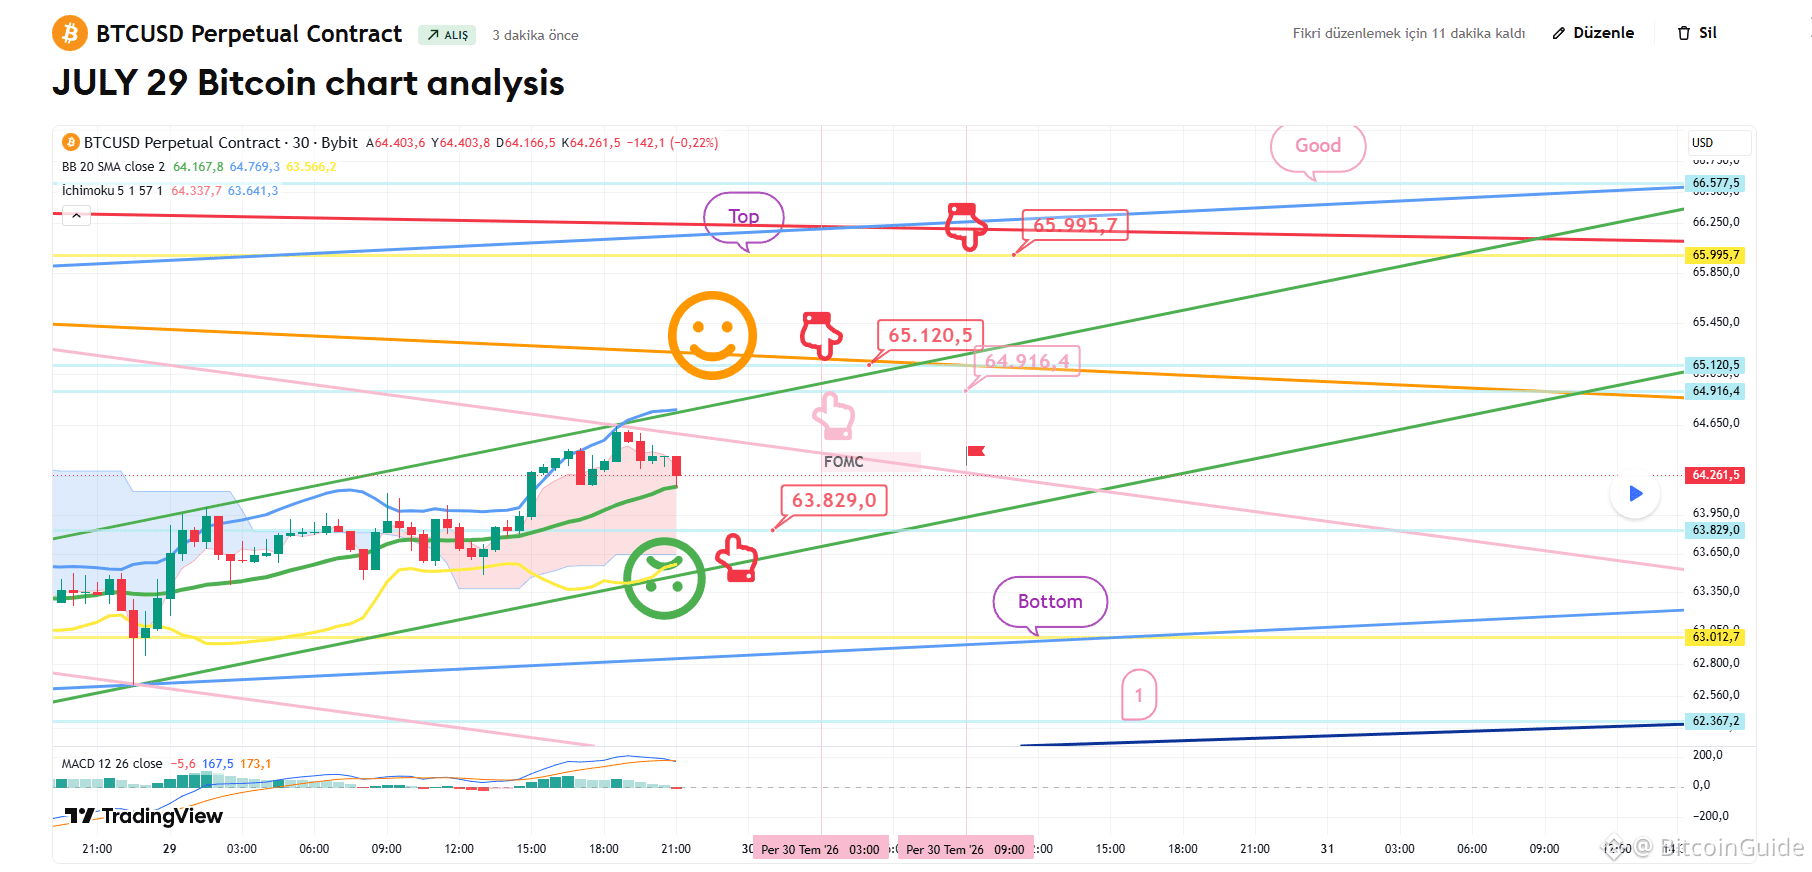

53
Log in to explore more content
Join global crypto users on Binance Square
⚡️ Get latest and useful information about crypto.
💬 Trusted by the world’s largest crypto exchange.
👍 Discover real insights from verified creators.
Email / Phone number
Trending Topics
FedRateWatch
44,622 views
276 Discussing
Share & Win Traffic Reward in our Trending Hashtag Campaign
✨Topic: FOMC September, What's The Fed's Next Move?
👉How to Join:
Publish a short post or article with hashtag #FedRateWatch
Create content based on the below angles:
- August core CPI rose 0.3% month-over-month, and the odds of a 25bp hike this week are now close to 90%. Do you anticipate a rate hike this week? Is it a one-off, or the start of a longer hiking cycle?
- If the hike lands, how does it play out for BTC, tech stocks, and gold? Bullish or bearish?
- How are you planning to trade next? Share your BTC, stocks or gold trade/holdings with our trade sharing widget.
⏰Campaign Period:
- 2026-09-15 11:00 - 2026-09-17 3:00 UTC
🎁Reward:
- Qualified posts that comply with the above guidelines and contain more than 100 words will be reviewed and may receive a random traffic boost of 500 to 3,000 views. You will receive a notification from your feed secretary if your post is selected.
- Get a chance to have your article featured on Binance Square Official
Need ideas for your post? Visit the topic page #FedRateWatch or the Square Guide on How to Post for Better Reach.
Binance Square Official
·81 Likes
·127.9k views
BitcoinReboundsTo$79K
35,802 views
291 Discussing
BessentEndorsesFinalClarityActDraft
3,556 views
153 Discussing