

Abdul0o
11 Posts

Abdul0o
Report
Block User
Open Trade
2.3 Years
12 Following
7 Followers
0 Liked
Posts
Portfolio
·
--
$ETC
{spot}(ETCUSDT)
Latest Market Analysis
October 30, 2026 | Market Update
Short-term bearish trend
$7.06
Approximate ETC price in USD
Market overview: Ethereum Classic is facing selling pressure, falling approximately 4.5% in the last 24 hours. The broader crypto market decline and Binance security concerns are contributing to negative sentiment.
CoinMarketCap+1
📉 ETC price chart
Important price levels
Level
Price
Support
$6.84
Major support
$6.50
Resistance
$7.35
Major resistance
$7.60
CoinMarketCap+1
🔮 Market outlook
Bullish scenario: Recovery above $7.35 could improve market sentiment.
Bearish scenario: Falling below $6.84 could increase downside pressure.
Overall: ETC remains weak, with elevated selling activity.
Final analysis: ETC is showing bearish momentum. Watch whether it can maintain support around $6.84. A recovery is possible, but confirmation is still needed.
Educational market commentary, not financial advice.
#$1.5BInLeveragedCryptoBetsLiquidated #KOSPIFalls3.53%BackBelow6000
$ETC
Latest Market Analysis
October 30, 2026 | Market Update
Short-term bearish trend
$7.06
Approximate ETC price in USD
Market overview: Ethereum Classic is facing selling pressure, falling approximately 4.5% in the last 24 hours. The broader crypto market decline and Binance security concerns are contributing to negative sentiment.
CoinMarketCap+1
📉 ETC price chart
Important price levels
Level
Price
Support
$6.84
Major support
$6.50
Resistance
$7.35
Major resistance
$7.60
CoinMarketCap+1
🔮 Market outlook
Bullish scenario: Recovery above $7.35 could improve market sentiment.
Bearish scenario: Falling below $6.84 could increase downside pressure.
Overall: ETC remains weak, with elevated selling activity.
Final analysis: ETC is showing bearish momentum. Watch whether it can maintain support around $6.84. A recovery is possible, but confirmation is still needed.
Educational market commentary, not financial advice.
#$1.5BInLeveragedCryptoBetsLiquidated #KOSPIFalls3.53%BackBelow6000

18
·
--
$INIT Coin (Initia) Latest Market Analysis
October 30, 2026 | INIT / USDT
Short-term recovery attempt
$0.22
Approximate current price in USD
Market overview: Initia (INIT) has experienced strong price movement recently, rising from around $0.15 to approximately $0.22. However, it remains volatile following recent network security concerns and a temporary chain suspension.
Binance+2
📈 INIT price chart
Important price levels
Level
Price
Support
$0.205
Strong support
$0.16
Resistance
$0.236
Next resistance
$0.25
CoinPaprika+1
🔮 Market outlook
Bullish: A move above $0.236 may indicate improving momentum.
Bearish: A break below $0.205 may increase downside pressure.
Risk: Network recovery and token supply developments remain important.
Final analysis: INIT has shown a notable recovery, but its technical and network risks remain elevated. Watch its price trend and verified network updates before drawing conclusions.
Educational market analysis, not financial advice.

348
·
--
$BNB
{spot}(BNBUSDT)
Coin Latest Analysis – October 30, 2026
Bearish market sentiment
$707.53
BNB approximate market price | USD
BNB is experiencing significant selling pressure, declining approximately 5.5% over 24 hours. The recent Binance security incident has increased market uncertainty and contributed to the sell-off.
CoinGecko+1
📉 BNB price chart
Important price levels
Level
Price
Recent support
$682–$690
Next support
$660
Immediate resistance
$730–$740
Major resistance
$760
Approximate technical reference levels based on recent price data.
CoinPaprika+1
🔮 Market outlook
Bullish possibility: Recovery above $740 could improve market sentiment.
Bearish possibility: A sustained move below $682 could indicate further weakness.
Overall: BNB remains volatile, and its recovery depends partly on restored market confidence.
Final conclusion: BNB is currently under bearish pressure. The recent security incident makes the outlook uncertain. Focus on understanding the market rather than rushing into financial decisions.
Educational market analysis, not financial advice.#$1.5BInLeveragedCryptoBetsLiquidated #AmazonSharesFallAbout7%InPremarketTrading
$BNB
Coin Latest Analysis – October 30, 2026
Bearish market sentiment
$707.53
BNB approximate market price | USD
BNB is experiencing significant selling pressure, declining approximately 5.5% over 24 hours. The recent Binance security incident has increased market uncertainty and contributed to the sell-off.
CoinGecko+1
📉 BNB price chart
Important price levels
Level
Price
Recent support
$682–$690
Next support
$660
Immediate resistance
$730–$740
Major resistance
$760
Approximate technical reference levels based on recent price data.
CoinPaprika+1
🔮 Market outlook
Bullish possibility: Recovery above $740 could improve market sentiment.
Bearish possibility: A sustained move below $682 could indicate further weakness.
Overall: BNB remains volatile, and its recovery depends partly on restored market confidence.
Final conclusion: BNB is currently under bearish pressure. The recent security incident makes the outlook uncertain. Focus on understanding the market rather than rushing into financial decisions.
Educational market analysis, not financial advice.#$1.5BInLeveragedCryptoBetsLiquidated #AmazonSharesFallAbout7%InPremarketTrading

42
·
--
The cryptocurrency market is experiencing volatility, making it important to understand market trends before evaluating individual coins.
Bitcoin ($BTC
{spot}(BTCUSDT)
) and Ethereum ($ETH
{spot}(ETHUSDT)
) are useful starting points for studying the crypto market because they are two major cryptocurrencies with established market histories. This is an educational comparison, not a recommendation to trade either asset.
Current market comparison
Coin
Latest reported price
24h change
BTC
$78,616
-2.02%
ETH
$2,246
-3.38%
SOL
$98.19
-2.26%
XRP
$1.26
-3.19%
Market snapshot: October 30, 2026.
MarketAlleys+1
Short conclusion: The overall market is under selling pressure. BTC and ETH are useful assets to study, but neither has a confirmed recovery signal in the available reports. Avoid treating a price drop as an automatic buying opportunity.
#$1.5BInLeveragedCryptoBetsLiquidated #KOSPIFalls3.53%BackBelow6000 #AmazonSharesFallAbout7%InPremarketTrading
The cryptocurrency market is experiencing volatility, making it important to understand market trends before evaluating individual coins.
Bitcoin ($BTC
) and Ethereum ($ETH
) are useful starting points for studying the crypto market because they are two major cryptocurrencies with established market histories. This is an educational comparison, not a recommendation to trade either asset.
Current market comparison
Coin
Latest reported price
24h change
BTC
$78,616
-2.02%
ETH
$2,246
-3.38%
SOL
$98.19
-2.26%
XRP
$1.26
-3.19%
Market snapshot: October 30, 2026.
MarketAlleys+1
Short conclusion: The overall market is under selling pressure. BTC and ETH are useful assets to study, but neither has a confirmed recovery signal in the available reports. Avoid treating a price drop as an automatic buying opportunity.
#$1.5BInLeveragedCryptoBetsLiquidated #KOSPIFalls3.53%BackBelow6000 #AmazonSharesFallAbout7%InPremarketTrading

93
·
--
🚨 $BTC
{spot}(BTCUSDT)
CRASH UPDATE – October 30, 2026
BEARISH MARKET
High volatility
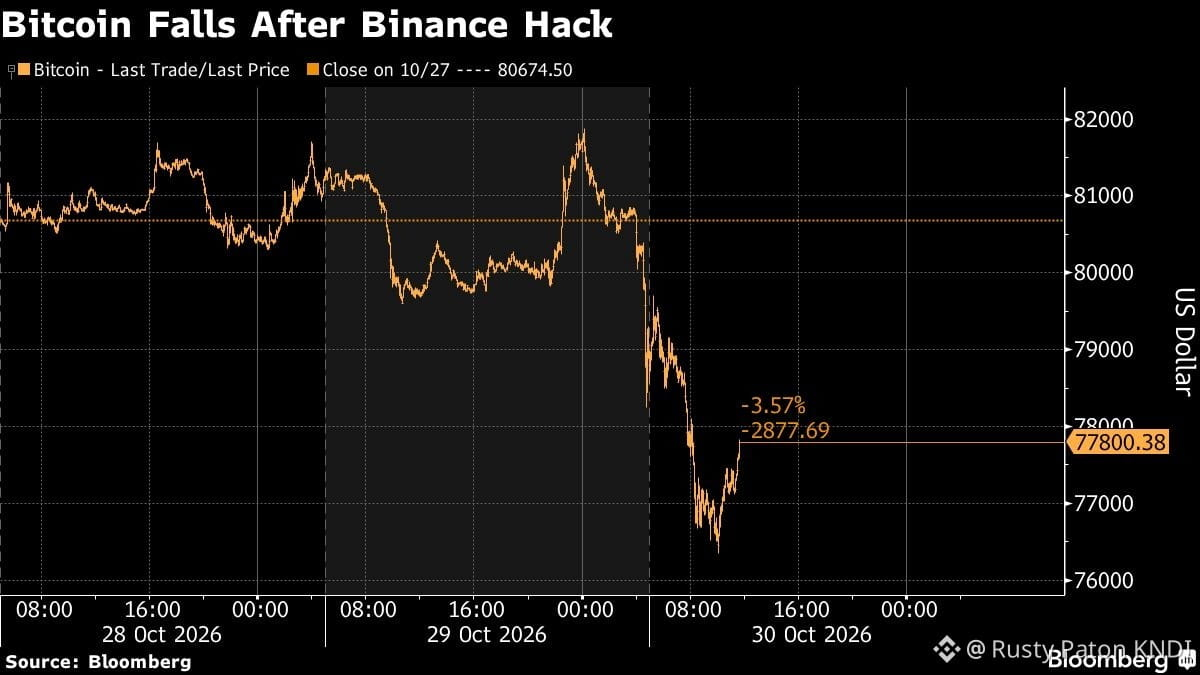
🚨 BITCOIN MARKET CRASH! BTC FALLS BELOW $80,000
Bitcoin is facing heavy selling pressure, dropping to a six-week low of approximately $77,646 on October 30.
📉 Why is Bitcoin falling?
Binance security incident triggered market uncertainty.
More than $1.5 billion in leveraged crypto positions were liquidated.
Heavy selling pressure weakened investor confidence.
📊 Important Price Levels:
Support: $77,000 – $76,000
Major Support: $73,000
Resistance: $80,000 – $82,000
🔮 Market Outlook:
Bitcoin remains under bearish pressure. A recovery above $80,000 could improve sentiment, while a break below $76,000 could increase downside risks.
⚠️ Volatility remains high. Watch the market carefully!
#Bitcoin #BTC #CryptoCrash #BitcoinAnalysis #CryptoMarket #BTCPrice #CryptoNews
📈 Bitcoin price chart
Key market data
Recent six-week low
$77,646
24-hour liquidations
$1.53B
Sources:
Reuters+1
Reuters and CoinDesk, October 30, 2026. Price levels are approximate and can change rapidly.
🚨 $BTC
CRASH UPDATE – October 30, 2026
BEARISH MARKET
High volatility
🚨 BITCOIN MARKET CRASH! BTC FALLS BELOW $80,000
Bitcoin is facing heavy selling pressure, dropping to a six-week low of approximately $77,646 on October 30.
📉 Why is Bitcoin falling?
Binance security incident triggered market uncertainty.
More than $1.5 billion in leveraged crypto positions were liquidated.
Heavy selling pressure weakened investor confidence.
📊 Important Price Levels:
Support: $77,000 – $76,000
Major Support: $73,000
Resistance: $80,000 – $82,000
🔮 Market Outlook:
Bitcoin remains under bearish pressure. A recovery above $80,000 could improve sentiment, while a break below $76,000 could increase downside risks.
⚠️ Volatility remains high. Watch the market carefully!
#Bitcoin #BTC #CryptoCrash #BitcoinAnalysis #CryptoMarket #BTCPrice #CryptoNews
📈 Bitcoin price chart
Key market data
Recent six-week low
$77,646
24-hour liquidations
$1.53B
Sources:
Reuters+1
Reuters and CoinDesk, October 30, 2026. Price levels are approximate and can change rapidly.
78
·
--
Bitcoin $BTC Latest Market Analysis
October 30, 2026 | Market Update
Short-term bearish pressure
$78,600–$78,700
Approximate BTC price based on October 30 market reports.
Bitcoin is facing significant selling pressure after falling below the $80,000 psychological level. The decline has been influenced by a reported Binance security incident, broader market uncertainty, and large-scale crypto liquidations. Bitcoin briefly dropped near $76,460 before recovering toward $78,500.
CoinDesk+1
Key price levels
Support: $76,000 – $77,000
Major support: Around $73,500
Resistance: $80,000 – $81,500
Next resistance: $82,500 – $84,000
Blockchain News+1
🔮 Future outlook
Bullish scenario: A recovery above $81,500 could improve market sentiment.
Bearish scenario: A sustained break below $76,000 could expose Bitcoin to further declines.
Overall: High volatility is expected while market confidence remains weak.
Final analysis
Bitcoin currently shows a cautious, short-term bearish trend. Its ability to defend the $76,000–$77,000 support zone will be important in determining its next move. Long-term direction remains uncertain.
This is market commentary, not financial advice. Cryptocurrency prices can change rapidly.
#$1.5BInLeveragedCryptoBetsLiquidated #KOSPIFalls3.53%BackBelow6000 #AmazonSharesFallAbout7%InPremarketTrading

80
·
--
$BTC
{spot}(BTCUSDT)
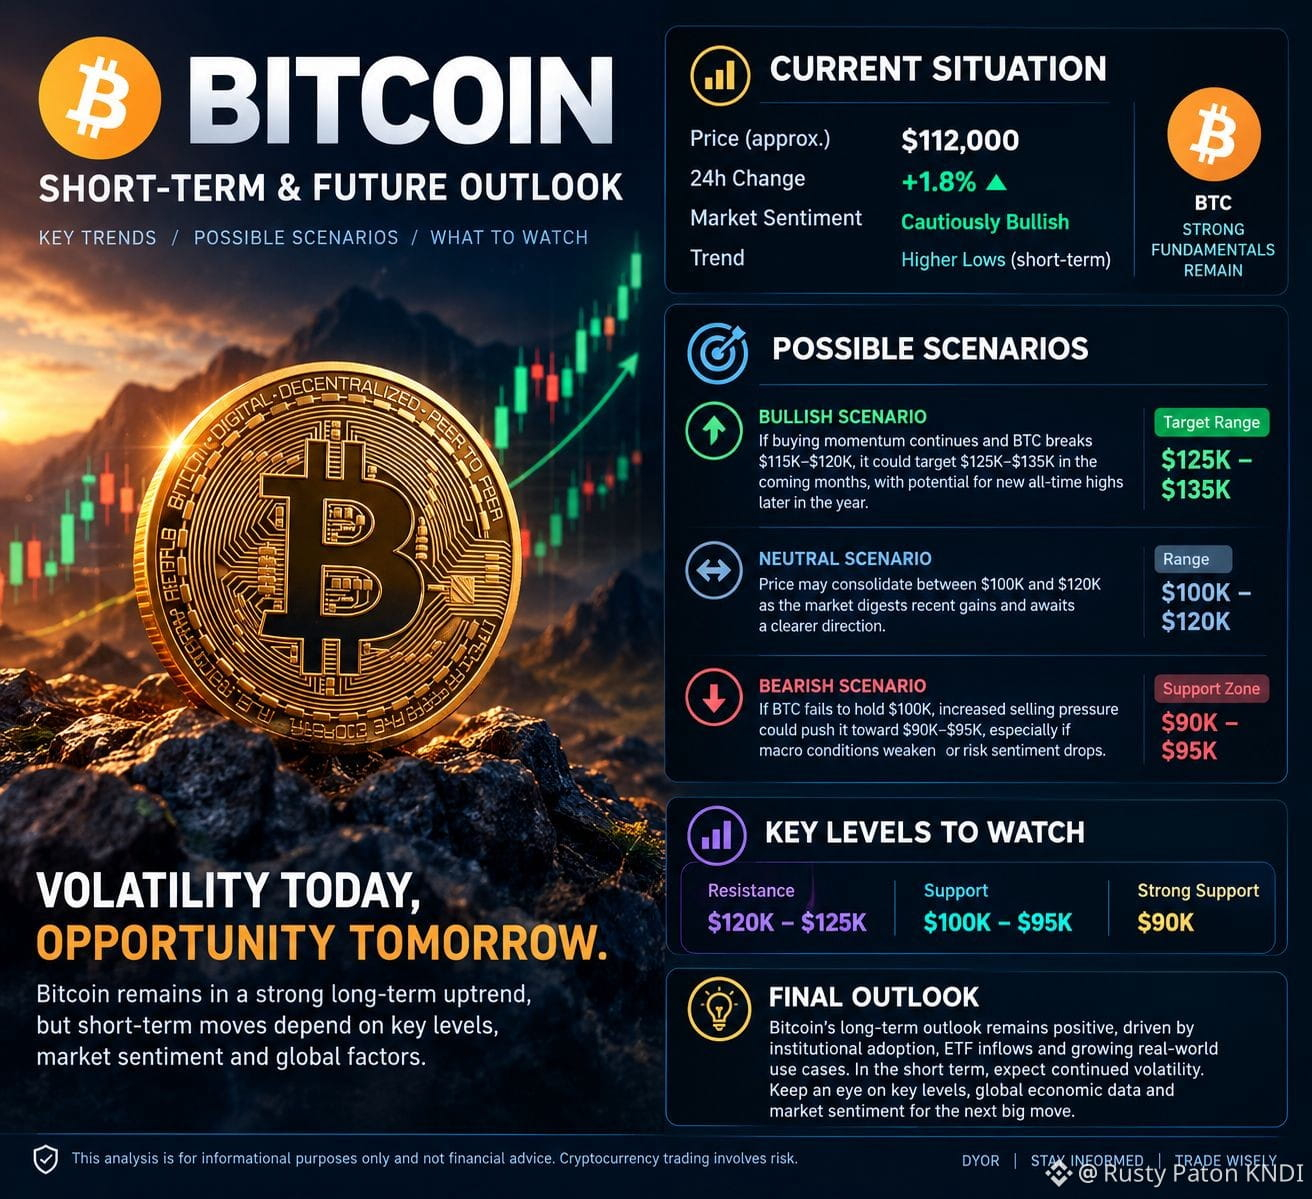
’s long-term outlook remains potentially bullish, supported by institutional adoption and growing market interest. In the short term, BTC may consolidate between $100,000 and $120,000. A breakout above $120,000 could open the door to $125,000–$135,000, while a drop below $100,000 may increase selling pressure toward $90,000–$95,000.
Conclusion: Bitcoin’s future looks promising, but volatility remains high. Watch key support and resistance levels before making investment decisions.#FedWatch #EarningsSeason #BitcoinDropsBelow$80K
$BTC
’s long-term outlook remains potentially bullish, supported by institutional adoption and growing market interest. In the short term, BTC may consolidate between $100,000 and $120,000. A breakout above $120,000 could open the door to $125,000–$135,000, while a drop below $100,000 may increase selling pressure toward $90,000–$95,000.
Conclusion: Bitcoin’s future looks promising, but volatility remains high. Watch key support and resistance levels before making investment decisions.#FedWatch #EarningsSeason #BitcoinDropsBelow$80K
30
·
--
$ACT
{spot}(ACTUSDT)
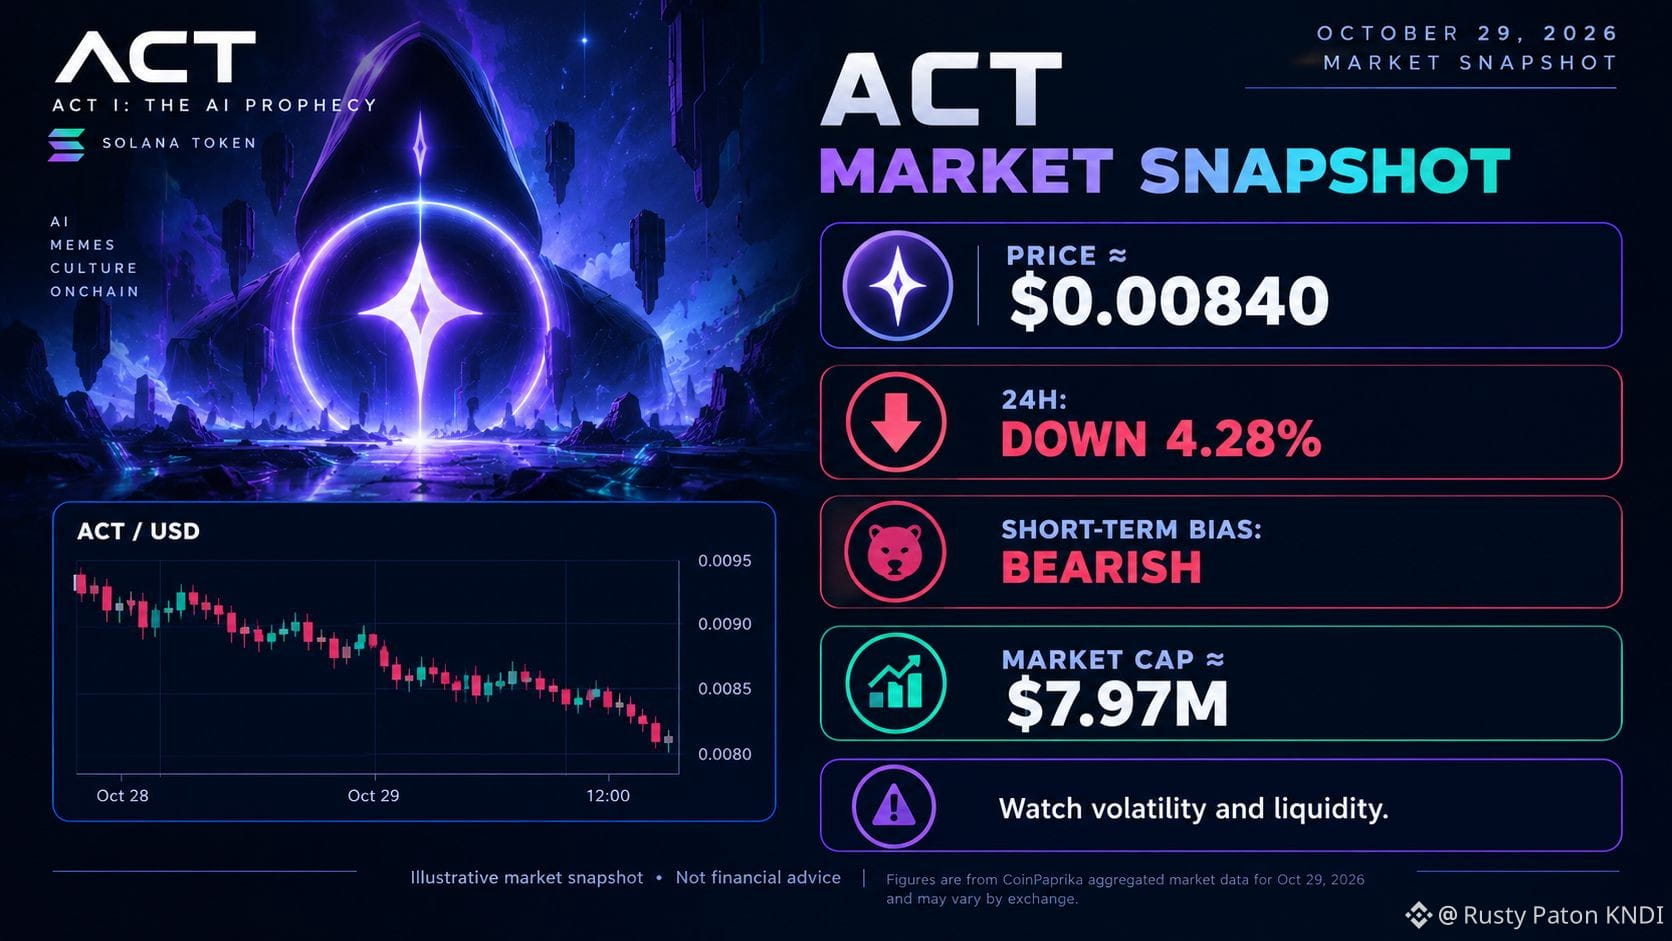
$ACT is a Solana-based token associated with AI and community-driven projects.
Key market data
Current price
$0.00840
24-hour change
−4.28%
Market capitalization
$7.97M
Short-term trend
Bearish
Market outlook: ACT is showing short-term weakness. Its relatively small market capitalization and potential liquidity fluctuations mean prices can be volatile. The next move remains uncertain, so avoid relying on a single indicator.
#FedWatch #EarningsSeason #USMidtermElections
$ACT
$ACT is a Solana-based token associated with AI and community-driven projects.
Key market data
Current price
$0.00840
24-hour change
−4.28%
Market capitalization
$7.97M
Short-term trend
Bearish
Market outlook: ACT is showing short-term weakness. Its relatively small market capitalization and potential liquidity fluctuations mean prices can be volatile. The next move remains uncertain, so avoid relying on a single indicator.
#FedWatch #EarningsSeason #USMidtermElections
211
·
--
$ETC
{spot}(ETCUSDT)
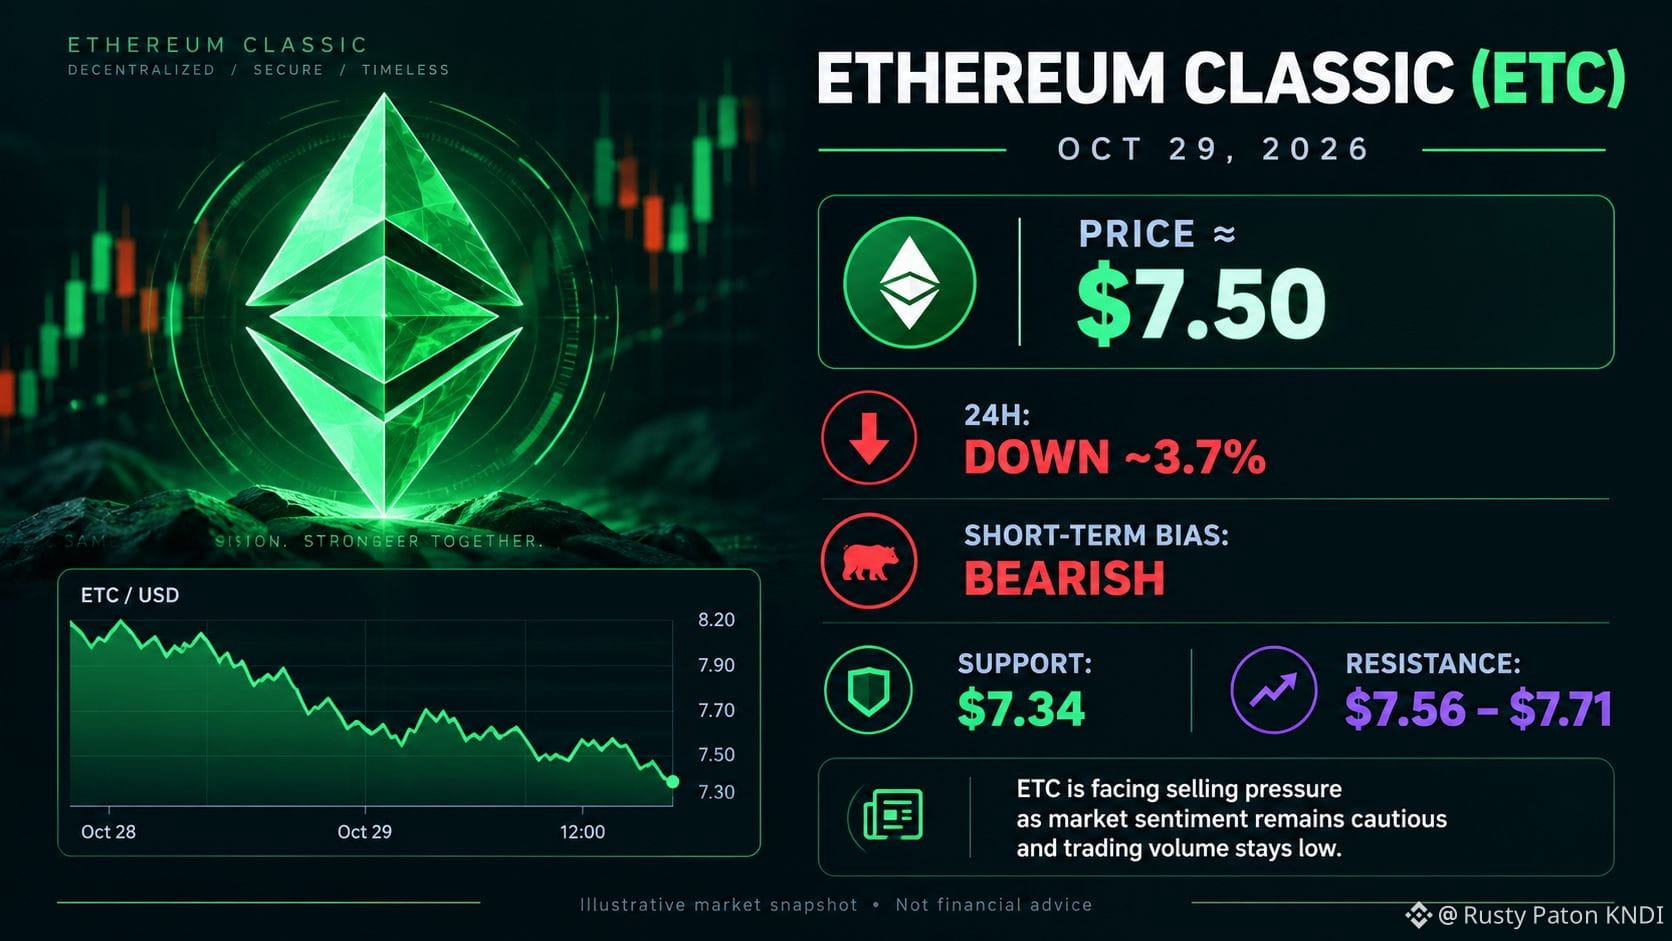
is trading around $7.50, down approximately 3.7% over 24 hours. The short-term trend is bearish, with technical indicators showing continued selling pressure.
CoinMarketCap+1
Key market levels
Current price
$7.50
Support
$7.34–$7.41
Resistance
$7.56–$7.71
Market trend
Bearish
Outlook: ETC may attempt a short-term recovery if it holds support. A break below $7.34 could signal further weakness, while a move above $7.71 would improve the technical picture.
#FedWatch #EarningsSeason #USMidtermElections #StanDruckenmillerBecomesInvestorInTradeXYZ
$ETC
is trading around $7.50, down approximately 3.7% over 24 hours. The short-term trend is bearish, with technical indicators showing continued selling pressure.
CoinMarketCap+1
Key market levels
Current price
$7.50
Support
$7.34–$7.41
Resistance
$7.56–$7.71
Market trend
Bearish
Outlook: ETC may attempt a short-term recovery if it holds support. A break below $7.34 could signal further weakness, while a move above $7.71 would improve the technical picture.
#FedWatch #EarningsSeason #USMidtermElections #StanDruckenmillerBecomesInvestorInTradeXYZ
57
·
--
$ETH is trading near $2,320, down approximately 1–2% over the past 24 hours. Selling pressure across the crypto market and continued outflows from Ethereum ETFs are weighing on sentiment.
crypto.news+1
Key market levels
Current price
$2,320
Support
$2,290
Resistance
$2,385
Short-term trend
Bearish
Market outlook: ETH could attempt a recovery toward $2,385 if buying pressure returns. However, a break below $2,290 could expose it to further downside. These levels are estimates based on today's market analysis, not guarantees.
#FedWatch #EarningsSeason #USMidtermElections #BrazilCryptoExchangesMustApplyForLicensesByFriday

44
·
--
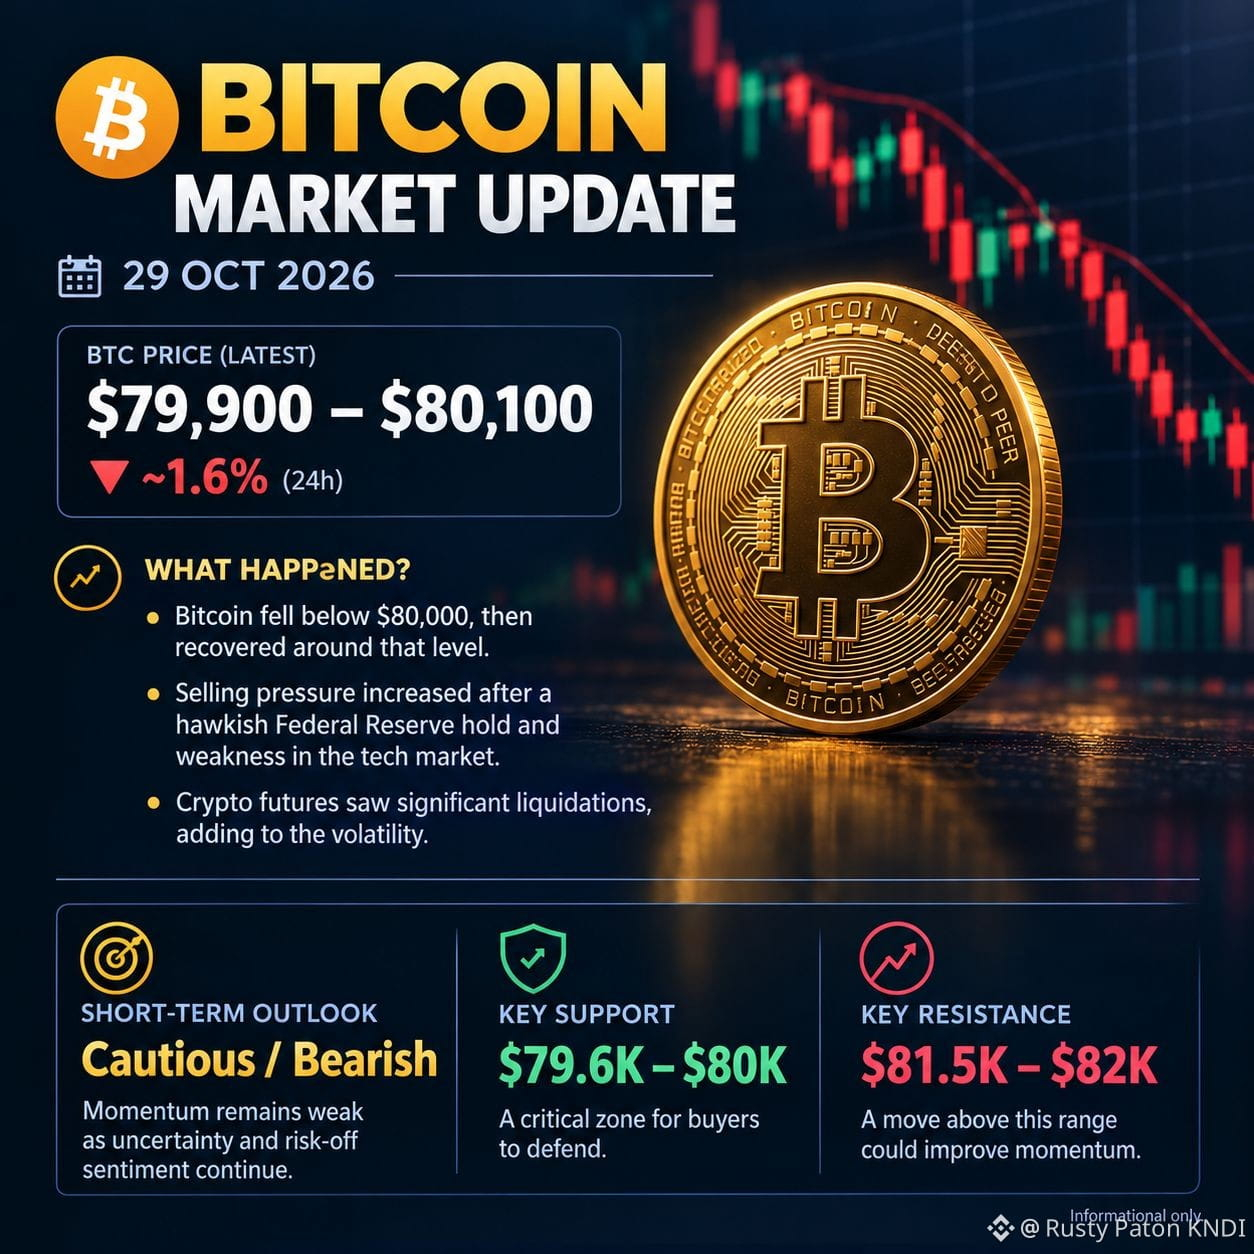
$BTC
{spot}(BTCUSDT)
: Around $80,000
Short-term pressure
Bitcoin fell below $80,000 as technology-market weakness and cautious Federal Reserve signals weighed on crypto prices.
CoinDesk+1
Key market levels
Support: $79,600–$80,000
Resistance: $81,500–$82,000
Trend: Cautious to bearish in the short term.
Outlook: Holding support could allow a recovery, while a sustained drop below it could lead to further weakness.
The Economic Times+1
Conclusion
Bitcoin remains volatile, with $80,000 acting as a key level to watch. The market needs stronger buying momentum to support a sustained recovery.
Informational purposes only, not financial advice. Prices change continuously.#FedWatch #EarningsSeason #BitcoinDropsBelow$80K #USMidtermElections #ICEPartnersWithTradeXYZToBringPerpetualContractsToUS
$BTC
: Around $80,000
Short-term pressure
Bitcoin fell below $80,000 as technology-market weakness and cautious Federal Reserve signals weighed on crypto prices.
CoinDesk+1
Key market levels
Support: $79,600–$80,000
Resistance: $81,500–$82,000
Trend: Cautious to bearish in the short term.
Outlook: Holding support could allow a recovery, while a sustained drop below it could lead to further weakness.
The Economic Times+1
Conclusion
Bitcoin remains volatile, with $80,000 acting as a key level to watch. The market needs stronger buying momentum to support a sustained recovery.
Informational purposes only, not financial advice. Prices change continuously.#FedWatch #EarningsSeason #BitcoinDropsBelow$80K #USMidtermElections #ICEPartnersWithTradeXYZToBringPerpetualContractsToUS
117
Log in to explore more content
Join global crypto users on Binance Square
⚡️ Get latest and useful information about crypto.
💬 Trusted by the world’s largest crypto exchange.
👍 Discover real insights from verified creators.
Email / Phone number
Trending Topics
UniswapA16zSeekDeFiExemptionFromIllinoisCryptoTax
2,133 views
180 Discussing
UNISWAP & a16z PUSH BACK AGAINST CRYPTO TAX RULES — IS DeFi AT A TURNING POINT?
Crypto Pulse Hub
·1 Likes
·119 views
HKDollarStablecoinHKDAPToLaunchOnSolana
251 views
41 Discussing
$1.5BInLeveragedCryptoBetsLiquidated
12,902 views
164 Discussing