
Professor Pump Intel
14 Posts

Professor Pump Intel
Report
Block User
This account is only for Trading and Sharing Trade signals.
Occasional Trader
5 Years
0 Following
21 Followers
31 Liked
Posts
·
--
Bullish
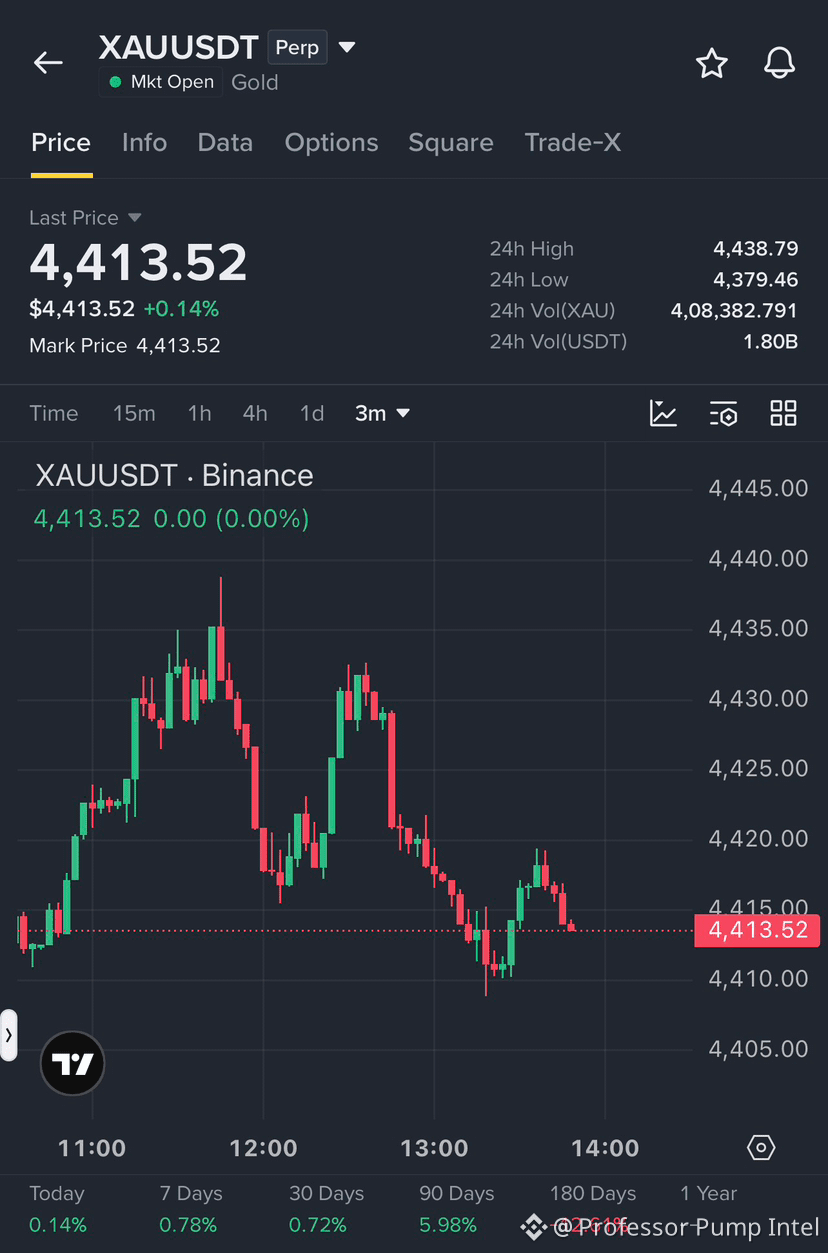
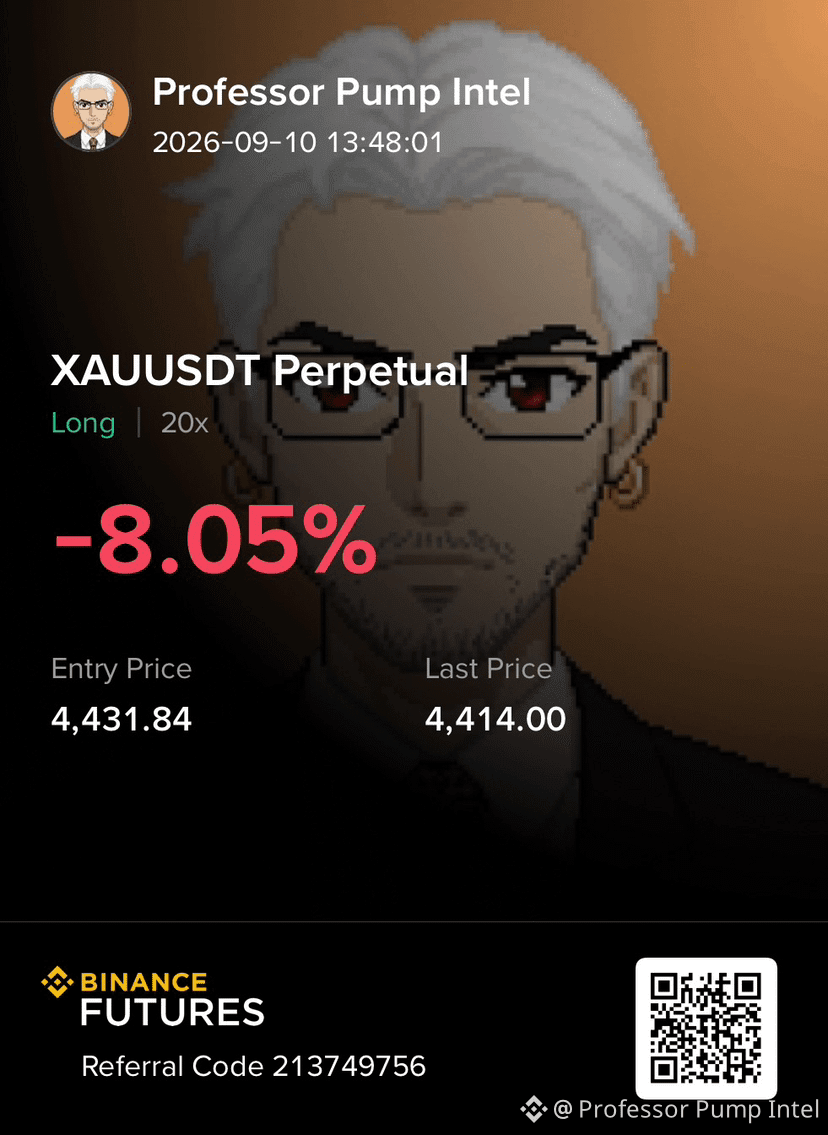
$XAU Shows Fake Breakdown after 4431 and Reversing it after.
$XAU Shows Fake Breakdown after 4431 and Reversing it after.
8
·
--
Bullish
Verified
How Did $ZEC Secure This Massive Pump? 🤔👀
Zcash did not simply wake up one morning and pump. This move looks like the result of multiple catalysts stacking on top of each other, while the chart structure created the conditions for an explosive repricing.
The first major factor is the return of the privacy narrative. Zcash has been benefiting from renewed demand for financial privacy, with shielded usage and shielded supply becoming increasingly important parts of the fundamental story.
Then came the institutional catalyst. Grayscale’s Zcash Trust conversion into the first U.S. spot ZEC ETF gave traditional investors a much easier route to gain exposure to ZEC. That transformed Zcash from an older privacy coin into something the market could suddenly treat as an institutional asset.
The technical structure amplified everything.
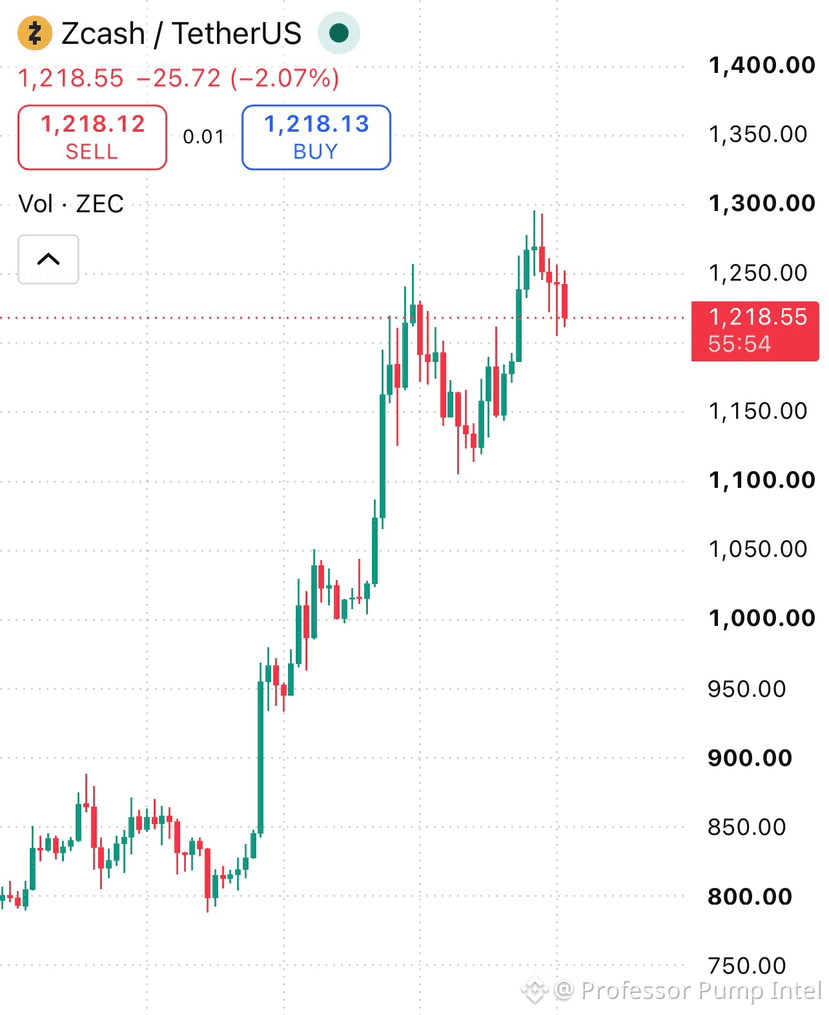
Looking at the chart, ZEC spent significant time building momentum before aggressively breaking through previous resistance zones. Once price cleared the major $800 area and continued toward $1,000, short sellers were forced to cover while momentum traders chased the breakout. Earlier in 2026, ZEC rallies had already produced massive short liquidations, demonstrating how leverage can accelerate an existing trend.
There is also a supply-side argument. ZEC has a fixed 21 million maximum supply, while issuance has been reduced through halvings. At the same time, more ZEC has been moving into shielded pools, potentially reducing immediately available liquid supply.
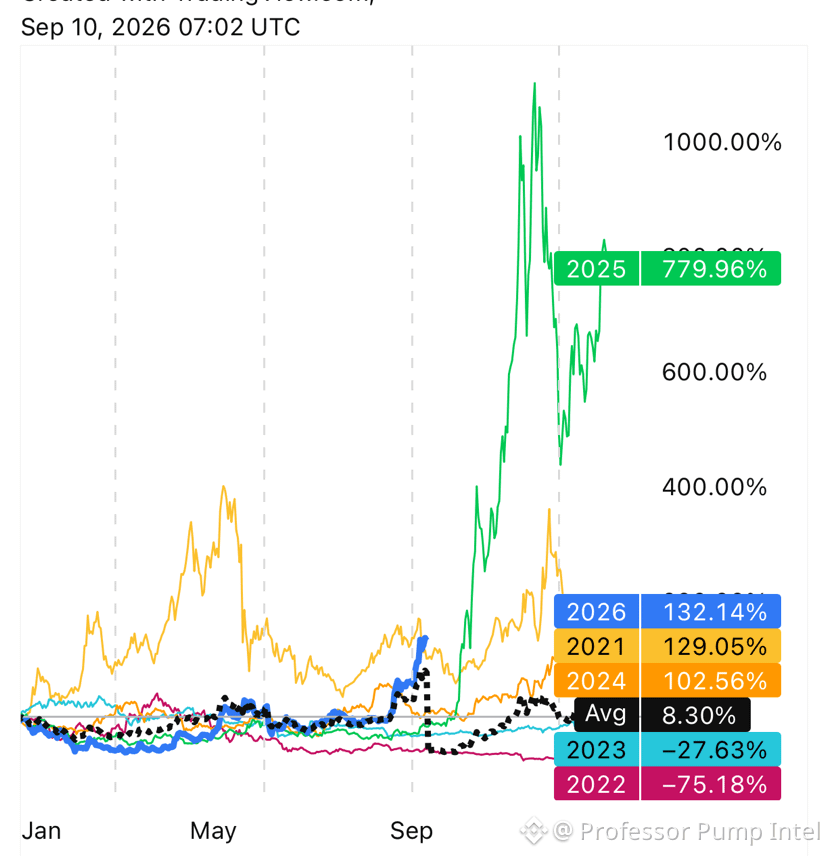
And the second chart tells an even bigger story: 2025 delivered an enormous repricing, while 2026 continued that momentum rather than completely resetting it.
So the pump was not caused by one single headline.
It was the combination of privacy demand + institutional access + reduced issuance + shrinking liquid supply + technical breakout + leverage + short squeezes + an extremely strong market narrative.
That combination is exactly how an old asset can suddenly become the center of the market again.
{future}(ZECUSDT)
#zec #ZECUSDT #zcash #ZECAnalysis
How Did $ZEC Secure This Massive Pump? 🤔👀
Zcash did not simply wake up one morning and pump. This move looks like the result of multiple catalysts stacking on top of each other, while the chart structure created the conditions for an explosive repricing.
The first major factor is the return of the privacy narrative. Zcash has been benefiting from renewed demand for financial privacy, with shielded usage and shielded supply becoming increasingly important parts of the fundamental story.
Then came the institutional catalyst. Grayscale’s Zcash Trust conversion into the first U.S. spot ZEC ETF gave traditional investors a much easier route to gain exposure to ZEC. That transformed Zcash from an older privacy coin into something the market could suddenly treat as an institutional asset.
The technical structure amplified everything.
Looking at the chart, ZEC spent significant time building momentum before aggressively breaking through previous resistance zones. Once price cleared the major $800 area and continued toward $1,000, short sellers were forced to cover while momentum traders chased the breakout. Earlier in 2026, ZEC rallies had already produced massive short liquidations, demonstrating how leverage can accelerate an existing trend.
There is also a supply-side argument. ZEC has a fixed 21 million maximum supply, while issuance has been reduced through halvings. At the same time, more ZEC has been moving into shielded pools, potentially reducing immediately available liquid supply.
And the second chart tells an even bigger story: 2025 delivered an enormous repricing, while 2026 continued that momentum rather than completely resetting it.
So the pump was not caused by one single headline.
It was the combination of privacy demand + institutional access + reduced issuance + shrinking liquid supply + technical breakout + leverage + short squeezes + an extremely strong market narrative.
That combination is exactly how an old asset can suddenly become the center of the market again.
#zec #ZECUSDT #zcash #ZECAnalysis
Zcash did not simply wake up one morning and pump. This move looks like the result of multiple catalysts stacking on top of each other, while the chart structure created the conditions for an explosive repricing.
The first major factor is the return of the privacy narrative. Zcash has been benefiting from renewed demand for financial privacy, with shielded usage and shielded supply becoming increasingly important parts of the fundamental story.
Then came the institutional catalyst. Grayscale’s Zcash Trust conversion into the first U.S. spot ZEC ETF gave traditional investors a much easier route to gain exposure to ZEC. That transformed Zcash from an older privacy coin into something the market could suddenly treat as an institutional asset.
The technical structure amplified everything.
Looking at the chart, ZEC spent significant time building momentum before aggressively breaking through previous resistance zones. Once price cleared the major $800 area and continued toward $1,000, short sellers were forced to cover while momentum traders chased the breakout. Earlier in 2026, ZEC rallies had already produced massive short liquidations, demonstrating how leverage can accelerate an existing trend.
There is also a supply-side argument. ZEC has a fixed 21 million maximum supply, while issuance has been reduced through halvings. At the same time, more ZEC has been moving into shielded pools, potentially reducing immediately available liquid supply.
And the second chart tells an even bigger story: 2025 delivered an enormous repricing, while 2026 continued that momentum rather than completely resetting it.
So the pump was not caused by one single headline.
It was the combination of privacy demand + institutional access + reduced issuance + shrinking liquid supply + technical breakout + leverage + short squeezes + an extremely strong market narrative.
That combination is exactly how an old asset can suddenly become the center of the market again.
#zec #ZECUSDT #zcash #ZECAnalysis

1
1
142
·
--
Bearish
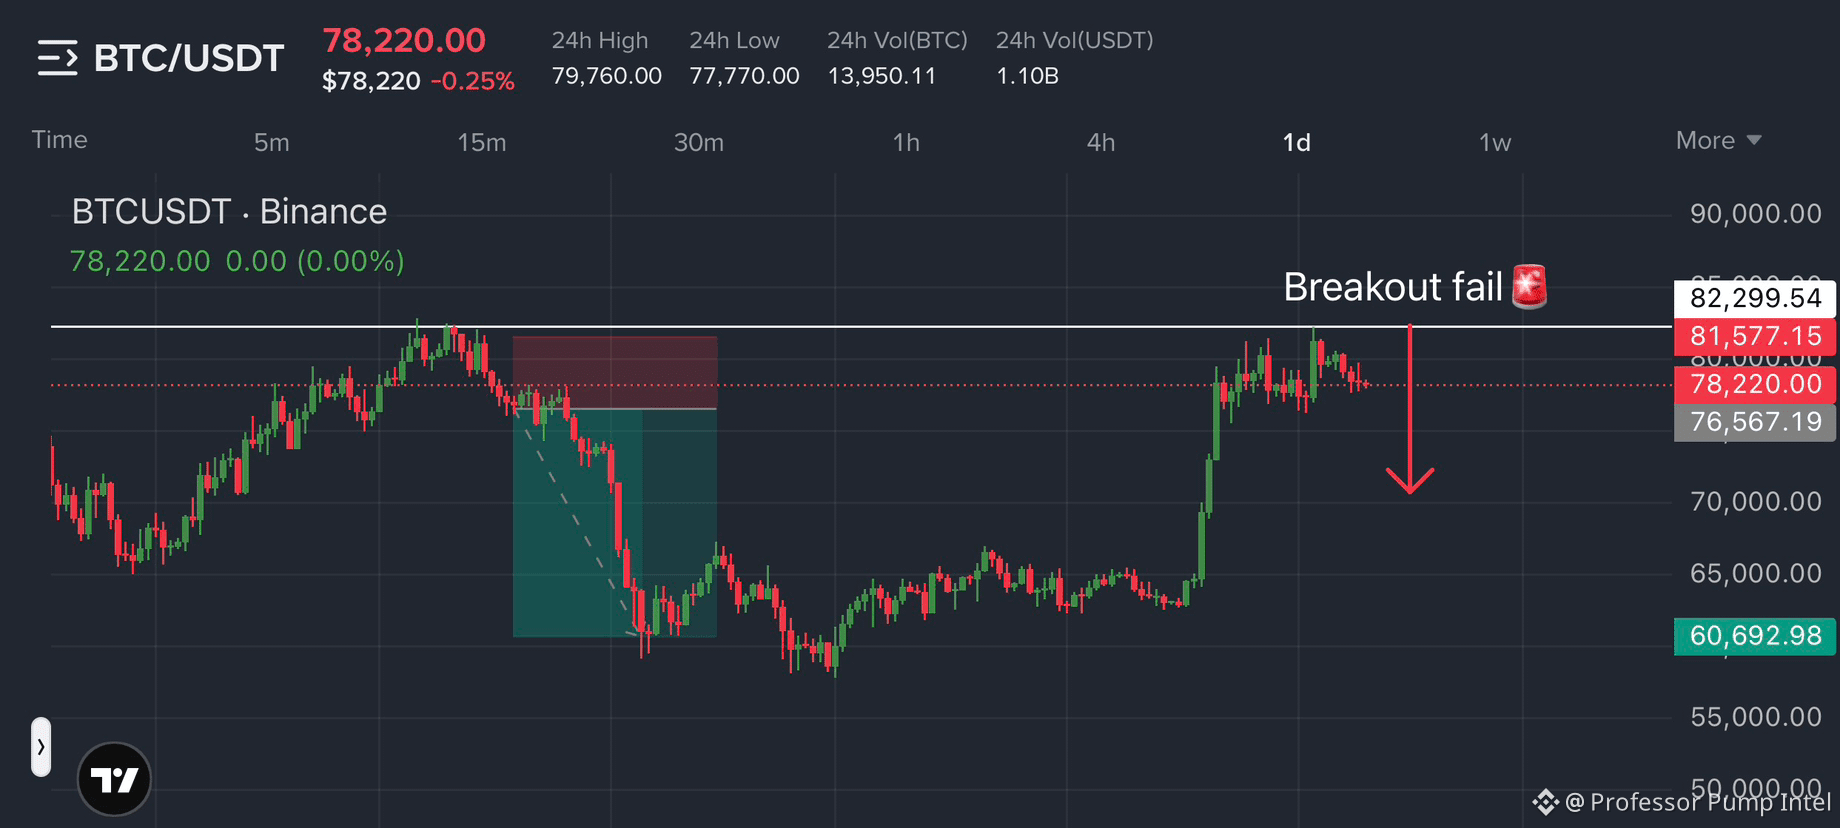
🚨 Another Bearish Wave for $BTC After Breakout Fail 🔻🔻🔻🔻
Bitcoin is showing a clear rejection from the $81,500 to $82,300 resistance zone, and the daily chart is now presenting a technically important decision point. After a strong recovery from the $60,692 area, BTC pushed into resistance but failed to establish a convincing breakout. The latest candles suggest that buyers are losing momentum near the highs, while sellers are attempting to reclaim control.
The key level to watch is $81,577. A daily close above this area, followed by a successful retest, would weaken the bearish setup and could open the door toward $82,300 and potentially higher levels. Until that happens, the failed breakout remains a warning that the market may be preparing for a deeper correction.
On the downside, $78,220 is the immediate area of interest. A decisive break below this level could accelerate selling toward $76,567, which is the next important support visible on the chart. If that support also fails, the recovery structure would face significantly greater pressure.
The chart is not confirming a major breakdown yet, but the risk of further downside is increasing. Traders should watch the daily closes carefully rather than assuming the rejection guarantees a collapse.
Key levels:
Resistance: $81,577 to $82,300
Support: $78,220 and $76,567
Bias: Bearish below resistance, bullish only after confirmed breakout.
Click here 👉 $BTC 👈 to Trade.
#bitcoin #btcbreakdown #BTCUSDT #FailedBreakout #analysis
🚨 Another Bearish Wave for $BTC After Breakout Fail 🔻🔻🔻🔻
Bitcoin is showing a clear rejection from the $81,500 to $82,300 resistance zone, and the daily chart is now presenting a technically important decision point. After a strong recovery from the $60,692 area, BTC pushed into resistance but failed to establish a convincing breakout. The latest candles suggest that buyers are losing momentum near the highs, while sellers are attempting to reclaim control.
The key level to watch is $81,577. A daily close above this area, followed by a successful retest, would weaken the bearish setup and could open the door toward $82,300 and potentially higher levels. Until that happens, the failed breakout remains a warning that the market may be preparing for a deeper correction.
On the downside, $78,220 is the immediate area of interest. A decisive break below this level could accelerate selling toward $76,567, which is the next important support visible on the chart. If that support also fails, the recovery structure would face significantly greater pressure.
The chart is not confirming a major breakdown yet, but the risk of further downside is increasing. Traders should watch the daily closes carefully rather than assuming the rejection guarantees a collapse.
Key levels:
Resistance: $81,577 to $82,300
Support: $78,220 and $76,567
Bias: Bearish below resistance, bullish only after confirmed breakout.
Click here 👉 $BTC 👈 to Trade.
#bitcoin #btcbreakdown #BTCUSDT #FailedBreakout #analysis
Bitcoin is showing a clear rejection from the $81,500 to $82,300 resistance zone, and the daily chart is now presenting a technically important decision point. After a strong recovery from the $60,692 area, BTC pushed into resistance but failed to establish a convincing breakout. The latest candles suggest that buyers are losing momentum near the highs, while sellers are attempting to reclaim control.
The key level to watch is $81,577. A daily close above this area, followed by a successful retest, would weaken the bearish setup and could open the door toward $82,300 and potentially higher levels. Until that happens, the failed breakout remains a warning that the market may be preparing for a deeper correction.
On the downside, $78,220 is the immediate area of interest. A decisive break below this level could accelerate selling toward $76,567, which is the next important support visible on the chart. If that support also fails, the recovery structure would face significantly greater pressure.
The chart is not confirming a major breakdown yet, but the risk of further downside is increasing. Traders should watch the daily closes carefully rather than assuming the rejection guarantees a collapse.
Key levels:
Resistance: $81,577 to $82,300
Support: $78,220 and $76,567
Bias: Bearish below resistance, bullish only after confirmed breakout.
Click here 👉 $BTC 👈 to Trade.
#bitcoin #btcbreakdown #BTCUSDT #FailedBreakout #analysis
4
4
260
·
--
Bullish
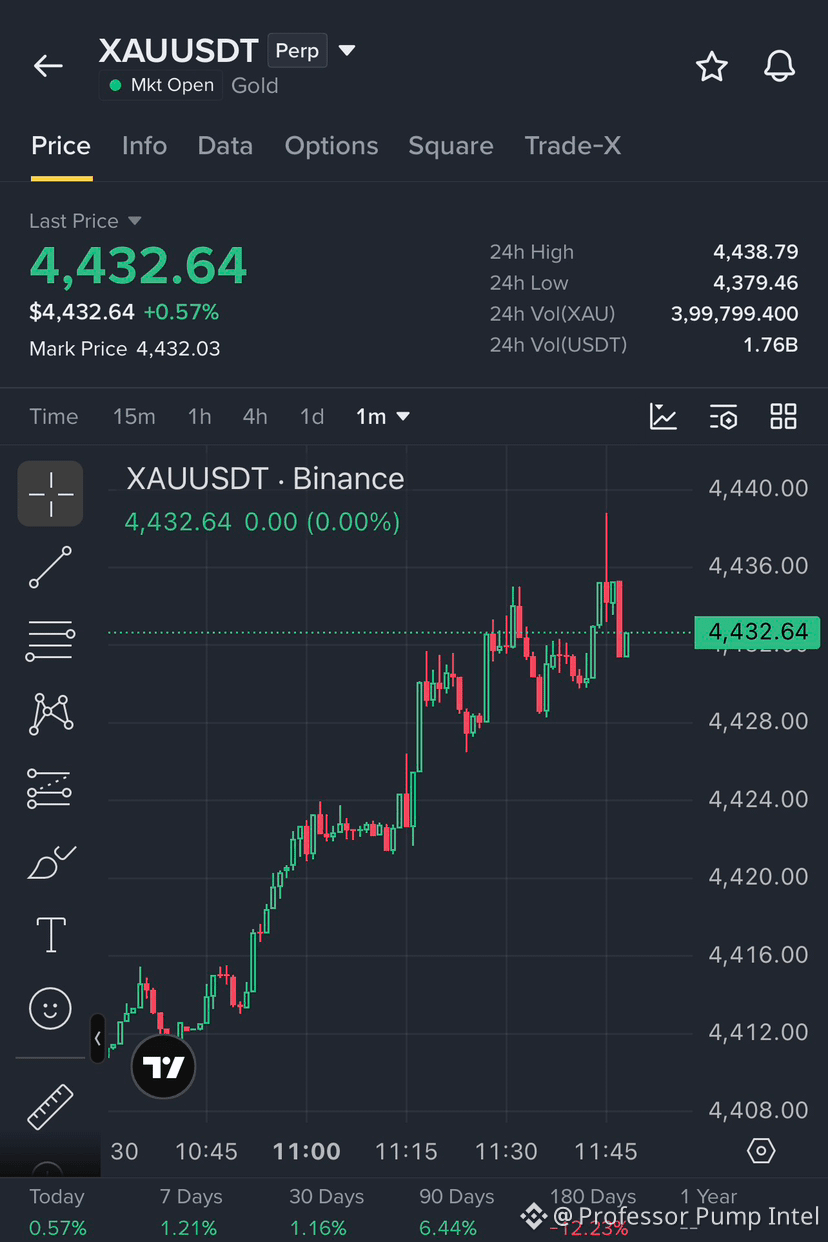
Going in Long Position on $XAU at 1min Timeframe, am i Stupid for this one?😂
Going in Long Position on $XAU at 1min Timeframe, am i Stupid for this one?😂

110
·
--
Bearish
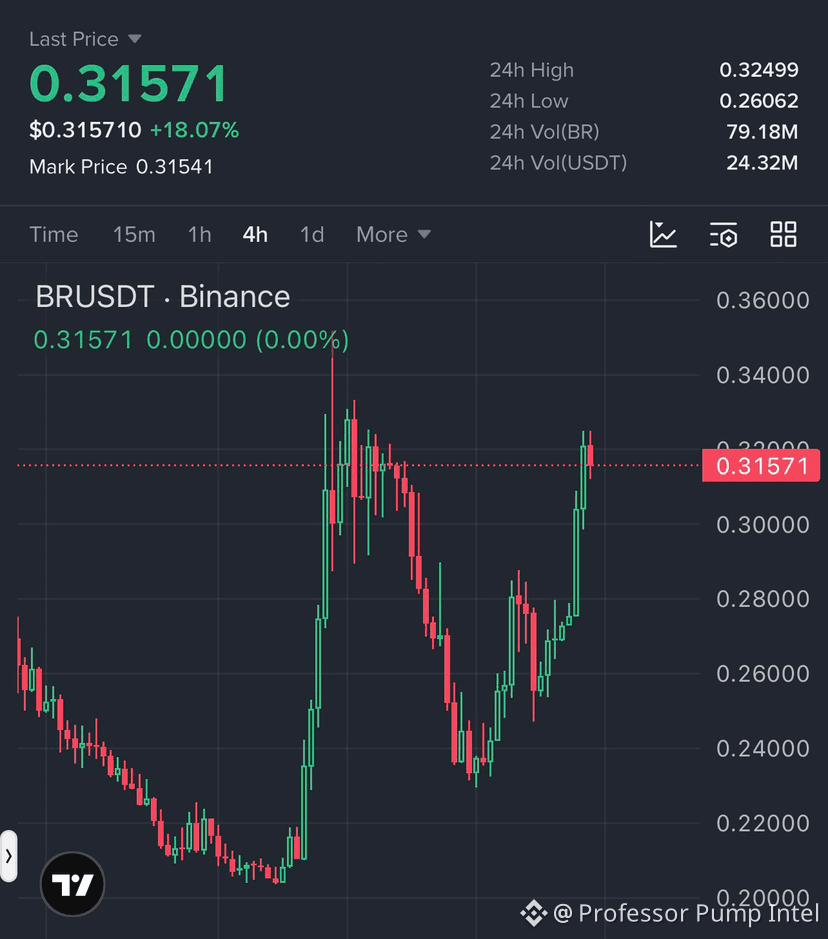
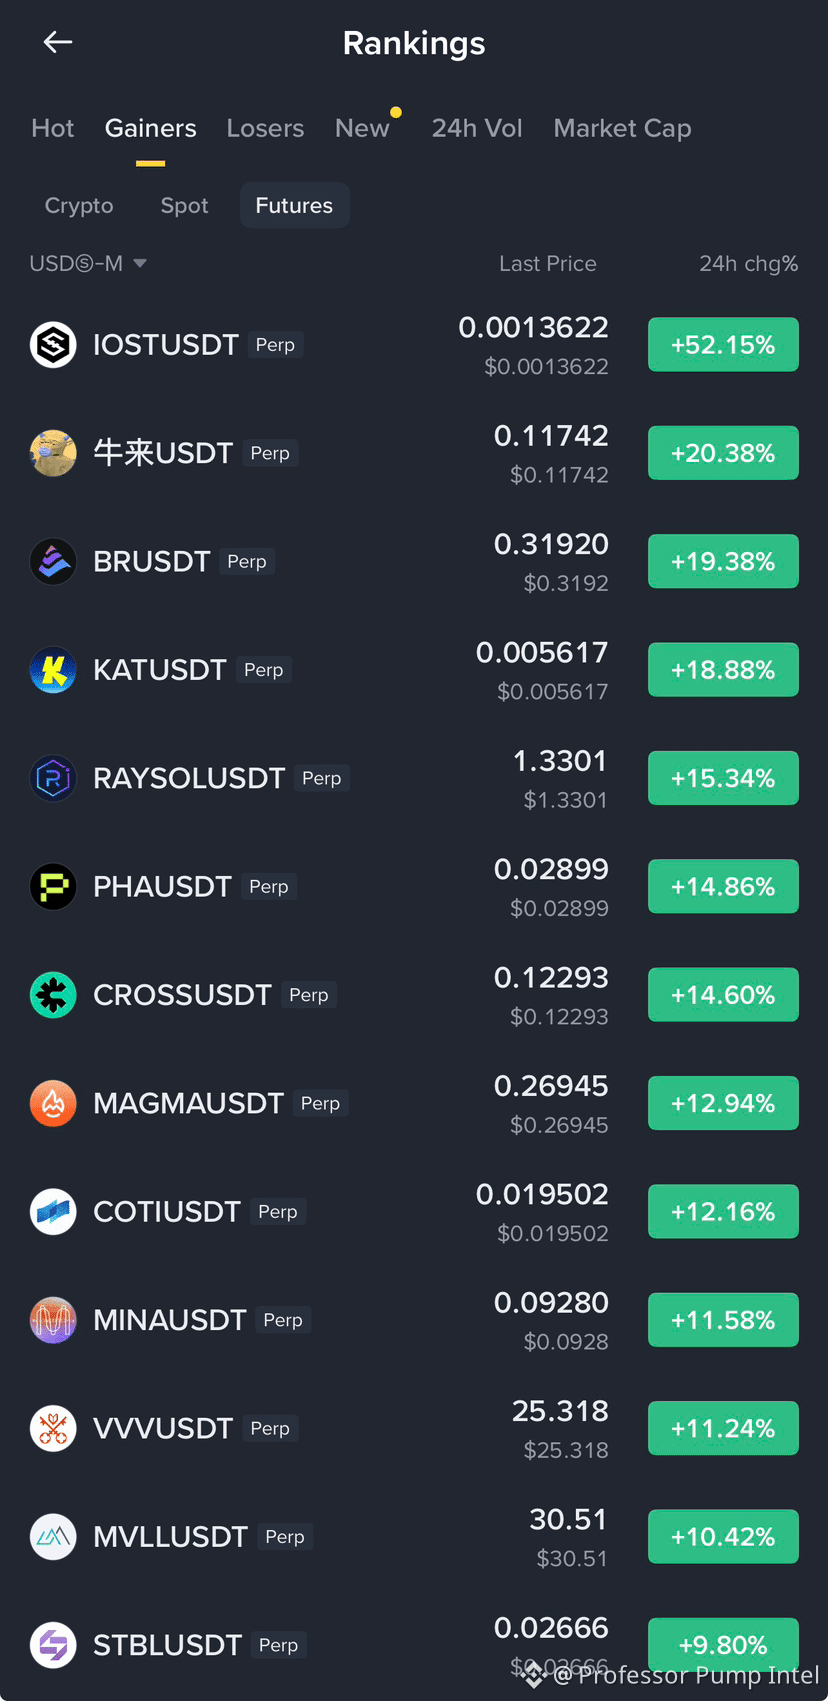
🚨 Sharp Rejection from $BR Right now! 🚨
Keep the target at 0.24 and Lets take a Entry around 0.32-0.31$ Don’t be late on this one please guys.
{future}(BRUSDT)
🚨 Sharp Rejection from $BR Right now! 🚨
Keep the target at 0.24 and Lets take a Entry around 0.32-0.31$ Don’t be late on this one please guys.
Keep the target at 0.24 and Lets take a Entry around 0.32-0.31$ Don’t be late on this one please guys.
63
·
--
Bearish
Listen here everyone……..pay attention for 1 min.
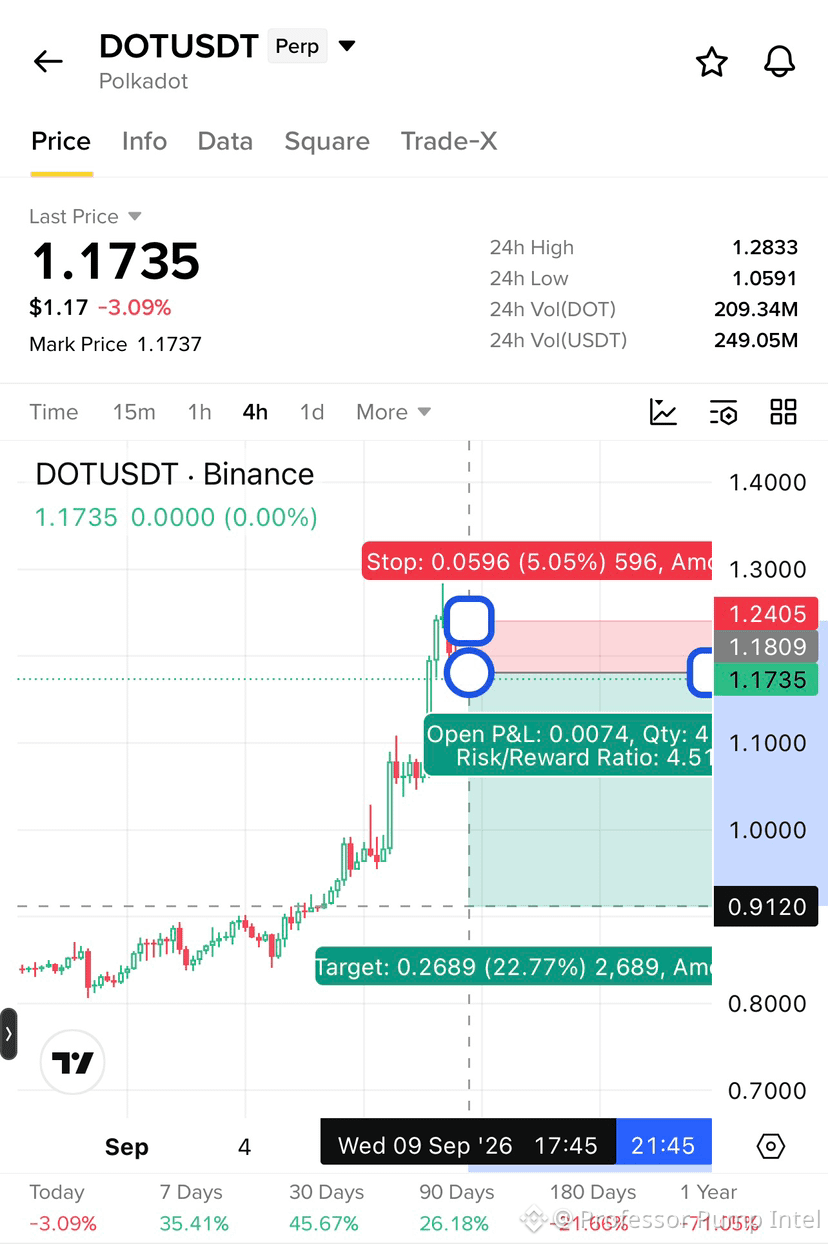
Do you see whats happening on $DOT chart here? Look at this sharp rejection it has been facing on top after securing 1$ price zone. I think it is the by far best short opportunity for everyone.
Short Trading Plan: 4h TF 📉
Entry: 1.18$-1.19$
Target: 1$ / 0.95$ / 0.9$
Stoploss: Above 1.25$
Follow me for Daily Trading Signals.😤
{future}(DOTUSDT)
#dot #bearishmomentum
Listen here everyone……..pay attention for 1 min.
Do you see whats happening on $DOT chart here? Look at this sharp rejection it has been facing on top after securing 1$ price zone. I think it is the by far best short opportunity for everyone.
Short Trading Plan: 4h TF 📉
Entry: 1.18$-1.19$
Target: 1$ / 0.95$ / 0.9$
Stoploss: Above 1.25$
Follow me for Daily Trading Signals.😤
#dot #bearishmomentum
Do you see whats happening on $DOT chart here? Look at this sharp rejection it has been facing on top after securing 1$ price zone. I think it is the by far best short opportunity for everyone.
Short Trading Plan: 4h TF 📉
Entry: 1.18$-1.19$
Target: 1$ / 0.95$ / 0.9$
Stoploss: Above 1.25$
Follow me for Daily Trading Signals.😤
#dot #bearishmomentum
86
·
--
Bullish
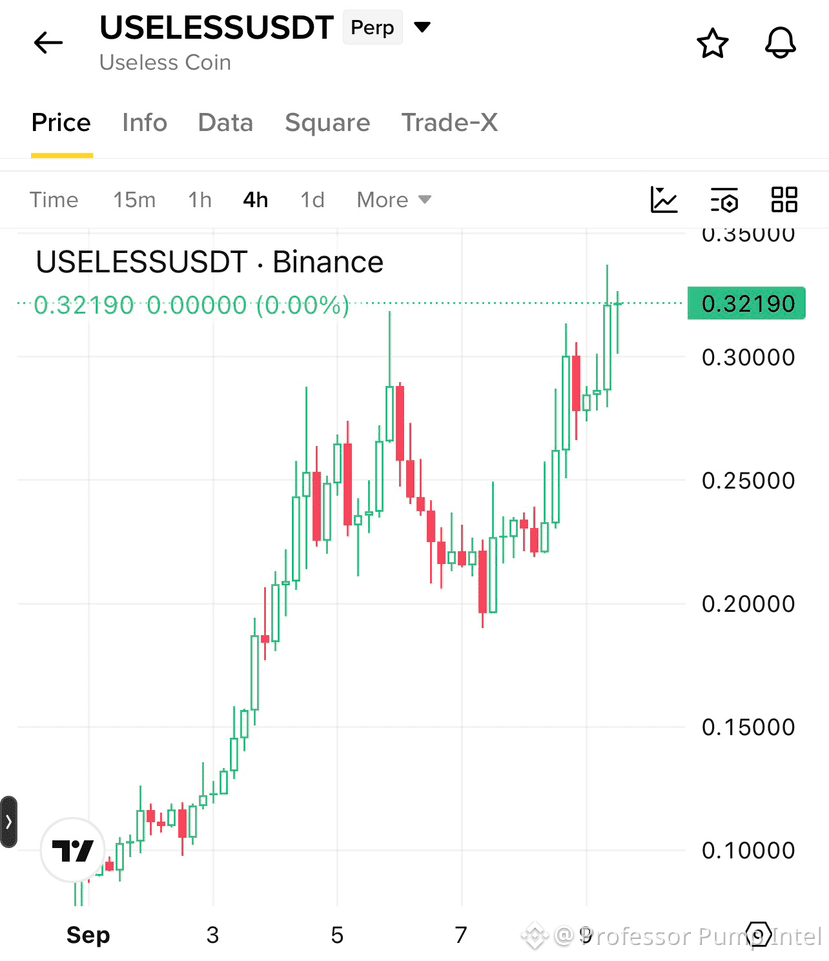
Don’t get Confused by the name $USELESS 😂
The gain it has been getting constantly is insanly impressive over past fewdays and i honestly think that it can surpass 1$ Price zone very soon.
My take would be: Entry at 0.32 - 0.31 and then keeping the target by around 0.4$/0.6$ anywhere in that gap is perfect i would say.
Main thing, maintain your stoploss according to your leverage and risk taking capacity.
Follow me for Daily Trading Content.
{future}(USELESSUSDT)
#useless #GrayscaleZcashETFTops$500M
Don’t get Confused by the name $USELESS 😂
The gain it has been getting constantly is insanly impressive over past fewdays and i honestly think that it can surpass 1$ Price zone very soon.
My take would be: Entry at 0.32 - 0.31 and then keeping the target by around 0.4$/0.6$ anywhere in that gap is perfect i would say.
Main thing, maintain your stoploss according to your leverage and risk taking capacity.
Follow me for Daily Trading Content.
#useless #GrayscaleZcashETFTops$500M
The gain it has been getting constantly is insanly impressive over past fewdays and i honestly think that it can surpass 1$ Price zone very soon.
My take would be: Entry at 0.32 - 0.31 and then keeping the target by around 0.4$/0.6$ anywhere in that gap is perfect i would say.
Main thing, maintain your stoploss according to your leverage and risk taking capacity.
Follow me for Daily Trading Content.
#useless #GrayscaleZcashETFTops$500M
196
Log in to explore more content
Join global crypto users on Binance Square
⚡️ Get latest and useful information about crypto.
💬 Trusted by the world’s largest crypto exchange.
👍 Discover real insights from verified creators.
Email / Phone number
Trending Topics
AppleDebutsFoldablePhone
23,663 views
487 Discussing
Apple just dropped the foldable iPhone — and the market is paying attention. This isn't just another product cycle; it's a new product category, a new CEO on stage, and a $1,999 price tag that pushes $AAPL further into ultra-premium territory. Foldables are the narrative, and Apple is now the headline.
#appledebutsfoldablephone #EUExtendsCentralContactPointToCASPs #US10YTreasuryYieldHitsHighestSinceNov2023 #BrentCrudeTops$100 #USTreasuryToBuyBackUpTo$6BLongDatedDebt
KimHotbae
·2 Likes
·2.7k views
TSMCAugustRevenueUp53.3%YoY
0 views
23 Discussing
IranSaysReadyToEscalateWarWithUS
1,819 views
81 Discussing