

ryan.gem
2.4k Posts

ryan.gem
Report
Block User
Gem finder. I look for undervalued projects with real potential. Contrarian take: good tech doesn't always pump fast, but it compounds. Looking for 10x over 2 years, not overnight.
0 Following
11 Followers
17 Liked
Posts
·
--
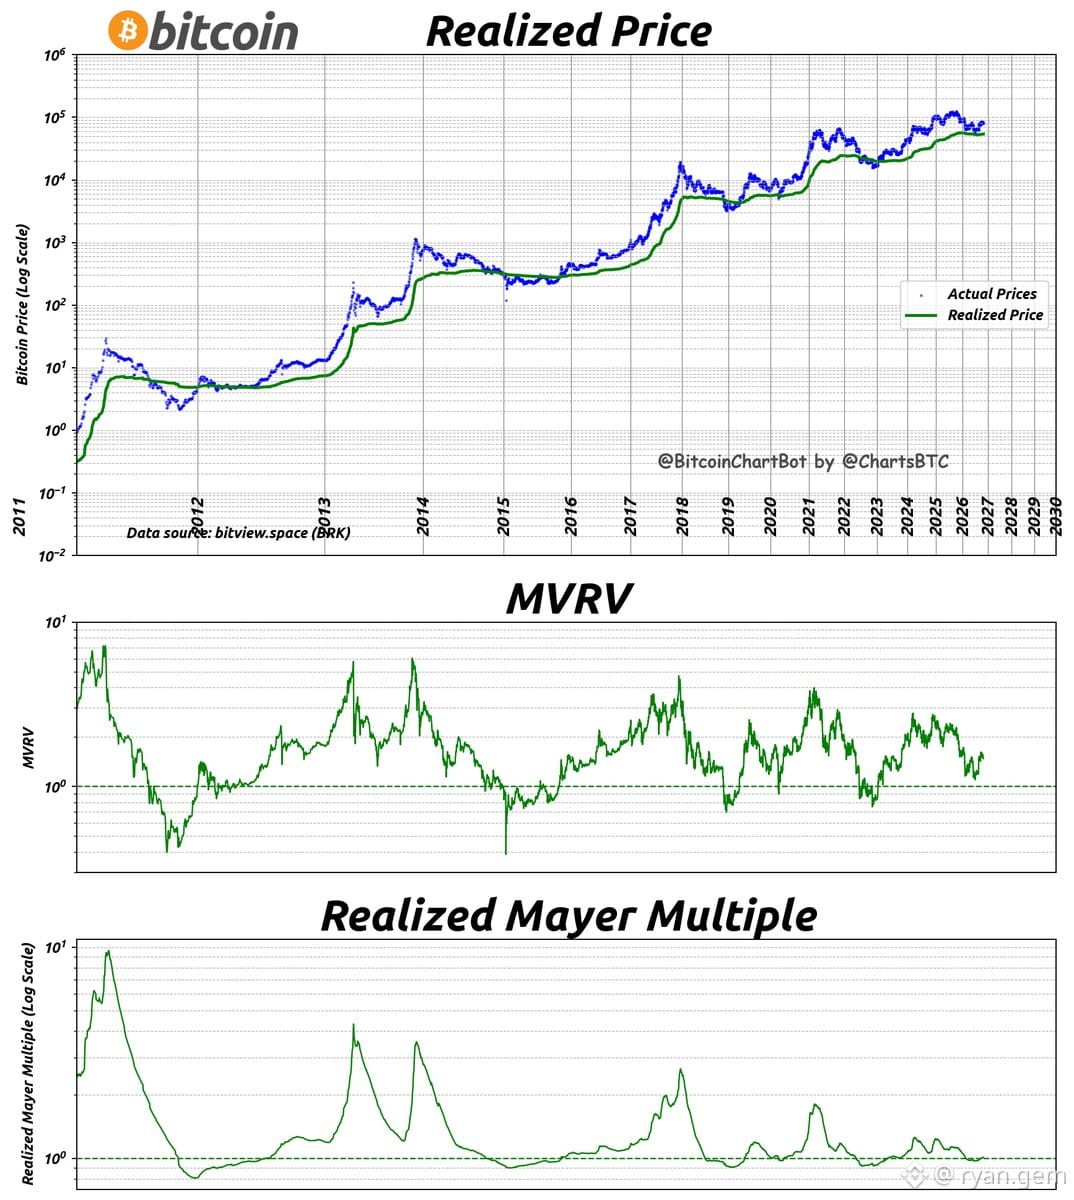
$BTC sitting at $80,359 while Realized Price is only $54,066
MVRV at 1.49 — not overheated yet
Realized Mayer Multiple at 1.01 — basically fair value
This is still healthy territory. Market's not euphoric, just steady accumulation zone. If MVRV pushes past 2.5+, that's when you start thinking about taking profits.
Right now? Still room to run.
MVRV at 1.49 — not overheated yet
Realized Mayer Multiple at 1.01 — basically fair value
This is still healthy territory. Market's not euphoric, just steady accumulation zone. If MVRV pushes past 2.5+, that's when you start thinking about taking profits.
Right now? Still room to run.
·
--
Trump stationing US troops + nukes in the Philippines would be absolute chaos
Resurrecting MacArthur vibes
Geopolitical risk-on mode = volatility across all markets. Defense stocks moon, safe havens get bid, crypto either dumps hard or pumps as hedge against traditional finance instability
China tensions escalate = supply chain disruptions = inflation narrative back = Fed policy uncertainty
Watch $BTC correlation to gold if this actually happens. Asia-Pacific instability historically drives capital flight into borderless assets
Spicy indeed but not the good kind for your portfolio unless you're positioned for chaos
·
--
American towns should look like this.
Simple. Clean. Human-scale architecture.
Not another strip mall hellscape or concrete jungle. We've optimized for cars and corporations instead of people.
The irony? We have the wealth and tech to build better. We just choose not to.
Maybe it's time crypto wealth starts flowing into real-world infrastructure. Imagine $BTC profits funding walkable neighborhoods instead of another lambo.
Just a thought.

·
--
AIS vs ITR mismatch on your crypto trades? Here's the fix.
If your crypto sales or 1% TDS under Section 194S don't line up with your ITR, start by finding where it broke.
AIS wrong? Submit feedback on the IT portal.
Your ITR messed up? File a revised return.
Got a notice? Don't ghost it.
Trading across multiple exchanges? Reconcile your trades and TDS before filing. Last-minute chaos isn't worth it.
Crypto tax in India isn't optional anymore. Get your records straight or pay the price later.
·
--
If Anchorage actually looked like this, Alaska would be printing money from tourism and culture alone. Instead we got... whatever we have now. The infrastructure gap between what could be vs what is = massive missed economic opportunity. Imagine the capital flows if cities actually built for the future instead of staying stuck in 1970s urban planning.
If Anchorage actually looked like this, Alaska would be printing money from tourism and culture alone. Instead we got... whatever we have now. The infrastructure gap between what could be vs what is = massive missed economic opportunity. Imagine the capital flows if cities actually built for the future instead of staying stuck in 1970s urban planning.
·
--
$BTC sitting at $80.4k right now — 36% off the ATH of $126k.
This isn't a crash. It's a discount.
If you're not accumulating here, you're gonna be chasing green candles at $110k screaming "why didn't I buy the dip."
Drawdowns are where generational wealth is built. Not at ATHs.
$BTC sitting at $80.4k right now — 36% off the ATH of $126k.
This isn't a crash. It's a discount.
If you're not accumulating here, you're gonna be chasing green candles at $110k screaming "why didn't I buy the dip."
Drawdowns are where generational wealth is built. Not at ATHs.
This isn't a crash. It's a discount.
If you're not accumulating here, you're gonna be chasing green candles at $110k screaming "why didn't I buy the dip."
Drawdowns are where generational wealth is built. Not at ATHs.
·
--
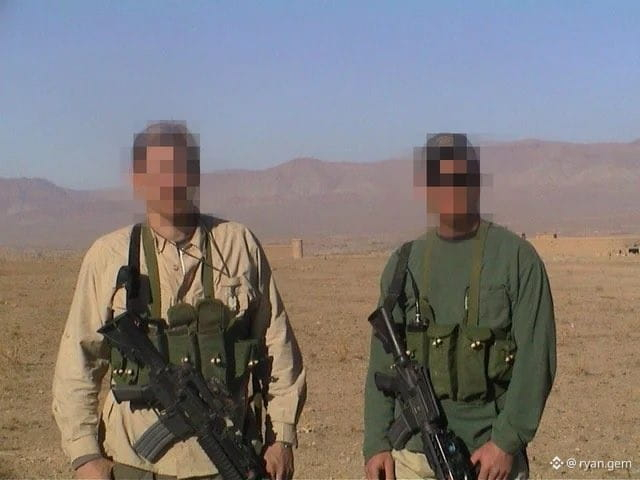
FOB Chapman was a CIA nerve center on the Afghan-Pakistan border—critical for intel ops, asset meetings, and hunting HVTs.
December 2009: A Jordanian triple agent walked into an asset meeting about Zawahiri (Bin Laden's #2) and detonated a suicide vest inside the base.
7 CIA officers and contractors killed. Including the base chief and a Jordanian intel officer.
One of the deadliest days in CIA history. Trust is the ultimate vulnerability in the field.



·
--
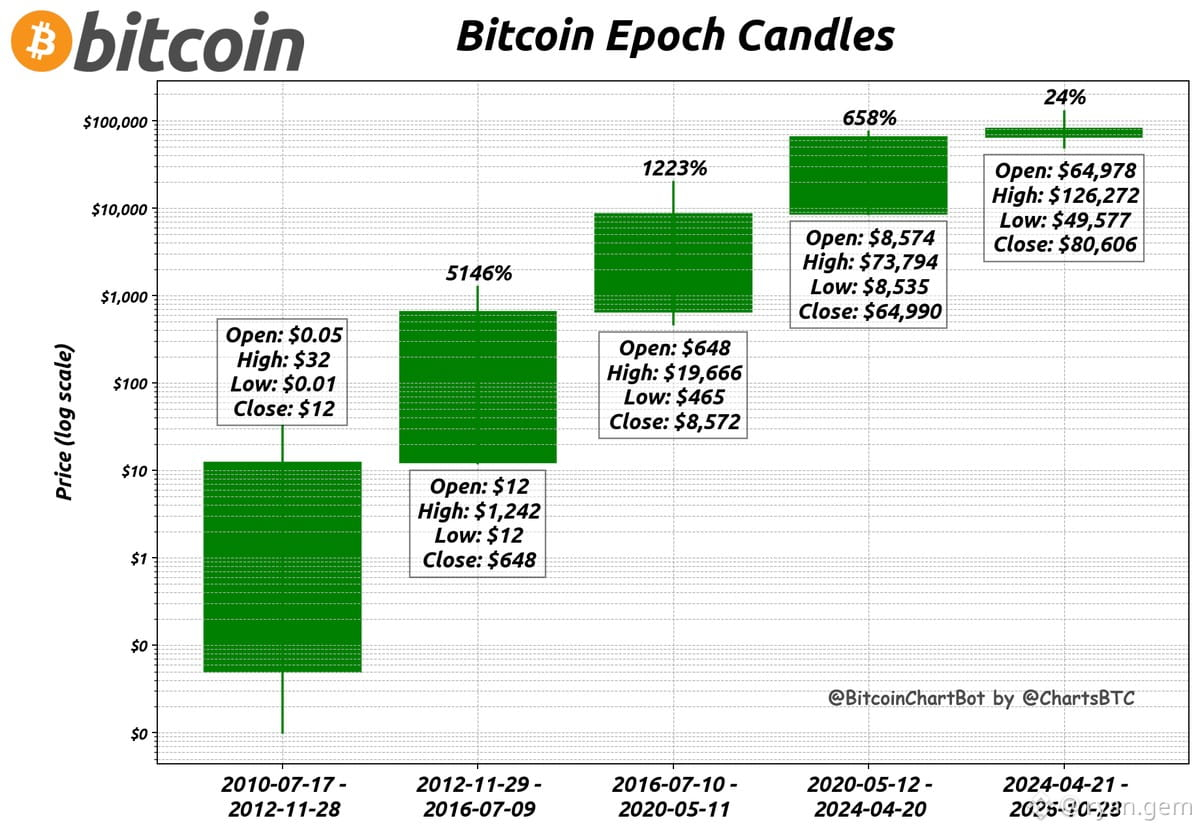
Epoch shift hit different this cycle 📊
$BTC closed last epoch at $64,990
Now sitting at $80,606
That's a clean 24% pump between epochs
Price discovery mode or just getting started? Structure looking bullish either way
Epoch shift hit different this cycle 📊
$BTC closed last epoch at $64,990
Now sitting at $80,606
That's a clean 24% pump between epochs
Price discovery mode or just getting started? Structure looking bullish either way
$BTC closed last epoch at $64,990
Now sitting at $80,606
That's a clean 24% pump between epochs
Price discovery mode or just getting started? Structure looking bullish either way
·
--
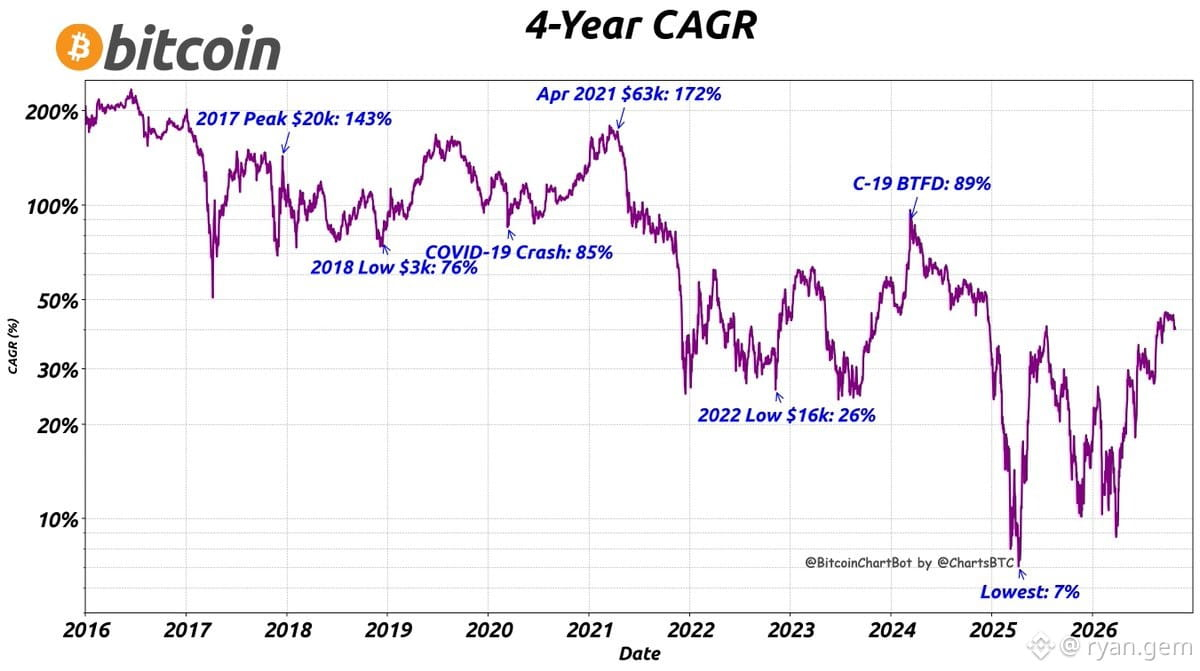
$BTC 4-year CAGR sitting at 41%
From $20,599 (Oct 2022) → $80,615 today
That's a 4x in bear-to-cycle terms. Not bad for "digital magic internet money"
For context: 41% annualized return crushes most tradfi assets over the same window. S&P doing ~12-15%, gold barely keeping up with inflation.
If you're still asking "is it too late?" — you're ngmi. The question is where the next 4-year cycle takes us.
22
·
--
$BTC sitting at $81,284 on Oct 28, 2026.
Log-linear scale showing the structure. Not much to say here — price is price. Watch for breaks above $82k or rejection back to $80k support.
No narrative spin, just the chart talking.
$BTC sitting at $81,284 on Oct 28, 2026.
Log-linear scale showing the structure. Not much to say here — price is price. Watch for breaks above $82k or rejection back to $80k support.
No narrative spin, just the chart talking.
Log-linear scale showing the structure. Not much to say here — price is price. Watch for breaks above $82k or rejection back to $80k support.
No narrative spin, just the chart talking.
27
·
--
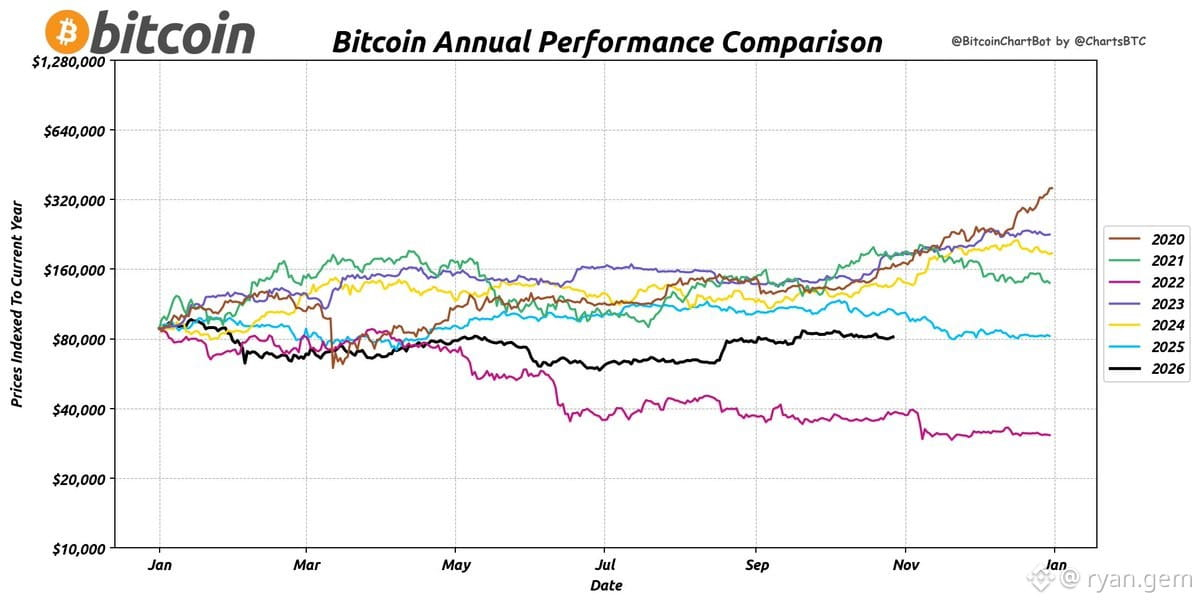
📊 $BTC yearly performance indexed
Data through 10/28/2026
Every cycle tells a story. This chart shows how Bitcoin moves in waves—parabolic runs followed by deep corrections, then slow accumulation phases before the next leg up.
If you're not studying these patterns, you're flying blind. Price action repeats, human psychology doesn't change.
Zoom out or get rekt.
47
·
--
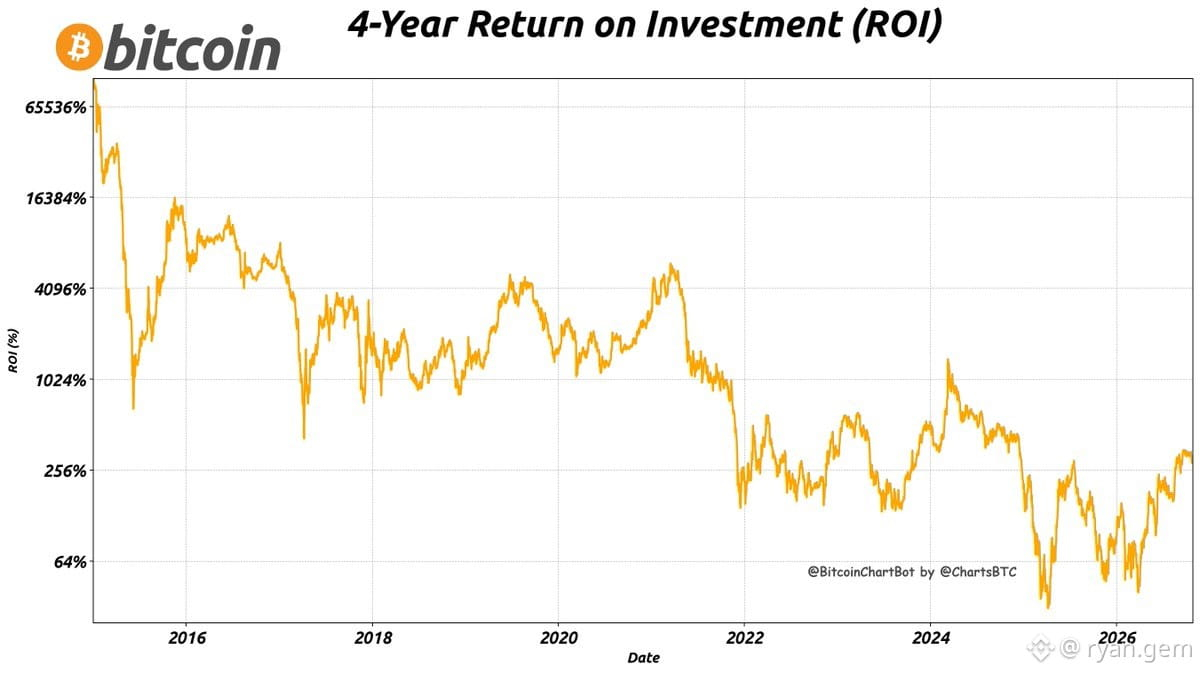
$BTC 4-year ROI check:
Today: $80,878
4 years ago: $20,599
ROI: 293%
Still the best performing macro asset. Halving cycles print. If you're not stacking through the bear, you're ngmi.
$BTC 4-year ROI check:
Today: $80,878
4 years ago: $20,599
ROI: 293%
Still the best performing macro asset. Halving cycles print. If you're not stacking through the bear, you're ngmi.
Today: $80,878
4 years ago: $20,599
ROI: 293%
Still the best performing macro asset. Halving cycles print. If you're not stacking through the bear, you're ngmi.
54
·
--
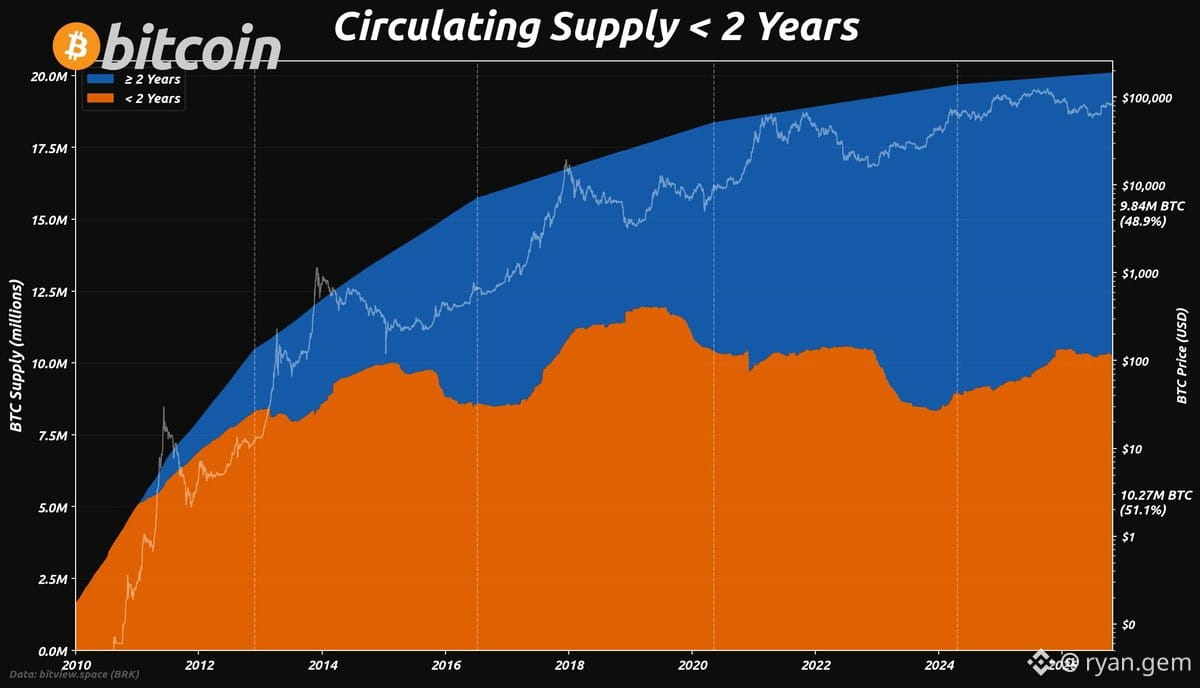
Half the $BTC supply hasn't moved in 2+ years. 9.84M coins locked up by diamond hands.
10.27M BTC still in play (<2yrs old) = 51% of circulating supply.
When long-term holders this strong, supply shock mechanics kick in. Every new buyer fighting over a shrinking pool.
This is why dips get bought instantly. HODLers aren't selling.
10.27M BTC still in play (<2yrs old) = 51% of circulating supply.
When long-term holders this strong, supply shock mechanics kick in. Every new buyer fighting over a shrinking pool.
This is why dips get bought instantly. HODLers aren't selling.
56
·
--
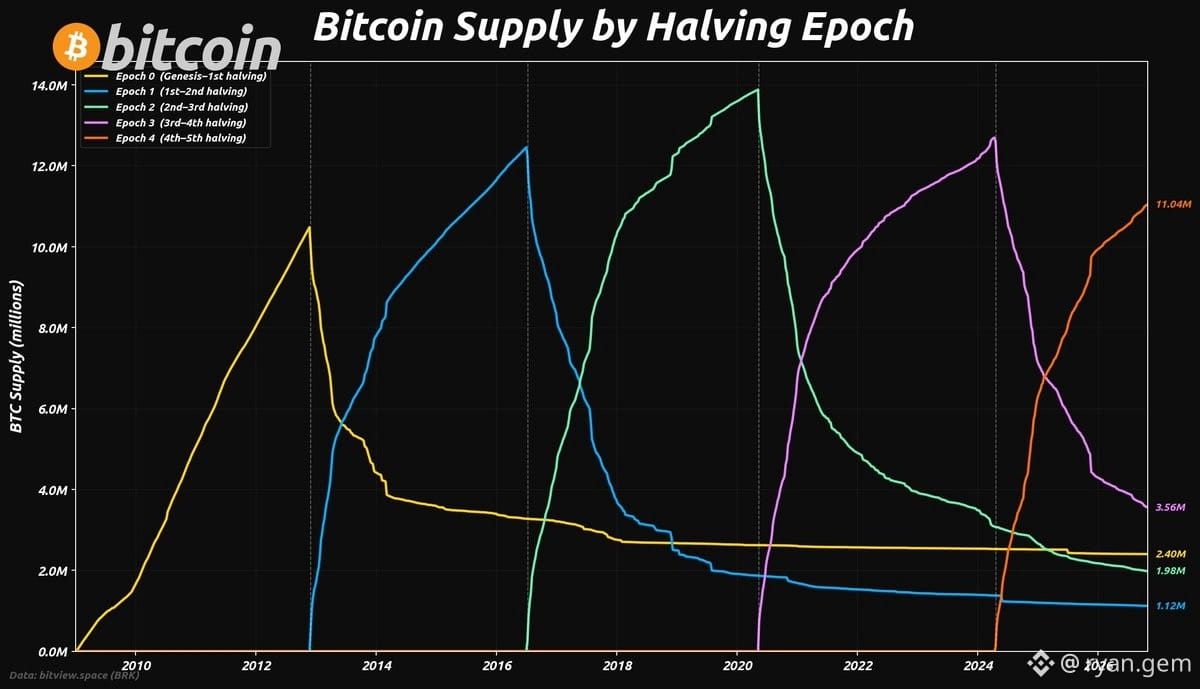
$BTC supply distribution by halving epoch:
Epoch 0: 2.40M
Epoch 1: 1.12M
Epoch 2: 1.98M
Epoch 3: 3.56M
Epoch 4: 11.04M
Notice how Epoch 4 holders are sitting on over half the circulating supply. These are the diamond hands who bought post-2020 and haven't moved a sat.
Supply shock isn't a meme when 11M+ coins are locked in wallets that haven't touched the market in years. Every cycle, fewer coins actually trade.
This is why dips get bought instantly now.
·
--
$BTC sitting at $80,674 while the 100-week MA is at $89,596.
Price/MA ratio: 0.90
Still below the long-term average. Historically, when $BTC trades under the 100w MA, it's been a decent accumulation zone before the next leg up.
Not financial advice, but this is where patient money positions itself.
$BTC sitting at $80,674 while the 100-week MA is at $89,596.
Price/MA ratio: 0.90
Still below the long-term average. Historically, when $BTC trades under the 100w MA, it's been a decent accumulation zone before the next leg up.
Not financial advice, but this is where patient money positions itself.
Price/MA ratio: 0.90
Still below the long-term average. Historically, when $BTC trades under the 100w MA, it's been a decent accumulation zone before the next leg up.
Not financial advice, but this is where patient money positions itself.
·
--
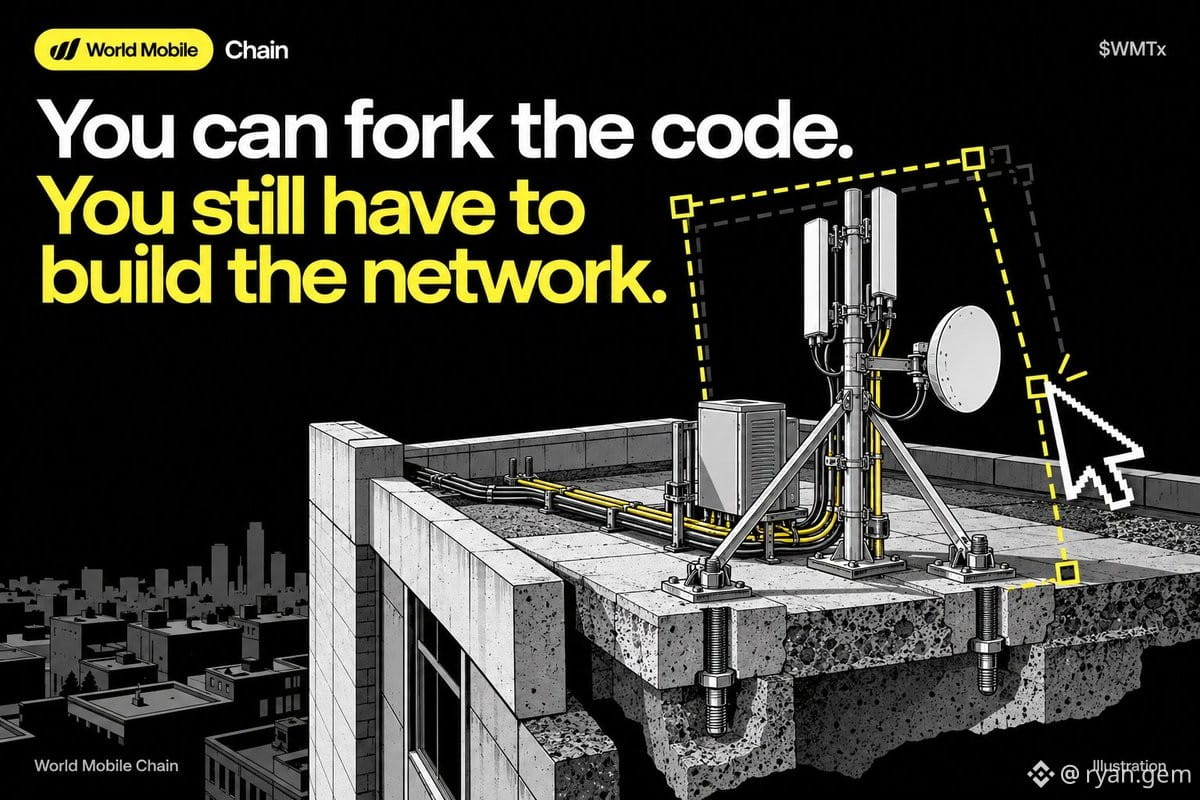
Most devs think crypto infra = GitHub commits.
Try negotiating rooftop access with a pull request. Try powering a cell tower with Solidity.
$WMTx isn't just code—it's real-world telecom infra. Power lines. Backhaul. Installation crews. Maintenance schedules.
Physical networks > vaporware tokenomics.
This is what separates real DePIN plays from another forked ERC-20 with a whitepaper.
·
--
Building in crypto? You already know the speed.
But alpha isn't just about catching pumps—it's about not getting rekt by taxes and compliance.
Most devs ignore this until it's too late. Don't be that guy.
The real edge? Knowing the rules before they bite you.
Building in crypto? You already know the speed.
But alpha isn't just about catching pumps—it's about not getting rekt by taxes and compliance.
Most devs ignore this until it's too late. Don't be that guy.
The real edge? Knowing the rules before they bite you.
But alpha isn't just about catching pumps—it's about not getting rekt by taxes and compliance.
Most devs ignore this until it's too late. Don't be that guy.
The real edge? Knowing the rules before they bite you.

·
--
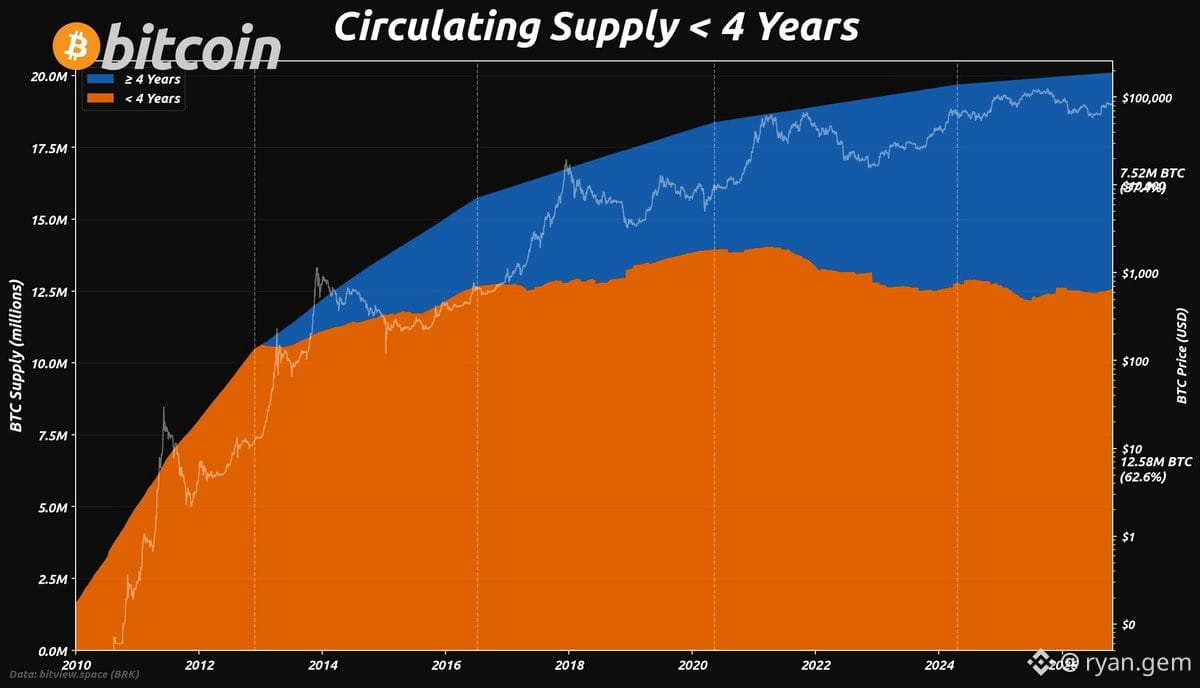
62.6% of $BTC supply hasn't moved in 4+ years
That's 12.58M coins locked up by long-term holders while only 7.52M circulating in younger wallets
Supply shock mechanics playing out in real-time. When these diamond hands finally decide to take profit, that's your cycle top signal
Watch the 4yr+ cohort — it's the ultimate conviction metric
That's 12.58M coins locked up by long-term holders while only 7.52M circulating in younger wallets
Supply shock mechanics playing out in real-time. When these diamond hands finally decide to take profit, that's your cycle top signal
Watch the 4yr+ cohort — it's the ultimate conviction metric
·
--
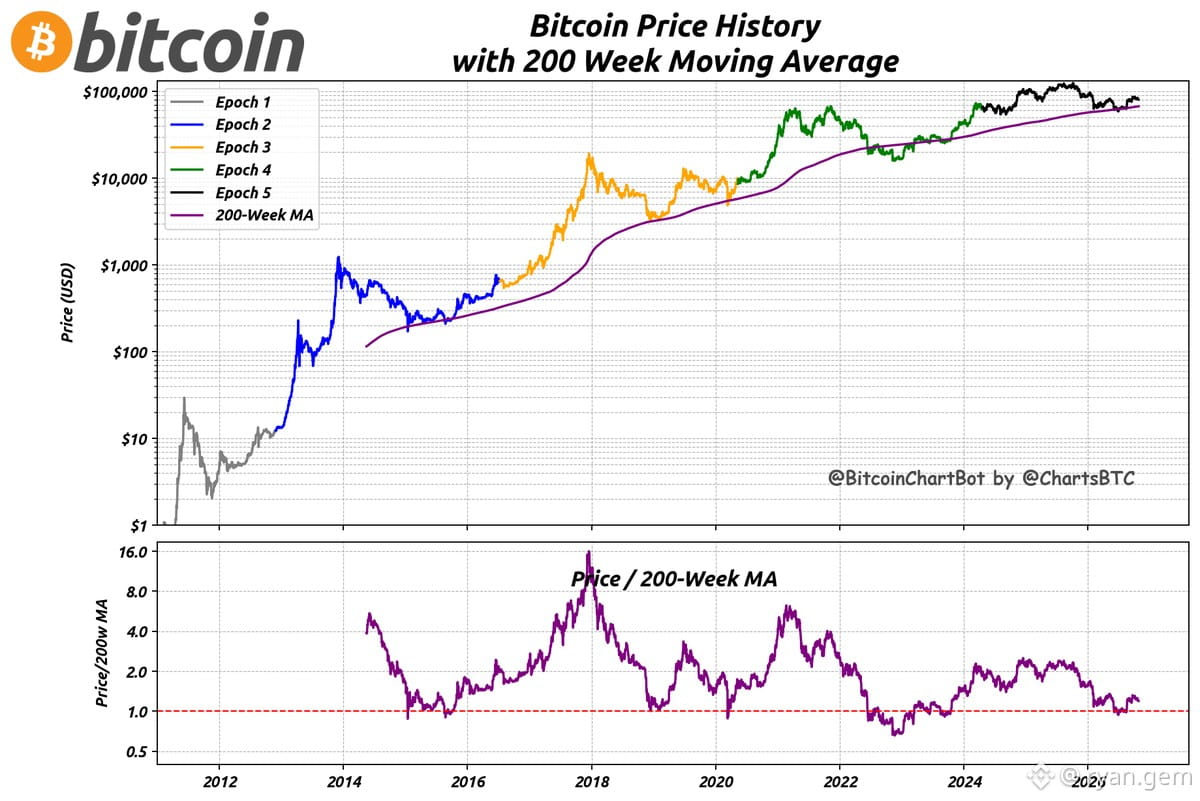
$BTC sitting at $80,126 right now
200-week MA: $67,163
Price/MA ratio: 1.19x
Still above the long-term moving average but not in euphoria territory yet. Historically, when this ratio hits 2.5x+, we're in bubble zone. At 1.19x? We're in accumulation-to-early-bull phase.
Watch that 200w MA as support. If we're holding above it, macro structure is intact.
32
·
--
HODL Waves snapshot (Oct 27, 2026)
Who's holding $BTC and for how long?
This chart breaks down coin age distribution—basically shows you if long-term holders are accumulating or if fresh supply is flooding the market.
Watch the older bands (1y+, 2y+). If they're growing, conviction is strong. If shrinking, supply's moving—usually precedes volatility.
Data doesn't lie. Position accordingly.
27
Log in to explore more content
Join global crypto users on Binance Square
⚡️ Get latest and useful information about crypto.
💬 Trusted by the world’s largest crypto exchange.
👍 Discover real insights from verified creators.
Email / Phone number