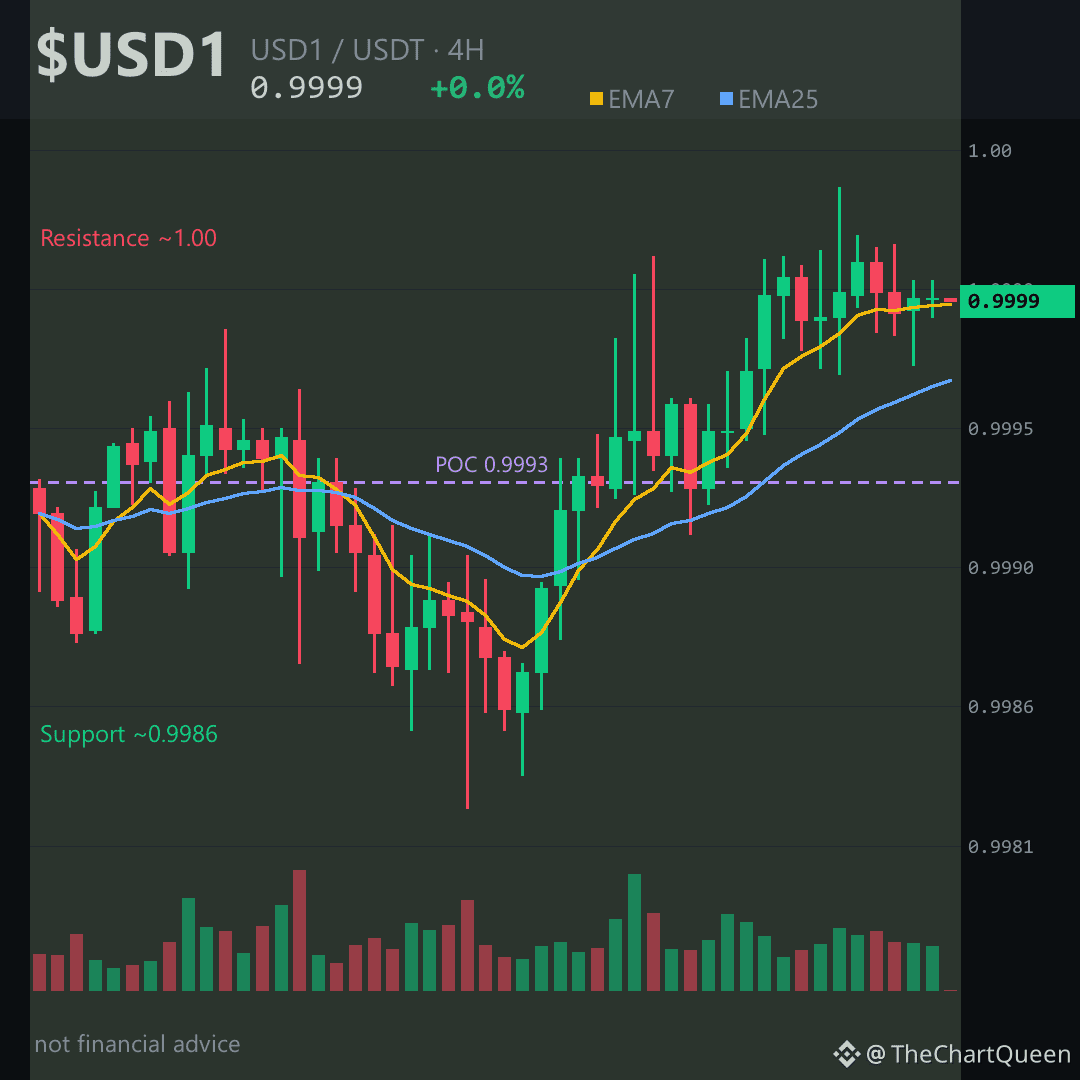
Someone’s botted this thing to a 0.06% daily range. $165M in volume for six basis points of movement — that’s not a market, that’s a peg with extra steps.
Here’s the part most will gloss over 👇
The 4H chart is technically bullish — EMA7 above EMA25, RSI at 60, POC just under price. But a “bullish” setup with a 0.6% objective and 1.5% invalidation is a chop zone, not a trend.
The real tell: the 0.999 area. Price has been grinding against it for 48 hours. The longer it hugs 1.00 without breaking clean, the more it looks like a coiled spring nobody wants to pay to release. This is acting like a stablecoin audition.
If $USD1 holds ~0.9999, the next meaningful test sits near ~1.0218. Lose ~0.98 on a daily close and the macro bearish bias takes over — weekly EMA25 above EMA7 is the quiet warning. Longer timeframes are just waiting for a real range to break.
Tap $USD1 to pull up the chart and see how flat this actually is.
My read: this is a volume mirage. Liquidity is there, conviction isn’t. The real risk isn’t a crash — it’s boredom bleeding into a slow drift toward ~0.63 if the 0.98 floor ever fails. Until then, it’s a parking lot.
Follow if you want the follow-up when $USD1 finally picks a direction — this sideways act won’t last forever.
What level are you watching to confirm the next real move on USD1? 👇
⚠️ Not financial advice. DYOR.
#USD1 #Stablecoin #Crypto #BinanceSquare
Here’s the part most will gloss over 👇
The 4H chart is technically bullish — EMA7 above EMA25, RSI at 60, POC just under price. But a “bullish” setup with a 0.6% objective and 1.5% invalidation is a chop zone, not a trend.
The real tell: the 0.999 area. Price has been grinding against it for 48 hours. The longer it hugs 1.00 without breaking clean, the more it looks like a coiled spring nobody wants to pay to release. This is acting like a stablecoin audition.
If $USD1 holds ~0.9999, the next meaningful test sits near ~1.0218. Lose ~0.98 on a daily close and the macro bearish bias takes over — weekly EMA25 above EMA7 is the quiet warning. Longer timeframes are just waiting for a real range to break.
Tap $USD1 to pull up the chart and see how flat this actually is.
My read: this is a volume mirage. Liquidity is there, conviction isn’t. The real risk isn’t a crash — it’s boredom bleeding into a slow drift toward ~0.63 if the 0.98 floor ever fails. Until then, it’s a parking lot.
Follow if you want the follow-up when $USD1 finally picks a direction — this sideways act won’t last forever.
What level are you watching to confirm the next real move on USD1? 👇
⚠️ Not financial advice. DYOR.
#USD1 #Stablecoin #Crypto #BinanceSquare