$KITE : Why Price Can Cross Moving Averages Multiple Times Without a Trend Existing
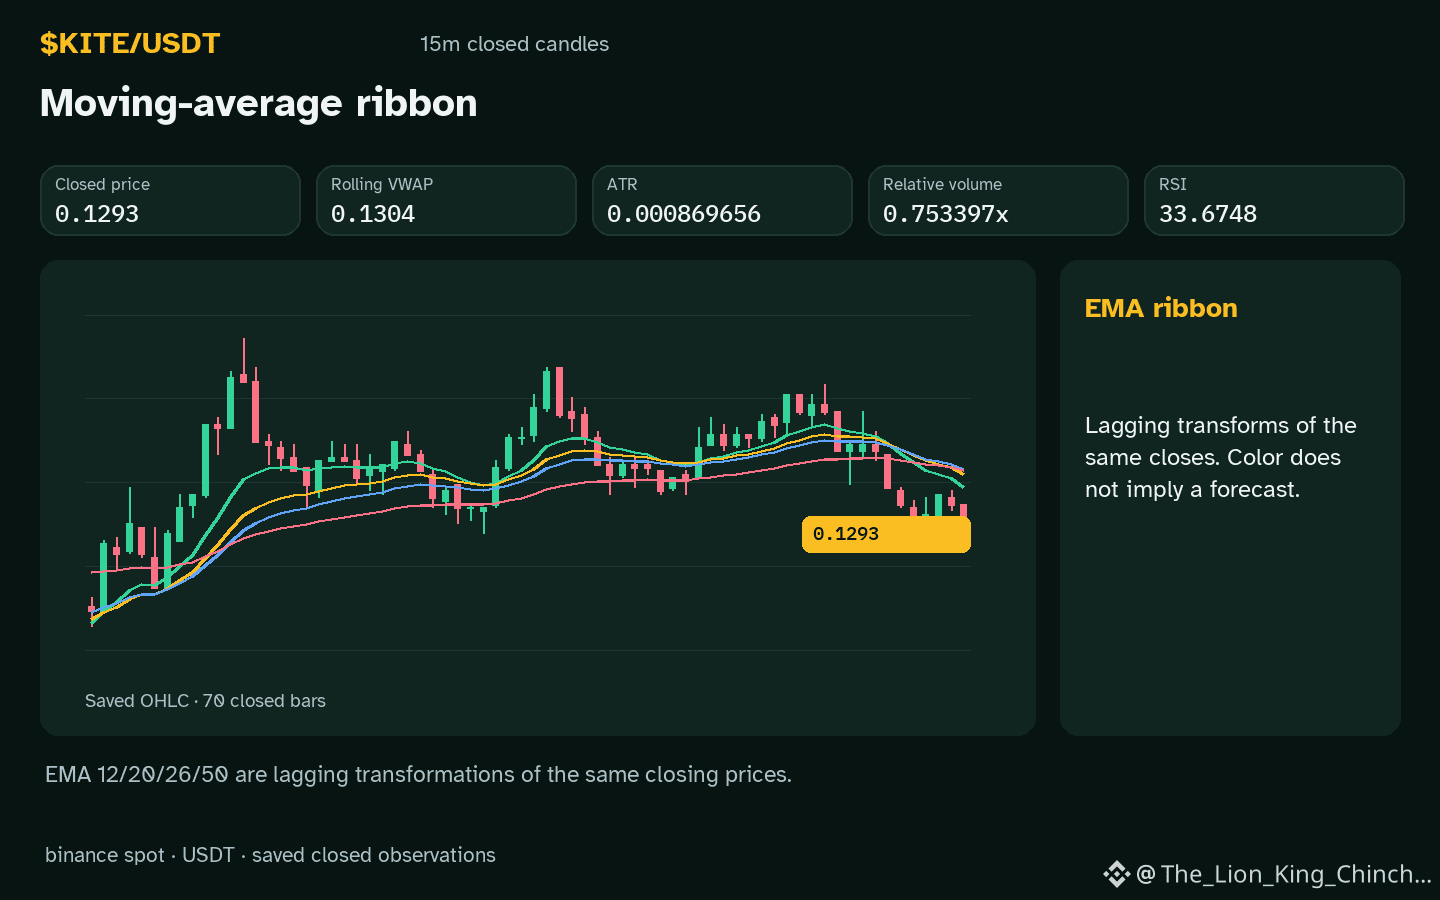
$KITE : Is the current down candle a clean close or merely a retest that could shift the view of equilibrium? $KITE sits below the local support line and the hourly direction is down while volume does not rise above baseline. One possible clue is the angle between the short‑term EMA and the longer EMA. If the short EMA tilts downward relative to the longer EMA, it may suggest that price is drifting within a flat range rather than launching a new trend.
An alternative reading is that the EMA angle alone does not prove a lack of momentum; a brief pullback could still precede a breakout if future candles show accelerating price change. The interpretation would weaken if the next hourly candle closes higher with a noticeable increase in relative volume 0.75x and the EMA gap narrows.
A counterexample would be a scenario where the EMA lines cross repeatedly yet the price manages to break the local resistance after several attempts, indicating that the slope was not a reliable equilibrium signal.
To reassess, monitor the next closed candle for a directional shift, a rise in relative volume, and a change in the EMA tilt. If those elements align, the hypothesis of non‑trending equilibrium loses strength.
Probabilistic market research, not a recommendation or guaranteed return.
#KITE #MarketAnalysis #CryptoLearning
$KITE : Is the current down candle a clean close or merely a retest that could shift the view of equilibrium? $KITE sits below the local support line and the hourly direction is down while volume does not rise above baseline. One possible clue is the angle between the short‑term EMA and the longer EMA. If the short EMA tilts downward relative to the longer EMA, it may suggest that price is drifting within a flat range rather than launching a new trend.
An alternative reading is that the EMA angle alone does not prove a lack of momentum; a brief pullback could still precede a breakout if future candles show accelerating price change. The interpretation would weaken if the next hourly candle closes higher with a noticeable increase in relative volume 0.75x and the EMA gap narrows.
A counterexample would be a scenario where the EMA lines cross repeatedly yet the price manages to break the local resistance after several attempts, indicating that the slope was not a reliable equilibrium signal.
To reassess, monitor the next closed candle for a directional shift, a rise in relative volume, and a change in the EMA tilt. If those elements align, the hypothesis of non‑trending equilibrium loses strength.
Probabilistic market research, not a recommendation or guaranteed return.
#KITE #MarketAnalysis #CryptoLearning