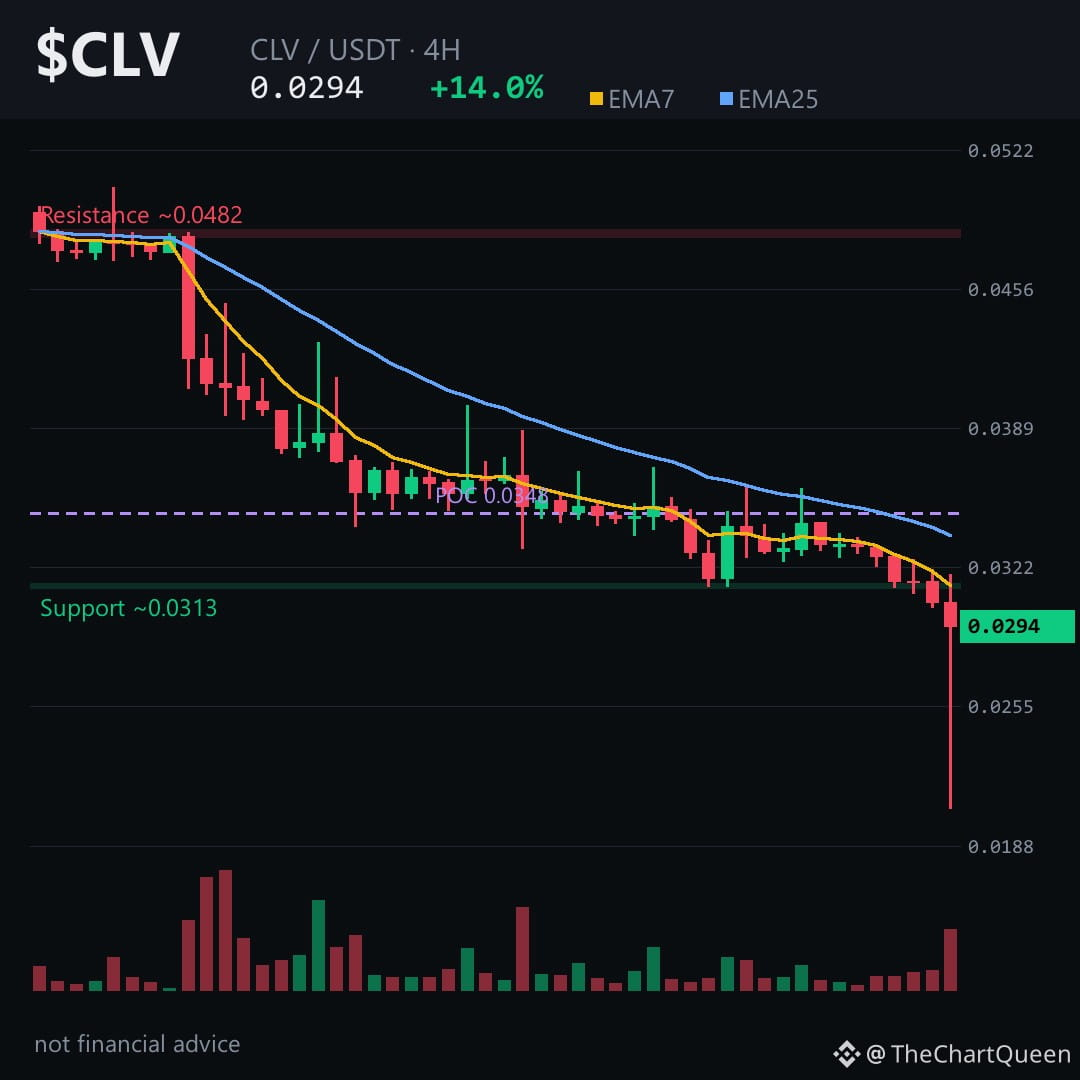
+13.97% in 24 hours, yet the 4-hour chart just printed 9 red candles out of 12.
That’s the gap between the headline and the tape.
The bounce everyone sees today is built on an overnight wick down to the 0.0206 area — a 49% range day. Price is still trading below an unfilled bearish gap sitting just overhead, around the 0.0327–0.0329 zone. That gap is the first real test if this “top gainer” wants to prove it’s more than a dead-cat bounce.
On the 4-hour picture, the short-term moving averages are stacked against any sustained push — the faster line sits well under the slower one, and momentum is deep in oversold territory without any sign of turning. Oversold can stay oversold longer than feels comfortable.
My read: the 4-hour bias stays lower while price respects that bearish gap. The area near 0.0310 is the line in the sand — a 4H close back above there and the bearish structure starts to crack. Until then, the path of least resistance points toward the 0.0268 zone.
Tap $CLV to pull up the chart and check that gap yourself.
Follow me for the breakdown when price reaches either side of this range — that’s where the next real signal lives.
Which level are you watching closer on $CLV — the gap above or the low below? 👇
⚠️ Not financial advice. DYOR.
#CLV #Crypto #Altcoins #BinanceSquare
That’s the gap between the headline and the tape.
The bounce everyone sees today is built on an overnight wick down to the 0.0206 area — a 49% range day. Price is still trading below an unfilled bearish gap sitting just overhead, around the 0.0327–0.0329 zone. That gap is the first real test if this “top gainer” wants to prove it’s more than a dead-cat bounce.
On the 4-hour picture, the short-term moving averages are stacked against any sustained push — the faster line sits well under the slower one, and momentum is deep in oversold territory without any sign of turning. Oversold can stay oversold longer than feels comfortable.
My read: the 4-hour bias stays lower while price respects that bearish gap. The area near 0.0310 is the line in the sand — a 4H close back above there and the bearish structure starts to crack. Until then, the path of least resistance points toward the 0.0268 zone.
Tap $CLV to pull up the chart and check that gap yourself.
Follow me for the breakdown when price reaches either side of this range — that’s where the next real signal lives.
Which level are you watching closer on $CLV — the gap above or the low below? 👇
⚠️ Not financial advice. DYOR.
#CLV #Crypto #Altcoins #BinanceSquare