$IMX: How Liquidity Works Like Water Flow in a River
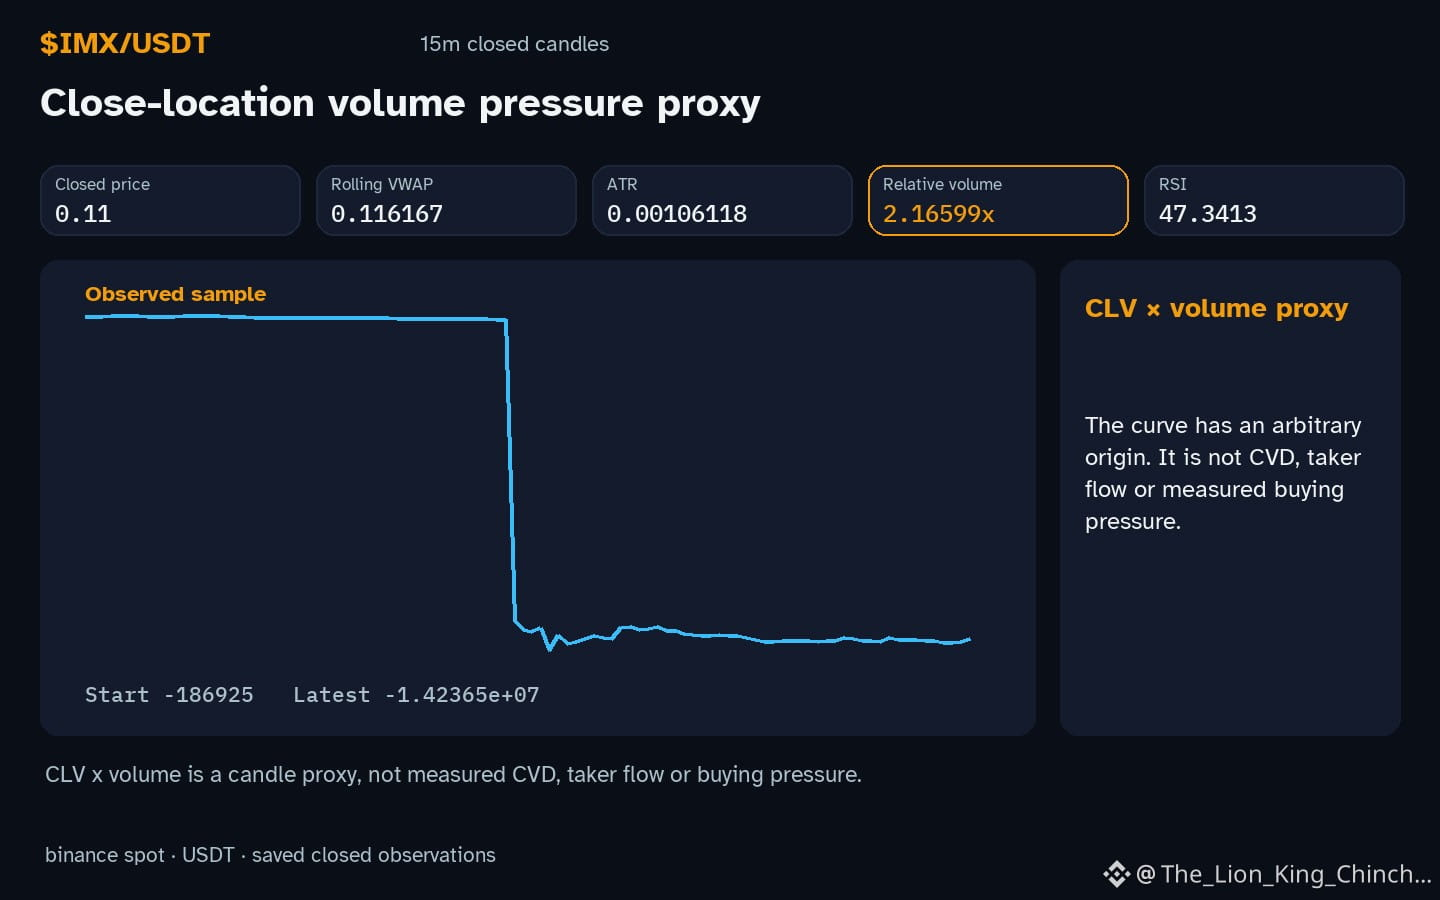
When you look at $IMX you see a down hourly direction and volume above baseline. Does that mean the market is ready for a new entry, or is the signal simply noise? One way to explore this is to compare market liquidity to water flowing through a riverbed. In a wide, deep channel, water moves smoothly and small stones do not cause a noticeable splash; similarly, a liquid market can absorb modest trades without large price swings. Conversely, a shallow, narrow stretch creates turbulence when a rock is dropped, just as thin order books amplify price moves.
If the river analogy holds, the observed high relative volume 2.17x suggests that many small streams are feeding the flow, which could mask the impact of a single trader adding exposure. However, the analogy breaks when we ignore the role of price limits, market makers, and the discrete nature of limit orders. factors that have no direct counterpart in natural water flow.
A practical self‑check is to monitor the next hourly candle: if the price change -0.452489% remains modest while volume stays elevated, the liquidity‑buffer hypothesis gains support. If instead the price moves sharply despite continued volume, the river model may be insufficient, indicating that other micro‑structure elements dominate the reaction.
Probabilistic market research, not a recommendation or guaranteed return.
The comparison to keep in mind: $BTC has hourly direction down and volume above its baseline; $BARD has hourly direction up and volume not above its baseline. This alone does not establish correlation.
#IMX #BTC #BARD #CryptoEducation #CryptoLearning
When you look at $IMX you see a down hourly direction and volume above baseline. Does that mean the market is ready for a new entry, or is the signal simply noise? One way to explore this is to compare market liquidity to water flowing through a riverbed. In a wide, deep channel, water moves smoothly and small stones do not cause a noticeable splash; similarly, a liquid market can absorb modest trades without large price swings. Conversely, a shallow, narrow stretch creates turbulence when a rock is dropped, just as thin order books amplify price moves.
If the river analogy holds, the observed high relative volume 2.17x suggests that many small streams are feeding the flow, which could mask the impact of a single trader adding exposure. However, the analogy breaks when we ignore the role of price limits, market makers, and the discrete nature of limit orders. factors that have no direct counterpart in natural water flow.
A practical self‑check is to monitor the next hourly candle: if the price change -0.452489% remains modest while volume stays elevated, the liquidity‑buffer hypothesis gains support. If instead the price moves sharply despite continued volume, the river model may be insufficient, indicating that other micro‑structure elements dominate the reaction.
Probabilistic market research, not a recommendation or guaranteed return.
The comparison to keep in mind: $BTC has hourly direction down and volume above its baseline; $BARD has hourly direction up and volume not above its baseline. This alone does not establish correlation.
#IMX #BTC #BARD #CryptoEducation #CryptoLearning