


Worked for 46s
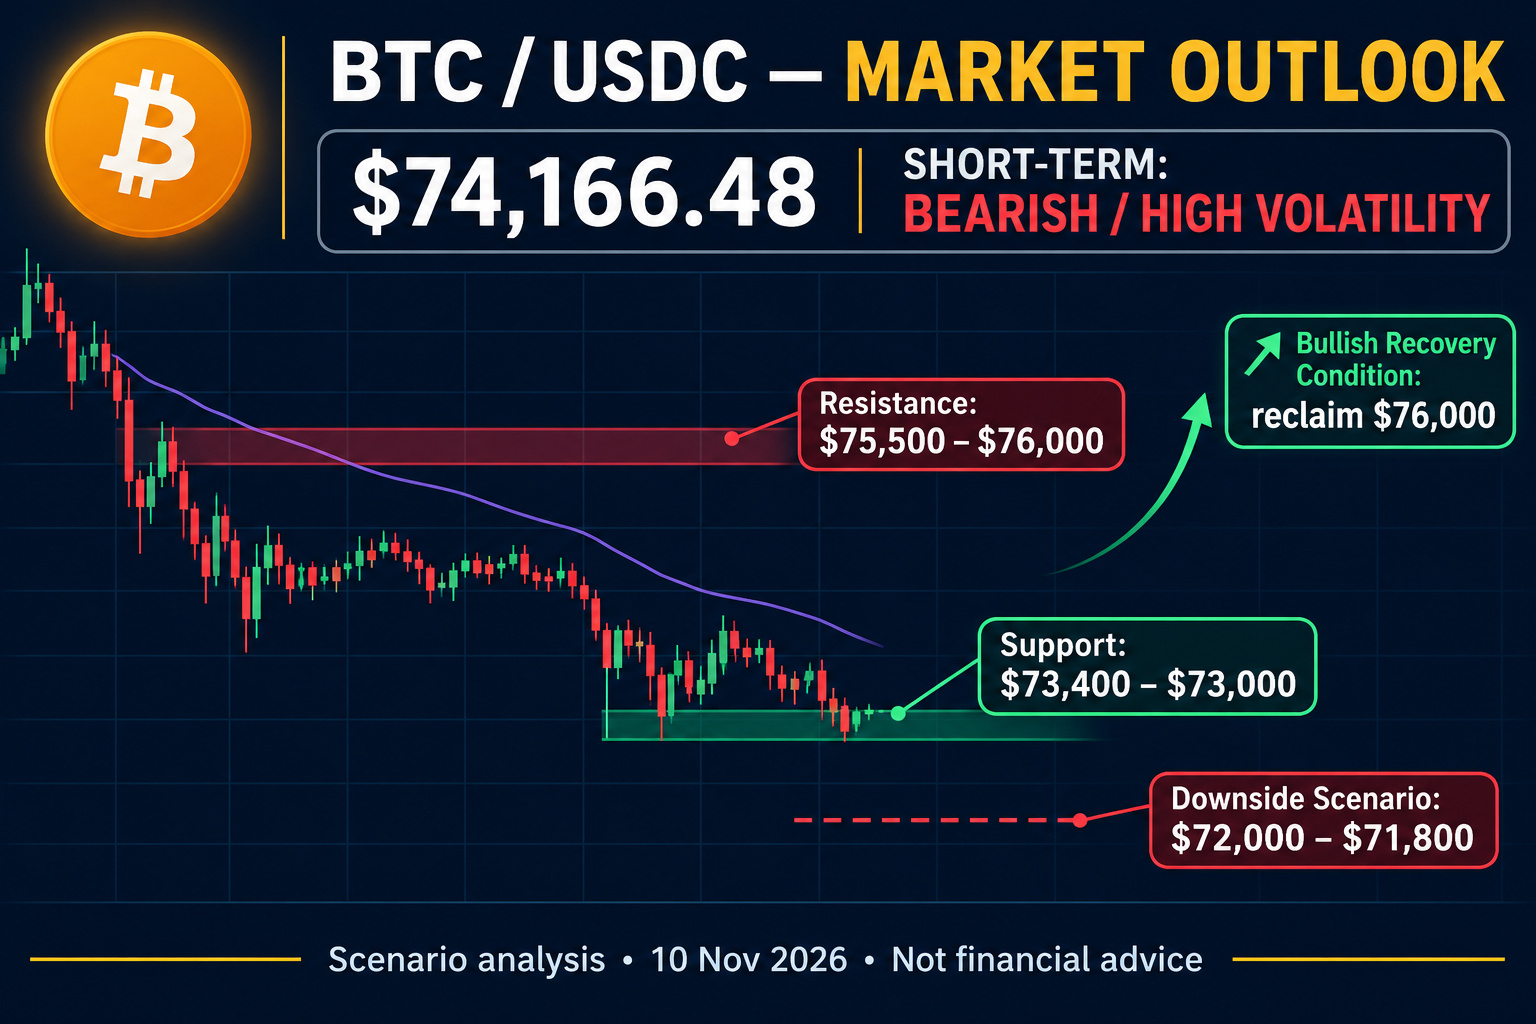
Market assessment | 10 November 2026 | Based on your Binance screenshot and latest available market reports

-0.56% in your screenshot
Your screenshot's $BTC /USDC price

Short-term bias: Bearish / volatile
My main prediction: Bitcoin is more likely to retest the $73,400–$73,000 support region before establishing a sustainable recovery. A convincing move above $75,500–$76,000 would weaken this bearish outlook.
This is a probability-based forecast, not a guaranteed price prediction.
### 1\. International market conditions
Here are the major developments affecting Bitcoin:
* US Federal Reserve: Markets are concerned about tighter monetary policy. A report today puts the probability of another Fed rate hike at 84%. Higher rates generally pressure speculative assets. BeInCrypto +1
* Bitcoin ETF activity: US spot Bitcoin ETFs reportedly experienced approximately $1.28 billion in outflows from November 2–6, followed by another $201 million on November 9. This is a significant bearish signal. CoinDesk CC +1
* US stock market: The S&P 500 rose 2.3% and Nasdaq 2.7% on November 9. This is supportive of risk appetite, although Bitcoin has not fully benefited. AP News
* Oil and war: Oil prices have fallen as the US-Iran conflict appears to be moving toward possible de-escalation. However, negotiations remain uncertain. Lower oil prices could reduce inflation pressure and help risk assets. Financial Times +1
* Institutional buying: Strategy reported buying 1,036 BTC during November 2–8, at an average price of $79,012. This is a longer-term supportive factor, but not enough by itself to reverse current selling pressure. Investing.com Nigeria
### 2\. Technical analysis of your Binance chart
Bitcoin (BTC)
### $74,190.00
-$404.00 (0.54%)
1D5D1M6MYTD1Y5YMAX
Open
-
Volume
-
Market Cap
-
Day Low
74,064
Year Low
57,945
EPS (TTM)
-
Day High
75,468
Year High
107,357
P/E Ratio
-
Your 1-hour chart shows several warning signs:
| Indicator | Your screenshot | Interpretation |
| ---------- | --------------- | ---------------------- |
| MA(7) | $74,405 | Above current price |
| MA(25) | $74,739 | Above current price |
| MA(99) | $75,338 | Above current price |
| Supertrend | $75,448 | Bearish resistance |
| 24h high | $75,500 | Resistance |
| 24h low | $74,040.92 | Immediate support area |
The latest independent technical reading for November 10 also shows:
* RSI (daily): 35.4 — weak momentum.
* 4-hour trend: strongly bearish.
* Daily trend: neutral.
* Weekly trend: bullish bias.
* Technical support: $74,193, then $73,384.
* Resistance: $76,042, then $76,834. COINOTAG
Important: Your screenshot shows price already below the short-term moving averages and Supertrend. Buyers need to recover those levels before I would consider a strong bullish reversal.
### 3\. My price prediction
Scenario estimates, not guaranteed targets. USD per BTC.
Next 24–72 hours
Bearish bias
### $73,400–$75,500
Most likely trading area in my base-case scenario.
Bearish breakout
### $72,000–$71,800
If BTC breaks $73,000 decisively and cannot recover it, further downside becomes possible.
Bullish recovery
### $76,800–$78,000
Requires a sustained recovery above $76,000, stronger spot buying and improving ETF flows.
### 4\. What could move Bitcoin next?
These are the most important triggers to watch:
| Market event | Potential BTC impact |
| ----------------------------- | ------------------------------ |
| US CPI inflation data | High volatility |
| Fed rate-hike expectations | Bearish if expectations rise |
| ETF outflows continue | Bearish |
| ETF inflows return | Bullish |
| US-Iran peace progress | Potentially bullish |
| Renewed military escalation | Risk-off / potentially bearish |
| Strong US stock markets | Potentially bullish |
| Large institutional purchases | Supportive |
The US-Iran situation deserves particular attention. Oil falling below $90 amid expectations of reduced military escalation is positive for inflation expectations, but there is no confirmed final peace agreement. Financial Times +1
### 5\. My trading strategy
If I were assessing this chart, I would use the following conditions rather than buying or selling blindly.
| BTC price action | My assessment |
| ---------------- | ------------------------------ |
| Below $74,000 | Weakness increasing |
| $73,400–$73,000 | Watch for support and reversal |
| Below $73,000 | Downside risk increases |
| Above $75,500 | Recovery signal |
| Above $76,000 | Stronger bullish confirmation |
| Above $76,800 | Potential continuation upward |
My recommendation:
* Avoid aggressive leveraged long positions right now.
* Don't short directly into support without confirmation.
* Wait for a 1-hour candle close and volume confirmation.
* Watch ETF flows and US inflation news.
* Keep stop-losses in place.
### 6\. Final verdict
My overall assessment
Cautious
### Bearish short-term
Neutral-to-bullish longer-term, provided important support holds.
My preferred scenario is a test of $73,400–$73,000 before a meaningful recovery attempt. A breakdown could expose $72,000–$71,800.
This is my analytical judgment based on the available information, not a certainty or personalized financial advice.
### One important question
Are you currently holding $BTC , or are you planning to enter a new trade?
That makes a big differenc
e to the strategy. I can calculate a more useful entry price, take-profit levels and stop-loss based on your position.
If you prefer, I can also explain the market analysis using Voice mode.#Binance #BNB走势 #BTC☀ #Ethereum