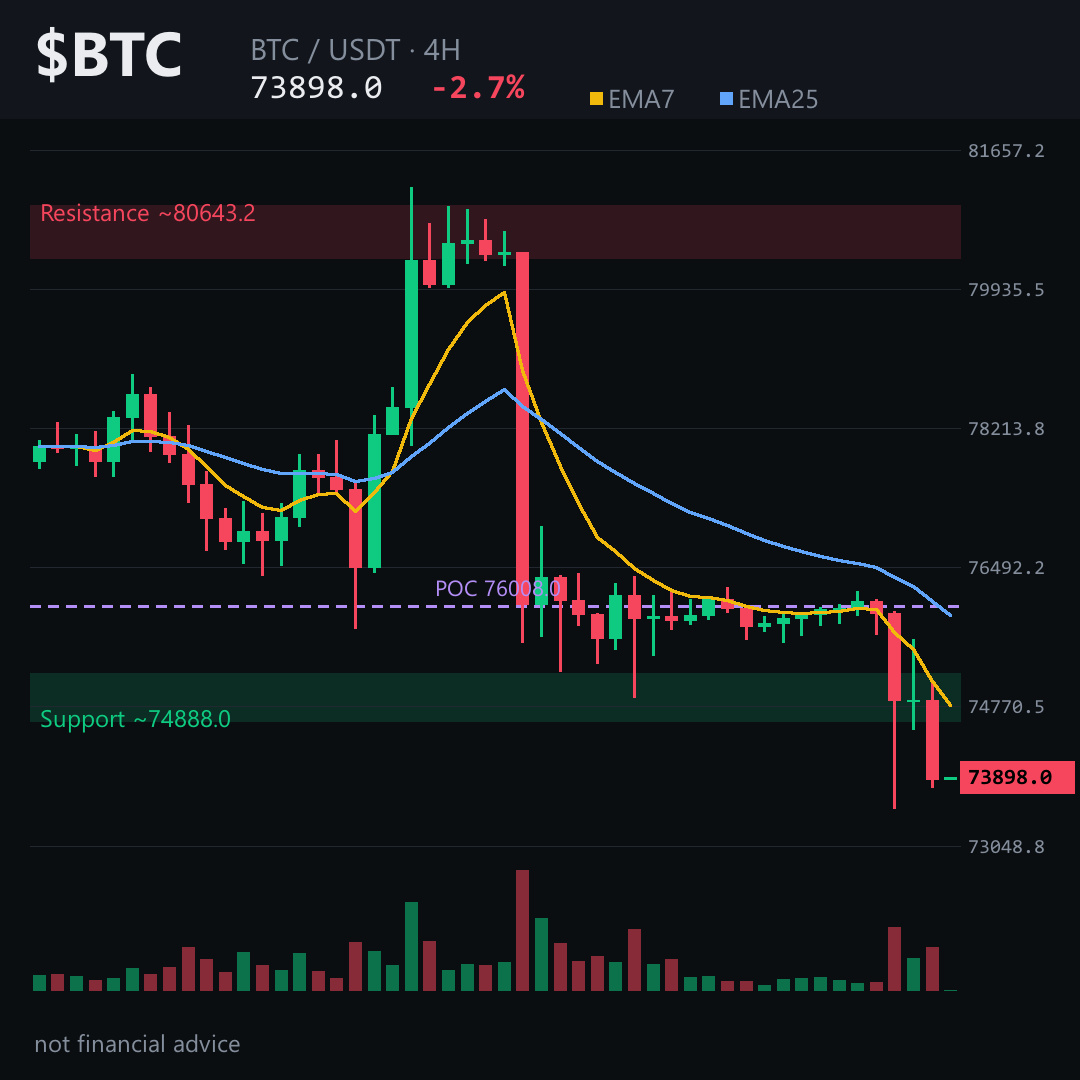
Imagine a market that quietly spent hours coiling just under 76K, then in one violent 4-hour candle simply stepped off a ledge. That’s what happened to $BTC .
Price now hovers near 73.9K after slicing through 75.6K — a floor for most of the day. The 4-hour chart is clear: the shorter-term trend average sits below the longer one, and momentum has fallen off a cliff. RSI near 25 isn’t just weak — it says sellers aren’t done.
Futures traders are still overwhelmingly long. Funding is positive, long-to-short ratio nearly 3-to-1. That’s a crowded boat. When price breaks down with this many leaning the wrong way, the unwind can feed on itself.
The level I’m watching most closely on the 4-hour is ~75.8K. That’s where the bearish case starts to break down. A convincing push back above it would tell me this was a shakeout, not a structural shift. Until then, path of least resistance is lower — mid-71K is the next natural pocket if momentum persists.
The daily agrees. Its trend averages are stacked against price, and the volume-weighted level where most trading has occurred sits far higher, around 82.8K. That’s a lot of overhead supply for any bounce to chew through.
My read: the 4-hour down-move hasn’t exhausted itself yet. Losing ~75.8K on a 4-hour close would be the first real sign bulls are regaining footing. Until then, I’d rather respect the downside than fight it. Tap $BTC to pull up the chart and read these levels yourself.
Which zone are you watching more closely right now — the 71K objective or the 75.8K invalidation? Drop your take on $BTC 👇
Follow for the next read on this chart.
⚠️ Not financial advice. DYOR.
#BTC #Bitcoin #Crypto #BinanceSquare
Price now hovers near 73.9K after slicing through 75.6K — a floor for most of the day. The 4-hour chart is clear: the shorter-term trend average sits below the longer one, and momentum has fallen off a cliff. RSI near 25 isn’t just weak — it says sellers aren’t done.
Futures traders are still overwhelmingly long. Funding is positive, long-to-short ratio nearly 3-to-1. That’s a crowded boat. When price breaks down with this many leaning the wrong way, the unwind can feed on itself.
The level I’m watching most closely on the 4-hour is ~75.8K. That’s where the bearish case starts to break down. A convincing push back above it would tell me this was a shakeout, not a structural shift. Until then, path of least resistance is lower — mid-71K is the next natural pocket if momentum persists.
The daily agrees. Its trend averages are stacked against price, and the volume-weighted level where most trading has occurred sits far higher, around 82.8K. That’s a lot of overhead supply for any bounce to chew through.
My read: the 4-hour down-move hasn’t exhausted itself yet. Losing ~75.8K on a 4-hour close would be the first real sign bulls are regaining footing. Until then, I’d rather respect the downside than fight it. Tap $BTC to pull up the chart and read these levels yourself.
Which zone are you watching more closely right now — the 71K objective or the 75.8K invalidation? Drop your take on $BTC 👇
Follow for the next read on this chart.
⚠️ Not financial advice. DYOR.
#BTC #Bitcoin #Crypto #BinanceSquare