🚨 TRUMP COIN: WHAT DOES THIS CHART REALLY TELL US?
Forget the usual price predictions. Let's read the story behind the candles. 👀
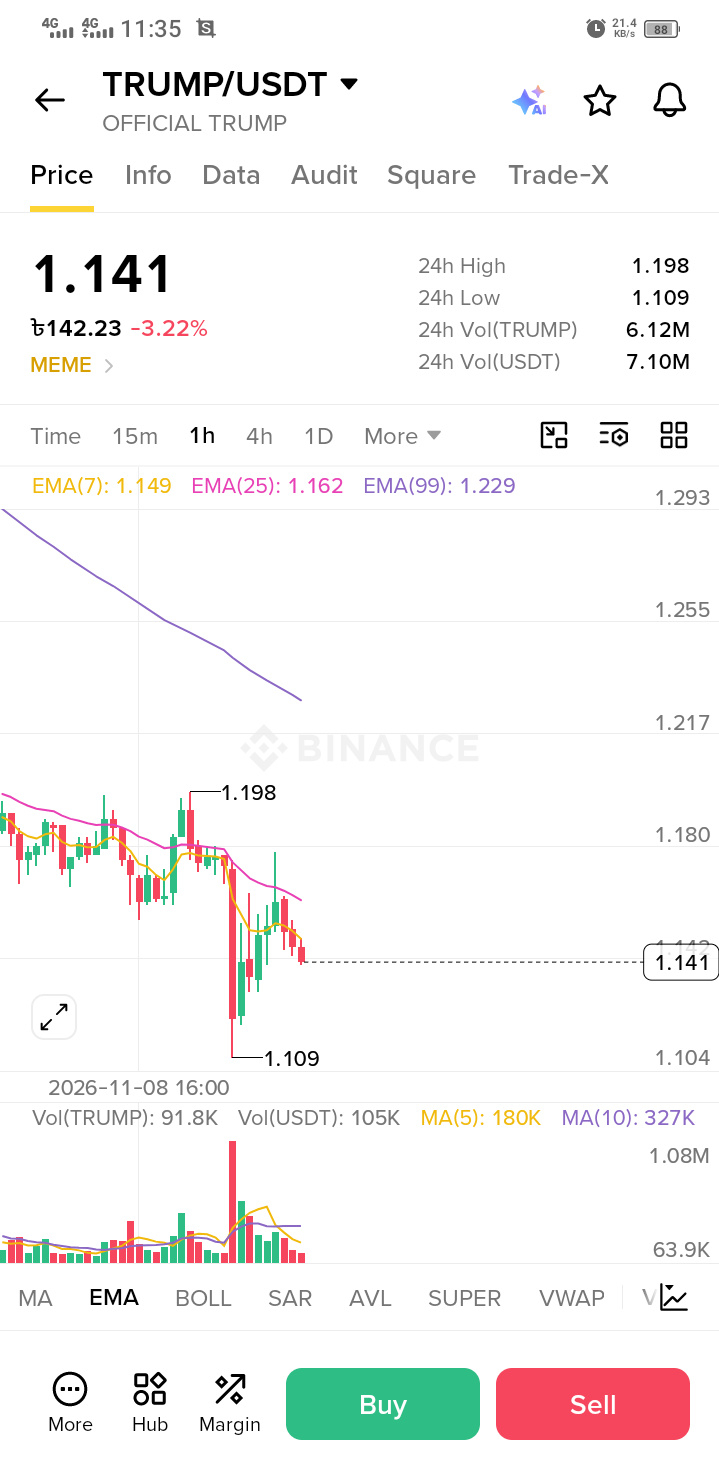
Look closely at the TRUMP/USDT 1H chart.
📉 THE CLUES:
🔴 Price: $1.141
🔻 24H Change: -3.22%
📍 24H High: $1.198
📍 24H Low: $1.109
But here's what makes this chart interesting:
1️⃣ A noticeable volume spike appeared during the sharp downward move.
2️⃣ Price attempted a recovery after reaching $1.109.
3️⃣ The recovery struggled to move above the EMA 25.
4️⃣ EMA 7 ($1.149), EMA 25 ($1.162), and EMA 99 ($1.229) are all above the current price.
🧠 THE BIG QUESTION
A sudden volume spike during a price decline can have different explanations.
It may reflect increased selling activity, liquidations, or other market activity. Volume alone cannot tell us exactly what happened.
🎯 COMMUNITY QUIZ
Which observation do you find most important?
A) The sudden volume spike
B) The failed recovery
C) Price staying below all three EMAs
D) The overall downward structure
👇 Drop your answer (A, B, C, or D) and explain WHY!
Let's learn to read charts instead of blindly following predictions.
— BLOCK ZENITH
#TRUMP #CryptoEducation #ChartAnalysis #MemeCoins #BlockZenith
$BTC $TRUMP
Forget the usual price predictions. Let's read the story behind the candles. 👀
Look closely at the TRUMP/USDT 1H chart.
📉 THE CLUES:
🔴 Price: $1.141
🔻 24H Change: -3.22%
📍 24H High: $1.198
📍 24H Low: $1.109
But here's what makes this chart interesting:
1️⃣ A noticeable volume spike appeared during the sharp downward move.
2️⃣ Price attempted a recovery after reaching $1.109.
3️⃣ The recovery struggled to move above the EMA 25.
4️⃣ EMA 7 ($1.149), EMA 25 ($1.162), and EMA 99 ($1.229) are all above the current price.
🧠 THE BIG QUESTION
A sudden volume spike during a price decline can have different explanations.
It may reflect increased selling activity, liquidations, or other market activity. Volume alone cannot tell us exactly what happened.
🎯 COMMUNITY QUIZ
Which observation do you find most important?
A) The sudden volume spike
B) The failed recovery
C) Price staying below all three EMAs
D) The overall downward structure
👇 Drop your answer (A, B, C, or D) and explain WHY!
Let's learn to read charts instead of blindly following predictions.
— BLOCK ZENITH
#TRUMP #CryptoEducation #ChartAnalysis #MemeCoins #BlockZenith
$BTC $TRUMP