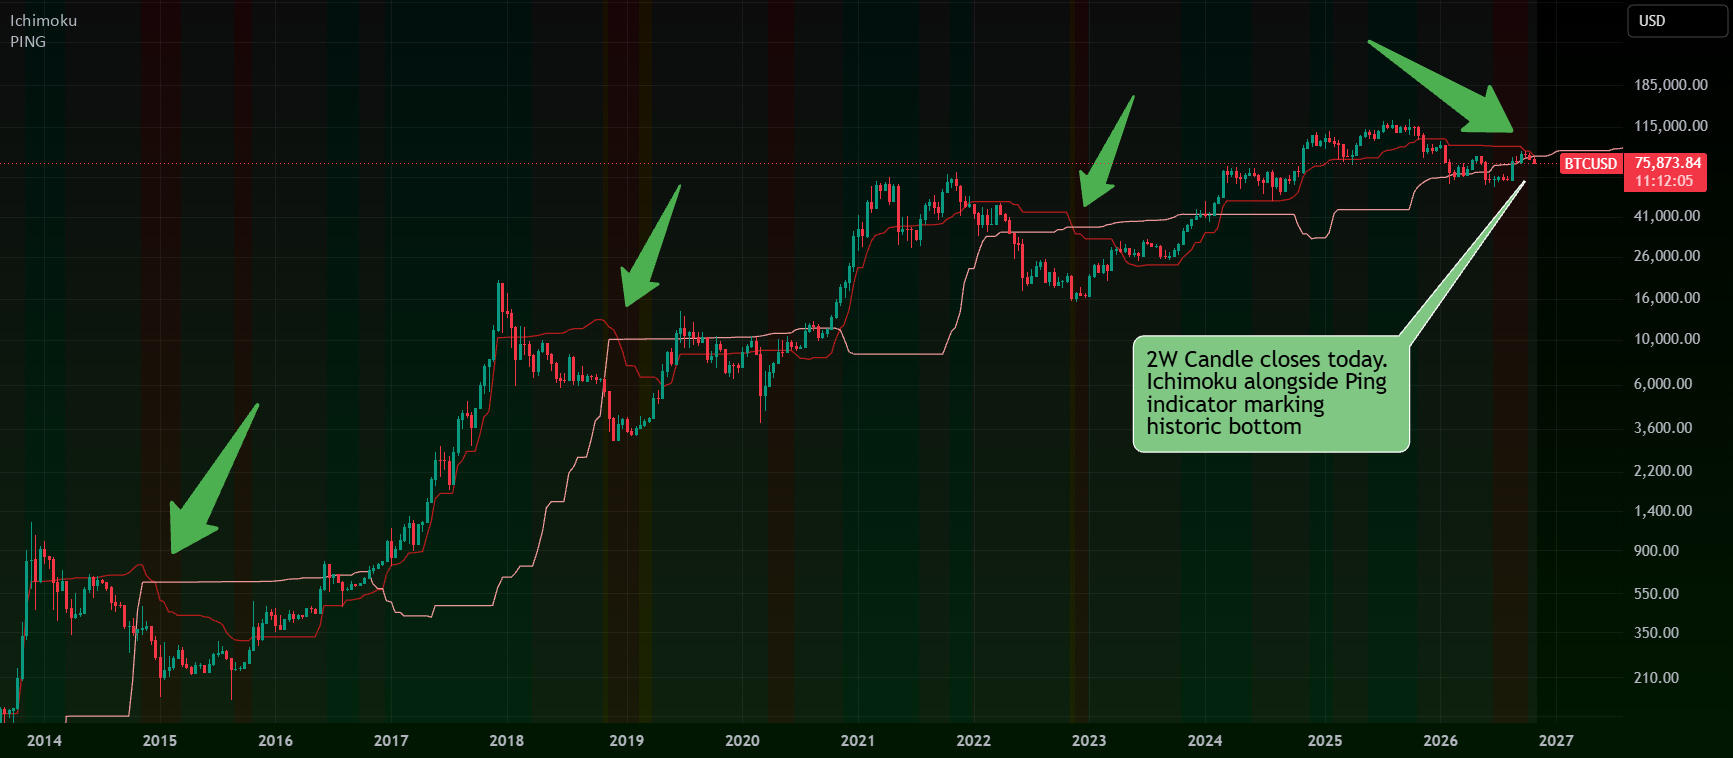


The background tint that marked the last three cycle bottoms is printing again, with the price sitting under the Ichimoku line and a 2W candle closing today.
What I'm seeing
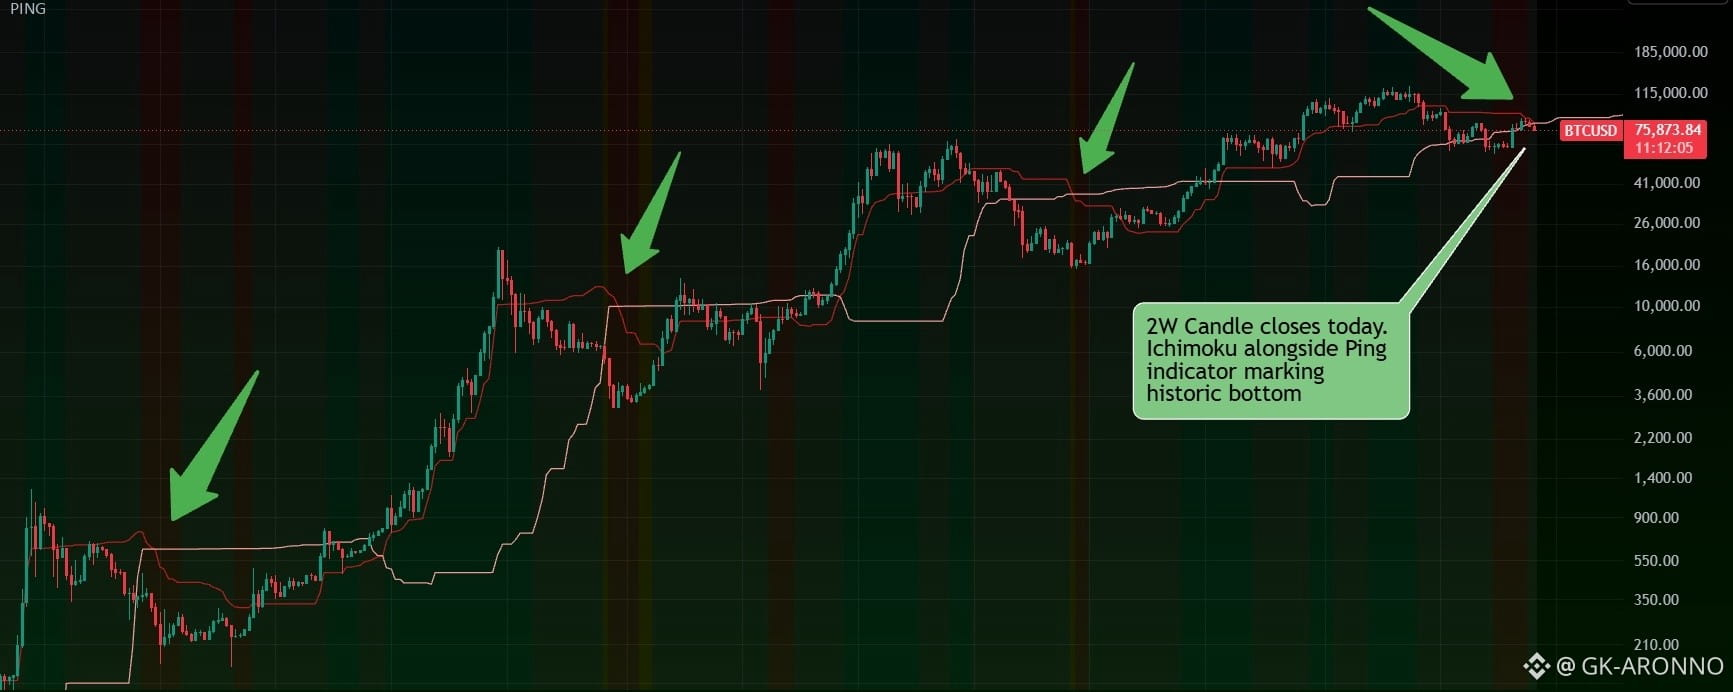
2-week chart, log scale, twelve years of bitcoin with Ichimoku lines and the PING regime tint.
2015: the bear phase took price well below the Ichimoku lines. The tint printed through the bottom zone, and that zone became the cycle low.
2018: same sequence. Price below the lines, the tint printed into the December 2018 low, and that became the cycle low.
2022: third time. Price below the lines, the tint printed into the November low, and that became the cycle low.
Now: price is at 75k, below the Ichimoku lines, and the tint is printing again. The 2W candle closes today.
Why it Matters
Two weeks ago i published the bearish side of this chart: Two Clocks Striking at Once. In all three prior cycles the bottom came after the Ichimoku cross along with the exit of the red PING tint. So a confirmed cross and a bottom zone signal aren't contradictions. In 2015, 2018, 2022 they were steps in the right sequence.
What I expect next
If the last three cycles tere the guide, the flip doesn't mark a moment. It marks the start of a base, and the prior bottoms tooks months to build. so the read comes in checkpoints, not one candle.
Educational analysis only - not financial advice.