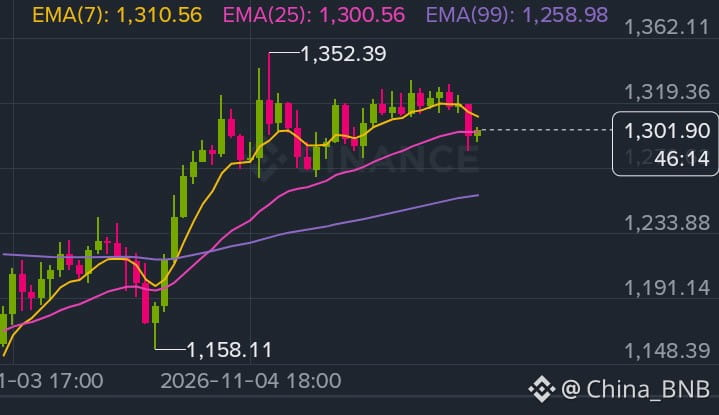

ZEC SIGNAL | LIVE CHART ANALYSIS
$ZEC is showing a bullish recovery, but the next move depends on whether buyers can maintain momentum and defend key support levels.
Market Structure: Bullish momentum is visible on lower timeframes, while the daily trend still requires confirmation.
Technical Outlook:
- RSI: Short-term momentum remains positive.
- Trend: Buyers are attempting to extend the recovery.
- Resistance: $1,350–$1,400 zone.
- Support: $1,300, followed by $1,270.
- Bullish Scenario: A strong breakout above resistance with increasing volume could open the door for further upside.
- Bearish Scenario: Losing support could trigger a pullback toward lower levels.
Trading Strategy: Watch the breakout confirmation, volume expansion, and support reaction before entering. Avoid chasing green candles without confirmation.
Signal: Cautiously Bullish | Confirmation Required
$ZEC is on watch. Let the chart confirm the next move.
Not financial advice. Always manage risk.
$ZEC is showing a bullish recovery, but the next move depends on whether buyers can maintain momentum and defend key support levels.
Market Structure: Bullish momentum is visible on lower timeframes, while the daily trend still requires confirmation.
Technical Outlook:
- RSI: Short-term momentum remains positive.
- Trend: Buyers are attempting to extend the recovery.
- Resistance: $1,350–$1,400 zone.
- Support: $1,300, followed by $1,270.
- Bullish Scenario: A strong breakout above resistance with increasing volume could open the door for further upside.
- Bearish Scenario: Losing support could trigger a pullback toward lower levels.
Trading Strategy: Watch the breakout confirmation, volume expansion, and support reaction before entering. Avoid chasing green candles without confirmation.
Signal: Cautiously Bullish | Confirmation Required
$ZEC is on watch. Let the chart confirm the next move.
Not financial advice. Always manage risk.