

H4 Bias: Bearish
Structure State: Strong Bearish Continuation — Approaching Demand
Market Structure
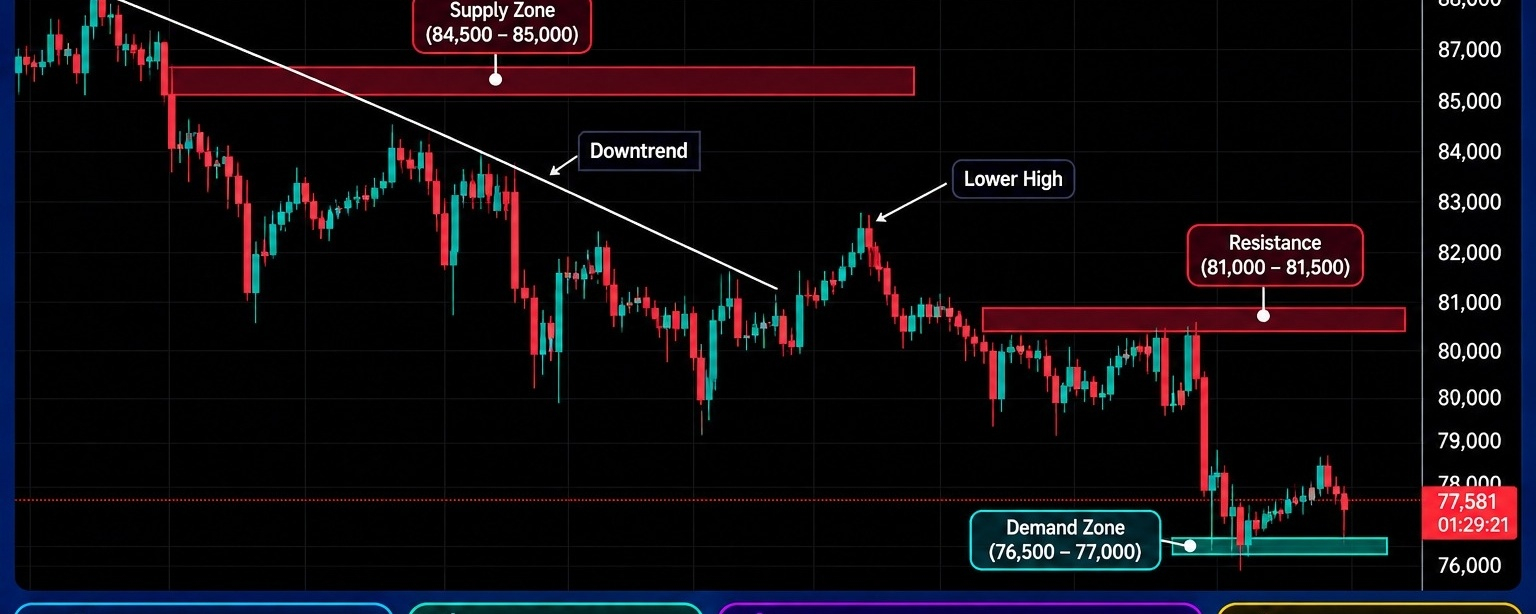
$BTC maintains a clear bearish H4 structure, with the chart showing a descending sequence of lower highs and lower lows. The broader decline developed beneath a descending trendline originating from the earlier high region around 88,000. This trendline reflects the persistent selling pressure that has controlled the market throughout the visible downward movement.
Price previously consolidated around the 80,000 region, but the consolidation failed to produce a sustained bullish reversal. The subsequent bearish displacement pushed price lower, reinforcing the existing structure and bringing the market toward the current demand area.
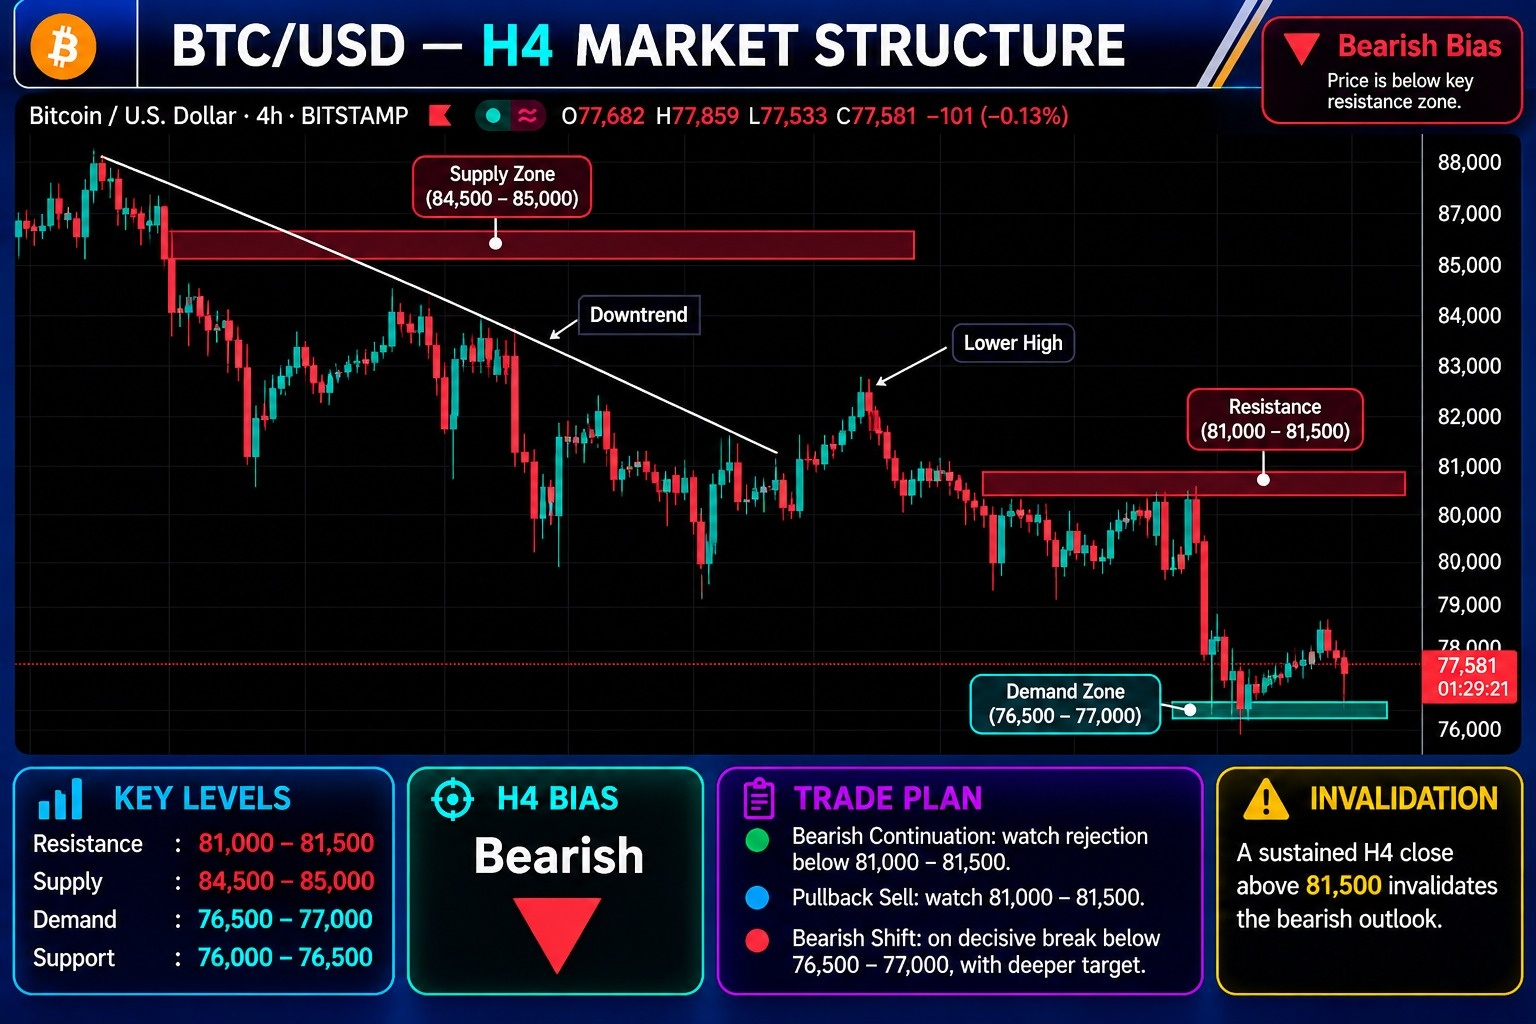
The current price is 77,581, placing BTC/USD just above the marked 76,500–77,000 demand region and close to the additional support area around 76,000–76,500. This is a critical area because the market has already experienced substantial downside movement. A confirmed breakdown beneath demand would support further bearish continuation, while a strong reaction could produce a corrective recovery toward the nearest resistance.
The descending trendline remains an important structural reference. Unless price breaks above the trendline and begins establishing higher highs and higher lows, the broader bearish interpretation remains valid.
Key Resistance
The immediate resistance zone is 81,000–81,500. This is the first important area to monitor during any upward retracement. A rejection from this region would support the prevailing bearish structure.
The higher supply zone is 84,500–85,000, which represents a broader overhead selling area if price manages to recover beyond immediate resistance.
Key Support
The primary demand region is 76,500–77,000. Price is currently trading close to this zone, making its reaction important for the next H4 development.
The nearby support region is 76,000–76,500. A decisive move beneath these levels would indicate that the current demand response is failing and that bearish momentum may be extending.
FVG — Fair Value Gap
The bearish displacement following the breakdown from the 80,000 consolidation suggests potential imbalance during the downward move. However, the chart does not provide sufficiently precise boundaries to identify a confirmed FVG range. The marked 81,000–81,500 resistance remains the clearer reference for a possible pullback reaction.
Order Block (OB)
The 84,500–85,000 supply zone is the principal higher area to monitor for potential bearish order-block activity. The immediate 81,000–81,500 resistance region is also important as a potential selling area during a recovery. More precise candle-specific OB boundaries are not established clearly enough by the visible chart.
Liquidity Map
Sell-side liquidity is concentrated beneath the 76,500–77,000 demand region, with the nearby 76,000–76,500 support providing an additional downside reference. A decisive break beneath these levels could expose further selling pressure. Buy-side liquidity may remain above recent lower highs, particularly around 81,000–81,500 and the higher 84,500–85,000 supply region.
Trade Scenarios
Bearish continuation: A recovery toward 81,000–81,500 followed by a clear rejection would support continuation of the existing downtrend. A confirmed H4 breakdown beneath 76,500–77,000 would provide further evidence of bearish strength and expose the lower support region.
Bullish recovery: Buyers must first defend the current demand area and reclaim 81,000–81,500. A sustained move above this resistance, supported by a break of the descending trendline, would be a more meaningful indication of improving momentum. Until then, upward movement should be treated as corrective.
Invalidation
A sustained H4 close above 81,500 would invalidate the immediate bearish outlook. A stronger recovery through 84,500–85,000 would challenge the broader bearish structure more significantly.
Professional Summary
BTC/USD remains firmly bearish on the H4 timeframe. The descending trendline, sequence of lower highs and lower lows, and recent breakdown from the 80,000 consolidation all support the prevailing downside structure. The current price of 77,581 is approaching the 76,500–77,000 demand zone, making this the immediate decision area. A confirmed breakdown would strengthen bearish continuation, whereas a recovery needs to reclaim 81,000–81,500 before a meaningful shift in momentum can be considered.
Risk Consideration: Price is already close to demand following a strong decline. Fresh bearish positions directly above the support area may face a corrective reaction. Confirmation beneath demand or a rejection from resistance offers a more reliable structural basis.