

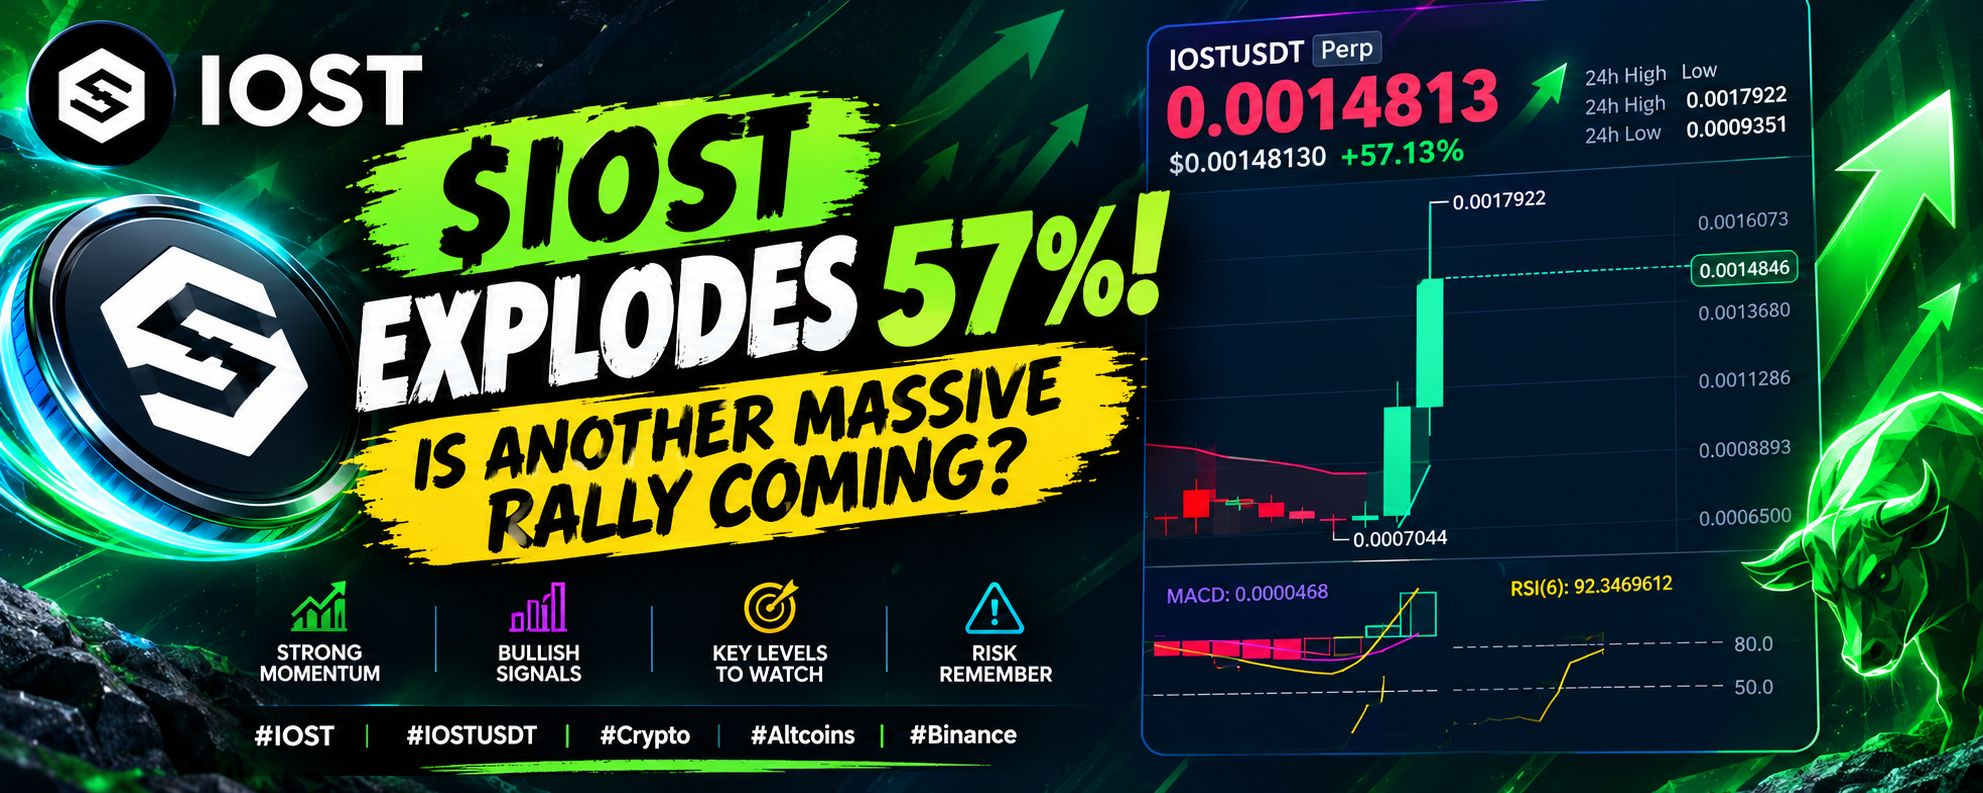

$IOST is making a powerful move in the crypto market! 🔥 According to the chart, IOSTUSDT is trading around $0.0014813, up approximately 57.13% in 24 hours, after a strong breakout from the $0.00070 area.
📈 What Does the Chart Say?
The daily chart shows strong bullish momentum, with consecutive green candles pushing the price toward the $0.0015 zone. The MACD has turned positive, suggesting increasing buying pressure. However, the RSI is around 92, indicating extremely overbought conditions and a higher risk of a short-term pullback.
🎯 Key Levels to Watch
- Resistance: $0.00160–$0.00179
- Support: $0.00136, then $0.00113
- Major breakout high: $0.0017922
If buyers maintain momentum and the price breaks above $0.00160, IOST could attempt to retest its recent high. On the other hand, profit-taking could trigger a correction toward nearby support levels.
⚠️ My Take: The trend looks bullish, but chasing a coin after a 57% rally can be risky. Watch for consolidation, volume, and confirmation before making a decision.
What do you think? Can $IOST break $0.00179 and continue higher, or is a correction coming first? 👇