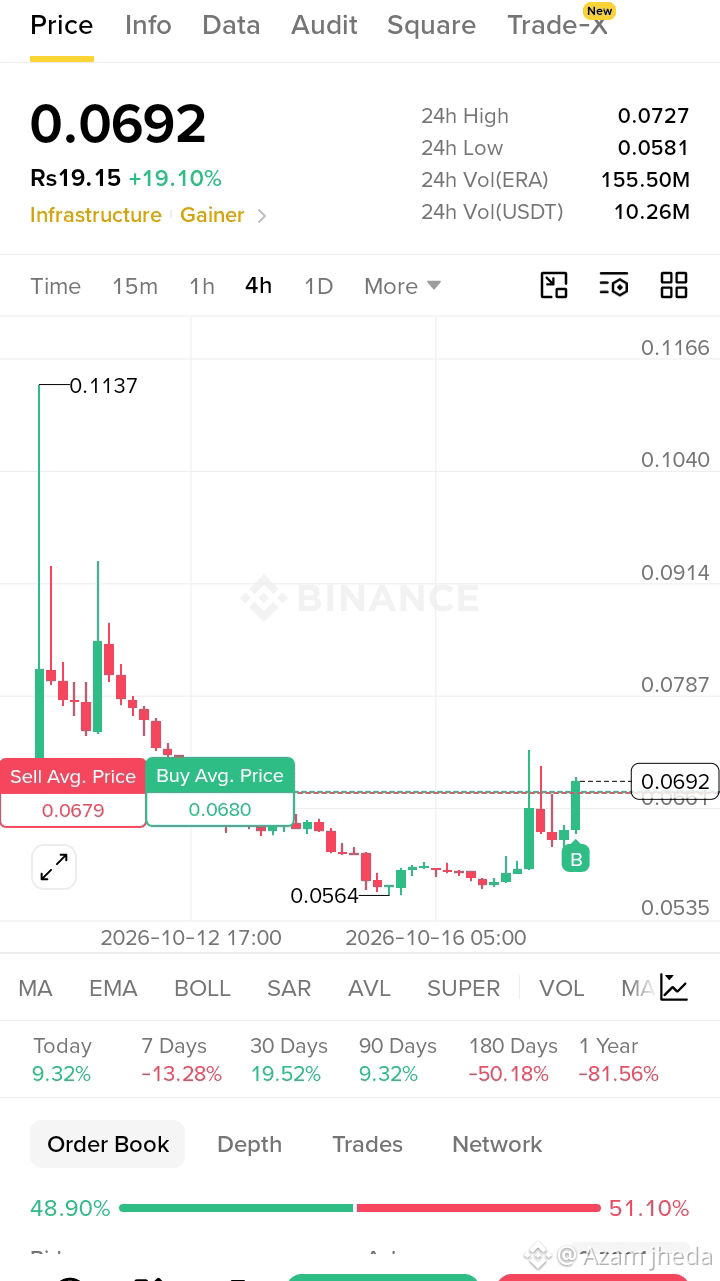
Price: approximately $ERA 0.0628
24-hour high: $0.0770
24-hour low: $0.0577
24-hour change: approximately +8.46% at the daily close.
Trading volume: increased significantly during the recent price movement.
ERA experienced a sharp price increase followed by a pullback. This indicates high volatility, so chasing the price after a pump can be risky. �
ChartExchange
Note: These figures are from October 17, not verified live prices for October 18.
2. Important Support and Resistance
Level
Price (USDT)
Significance
Resistance 2
$0.0770
Recent daily high
Resistance 1
$0.0670–$0.0700
Potential selling zone
Support 1
$0.0600–$0.0620
Near-term support area
Support 2
$0.0570–$0.0580
Recent low area
Support 3
$0.0540–$0.0550
Possible lower support
These are indicative technical levels, not guaranteed turning points. Confirm them against the live Binance chart before trading.
3. Bullish Scenario 📈
ERA could recover if:
The price holds above $0.0600–$0.0620.
Buying volume increases.
The price breaks above $0.0670–$0.0700 and holds that area.
A sustained breakout could open the way toward $0.0770.
4. Bearish Scenario 📉
If ERA loses the $0.0600 support area:
The price could retest $0.0570–$0.0580.
A breakdown below $0.0570 could expose the $0.0540–$0.0550 area.
5. Should You Buy ERA Today?
My view: Wait for confirmation rather than buying immediately after a sharp pump.
Spot trading: Wait for support to hold or a confirmed breakout.
If you already own ERA: Watch the support levels and consider your acceptable loss.
If you are a beginner: Avoid investing your entire balance in this volatile coin.
Crypto prices can move sharply in either direction, and no setup guarantees profit.
not Financial advice
#CelestiaRises16%To2026High #NasdaqDowWeeklyGapWidestSinceJuly2002