The question every holder is quietly asking right now: is $ETH just coiling, or is this the calm before a real move?
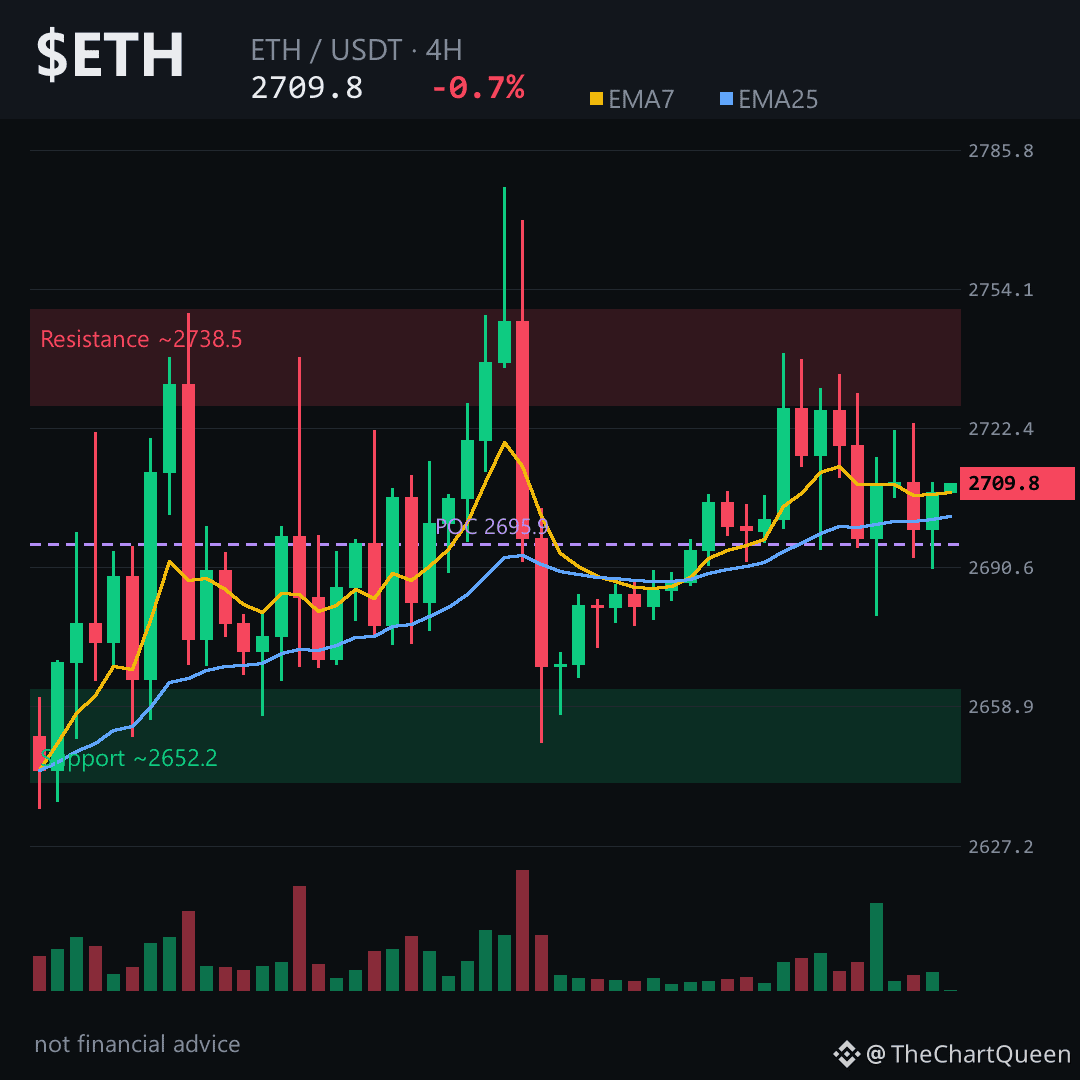
Here's the uncomfortable truth: the 4H chart shows price pinned between two short-term averages — the faster one (EMA7) and the slower one (EMA25) — separated by only a few dollars. That kind of squeeze often resolves with a sharp push, not a gentle drift. And right now, the slight upward tilt of both averages suggests the easier path may be higher.
But there’s a hidden tension worth noting. Funding is negative — meaning shorts are paying longs to stay in their positions. That’s unusual when price is holding near local highs. Open interest also looks thin. Translation: the move may come from spot buyers stepping in, not leveraged traders chasing. That tends to be healthier and slower, but also less explosive.
The level that matters most on the 4H picture is the ~2700 area. As long as $ETH holds above that zone — think of it as the market’s current “fair value” shelf — the path toward the ~2790 area stays open. Lose the ~2650 area on a 4H close, however, and the short-term bull case is simply wrong.
My read: the structure leans bullish, but it’s a patient, low-leverage kind of bullish. The real risk is chop, not a crash.
Where’s the one level you’re watching on $ETH right now? 👇
#ETH #Ethereum #Crypto #BinanceSquare
Follow for the next read on this chart.
⚠️ Not financial advice. DYOR.
Here's the uncomfortable truth: the 4H chart shows price pinned between two short-term averages — the faster one (EMA7) and the slower one (EMA25) — separated by only a few dollars. That kind of squeeze often resolves with a sharp push, not a gentle drift. And right now, the slight upward tilt of both averages suggests the easier path may be higher.
But there’s a hidden tension worth noting. Funding is negative — meaning shorts are paying longs to stay in their positions. That’s unusual when price is holding near local highs. Open interest also looks thin. Translation: the move may come from spot buyers stepping in, not leveraged traders chasing. That tends to be healthier and slower, but also less explosive.
The level that matters most on the 4H picture is the ~2700 area. As long as $ETH holds above that zone — think of it as the market’s current “fair value” shelf — the path toward the ~2790 area stays open. Lose the ~2650 area on a 4H close, however, and the short-term bull case is simply wrong.
My read: the structure leans bullish, but it’s a patient, low-leverage kind of bullish. The real risk is chop, not a crash.
Where’s the one level you’re watching on $ETH right now? 👇
#ETH #Ethereum #Crypto #BinanceSquare
Follow for the next read on this chart.
⚠️ Not financial advice. DYOR.