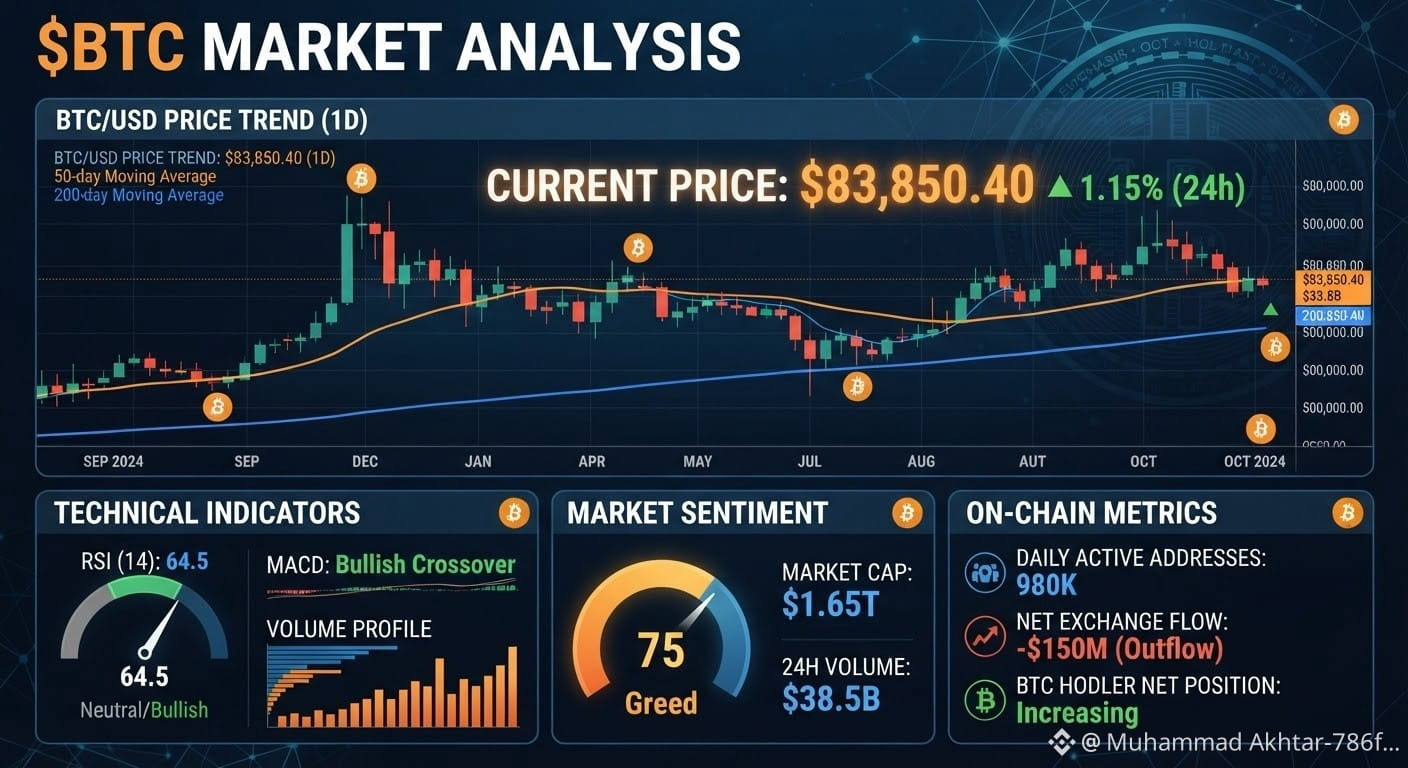
Bitcoin ($BTC ) Market Analysis & Overview
Bitcoin is trading in a constructive consolidation phase near the $83,400 to $84,500 range, balancing between softer macroeconomic inflation pressures and persistent Treasury yield headwind pressures.
Key Market Fundamentals & Macro Drivers
Macro Data & Rate Expectations: Recent U.S. PCE inflation metrics came in softer than consensus expectations, which initially eased tightening fears from the Federal Reserve and supported a push toward the $85,000 zone. However, elevated U.S. Treasury yields continue to cap aggressive upside extensions.
Institutional Flows & ETFs: Spot Bitcoin ETFs have experienced mixed institutional data flows—including alternating periods of strong weekly accumulations and intermittent single-day net outflows. Consistent multi-day inflows remain a critical catalyst for driving a decisive breakout.
Seasonal Trends: Entering October (historically known for positive historical seasonality or "Uptober"), market participants are closely watching whether BTC can clear major overhead barriers.
Technical Indicators & Key Price Levels
Indicator / Metric
Current Technical Zone
Outlook / Interpretation
Immediate Support
$83,300 – $83,400
Critical near-term floor where buyers must remain active to sustain the current structure.
Deeper Support Buffer
$80,900 – $82,000
Aligns with major daily moving averages (including the 20-day and 50-day MAs).
Immediate Resistance
$84,200 – $84,600
Overhead supply zone; clearing this range opens up tests toward $86,000 – $88,000.
Actionable Strategic Plan
Monitor Support Stability: Watch how Bitcoin behaves around the $83,300 support boundary; a failure to hold this zone could signal a deeper retest toward the $81,000 structural moving averages.
Track Institutional Flows: Keep an eye on consecutive daily net inflows or outflows in U.S. spot Bitcoin ETFs as a gauge for active institutional conviction.
$BTC #BTC☀️ #ETHUp70%InQ3ButLiquidityFalls #FedOctoberHoldOdds82.3%
Bitcoin is trading in a constructive consolidation phase near the $83,400 to $84,500 range, balancing between softer macroeconomic inflation pressures and persistent Treasury yield headwind pressures.
Key Market Fundamentals & Macro Drivers
Macro Data & Rate Expectations: Recent U.S. PCE inflation metrics came in softer than consensus expectations, which initially eased tightening fears from the Federal Reserve and supported a push toward the $85,000 zone. However, elevated U.S. Treasury yields continue to cap aggressive upside extensions.
Institutional Flows & ETFs: Spot Bitcoin ETFs have experienced mixed institutional data flows—including alternating periods of strong weekly accumulations and intermittent single-day net outflows. Consistent multi-day inflows remain a critical catalyst for driving a decisive breakout.
Seasonal Trends: Entering October (historically known for positive historical seasonality or "Uptober"), market participants are closely watching whether BTC can clear major overhead barriers.
Technical Indicators & Key Price Levels
Indicator / Metric
Current Technical Zone
Outlook / Interpretation
Immediate Support
$83,300 – $83,400
Critical near-term floor where buyers must remain active to sustain the current structure.
Deeper Support Buffer
$80,900 – $82,000
Aligns with major daily moving averages (including the 20-day and 50-day MAs).
Immediate Resistance
$84,200 – $84,600
Overhead supply zone; clearing this range opens up tests toward $86,000 – $88,000.
Actionable Strategic Plan
Monitor Support Stability: Watch how Bitcoin behaves around the $83,300 support boundary; a failure to hold this zone could signal a deeper retest toward the $81,000 structural moving averages.
Track Institutional Flows: Keep an eye on consecutive daily net inflows or outflows in U.S. spot Bitcoin ETFs as a gauge for active institutional conviction.
$BTC #BTC☀️ #ETHUp70%InQ3ButLiquidityFalls #FedOctoberHoldOdds82.3%