

#DEXE
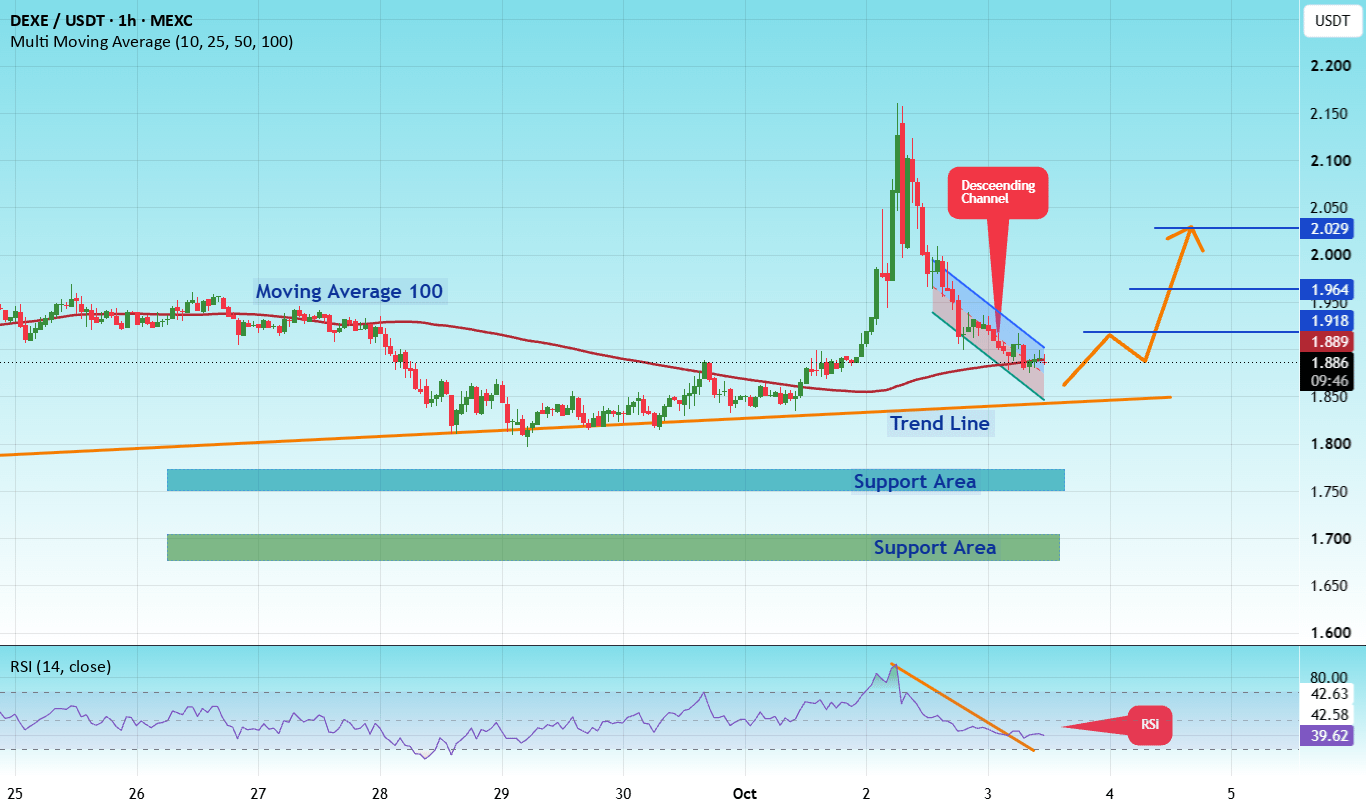
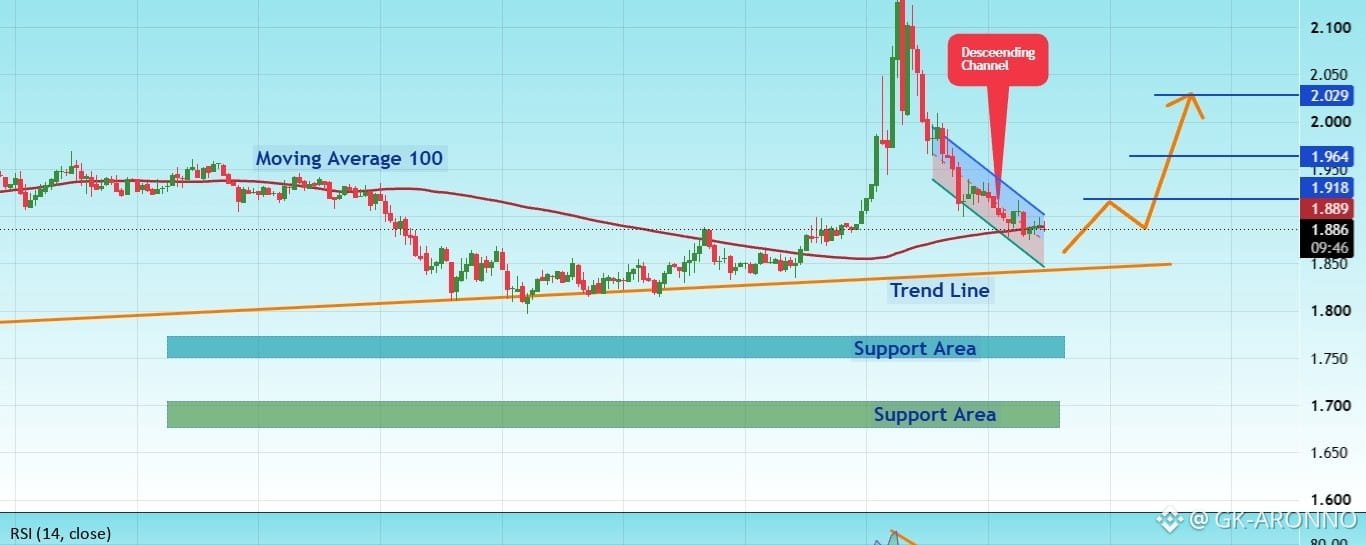
The price is moving within a descending channel on the 1-hour timeframe; it has reached the lower boundary and is poised for a rebound, suggesting a potential upward move upon retesting this level.
The Relative Strength Index (RSI) indicates a bearish trend, yet a bullish breakout is likely given that the price has reached "oversold" levels on the 1-hour chart.
An orange trendline supports the likelihood of a bullish rebound.
There is an initial support level at 1.75, acting as a preliminary support zone.
A key support zone (marked in green) exists at 1.67; the price has bounced from this area multiple times, making it a strong support level.
The price is heading toward the 100-period moving average (a level currently being approached), reinforcing the potential for an upward move.
Entry Price: 1.88
Target 1: 1.918
Target 2: 1.96
Target 3: 2.03
Stop Loss: At the green resistance zone.
Remember this simple rule: capital management.
If you have any questions, please leave a comment.
Thank you.