

AbdullRauf
8.2k Posts

AbdullRauf
 Square Verified
Report
Block User
Hi Guys i am Spot trader specialist in Intra Daytrade, DCA and Swing trade. Follow me tostay updated about market and Binance reward Campaigns.
Open Trade

DUSK Holder
Frequent Trader
1.4 Years
1.1K+ Following
33.9K+ Followers
29.7K+ Liked
Posts
Portfolio
All
Quotes
Videos
Live
PINNED
·
--
YOU’RE AMAZING! Here’s a Thank You Giveaway. ✨
Body:
A massive shoutout to our Square supporters! We see you, we appreciate you, and to say thanks, we're giving away 2000 FREE GIFTS! 🎉
Join the fun & enter to win:
✅ Follow us
✅ Share this post
✅ Comment anything below! 666
Winners are chosen randomly. Let's go! 🚀
YOU’RE AMAZING! Here’s a Thank You Giveaway. ✨
Body:
A massive shoutout to our Square supporters! We see you, we appreciate you, and to say thanks, we're giving away 2000 FREE GIFTS! 🎉
Join the fun & enter to win:
✅ Follow us
✅ Share this post
✅ Comment anything below! 666
Winners are chosen randomly. Let's go! 🚀
Body:
A massive shoutout to our Square supporters! We see you, we appreciate you, and to say thanks, we're giving away 2000 FREE GIFTS! 🎉
Join the fun & enter to win:
✅ Follow us
✅ Share this post
✅ Comment anything below! 666
Winners are chosen randomly. Let's go! 🚀

776
27
41
776



·
--
anuu
anuu

CZ_ANUU
·
--
BREAKING: Over $550 BILLION has been wiped out from gold and silver in the last 3 hours.
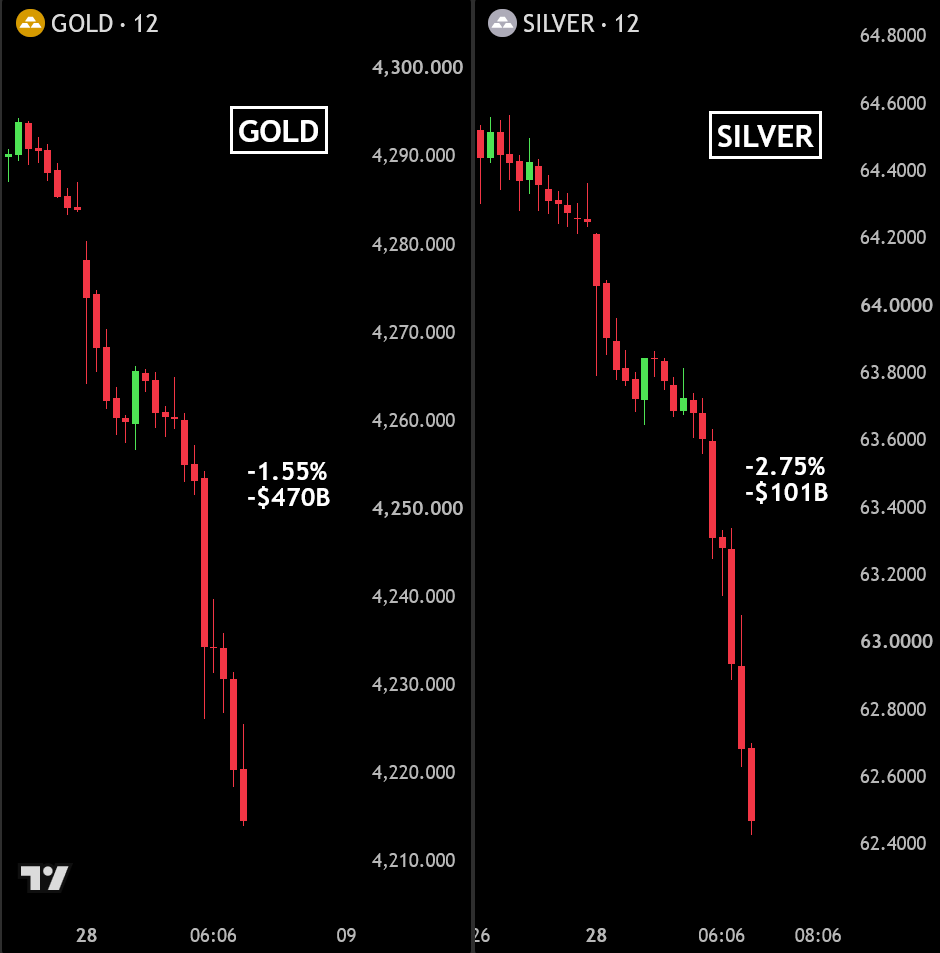
1
617
·
--
SNM
SNM

SNM Khan
·
--
THE FINAL $BTC BULL TRAP IS HERE.
Don’t fall for the failed relief rally.
Another bearish rejection will trigger fresh lows.
This pattern has never missed. Let's see What The Next Move
$86K → $73K → $65K → $53K
Save this now. revisit it later. Call Me#TheOne #SNM_Khan $BTC
Don’t fall for the failed relief rally.
Another bearish rejection will trigger fresh lows.
This pattern has never missed. Let's see What The Next Move
$86K → $73K → $65K → $53K
Save this now. revisit it later. Call Me#TheOne #SNM_Khan $BTC
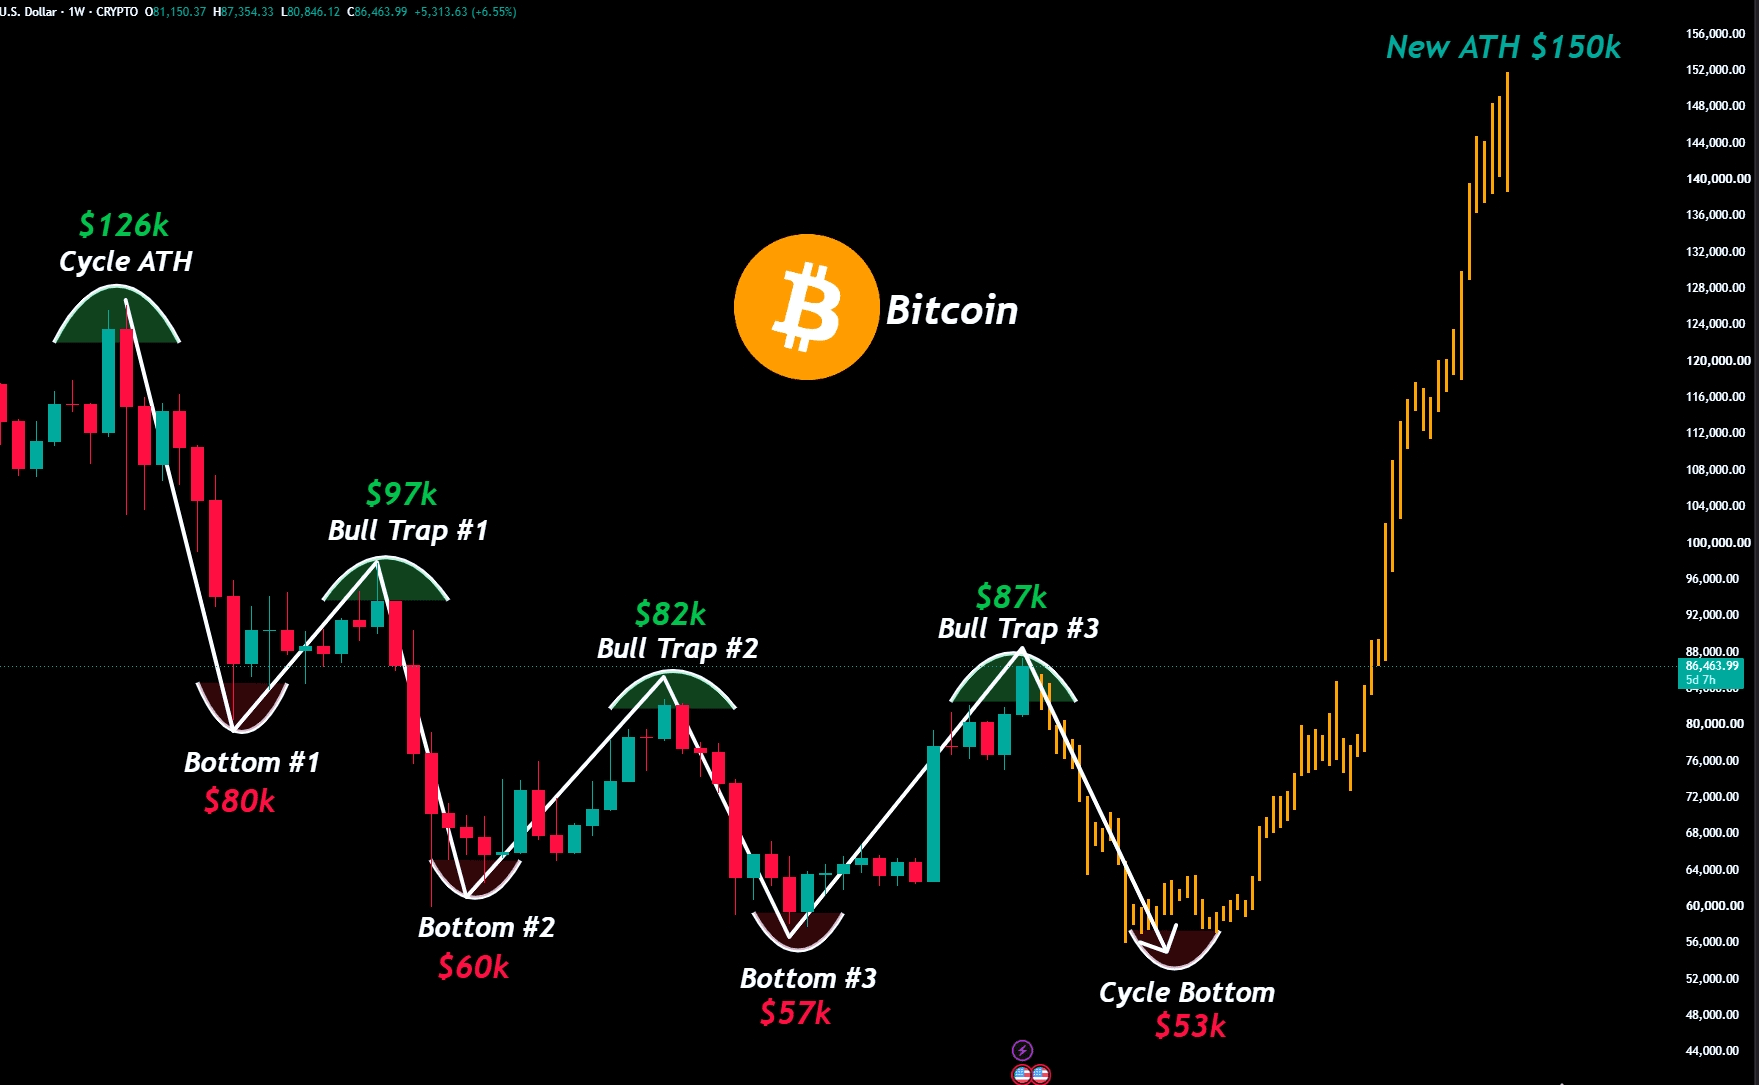
150




·
--

Article
BCH’s 20% Jump Puts the CME Futures Catalyst to WorkMid-caps do not get this kind of headline often. Bitcoin Cash advanced more than 20% after CME Group confirmed plans for cash-settled BCH futures, with a target around October 19 subject to regulatory review. UNI was included in the same expansion. Volume expanded sharply. Open interest rose with the move. Fear & Greed sits near 71, which helps explain why the market was willing to pay immediately for the news.
The announcement reaction is clear. The harder question for pro traders is whether a CME listing can change BCH’s liquidity profile beyond the first impulse, or whether this remains a classic event spike that fades once the date is fully priced.
Why a CME Listing Moves the Tape
CME products matter because they sit inside the institutional stack. Cash-settled futures do not require the same custody mechanics as physically delivered markets, but they still open a regulated venue for hedging, expression, and basis strategies. For assets that have lived mostly on crypto-native exchanges, that is a meaningful change in access.
BCH has long occupied an awkward middle ground: large enough to be familiar, yet less central than BTC or ETH in institutional product design. A dedicated CME contract pushes it closer to the mainstream derivatives complex. That can attract systematic desks, relative-value traders, and hedgers who would not touch a thinner altbook. It can also create a short window where speculative positioning runs ahead of actual institutional participation. Both forces can trade in the same week.
Technical Breakout and Leveraged Positioning
The price response came with the right surface evidence for a real catalyst: a sharp breakout, elevated volume, and expanding open interest. That combination says new risk entered the market rather than pure short covering alone. Elevated funding alongside rising OI is the tactical warning. It shows leveraged longs are paying to hold exposure after a vertical move. That can be sustainable if spot demand remains strong into the listing window. It becomes fragile if price stalls and funding stays rich.
Liquidity conditions around the breakout zone now matter more than the announcement language. If BCH can hold above the post-news range through ordinary two-way flow, the market is treating the listing as a regime shift. If the breakout level fails while funding remains elevated, the move starts to look like an event premium rather than a durable re-rating. Pro traders should define that distinction early rather than negotiating with it after the fact.
Flows, Reserves, and What Sustained Demand Would Look Like
Announcement rallies are easy to spot and hard to trust without flow confirmation. Exchange reserves and large-wallet behavior are the practical filters. Declining exchange balances into strength would support the case that longer-horizon holders are absorbing supply. Rising reserves and rapid turnover would argue that the advance is mostly speculative inventory cycling through the event.
Large-wallet activity needs the same skepticism. A few sizeable transfers can look like accumulation when they are only internal repositioning. What matters is whether net distribution pressure stays muted while open interest and volume remain elevated. If whale flow turns net toward exchanges as the October window approaches, the market will likely demand a higher risk premium for staying long. If coins stay off-exchange and futures basis develops cleanly, the listing thesis gets stronger.
Institutional Access and the Basis Opportunity
The core opportunity is structural. CME futures create a reference market that can tighten price discovery and support basis trades between exchange spot, crypto-native perpetual markets, and the listed contract once it is live. For desks that already run BTC and ETH basis strategies, a BCH contract is an incremental product, not a new asset class. That is exactly why it can matter. Incremental products get used when the operational path is already familiar.
There is also a selection effect. CME does not list everything. Inclusion signals that the venue sees enough client interest, surveillance feasibility, and market integrity to justify the contract. That signal has value. It is not the same thing as guaranteed sustained inflows. Regulatory review still sits between announcement and launch, and launch itself does not force volume. The useful process is to track whether depth, basis stability, and open interest build after the first week of trading rather than assuming the announcement is the whole story.
Risks and Practical Positioning
The main risk is timing. Markets often buy the confirmation and sell the approach to the effective date, especially when the initial reaction exceeds 20%. Positive funding after such a move raises the cost of crowded longs. Another risk is category misreading. A CME listing improves access. It does not rewrite BCH’s fundamental debate or automatically reprice every on-chain metric.
For pro traders, the cleaner framework is event-to-structure. Trade the announcement with tight risk while volume is one-sided if that fits your style, but treat continuation as conditional on held breakout levels, non-deteriorating exchange reserves, and futures OI that looks like two-way institutional interest rather than one-way leverage. Relative performance against BTC also matters. If BCH only outperforms on the headline day and then reverts to beta, the catalyst was real but temporary. If it keeps relative strength as the listing window nears, the access premium is still being valued.
Closing View
CME’s plan for cash-settled BCH futures gave a previously under-served large-cap a rare institutional catalyst, and the market responded immediately with a 20%+ advance, higher volume, and rising open interest. Fear & Greed at 71 helped the reaction travel. That does not settle the trade. It opens a decision window between speculative event premium and a genuine liquidity upgrade.
What the setup suggests is straightforward. The announcement has done its job. From here, price has to prove it can hold the new range while flow data shows more than short-term turnover. If exchange reserves stay orderly and listed futures later attract real open interest, BCH will have earned a stronger place in the institutional derivatives complex. If the bid fades into the date and leverage remains one-sided, this will look like another sharp mid-cap response to a headline that outran follow-through. The listing can still matter either way. Only the post-announcement tape will show whether traders were early to a market-structure shift or late to the reaction.
#BitcoinCash #BCH #CMEBitcoinSpotTrading #crypto #cryptocurrency
$BCH
{spot}(BCHUSDT)
BCH’s 20% Jump Puts the CME Futures Catalyst to Work
Mid-caps do not get this kind of headline often. Bitcoin Cash advanced more than 20% after CME Group confirmed plans for cash-settled BCH futures, with a target around October 19 subject to regulatory review. UNI was included in the same expansion. Volume expanded sharply. Open interest rose with the move. Fear & Greed sits near 71, which helps explain why the market was willing to pay immediately for the news.
The announcement reaction is clear. The harder question for pro traders is whether a CME listing can change BCH’s liquidity profile beyond the first impulse, or whether this remains a classic event spike that fades once the date is fully priced.
Why a CME Listing Moves the Tape
CME products matter because they sit inside the institutional stack. Cash-settled futures do not require the same custody mechanics as physically delivered markets, but they still open a regulated venue for hedging, expression, and basis strategies. For assets that have lived mostly on crypto-native exchanges, that is a meaningful change in access.
BCH has long occupied an awkward middle ground: large enough to be familiar, yet less central than BTC or ETH in institutional product design. A dedicated CME contract pushes it closer to the mainstream derivatives complex. That can attract systematic desks, relative-value traders, and hedgers who would not touch a thinner altbook. It can also create a short window where speculative positioning runs ahead of actual institutional participation. Both forces can trade in the same week.
Technical Breakout and Leveraged Positioning
The price response came with the right surface evidence for a real catalyst: a sharp breakout, elevated volume, and expanding open interest. That combination says new risk entered the market rather than pure short covering alone. Elevated funding alongside rising OI is the tactical warning. It shows leveraged longs are paying to hold exposure after a vertical move. That can be sustainable if spot demand remains strong into the listing window. It becomes fragile if price stalls and funding stays rich.
Liquidity conditions around the breakout zone now matter more than the announcement language. If BCH can hold above the post-news range through ordinary two-way flow, the market is treating the listing as a regime shift. If the breakout level fails while funding remains elevated, the move starts to look like an event premium rather than a durable re-rating. Pro traders should define that distinction early rather than negotiating with it after the fact.
Flows, Reserves, and What Sustained Demand Would Look Like
Announcement rallies are easy to spot and hard to trust without flow confirmation. Exchange reserves and large-wallet behavior are the practical filters. Declining exchange balances into strength would support the case that longer-horizon holders are absorbing supply. Rising reserves and rapid turnover would argue that the advance is mostly speculative inventory cycling through the event.
Large-wallet activity needs the same skepticism. A few sizeable transfers can look like accumulation when they are only internal repositioning. What matters is whether net distribution pressure stays muted while open interest and volume remain elevated. If whale flow turns net toward exchanges as the October window approaches, the market will likely demand a higher risk premium for staying long. If coins stay off-exchange and futures basis develops cleanly, the listing thesis gets stronger.
Institutional Access and the Basis Opportunity
The core opportunity is structural. CME futures create a reference market that can tighten price discovery and support basis trades between exchange spot, crypto-native perpetual markets, and the listed contract once it is live. For desks that already run BTC and ETH basis strategies, a BCH contract is an incremental product, not a new asset class. That is exactly why it can matter. Incremental products get used when the operational path is already familiar.
There is also a selection effect. CME does not list everything. Inclusion signals that the venue sees enough client interest, surveillance feasibility, and market integrity to justify the contract. That signal has value. It is not the same thing as guaranteed sustained inflows. Regulatory review still sits between announcement and launch, and launch itself does not force volume. The useful process is to track whether depth, basis stability, and open interest build after the first week of trading rather than assuming the announcement is the whole story.
Risks and Practical Positioning
The main risk is timing. Markets often buy the confirmation and sell the approach to the effective date, especially when the initial reaction exceeds 20%. Positive funding after such a move raises the cost of crowded longs. Another risk is category misreading. A CME listing improves access. It does not rewrite BCH’s fundamental debate or automatically reprice every on-chain metric.
For pro traders, the cleaner framework is event-to-structure. Trade the announcement with tight risk while volume is one-sided if that fits your style, but treat continuation as conditional on held breakout levels, non-deteriorating exchange reserves, and futures OI that looks like two-way institutional interest rather than one-way leverage. Relative performance against BTC also matters. If BCH only outperforms on the headline day and then reverts to beta, the catalyst was real but temporary. If it keeps relative strength as the listing window nears, the access premium is still being valued.
Closing View
CME’s plan for cash-settled BCH futures gave a previously under-served large-cap a rare institutional catalyst, and the market responded immediately with a 20%+ advance, higher volume, and rising open interest. Fear & Greed at 71 helped the reaction travel. That does not settle the trade. It opens a decision window between speculative event premium and a genuine liquidity upgrade.
What the setup suggests is straightforward. The announcement has done its job. From here, price has to prove it can hold the new range while flow data shows more than short-term turnover. If exchange reserves stay orderly and listed futures later attract real open interest, BCH will have earned a stronger place in the institutional derivatives complex. If the bid fades into the date and leverage remains one-sided, this will look like another sharp mid-cap response to a headline that outran follow-through. The listing can still matter either way. Only the post-announcement tape will show whether traders were early to a market-structure shift or late to the reaction.
#BitcoinCash #BCH #CMEBitcoinSpotTrading #crypto #cryptocurrency
$BCH
The announcement reaction is clear. The harder question for pro traders is whether a CME listing can change BCH’s liquidity profile beyond the first impulse, or whether this remains a classic event spike that fades once the date is fully priced.
Why a CME Listing Moves the Tape
CME products matter because they sit inside the institutional stack. Cash-settled futures do not require the same custody mechanics as physically delivered markets, but they still open a regulated venue for hedging, expression, and basis strategies. For assets that have lived mostly on crypto-native exchanges, that is a meaningful change in access.
BCH has long occupied an awkward middle ground: large enough to be familiar, yet less central than BTC or ETH in institutional product design. A dedicated CME contract pushes it closer to the mainstream derivatives complex. That can attract systematic desks, relative-value traders, and hedgers who would not touch a thinner altbook. It can also create a short window where speculative positioning runs ahead of actual institutional participation. Both forces can trade in the same week.
Technical Breakout and Leveraged Positioning
The price response came with the right surface evidence for a real catalyst: a sharp breakout, elevated volume, and expanding open interest. That combination says new risk entered the market rather than pure short covering alone. Elevated funding alongside rising OI is the tactical warning. It shows leveraged longs are paying to hold exposure after a vertical move. That can be sustainable if spot demand remains strong into the listing window. It becomes fragile if price stalls and funding stays rich.
Liquidity conditions around the breakout zone now matter more than the announcement language. If BCH can hold above the post-news range through ordinary two-way flow, the market is treating the listing as a regime shift. If the breakout level fails while funding remains elevated, the move starts to look like an event premium rather than a durable re-rating. Pro traders should define that distinction early rather than negotiating with it after the fact.
Flows, Reserves, and What Sustained Demand Would Look Like
Announcement rallies are easy to spot and hard to trust without flow confirmation. Exchange reserves and large-wallet behavior are the practical filters. Declining exchange balances into strength would support the case that longer-horizon holders are absorbing supply. Rising reserves and rapid turnover would argue that the advance is mostly speculative inventory cycling through the event.
Large-wallet activity needs the same skepticism. A few sizeable transfers can look like accumulation when they are only internal repositioning. What matters is whether net distribution pressure stays muted while open interest and volume remain elevated. If whale flow turns net toward exchanges as the October window approaches, the market will likely demand a higher risk premium for staying long. If coins stay off-exchange and futures basis develops cleanly, the listing thesis gets stronger.
Institutional Access and the Basis Opportunity
The core opportunity is structural. CME futures create a reference market that can tighten price discovery and support basis trades between exchange spot, crypto-native perpetual markets, and the listed contract once it is live. For desks that already run BTC and ETH basis strategies, a BCH contract is an incremental product, not a new asset class. That is exactly why it can matter. Incremental products get used when the operational path is already familiar.
There is also a selection effect. CME does not list everything. Inclusion signals that the venue sees enough client interest, surveillance feasibility, and market integrity to justify the contract. That signal has value. It is not the same thing as guaranteed sustained inflows. Regulatory review still sits between announcement and launch, and launch itself does not force volume. The useful process is to track whether depth, basis stability, and open interest build after the first week of trading rather than assuming the announcement is the whole story.
Risks and Practical Positioning
The main risk is timing. Markets often buy the confirmation and sell the approach to the effective date, especially when the initial reaction exceeds 20%. Positive funding after such a move raises the cost of crowded longs. Another risk is category misreading. A CME listing improves access. It does not rewrite BCH’s fundamental debate or automatically reprice every on-chain metric.
For pro traders, the cleaner framework is event-to-structure. Trade the announcement with tight risk while volume is one-sided if that fits your style, but treat continuation as conditional on held breakout levels, non-deteriorating exchange reserves, and futures OI that looks like two-way institutional interest rather than one-way leverage. Relative performance against BTC also matters. If BCH only outperforms on the headline day and then reverts to beta, the catalyst was real but temporary. If it keeps relative strength as the listing window nears, the access premium is still being valued.
Closing View
CME’s plan for cash-settled BCH futures gave a previously under-served large-cap a rare institutional catalyst, and the market responded immediately with a 20%+ advance, higher volume, and rising open interest. Fear & Greed at 71 helped the reaction travel. That does not settle the trade. It opens a decision window between speculative event premium and a genuine liquidity upgrade.
What the setup suggests is straightforward. The announcement has done its job. From here, price has to prove it can hold the new range while flow data shows more than short-term turnover. If exchange reserves stay orderly and listed futures later attract real open interest, BCH will have earned a stronger place in the institutional derivatives complex. If the bid fades into the date and leverage remains one-sided, this will look like another sharp mid-cap response to a headline that outran follow-through. The listing can still matter either way. Only the post-announcement tape will show whether traders were early to a market-structure shift or late to the reaction.
#BitcoinCash #BCH #CMEBitcoinSpotTrading #crypto #cryptocurrency
$BCH
1
1
505
·
--

Article
Bitcoin ETFs Take the Cash. Tokenized Markets Are Building the Next Stop.Four strong sessions in a row are hard to ignore. Spot Bitcoin ETFs have absorbed roughly $2.3 billion in net inflows, while Fear & Greed sits near 71. ETF net assets have recovered toward the $111 billion area. At the same time, tokenized equities have pushed distributed value above $3 billion, with holder counts at record levels. MoonPay’s move to acquire North Capital and the continued DTCC and bank tokenization pilots add institutional texture beyond pure BTC demand.
The market is treating this as more than another inflow print. It is asking whether traditional-finance capital is still stopping at Bitcoin, or whether Bitcoin has become the on-ramp into a wider on-chain allocation stack.
Why the Combination Matters Now
ETF demand is the cleanest institutional signal in crypto. When products take billions over consecutive sessions, the bid is not just leverage recycling itself. It is capital moving through regulated channels. A greed reading around 71 supports that process without the full excess that usually marks the end of a move.
What makes this week different is the second leg of the story. Tokenized equities crossing $3 billion in distributed value is still small against global equity markets, but the direction is unambiguous. Holder growth at record levels suggests the user base is expanding, not just a handful of pilot wallets recycling the same balances. Infrastructure deals and market-structure pilots reinforce the same point: the plumbing for on-chain traditional assets is being built while Bitcoin products are still taking the bulk of the flow.
For macro traders, the practical question is rotation. Is BTC absorbing risk capital that would otherwise stay in traditional markets, or is it becoming the first allocation before investors move into tokenized funds, equities, and credit?
Layered Demand: ETFs, Perps, and Positioning
ETF net assets near $111 billion put the product complex back in a zone that commands attention from both crypto-native and traditional desks. Persistent inflows after prior volatility matter more than a single catch-up day. They suggest institutional comfort has returned enough to rebuild exposure rather than merely cover shorts.
Derivatives are participating as well. Perpetual open interest across the complex has climbed to multi-month highs, which means speculative and hedging demand is layered on top of the spot product bid. That combination can extend trends. It can also amplify reversals. Positive ETF flow with rising OI is constructive while price holds structure. The same mix becomes fragile if inflows stall and elevated leverage is left exposed.
Pro traders should separate the two books. The ETF channel is slower money with different constraints. The perpetual complex is faster and more sensitive to funding and liquidation levels. When both rise together, upside can look easy. When they diverge, the tape usually gets honest quickly.
RWA Reality Check: Growth Without Full Utilization
On-chain RWA metrics show tokenized equities and bonds expanding at a meaningful pace. The more honest reading is that issuance and distribution are ahead of deep DeFi utilization. A large share of tokenized value still behaves like a regulated wrapper or pilot instrument rather than active collateral across lending, trading, and structured products. That does not invalidate the trend. It defines the phase.
Infrastructure is catching up. Temporary SEC frameworks, bank tokenization pilots, and DTCC-related experiments matter because institutions do not scale into assets they cannot custody, settle, and report cleanly. MoonPay’s acquisition of North Capital fits the same pattern: payments and distribution businesses moving closer to licensed securities infrastructure. These are not retail meme signals. They are capacity-building moves.
Limited DeFi usage today is the constraint. It is also the opportunity set. If tokenized equities remain siloed, the $3 billion print is mostly a showcase. If they become usable across on-chain markets under clear rules, the addressable surface expands beyond balance-sheet experiments.
Risks, Opportunities, and Portfolio Implications
The main risk is assuming continuous ETF absorption equals a one-way market. Inflows can slow. Leverage can unwind. A greed reading at 71 still leaves room for sentiment to overshoot and then correct. Another risk is category confusion. Bitcoin ETFs and tokenized equities are both “institutional crypto-adjacent,” but they respond to different drivers. BTC remains a macro and liquidity asset. Tokenized equities still depend on regulatory clarity, broker access, and issuer participation.
The opportunity sits in the sequence. Institutions appear more willing to use Bitcoin as the entry point while parallel teams build the rails for broader on-chain exposure. For long-term investors, that supports a barbell view: maintain core BTC exposure through the most liquid regulated products, while tracking which RWA platforms convert pilot value into recurring usage. For pro traders, the edge is in monitoring whether ETF flow leadership continues to pull the whole complex higher, or whether capital begins to prefer tokenized yield and equity products as those markets deepen.
A useful scoreboard is simple: consecutive ETF flow direction, OI and funding conditions, tokenized-equity value and holders, and any evidence that RWA assets are moving from issuance into actual secondary activity.
Closing View
The market is sending two institutional signals at once. Spot Bitcoin ETFs are absorbing large sums again, with net assets near $111 billion and four-session strength near $2.3 billion. Tokenized equities have pushed through $3 billion in distributed value as infrastructure and regulatory work continues in the background. Fear & Greed at 71 helps explain why both stories can trade at the same time.
What the data suggests is not that Bitcoin has been replaced as the institutional priority. It suggests Bitcoin is still the front door. The more interesting development is what is being built after the entry point: tokenized markets, licensed distribution, and settlement experiments that treat on-chain assets as an extension of traditional portfolios rather than a separate casino. Whether that becomes a true rotation or remains a parallel pilot track will depend on utilization, not just issuance. For now, the tape is clear enough. Institutions are comfortable buying the gateway. They are also funding the road beyond it.
#bitcoin
#BTC
#SpotBitcoinETF
#CryptoETFs
#Tokenization
$BTC
{spot}(BTCUSDT)
Bitcoin ETFs Take the Cash. Tokenized Markets Are Building the Next Stop.
Four strong sessions in a row are hard to ignore. Spot Bitcoin ETFs have absorbed roughly $2.3 billion in net inflows, while Fear & Greed sits near 71. ETF net assets have recovered toward the $111 billion area. At the same time, tokenized equities have pushed distributed value above $3 billion, with holder counts at record levels. MoonPay’s move to acquire North Capital and the continued DTCC and bank tokenization pilots add institutional texture beyond pure BTC demand.
The market is treating this as more than another inflow print. It is asking whether traditional-finance capital is still stopping at Bitcoin, or whether Bitcoin has become the on-ramp into a wider on-chain allocation stack.
Why the Combination Matters Now
ETF demand is the cleanest institutional signal in crypto. When products take billions over consecutive sessions, the bid is not just leverage recycling itself. It is capital moving through regulated channels. A greed reading around 71 supports that process without the full excess that usually marks the end of a move.
What makes this week different is the second leg of the story. Tokenized equities crossing $3 billion in distributed value is still small against global equity markets, but the direction is unambiguous. Holder growth at record levels suggests the user base is expanding, not just a handful of pilot wallets recycling the same balances. Infrastructure deals and market-structure pilots reinforce the same point: the plumbing for on-chain traditional assets is being built while Bitcoin products are still taking the bulk of the flow.
For macro traders, the practical question is rotation. Is BTC absorbing risk capital that would otherwise stay in traditional markets, or is it becoming the first allocation before investors move into tokenized funds, equities, and credit?
Layered Demand: ETFs, Perps, and Positioning
ETF net assets near $111 billion put the product complex back in a zone that commands attention from both crypto-native and traditional desks. Persistent inflows after prior volatility matter more than a single catch-up day. They suggest institutional comfort has returned enough to rebuild exposure rather than merely cover shorts.
Derivatives are participating as well. Perpetual open interest across the complex has climbed to multi-month highs, which means speculative and hedging demand is layered on top of the spot product bid. That combination can extend trends. It can also amplify reversals. Positive ETF flow with rising OI is constructive while price holds structure. The same mix becomes fragile if inflows stall and elevated leverage is left exposed.
Pro traders should separate the two books. The ETF channel is slower money with different constraints. The perpetual complex is faster and more sensitive to funding and liquidation levels. When both rise together, upside can look easy. When they diverge, the tape usually gets honest quickly.
RWA Reality Check: Growth Without Full Utilization
On-chain RWA metrics show tokenized equities and bonds expanding at a meaningful pace. The more honest reading is that issuance and distribution are ahead of deep DeFi utilization. A large share of tokenized value still behaves like a regulated wrapper or pilot instrument rather than active collateral across lending, trading, and structured products. That does not invalidate the trend. It defines the phase.
Infrastructure is catching up. Temporary SEC frameworks, bank tokenization pilots, and DTCC-related experiments matter because institutions do not scale into assets they cannot custody, settle, and report cleanly. MoonPay’s acquisition of North Capital fits the same pattern: payments and distribution businesses moving closer to licensed securities infrastructure. These are not retail meme signals. They are capacity-building moves.
Limited DeFi usage today is the constraint. It is also the opportunity set. If tokenized equities remain siloed, the $3 billion print is mostly a showcase. If they become usable across on-chain markets under clear rules, the addressable surface expands beyond balance-sheet experiments.
Risks, Opportunities, and Portfolio Implications
The main risk is assuming continuous ETF absorption equals a one-way market. Inflows can slow. Leverage can unwind. A greed reading at 71 still leaves room for sentiment to overshoot and then correct. Another risk is category confusion. Bitcoin ETFs and tokenized equities are both “institutional crypto-adjacent,” but they respond to different drivers. BTC remains a macro and liquidity asset. Tokenized equities still depend on regulatory clarity, broker access, and issuer participation.
The opportunity sits in the sequence. Institutions appear more willing to use Bitcoin as the entry point while parallel teams build the rails for broader on-chain exposure. For long-term investors, that supports a barbell view: maintain core BTC exposure through the most liquid regulated products, while tracking which RWA platforms convert pilot value into recurring usage. For pro traders, the edge is in monitoring whether ETF flow leadership continues to pull the whole complex higher, or whether capital begins to prefer tokenized yield and equity products as those markets deepen.
A useful scoreboard is simple: consecutive ETF flow direction, OI and funding conditions, tokenized-equity value and holders, and any evidence that RWA assets are moving from issuance into actual secondary activity.
Closing View
The market is sending two institutional signals at once. Spot Bitcoin ETFs are absorbing large sums again, with net assets near $111 billion and four-session strength near $2.3 billion. Tokenized equities have pushed through $3 billion in distributed value as infrastructure and regulatory work continues in the background. Fear & Greed at 71 helps explain why both stories can trade at the same time.
What the data suggests is not that Bitcoin has been replaced as the institutional priority. It suggests Bitcoin is still the front door. The more interesting development is what is being built after the entry point: tokenized markets, licensed distribution, and settlement experiments that treat on-chain assets as an extension of traditional portfolios rather than a separate casino. Whether that becomes a true rotation or remains a parallel pilot track will depend on utilization, not just issuance. For now, the tape is clear enough. Institutions are comfortable buying the gateway. They are also funding the road beyond it.
#bitcoin
#BTC
#SpotBitcoinETF
#CryptoETFs
#Tokenization
$BTC
The market is treating this as more than another inflow print. It is asking whether traditional-finance capital is still stopping at Bitcoin, or whether Bitcoin has become the on-ramp into a wider on-chain allocation stack.
Why the Combination Matters Now
ETF demand is the cleanest institutional signal in crypto. When products take billions over consecutive sessions, the bid is not just leverage recycling itself. It is capital moving through regulated channels. A greed reading around 71 supports that process without the full excess that usually marks the end of a move.
What makes this week different is the second leg of the story. Tokenized equities crossing $3 billion in distributed value is still small against global equity markets, but the direction is unambiguous. Holder growth at record levels suggests the user base is expanding, not just a handful of pilot wallets recycling the same balances. Infrastructure deals and market-structure pilots reinforce the same point: the plumbing for on-chain traditional assets is being built while Bitcoin products are still taking the bulk of the flow.
For macro traders, the practical question is rotation. Is BTC absorbing risk capital that would otherwise stay in traditional markets, or is it becoming the first allocation before investors move into tokenized funds, equities, and credit?
Layered Demand: ETFs, Perps, and Positioning
ETF net assets near $111 billion put the product complex back in a zone that commands attention from both crypto-native and traditional desks. Persistent inflows after prior volatility matter more than a single catch-up day. They suggest institutional comfort has returned enough to rebuild exposure rather than merely cover shorts.
Derivatives are participating as well. Perpetual open interest across the complex has climbed to multi-month highs, which means speculative and hedging demand is layered on top of the spot product bid. That combination can extend trends. It can also amplify reversals. Positive ETF flow with rising OI is constructive while price holds structure. The same mix becomes fragile if inflows stall and elevated leverage is left exposed.
Pro traders should separate the two books. The ETF channel is slower money with different constraints. The perpetual complex is faster and more sensitive to funding and liquidation levels. When both rise together, upside can look easy. When they diverge, the tape usually gets honest quickly.
RWA Reality Check: Growth Without Full Utilization
On-chain RWA metrics show tokenized equities and bonds expanding at a meaningful pace. The more honest reading is that issuance and distribution are ahead of deep DeFi utilization. A large share of tokenized value still behaves like a regulated wrapper or pilot instrument rather than active collateral across lending, trading, and structured products. That does not invalidate the trend. It defines the phase.
Infrastructure is catching up. Temporary SEC frameworks, bank tokenization pilots, and DTCC-related experiments matter because institutions do not scale into assets they cannot custody, settle, and report cleanly. MoonPay’s acquisition of North Capital fits the same pattern: payments and distribution businesses moving closer to licensed securities infrastructure. These are not retail meme signals. They are capacity-building moves.
Limited DeFi usage today is the constraint. It is also the opportunity set. If tokenized equities remain siloed, the $3 billion print is mostly a showcase. If they become usable across on-chain markets under clear rules, the addressable surface expands beyond balance-sheet experiments.
Risks, Opportunities, and Portfolio Implications
The main risk is assuming continuous ETF absorption equals a one-way market. Inflows can slow. Leverage can unwind. A greed reading at 71 still leaves room for sentiment to overshoot and then correct. Another risk is category confusion. Bitcoin ETFs and tokenized equities are both “institutional crypto-adjacent,” but they respond to different drivers. BTC remains a macro and liquidity asset. Tokenized equities still depend on regulatory clarity, broker access, and issuer participation.
The opportunity sits in the sequence. Institutions appear more willing to use Bitcoin as the entry point while parallel teams build the rails for broader on-chain exposure. For long-term investors, that supports a barbell view: maintain core BTC exposure through the most liquid regulated products, while tracking which RWA platforms convert pilot value into recurring usage. For pro traders, the edge is in monitoring whether ETF flow leadership continues to pull the whole complex higher, or whether capital begins to prefer tokenized yield and equity products as those markets deepen.
A useful scoreboard is simple: consecutive ETF flow direction, OI and funding conditions, tokenized-equity value and holders, and any evidence that RWA assets are moving from issuance into actual secondary activity.
Closing View
The market is sending two institutional signals at once. Spot Bitcoin ETFs are absorbing large sums again, with net assets near $111 billion and four-session strength near $2.3 billion. Tokenized equities have pushed through $3 billion in distributed value as infrastructure and regulatory work continues in the background. Fear & Greed at 71 helps explain why both stories can trade at the same time.
What the data suggests is not that Bitcoin has been replaced as the institutional priority. It suggests Bitcoin is still the front door. The more interesting development is what is being built after the entry point: tokenized markets, licensed distribution, and settlement experiments that treat on-chain assets as an extension of traditional portfolios rather than a separate casino. Whether that becomes a true rotation or remains a parallel pilot track will depend on utilization, not just issuance. For now, the tape is clear enough. Institutions are comfortable buying the gateway. They are also funding the road beyond it.
#bitcoin
#BTC
#SpotBitcoinETF
#CryptoETFs
#Tokenization
$BTC
1
328
·
--
Verified
Article
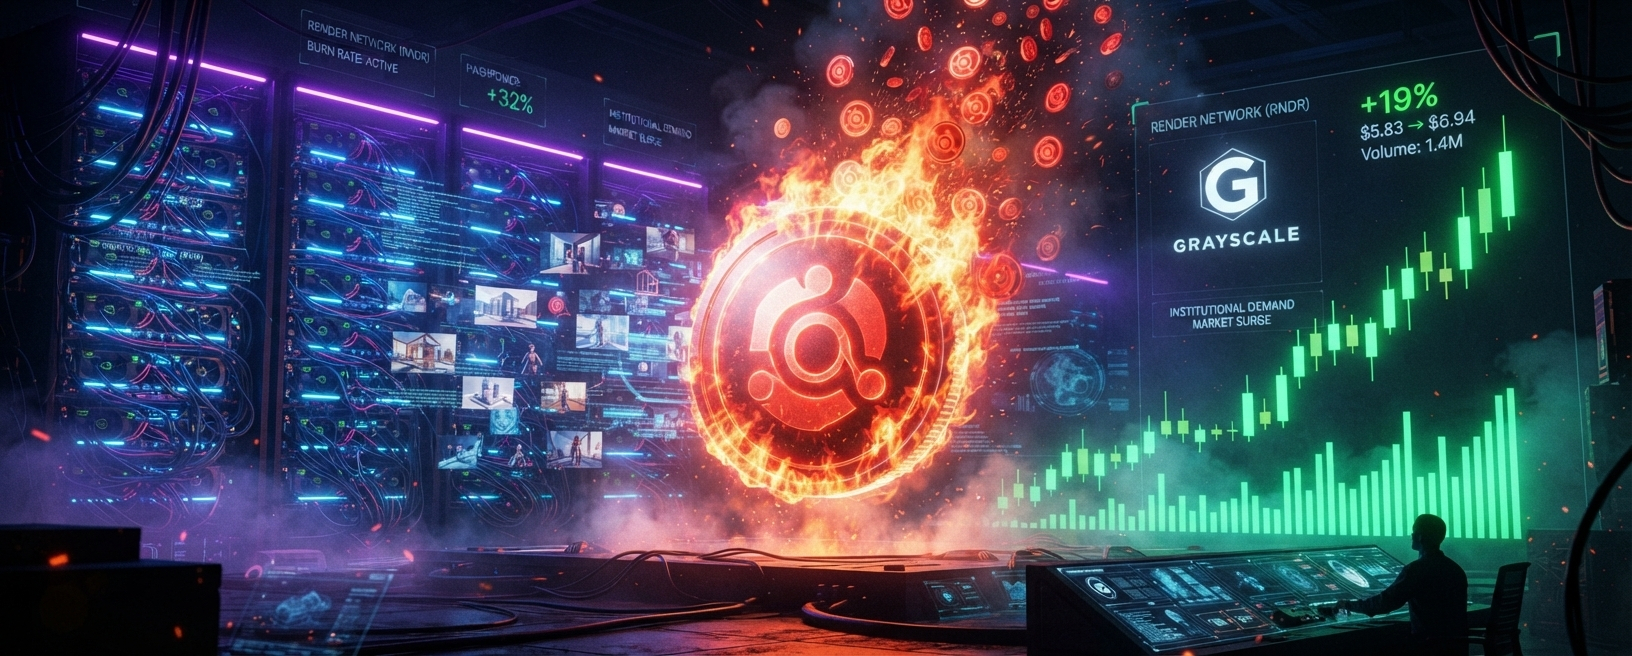
Render’s 19% Bid Puts Usage and Burns Back in the Same FrameAI tokens move for many reasons. Some move on narrative alone. Render’s latest advance came with a cleaner package. The token jumped about 19%, trading near $1.83, as broader AI-linked names stayed firm and Fear & Greed sat around 71. Volume was strong, near $162 million over 24 hours. Network activity reached roughly 77 million rendered frames. About 1.16 million RENDER were burned. Grayscale’s decentralized AI allocation still carries a notable position, around 21% of that fund.
That combination matters more than the percentage gain. Traders are not only asking whether AI beta is working. They are asking whether compute demand and token sinks can keep pace with the supply side of a DePIN network.
Why Render Is Back on the Desk
Risk appetite is clearly present. Greed-range sentiment and strong flows into AI-linked names create room for mid-cap infrastructure to re-rate quickly. Render sits in a more useful corner of that complex than pure story tokens. Its network converts GPU work into measurable output. Frames rendered and tokens burned give the market two numbers it can argue about. One speaks to usage. The other speaks to supply.
What stands out is the institutional overlay. A concentrated Grayscale position does not guarantee price support on any given day. It does show that at least one regulated product channel has treated RENDER as a core decentralized AI exposure rather than a peripheral bet. In a tape already favoring AI infrastructure, that kind of allocation can reinforce attention when on-chain activity is also rising.
Technical Tape and Sector Correlation
The breakout came with rising volume, which is the first filter worth applying. Advances on thin liquidity are easy to dismiss. A roughly 19% move with nine-figure volume forces a more serious read. Momentum is clearly extended. RSI risk is real after a move of this speed. That does not automatically invalidate the breakout. It does mean the next phase often depends on whether price can hold higher levels through a pause rather than needing constant new highs.
Sector correlation remains a central variable. Render still trades as part of the broader AI and DePIN basket. When that basket is in favor, idiosyncratic strength gets amplified. When the basket rotates out, even solid network prints can struggle to hold attention. Pro traders should treat RENDER’s relative strength against both Bitcoin and the wider AI token set as part of the setup, not as an afterthought. If the sector bid fades and Render loses the breakout zone on rising sell volume, the move starts to look like another high-beta spike. If the sector cools and Render holds up better than peers, the usage-and-burn story gains credibility.
On-Chain: Throughput, Burns, and Supply Reality
The burn of about 1.16 million RENDER is the cleanest tokenomic signal in the latest package. Burns only matter if they are recurring and linked to actual network demand rather than one-off events. In Render’s case, the more persuasive argument is the loop: work gets done on the network, activity is visible in frames rendered, and token sinks reduce circulating supply as that work is paid for. That is a different structure from AI tokens that rely mainly on emissions narratives or roadmap optionality.
Seventy-seven million rendered frames help anchor the discussion in throughput. No single print proves durable demand. Sustained utilization does. The market has become more skeptical of DePIN names that can show node counts without showing work. Render’s advantage, when it works, is that the product output is legible. GPU time goes in. Rendered frames come out. The token sits in the middle of that process.
Supply dynamics still deserve caution. Burns improve the marginal picture. They do not erase broader circulating supply or the possibility of distribution into strength. Exchange balances, holder concentration, and whether large wallets lean into or out of rallies remain part of any serious assessment.
Fundamentals, Risks, and Positioning
The fundamental case is that decentralized GPU networks can capture a slice of AI and rendering demand that would otherwise remain entirely inside centralized cloud providers. Cost, availability, and workload flexibility all create openings. Render’s positioning in rendering and related compute markets gives it a clearer commercial surface than many abstract compute tokens. Institutional packaging through vehicles such as Grayscale’s decentralized AI exposure adds another distribution channel for that thesis.
Risks are familiar but still binding. AI narrative premiums can compress quickly when sentiment rolls over. Utilization can soften. Competition from other DePIN compute networks and from traditional cloud pricing remains intense. There is also execution risk inside the token itself: if burns slow while price runs ahead of usage, the market will treat the latest rally as leverage on the sector rather than a re-rating of the network.
For pro traders, the practical approach is to respect the volume-backed breakout while defining invalidation below the post-move support band, especially if funding becomes crowded. For longer-term investors, the better scorecard is still utilization trend, burn persistence, and whether institutional ownership remains sticky through drawdowns rather than only through up weeks.
Closing View
Render’s latest strength is better grounded than a pure narrative spike. A 19% advance, strong volume, millions of rendered frames, a visible token burn, and a meaningful institutional fund weight form a coherent package. Fear & Greed at 71 helps explain why the market was ready to pay for that package now.
The data suggests Render is being treated as one of the cleaner ways to express decentralized GPU demand inside the current AI bid. That status is provisional. It holds if usage and burns continue to show up when the easy momentum fades. It weakens if price keeps rising while the work metrics stall. From here, the useful question is not whether AI compute demand exists. It is whether Render’s burn-plus-usage loop can keep converting that demand into a token structure the market is willing to hold after the first pause.
#render
#RenderNetwork
#DePIN
#aicrypto
Render’s 19% Bid Puts Usage and Burns Back in the Same Frame
AI tokens move for many reasons. Some move on narrative alone. Render’s latest advance came with a cleaner package. The token jumped about 19%, trading near $1.83, as broader AI-linked names stayed firm and Fear & Greed sat around 71. Volume was strong, near $162 million over 24 hours. Network activity reached roughly 77 million rendered frames. About 1.16 million RENDER were burned. Grayscale’s decentralized AI allocation still carries a notable position, around 21% of that fund.
That combination matters more than the percentage gain. Traders are not only asking whether AI beta is working. They are asking whether compute demand and token sinks can keep pace with the supply side of a DePIN network.
Why Render Is Back on the Desk
Risk appetite is clearly present. Greed-range sentiment and strong flows into AI-linked names create room for mid-cap infrastructure to re-rate quickly. Render sits in a more useful corner of that complex than pure story tokens. Its network converts GPU work into measurable output. Frames rendered and tokens burned give the market two numbers it can argue about. One speaks to usage. The other speaks to supply.
What stands out is the institutional overlay. A concentrated Grayscale position does not guarantee price support on any given day. It does show that at least one regulated product channel has treated RENDER as a core decentralized AI exposure rather than a peripheral bet. In a tape already favoring AI infrastructure, that kind of allocation can reinforce attention when on-chain activity is also rising.
Technical Tape and Sector Correlation
The breakout came with rising volume, which is the first filter worth applying. Advances on thin liquidity are easy to dismiss. A roughly 19% move with nine-figure volume forces a more serious read. Momentum is clearly extended. RSI risk is real after a move of this speed. That does not automatically invalidate the breakout. It does mean the next phase often depends on whether price can hold higher levels through a pause rather than needing constant new highs.
Sector correlation remains a central variable. Render still trades as part of the broader AI and DePIN basket. When that basket is in favor, idiosyncratic strength gets amplified. When the basket rotates out, even solid network prints can struggle to hold attention. Pro traders should treat RENDER’s relative strength against both Bitcoin and the wider AI token set as part of the setup, not as an afterthought. If the sector bid fades and Render loses the breakout zone on rising sell volume, the move starts to look like another high-beta spike. If the sector cools and Render holds up better than peers, the usage-and-burn story gains credibility.
On-Chain: Throughput, Burns, and Supply Reality
The burn of about 1.16 million RENDER is the cleanest tokenomic signal in the latest package. Burns only matter if they are recurring and linked to actual network demand rather than one-off events. In Render’s case, the more persuasive argument is the loop: work gets done on the network, activity is visible in frames rendered, and token sinks reduce circulating supply as that work is paid for. That is a different structure from AI tokens that rely mainly on emissions narratives or roadmap optionality.
Seventy-seven million rendered frames help anchor the discussion in throughput. No single print proves durable demand. Sustained utilization does. The market has become more skeptical of DePIN names that can show node counts without showing work. Render’s advantage, when it works, is that the product output is legible. GPU time goes in. Rendered frames come out. The token sits in the middle of that process.
Supply dynamics still deserve caution. Burns improve the marginal picture. They do not erase broader circulating supply or the possibility of distribution into strength. Exchange balances, holder concentration, and whether large wallets lean into or out of rallies remain part of any serious assessment.
Fundamentals, Risks, and Positioning
The fundamental case is that decentralized GPU networks can capture a slice of AI and rendering demand that would otherwise remain entirely inside centralized cloud providers. Cost, availability, and workload flexibility all create openings. Render’s positioning in rendering and related compute markets gives it a clearer commercial surface than many abstract compute tokens. Institutional packaging through vehicles such as Grayscale’s decentralized AI exposure adds another distribution channel for that thesis.
Risks are familiar but still binding. AI narrative premiums can compress quickly when sentiment rolls over. Utilization can soften. Competition from other DePIN compute networks and from traditional cloud pricing remains intense. There is also execution risk inside the token itself: if burns slow while price runs ahead of usage, the market will treat the latest rally as leverage on the sector rather than a re-rating of the network.
For pro traders, the practical approach is to respect the volume-backed breakout while defining invalidation below the post-move support band, especially if funding becomes crowded. For longer-term investors, the better scorecard is still utilization trend, burn persistence, and whether institutional ownership remains sticky through drawdowns rather than only through up weeks.
Closing View
Render’s latest strength is better grounded than a pure narrative spike. A 19% advance, strong volume, millions of rendered frames, a visible token burn, and a meaningful institutional fund weight form a coherent package. Fear & Greed at 71 helps explain why the market was ready to pay for that package now.
The data suggests Render is being treated as one of the cleaner ways to express decentralized GPU demand inside the current AI bid. That status is provisional. It holds if usage and burns continue to show up when the easy momentum fades. It weakens if price keeps rising while the work metrics stall. From here, the useful question is not whether AI compute demand exists. It is whether Render’s burn-plus-usage loop can keep converting that demand into a token structure the market is willing to hold after the first pause.
#render
#RenderNetwork
#DePIN
#aicrypto
That combination matters more than the percentage gain. Traders are not only asking whether AI beta is working. They are asking whether compute demand and token sinks can keep pace with the supply side of a DePIN network.
Why Render Is Back on the Desk
Risk appetite is clearly present. Greed-range sentiment and strong flows into AI-linked names create room for mid-cap infrastructure to re-rate quickly. Render sits in a more useful corner of that complex than pure story tokens. Its network converts GPU work into measurable output. Frames rendered and tokens burned give the market two numbers it can argue about. One speaks to usage. The other speaks to supply.
What stands out is the institutional overlay. A concentrated Grayscale position does not guarantee price support on any given day. It does show that at least one regulated product channel has treated RENDER as a core decentralized AI exposure rather than a peripheral bet. In a tape already favoring AI infrastructure, that kind of allocation can reinforce attention when on-chain activity is also rising.
Technical Tape and Sector Correlation
The breakout came with rising volume, which is the first filter worth applying. Advances on thin liquidity are easy to dismiss. A roughly 19% move with nine-figure volume forces a more serious read. Momentum is clearly extended. RSI risk is real after a move of this speed. That does not automatically invalidate the breakout. It does mean the next phase often depends on whether price can hold higher levels through a pause rather than needing constant new highs.
Sector correlation remains a central variable. Render still trades as part of the broader AI and DePIN basket. When that basket is in favor, idiosyncratic strength gets amplified. When the basket rotates out, even solid network prints can struggle to hold attention. Pro traders should treat RENDER’s relative strength against both Bitcoin and the wider AI token set as part of the setup, not as an afterthought. If the sector bid fades and Render loses the breakout zone on rising sell volume, the move starts to look like another high-beta spike. If the sector cools and Render holds up better than peers, the usage-and-burn story gains credibility.
On-Chain: Throughput, Burns, and Supply Reality
The burn of about 1.16 million RENDER is the cleanest tokenomic signal in the latest package. Burns only matter if they are recurring and linked to actual network demand rather than one-off events. In Render’s case, the more persuasive argument is the loop: work gets done on the network, activity is visible in frames rendered, and token sinks reduce circulating supply as that work is paid for. That is a different structure from AI tokens that rely mainly on emissions narratives or roadmap optionality.
Seventy-seven million rendered frames help anchor the discussion in throughput. No single print proves durable demand. Sustained utilization does. The market has become more skeptical of DePIN names that can show node counts without showing work. Render’s advantage, when it works, is that the product output is legible. GPU time goes in. Rendered frames come out. The token sits in the middle of that process.
Supply dynamics still deserve caution. Burns improve the marginal picture. They do not erase broader circulating supply or the possibility of distribution into strength. Exchange balances, holder concentration, and whether large wallets lean into or out of rallies remain part of any serious assessment.
Fundamentals, Risks, and Positioning
The fundamental case is that decentralized GPU networks can capture a slice of AI and rendering demand that would otherwise remain entirely inside centralized cloud providers. Cost, availability, and workload flexibility all create openings. Render’s positioning in rendering and related compute markets gives it a clearer commercial surface than many abstract compute tokens. Institutional packaging through vehicles such as Grayscale’s decentralized AI exposure adds another distribution channel for that thesis.
Risks are familiar but still binding. AI narrative premiums can compress quickly when sentiment rolls over. Utilization can soften. Competition from other DePIN compute networks and from traditional cloud pricing remains intense. There is also execution risk inside the token itself: if burns slow while price runs ahead of usage, the market will treat the latest rally as leverage on the sector rather than a re-rating of the network.
For pro traders, the practical approach is to respect the volume-backed breakout while defining invalidation below the post-move support band, especially if funding becomes crowded. For longer-term investors, the better scorecard is still utilization trend, burn persistence, and whether institutional ownership remains sticky through drawdowns rather than only through up weeks.
Closing View
Render’s latest strength is better grounded than a pure narrative spike. A 19% advance, strong volume, millions of rendered frames, a visible token burn, and a meaningful institutional fund weight form a coherent package. Fear & Greed at 71 helps explain why the market was ready to pay for that package now.
The data suggests Render is being treated as one of the cleaner ways to express decentralized GPU demand inside the current AI bid. That status is provisional. It holds if usage and burns continue to show up when the easy momentum fades. It weakens if price keeps rising while the work metrics stall. From here, the useful question is not whether AI compute demand exists. It is whether Render’s burn-plus-usage loop can keep converting that demand into a token structure the market is willing to hold after the first pause.
#render
#RenderNetwork
#DePIN
#aicrypto
1
625
·
--
Article
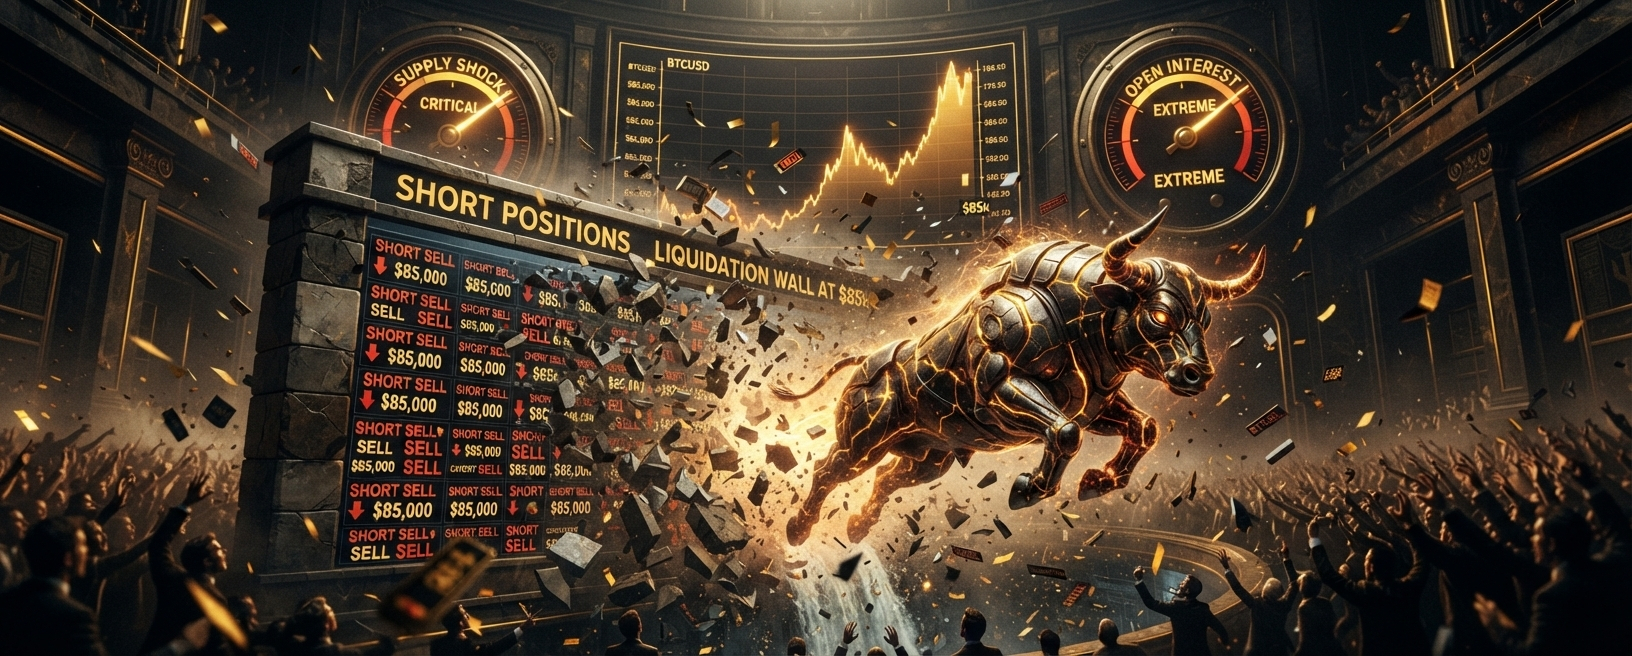
BTC’s $85K Break Turns a Squeeze Into a Positioning TestBitcoin did not drift through $85,000. It was pushed there. The market reclaimed the $85,000 to $86,000 area with a roughly 5% to 6% move over 24 hours, clearing multi-month resistance as short liquidations piled up. Estimates put the short wipeout in the $648 million to $666 million range, inside a broader liquidation total near $750 million. Open interest has been running near recent peaks, around $28.8 billion. Funding remains positive. Fear & Greed sits near 71.
That is a classic squeeze profile. The harder question is what comes after the forced buying. Crowded shorts can fuel a fast leg higher. Crowded longs and elevated open interest can just as easily set up the reversal once the liquidation fuel is gone. Pro traders are not debating whether the squeeze happened. They are debating whether the market still has demand after it.
Why This Level Matters Now
The break above prior resistance changed the immediate technical conversation. Liquidity above the old range was pulled in, and the move accelerated as short clusters between roughly $83,000 and $86,000 were forced to cover. Heatmaps had been flagging that concentration for days. When price enters a dense short band with high open interest, the cascade can become self-reinforcing. That appears to be exactly what traded.
Sentiment is supportive but not off the charts. A Fear & Greed reading around 71 fits a market willing to chase strength without full euphoria. That backdrop helps squeezes extend. It also means there is still room for positioning to become more one-sided from here. Positive funding, including prints around +0.0015% per hour on venues such as Hyperliquid, shows that longs are already paying to stay in. The longer that condition persists after a vertical advance, the more expensive and fragile the long side becomes if spot demand slows.
Derivatives Structure: OI, Funding, and the Post-Squeeze Window
Open interest near $28.83 billion is the central risk variable. High OI into a breakout can mean conviction. It can also mean the market is loaded with leverage that has not yet been resolved. The short side has taken the first major hit. That does not clear the board. It often transfers risk to the long side, especially when funding flips from a short-squeeze accelerant into a carrying cost for late longs.
This is where pure price charts understate the asymmetry. A market that has just cleared short liquidity can keep rising on relatively modest spot demand because forced buyers are still active and remaining shorts are defensive. Once that process completes, the same elevated OI can amplify downside if price fails to hold the breakout zone. The practical tell is acceptance. Holding above the reclaimed band keeps the squeeze-to-trend case alive. Losing it quickly while funding stays positive argues for a more tactical fade or at least a reduction in chase behavior.
On-Chain Supply and the ETF Overlay
The on-chain picture is more nuanced than the liquidation headline. Long-term holder supply outflows have slowed to about 21,700 BTC over 30 days, down from roughly 105,900 earlier. That deceleration matters. Heavy LTH distribution into strength is one of the cleaner warnings of a mature advance. A slower pace removes some of that pressure, though it does not by itself prove accumulation.
OTC desk reserves near record lows, around 123,000 BTC, tighten the picture further. When readily available off-exchange inventory is compressed, even moderate demand can move price more than models based on total free float would suggest. Against that, recent whale net exchange inflows of about 2,753 BTC introduce a caution flag. Coins moving onto exchanges into strength are never a signal to ignore. The size is not extreme on its own, but the direction is the wrong one if the bullish case depends on continued scarcity at the margin.
ETF flow has been supportive in a quieter way. A weekly net figure around +$6.2 million after Friday’s much larger $433 million inflow shows that product demand has not vanished, even if the latest weekly total is modest by recent standards. The market does not need record ETF prints every session to sustain a breakout. It does need the absence of persistent outflows while leverage is this elevated.
Practical Levels and Trader Implications
The operational map is straightforward. The $83,000 to $86,000 region has shifted from overhead liquidity to a zone the market must now defend if the breakout is real. RSI and momentum measures are extended after the cascade, which raises the odds of a pause or a sharp retest. That does not invalidate the move. It changes the preferred expression. Chasing stretched funding after a $648 million-plus short flush is a different trade from buying a controlled retest of the breakout area with cleaner positioning.
What I'm watching is the interaction of three things: open interest direction, funding persistence, and whether exchange-bound whale flow expands from here. Falling OI with stable price would suggest deleveraging without immediate trend failure. Rising OI and rising funding into another vertical leg would increase reversal risk. Expanding exchange inflows while price stalls would argue that supply is meeting the squeeze bid more actively.
Closing View
Bitcoin’s reclaim of $85,000 was driven by mechanics as much as by narrative. Short liquidations cleared a visible band of resistance, open interest remains near peak levels, funding is positive, and available OTC inventory is tight. ETF demand is still present in the background. Whale exchange inflows are the main near-term caution inside an otherwise constructive scarcity setup.
The data suggests asymmetric upside can remain in play as long as the market holds the reclaimed zone and leverage does not become one-sided on the long side. The same data also says this is no longer a clean short-squeeze entry. That trade has largely expressed. From here, the edge shifts to managing the post-cascade regime: respecting the breakout while refusing to ignore elevated OI, positive funding, and any acceleration in coins moving toward exchanges. The next decisive tell will be whether spot and product demand can lead once the forced buyers are done.
$BTC
#BitcoinSquareTurkiye #BTC #ShortSqueeze #BitcoinBreakout
BTC’s $85K Break Turns a Squeeze Into a Positioning Test
Bitcoin did not drift through $85,000. It was pushed there. The market reclaimed the $85,000 to $86,000 area with a roughly 5% to 6% move over 24 hours, clearing multi-month resistance as short liquidations piled up. Estimates put the short wipeout in the $648 million to $666 million range, inside a broader liquidation total near $750 million. Open interest has been running near recent peaks, around $28.8 billion. Funding remains positive. Fear & Greed sits near 71.
That is a classic squeeze profile. The harder question is what comes after the forced buying. Crowded shorts can fuel a fast leg higher. Crowded longs and elevated open interest can just as easily set up the reversal once the liquidation fuel is gone. Pro traders are not debating whether the squeeze happened. They are debating whether the market still has demand after it.
Why This Level Matters Now
The break above prior resistance changed the immediate technical conversation. Liquidity above the old range was pulled in, and the move accelerated as short clusters between roughly $83,000 and $86,000 were forced to cover. Heatmaps had been flagging that concentration for days. When price enters a dense short band with high open interest, the cascade can become self-reinforcing. That appears to be exactly what traded.
Sentiment is supportive but not off the charts. A Fear & Greed reading around 71 fits a market willing to chase strength without full euphoria. That backdrop helps squeezes extend. It also means there is still room for positioning to become more one-sided from here. Positive funding, including prints around +0.0015% per hour on venues such as Hyperliquid, shows that longs are already paying to stay in. The longer that condition persists after a vertical advance, the more expensive and fragile the long side becomes if spot demand slows.
Derivatives Structure: OI, Funding, and the Post-Squeeze Window
Open interest near $28.83 billion is the central risk variable. High OI into a breakout can mean conviction. It can also mean the market is loaded with leverage that has not yet been resolved. The short side has taken the first major hit. That does not clear the board. It often transfers risk to the long side, especially when funding flips from a short-squeeze accelerant into a carrying cost for late longs.
This is where pure price charts understate the asymmetry. A market that has just cleared short liquidity can keep rising on relatively modest spot demand because forced buyers are still active and remaining shorts are defensive. Once that process completes, the same elevated OI can amplify downside if price fails to hold the breakout zone. The practical tell is acceptance. Holding above the reclaimed band keeps the squeeze-to-trend case alive. Losing it quickly while funding stays positive argues for a more tactical fade or at least a reduction in chase behavior.
On-Chain Supply and the ETF Overlay
The on-chain picture is more nuanced than the liquidation headline. Long-term holder supply outflows have slowed to about 21,700 BTC over 30 days, down from roughly 105,900 earlier. That deceleration matters. Heavy LTH distribution into strength is one of the cleaner warnings of a mature advance. A slower pace removes some of that pressure, though it does not by itself prove accumulation.
OTC desk reserves near record lows, around 123,000 BTC, tighten the picture further. When readily available off-exchange inventory is compressed, even moderate demand can move price more than models based on total free float would suggest. Against that, recent whale net exchange inflows of about 2,753 BTC introduce a caution flag. Coins moving onto exchanges into strength are never a signal to ignore. The size is not extreme on its own, but the direction is the wrong one if the bullish case depends on continued scarcity at the margin.
ETF flow has been supportive in a quieter way. A weekly net figure around +$6.2 million after Friday’s much larger $433 million inflow shows that product demand has not vanished, even if the latest weekly total is modest by recent standards. The market does not need record ETF prints every session to sustain a breakout. It does need the absence of persistent outflows while leverage is this elevated.
Practical Levels and Trader Implications
The operational map is straightforward. The $83,000 to $86,000 region has shifted from overhead liquidity to a zone the market must now defend if the breakout is real. RSI and momentum measures are extended after the cascade, which raises the odds of a pause or a sharp retest. That does not invalidate the move. It changes the preferred expression. Chasing stretched funding after a $648 million-plus short flush is a different trade from buying a controlled retest of the breakout area with cleaner positioning.
What I'm watching is the interaction of three things: open interest direction, funding persistence, and whether exchange-bound whale flow expands from here. Falling OI with stable price would suggest deleveraging without immediate trend failure. Rising OI and rising funding into another vertical leg would increase reversal risk. Expanding exchange inflows while price stalls would argue that supply is meeting the squeeze bid more actively.
Closing View
Bitcoin’s reclaim of $85,000 was driven by mechanics as much as by narrative. Short liquidations cleared a visible band of resistance, open interest remains near peak levels, funding is positive, and available OTC inventory is tight. ETF demand is still present in the background. Whale exchange inflows are the main near-term caution inside an otherwise constructive scarcity setup.
The data suggests asymmetric upside can remain in play as long as the market holds the reclaimed zone and leverage does not become one-sided on the long side. The same data also says this is no longer a clean short-squeeze entry. That trade has largely expressed. From here, the edge shifts to managing the post-cascade regime: respecting the breakout while refusing to ignore elevated OI, positive funding, and any acceleration in coins moving toward exchanges. The next decisive tell will be whether spot and product demand can lead once the forced buyers are done.
$BTC
#BitcoinSquareTurkiye #BTC #ShortSqueeze #BitcoinBreakout
That is a classic squeeze profile. The harder question is what comes after the forced buying. Crowded shorts can fuel a fast leg higher. Crowded longs and elevated open interest can just as easily set up the reversal once the liquidation fuel is gone. Pro traders are not debating whether the squeeze happened. They are debating whether the market still has demand after it.
Why This Level Matters Now
The break above prior resistance changed the immediate technical conversation. Liquidity above the old range was pulled in, and the move accelerated as short clusters between roughly $83,000 and $86,000 were forced to cover. Heatmaps had been flagging that concentration for days. When price enters a dense short band with high open interest, the cascade can become self-reinforcing. That appears to be exactly what traded.
Sentiment is supportive but not off the charts. A Fear & Greed reading around 71 fits a market willing to chase strength without full euphoria. That backdrop helps squeezes extend. It also means there is still room for positioning to become more one-sided from here. Positive funding, including prints around +0.0015% per hour on venues such as Hyperliquid, shows that longs are already paying to stay in. The longer that condition persists after a vertical advance, the more expensive and fragile the long side becomes if spot demand slows.
Derivatives Structure: OI, Funding, and the Post-Squeeze Window
Open interest near $28.83 billion is the central risk variable. High OI into a breakout can mean conviction. It can also mean the market is loaded with leverage that has not yet been resolved. The short side has taken the first major hit. That does not clear the board. It often transfers risk to the long side, especially when funding flips from a short-squeeze accelerant into a carrying cost for late longs.
This is where pure price charts understate the asymmetry. A market that has just cleared short liquidity can keep rising on relatively modest spot demand because forced buyers are still active and remaining shorts are defensive. Once that process completes, the same elevated OI can amplify downside if price fails to hold the breakout zone. The practical tell is acceptance. Holding above the reclaimed band keeps the squeeze-to-trend case alive. Losing it quickly while funding stays positive argues for a more tactical fade or at least a reduction in chase behavior.
On-Chain Supply and the ETF Overlay
The on-chain picture is more nuanced than the liquidation headline. Long-term holder supply outflows have slowed to about 21,700 BTC over 30 days, down from roughly 105,900 earlier. That deceleration matters. Heavy LTH distribution into strength is one of the cleaner warnings of a mature advance. A slower pace removes some of that pressure, though it does not by itself prove accumulation.
OTC desk reserves near record lows, around 123,000 BTC, tighten the picture further. When readily available off-exchange inventory is compressed, even moderate demand can move price more than models based on total free float would suggest. Against that, recent whale net exchange inflows of about 2,753 BTC introduce a caution flag. Coins moving onto exchanges into strength are never a signal to ignore. The size is not extreme on its own, but the direction is the wrong one if the bullish case depends on continued scarcity at the margin.
ETF flow has been supportive in a quieter way. A weekly net figure around +$6.2 million after Friday’s much larger $433 million inflow shows that product demand has not vanished, even if the latest weekly total is modest by recent standards. The market does not need record ETF prints every session to sustain a breakout. It does need the absence of persistent outflows while leverage is this elevated.
Practical Levels and Trader Implications
The operational map is straightforward. The $83,000 to $86,000 region has shifted from overhead liquidity to a zone the market must now defend if the breakout is real. RSI and momentum measures are extended after the cascade, which raises the odds of a pause or a sharp retest. That does not invalidate the move. It changes the preferred expression. Chasing stretched funding after a $648 million-plus short flush is a different trade from buying a controlled retest of the breakout area with cleaner positioning.
What I'm watching is the interaction of three things: open interest direction, funding persistence, and whether exchange-bound whale flow expands from here. Falling OI with stable price would suggest deleveraging without immediate trend failure. Rising OI and rising funding into another vertical leg would increase reversal risk. Expanding exchange inflows while price stalls would argue that supply is meeting the squeeze bid more actively.
Closing View
Bitcoin’s reclaim of $85,000 was driven by mechanics as much as by narrative. Short liquidations cleared a visible band of resistance, open interest remains near peak levels, funding is positive, and available OTC inventory is tight. ETF demand is still present in the background. Whale exchange inflows are the main near-term caution inside an otherwise constructive scarcity setup.
The data suggests asymmetric upside can remain in play as long as the market holds the reclaimed zone and leverage does not become one-sided on the long side. The same data also says this is no longer a clean short-squeeze entry. That trade has largely expressed. From here, the edge shifts to managing the post-cascade regime: respecting the breakout while refusing to ignore elevated OI, positive funding, and any acceleration in coins moving toward exchanges. The next decisive tell will be whether spot and product demand can lead once the forced buyers are done.
$BTC
#BitcoinSquareTurkiye #BTC #ShortSqueeze #BitcoinBreakout
264
·
--
Bitcoin Spot ETF Inflows Turn Positive Again
After several days of outflows, Bitcoin Spot ETFs have flipped back to net inflows.
Sep 18: +5,670 BTC
Sep 17: +2,090 BTC
This comes after notable outflows on Sep 15 (-5,760 BTC) and Sep 16 (-3,910 BTC).
The shift suggests some institutional demand is returning, even as price action remains cautious.
Worth watching whether this inflow trend continues over the next few sessions.
$BTC
{spot}(BTCUSDT)
#BTC走势分析
Bitcoin Spot ETF Inflows Turn Positive Again
After several days of outflows, Bitcoin Spot ETFs have flipped back to net inflows.
Sep 18: +5,670 BTC
Sep 17: +2,090 BTC
This comes after notable outflows on Sep 15 (-5,760 BTC) and Sep 16 (-3,910 BTC).
The shift suggests some institutional demand is returning, even as price action remains cautious.
Worth watching whether this inflow trend continues over the next few sessions.
$BTC
#BTC走势分析
After several days of outflows, Bitcoin Spot ETFs have flipped back to net inflows.
Sep 18: +5,670 BTC
Sep 17: +2,090 BTC
This comes after notable outflows on Sep 15 (-5,760 BTC) and Sep 16 (-3,910 BTC).
The shift suggests some institutional demand is returning, even as price action remains cautious.
Worth watching whether this inflow trend continues over the next few sessions.
$BTC
#BTC走势分析
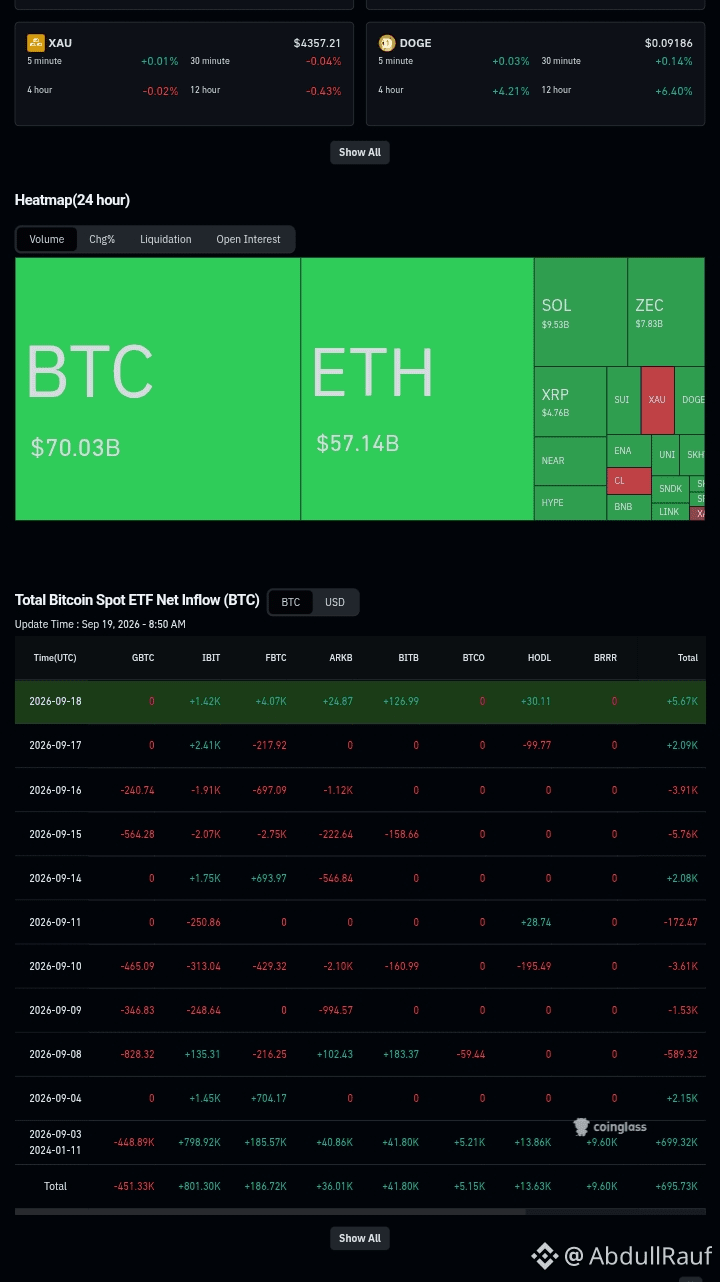
225
·
--
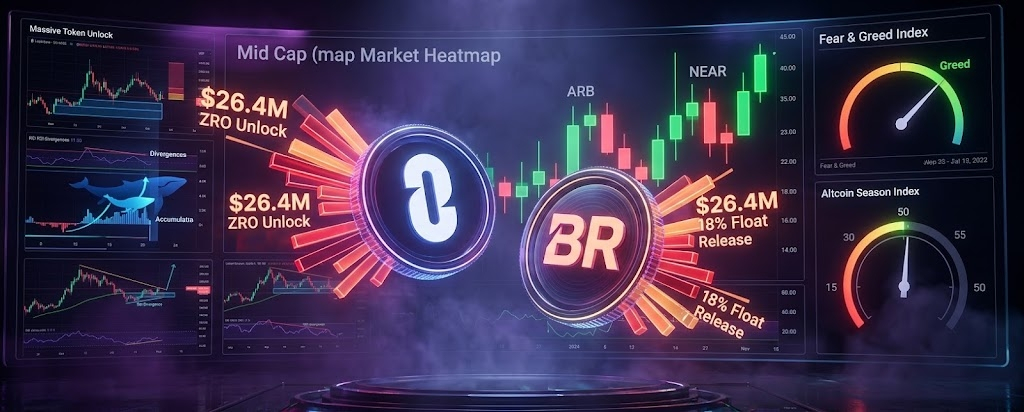
Article
Unlock Day in a Greedy Tape: ZRO and Bedrock Put Float Under the MicroscopeScheduled unlocks rarely arrive at convenient times. Today’s cluster is no exception. LayerZero’s ZRO faces a roughly $26.4 million unlock, equal to about 4.22% of unlocked supply. Bedrock’s release is more aggressive relative to float, with an estimated 18% float impact. Fear & Greed is sitting in Greed territory. The altcoin season index is approaching 50. Mid-caps such as ARB and NEAR have already posted strong weekly moves. That is the backdrop: risk appetite is present, secondary names are active, and fresh supply is landing into the market anyway.
The important distinction is not the headline dollar amount. It is relative float. A $26 million unlock can be routine in a deep book and disruptive in a thin one. An 18% float release is a different category of event. Traders and holders are deciding whether current greed-driven flow is strong enough to absorb that supply—or whether the releases create a lasting overhang.
Why These Unlocks Matter Now
Unlock risk is always about timing and context. In a fearful market, even modest unlocks can accelerate downside because buyers are scarce. In a greedy market, the same unlocks can be absorbed if momentum and inflows are strong enough. The danger is assuming greed automatically solves supply. It often helps. It does not guarantee clearance.
What stands out here is the contrast between the two names. ZRO’s unlock is meaningful but still in a range the market has learned to process when conditions are supportive. Bedrock’s elevated float release is larger relative to what is already trading. Absolute value gets the social-media attention. Relative float usually decides the price path. That is the core angle for both pro traders and longer-term holders watching today’s session and the next several.
Supply Mechanics and Historical Pattern
Vesting events increase circulating supply by definition. The market impact depends on who receives the tokens, whether those recipients are structured sellers, and how quickly inventory reaches exchanges. Rising exchange reserves around an unlock window are the cleaner caution signal. Stable or declining reserves after the event suggest more of the supply is being held or routed carefully rather than dumped into the bid.
Historical patterns in similar FDV-heavy names are mixed but familiar. Markets often sell the rumor into the unlock, then stabilize if broader flow remains supportive. Sometimes the opposite happens: price holds into the event and weakens after, once the new float is actually available. The common mistake is treating the unlock timestamp as the only risk moment. Distribution can begin before and continue after. The window matters more than the single print.
For names with large fully diluted valuations relative to float, each unlock is also a referendum on whether earlier valuations still make sense once more tokens are free to trade. That pressure is structural. It does not require a change in narrative to matter.
On-Chain and Derivatives Context
Around unlock windows, whale behavior becomes more informative than usual. Accumulation into weakness can support the absorption case. Distribution into strength, especially if paired with rising exchange balances, argues for patience rather than aggressive buying. Active addresses and transfer volume often spike into these events. Some of that is noise—wallets repositioning, custodial moves, market-maker inventory. Some of it is real supply seeking liquidity.
On the derivatives side, positive funding around ZRO and related pairs complicates the picture. Positive funding means longs are paying to stay in. That can be sustainable in a strong tape. It becomes expensive and fragile if spot demand fades right as new tokens hit circulation. Open interest elevated into an unlock raises the odds of a fast move once the first wave of supply lands, because leveraged positioning and spot inventory interact. RSI divergences and order-block retests are the practical technical map for that process. If price loses key post-impulse supports while funding stays positive, the unwind can be disorderly. If the book absorbs the float and those supports hold, the unlock can pass as a digested event rather than a regime change.
Risks, Opportunities, and Positioning
The main risk is straightforward. New supply meets a market that has already rewarded mid-caps hard. Late longs financed by positive funding are vulnerable if absorption fails. For Bedrock, the relative float size makes that risk more acute. For ZRO, the risk is less about a single catastrophic percentage and more about whether repeated unlocks steadily cap upside.
There is also opportunity in the same structure. Greed-range conditions and active altcoin flow can clear inventory that would overwhelm a weaker tape. Markets that successfully absorb unlocks sometimes reset positioning and continue higher once forced or scheduled selling is out of the way. That outcome is possible. It should be earned by the order book, not assumed from the sentiment index.
For pro traders, the cleanest approach is event-based discipline: watch relative float, exchange-reserve direction, funding, and whether price can reclaim or hold the pre-unlock range. For longer-term investors, the question is whether these unlocks are ordinary vesting progress or the start of a multi-month supply ceiling. That answer depends less on today’s candle and more on recipient behavior over subsequent sessions.
Closing View
LayerZero and Bedrock are testing the same market quality from different angles. ZRO brings a sizable but more conventional unlock into a constructive sentiment regime. Bedrock brings a much heavier relative float release into the same regime. Altcoin momentum and greed readings improve the odds of absorption. They do not eliminate overhang risk.
What the setup suggests is a sorting event. If bids remain deep and exchange reserves do not persistently rise, these unlocks may be remembered as noise inside a broader mid-cap advance. If supply shows up faster than demand and technical supports give way under positive funding, the market will be reminded that float math still overrides narrative when inventory is large enough. Relative float, not the headline dollar figure, remains the variable to respect.
#BR #zro #Near #ARB
$BR
{future}(BRUSDT)
$ZRO
{spot}(ZROUSDT)
$ARB
{spot}(ARBUSDT)
Unlock Day in a Greedy Tape: ZRO and Bedrock Put Float Under the Microscope
Scheduled unlocks rarely arrive at convenient times. Today’s cluster is no exception. LayerZero’s ZRO faces a roughly $26.4 million unlock, equal to about 4.22% of unlocked supply. Bedrock’s release is more aggressive relative to float, with an estimated 18% float impact. Fear & Greed is sitting in Greed territory. The altcoin season index is approaching 50. Mid-caps such as ARB and NEAR have already posted strong weekly moves. That is the backdrop: risk appetite is present, secondary names are active, and fresh supply is landing into the market anyway.
The important distinction is not the headline dollar amount. It is relative float. A $26 million unlock can be routine in a deep book and disruptive in a thin one. An 18% float release is a different category of event. Traders and holders are deciding whether current greed-driven flow is strong enough to absorb that supply—or whether the releases create a lasting overhang.
Why These Unlocks Matter Now
Unlock risk is always about timing and context. In a fearful market, even modest unlocks can accelerate downside because buyers are scarce. In a greedy market, the same unlocks can be absorbed if momentum and inflows are strong enough. The danger is assuming greed automatically solves supply. It often helps. It does not guarantee clearance.
What stands out here is the contrast between the two names. ZRO’s unlock is meaningful but still in a range the market has learned to process when conditions are supportive. Bedrock’s elevated float release is larger relative to what is already trading. Absolute value gets the social-media attention. Relative float usually decides the price path. That is the core angle for both pro traders and longer-term holders watching today’s session and the next several.
Supply Mechanics and Historical Pattern
Vesting events increase circulating supply by definition. The market impact depends on who receives the tokens, whether those recipients are structured sellers, and how quickly inventory reaches exchanges. Rising exchange reserves around an unlock window are the cleaner caution signal. Stable or declining reserves after the event suggest more of the supply is being held or routed carefully rather than dumped into the bid.
Historical patterns in similar FDV-heavy names are mixed but familiar. Markets often sell the rumor into the unlock, then stabilize if broader flow remains supportive. Sometimes the opposite happens: price holds into the event and weakens after, once the new float is actually available. The common mistake is treating the unlock timestamp as the only risk moment. Distribution can begin before and continue after. The window matters more than the single print.
For names with large fully diluted valuations relative to float, each unlock is also a referendum on whether earlier valuations still make sense once more tokens are free to trade. That pressure is structural. It does not require a change in narrative to matter.
On-Chain and Derivatives Context
Around unlock windows, whale behavior becomes more informative than usual. Accumulation into weakness can support the absorption case. Distribution into strength, especially if paired with rising exchange balances, argues for patience rather than aggressive buying. Active addresses and transfer volume often spike into these events. Some of that is noise—wallets repositioning, custodial moves, market-maker inventory. Some of it is real supply seeking liquidity.
On the derivatives side, positive funding around ZRO and related pairs complicates the picture. Positive funding means longs are paying to stay in. That can be sustainable in a strong tape. It becomes expensive and fragile if spot demand fades right as new tokens hit circulation. Open interest elevated into an unlock raises the odds of a fast move once the first wave of supply lands, because leveraged positioning and spot inventory interact. RSI divergences and order-block retests are the practical technical map for that process. If price loses key post-impulse supports while funding stays positive, the unwind can be disorderly. If the book absorbs the float and those supports hold, the unlock can pass as a digested event rather than a regime change.
Risks, Opportunities, and Positioning
The main risk is straightforward. New supply meets a market that has already rewarded mid-caps hard. Late longs financed by positive funding are vulnerable if absorption fails. For Bedrock, the relative float size makes that risk more acute. For ZRO, the risk is less about a single catastrophic percentage and more about whether repeated unlocks steadily cap upside.
There is also opportunity in the same structure. Greed-range conditions and active altcoin flow can clear inventory that would overwhelm a weaker tape. Markets that successfully absorb unlocks sometimes reset positioning and continue higher once forced or scheduled selling is out of the way. That outcome is possible. It should be earned by the order book, not assumed from the sentiment index.
For pro traders, the cleanest approach is event-based discipline: watch relative float, exchange-reserve direction, funding, and whether price can reclaim or hold the pre-unlock range. For longer-term investors, the question is whether these unlocks are ordinary vesting progress or the start of a multi-month supply ceiling. That answer depends less on today’s candle and more on recipient behavior over subsequent sessions.
Closing View
LayerZero and Bedrock are testing the same market quality from different angles. ZRO brings a sizable but more conventional unlock into a constructive sentiment regime. Bedrock brings a much heavier relative float release into the same regime. Altcoin momentum and greed readings improve the odds of absorption. They do not eliminate overhang risk.
What the setup suggests is a sorting event. If bids remain deep and exchange reserves do not persistently rise, these unlocks may be remembered as noise inside a broader mid-cap advance. If supply shows up faster than demand and technical supports give way under positive funding, the market will be reminded that float math still overrides narrative when inventory is large enough. Relative float, not the headline dollar figure, remains the variable to respect.
#BR #zro #Near #ARB
$BR
$ZRO
$ARB
The important distinction is not the headline dollar amount. It is relative float. A $26 million unlock can be routine in a deep book and disruptive in a thin one. An 18% float release is a different category of event. Traders and holders are deciding whether current greed-driven flow is strong enough to absorb that supply—or whether the releases create a lasting overhang.
Why These Unlocks Matter Now
Unlock risk is always about timing and context. In a fearful market, even modest unlocks can accelerate downside because buyers are scarce. In a greedy market, the same unlocks can be absorbed if momentum and inflows are strong enough. The danger is assuming greed automatically solves supply. It often helps. It does not guarantee clearance.
What stands out here is the contrast between the two names. ZRO’s unlock is meaningful but still in a range the market has learned to process when conditions are supportive. Bedrock’s elevated float release is larger relative to what is already trading. Absolute value gets the social-media attention. Relative float usually decides the price path. That is the core angle for both pro traders and longer-term holders watching today’s session and the next several.
Supply Mechanics and Historical Pattern
Vesting events increase circulating supply by definition. The market impact depends on who receives the tokens, whether those recipients are structured sellers, and how quickly inventory reaches exchanges. Rising exchange reserves around an unlock window are the cleaner caution signal. Stable or declining reserves after the event suggest more of the supply is being held or routed carefully rather than dumped into the bid.
Historical patterns in similar FDV-heavy names are mixed but familiar. Markets often sell the rumor into the unlock, then stabilize if broader flow remains supportive. Sometimes the opposite happens: price holds into the event and weakens after, once the new float is actually available. The common mistake is treating the unlock timestamp as the only risk moment. Distribution can begin before and continue after. The window matters more than the single print.
For names with large fully diluted valuations relative to float, each unlock is also a referendum on whether earlier valuations still make sense once more tokens are free to trade. That pressure is structural. It does not require a change in narrative to matter.
On-Chain and Derivatives Context
Around unlock windows, whale behavior becomes more informative than usual. Accumulation into weakness can support the absorption case. Distribution into strength, especially if paired with rising exchange balances, argues for patience rather than aggressive buying. Active addresses and transfer volume often spike into these events. Some of that is noise—wallets repositioning, custodial moves, market-maker inventory. Some of it is real supply seeking liquidity.
On the derivatives side, positive funding around ZRO and related pairs complicates the picture. Positive funding means longs are paying to stay in. That can be sustainable in a strong tape. It becomes expensive and fragile if spot demand fades right as new tokens hit circulation. Open interest elevated into an unlock raises the odds of a fast move once the first wave of supply lands, because leveraged positioning and spot inventory interact. RSI divergences and order-block retests are the practical technical map for that process. If price loses key post-impulse supports while funding stays positive, the unwind can be disorderly. If the book absorbs the float and those supports hold, the unlock can pass as a digested event rather than a regime change.
Risks, Opportunities, and Positioning
The main risk is straightforward. New supply meets a market that has already rewarded mid-caps hard. Late longs financed by positive funding are vulnerable if absorption fails. For Bedrock, the relative float size makes that risk more acute. For ZRO, the risk is less about a single catastrophic percentage and more about whether repeated unlocks steadily cap upside.
There is also opportunity in the same structure. Greed-range conditions and active altcoin flow can clear inventory that would overwhelm a weaker tape. Markets that successfully absorb unlocks sometimes reset positioning and continue higher once forced or scheduled selling is out of the way. That outcome is possible. It should be earned by the order book, not assumed from the sentiment index.
For pro traders, the cleanest approach is event-based discipline: watch relative float, exchange-reserve direction, funding, and whether price can reclaim or hold the pre-unlock range. For longer-term investors, the question is whether these unlocks are ordinary vesting progress or the start of a multi-month supply ceiling. That answer depends less on today’s candle and more on recipient behavior over subsequent sessions.
Closing View
LayerZero and Bedrock are testing the same market quality from different angles. ZRO brings a sizable but more conventional unlock into a constructive sentiment regime. Bedrock brings a much heavier relative float release into the same regime. Altcoin momentum and greed readings improve the odds of absorption. They do not eliminate overhang risk.
What the setup suggests is a sorting event. If bids remain deep and exchange reserves do not persistently rise, these unlocks may be remembered as noise inside a broader mid-cap advance. If supply shows up faster than demand and technical supports give way under positive funding, the market will be reminded that float math still overrides narrative when inventory is large enough. Relative float, not the headline dollar figure, remains the variable to respect.
#BR #zro #Near #ARB
$BR
$ZRO
$ARB
1
949
·
--
Verified

Article
Aethir’s 20 MW Push Turns the Compute Narrative PhysicalMost AI-token rallies still begin with a story. Aethir’s latest catalyst begins with sites and power. The ACCELERATE program is targeting up to 20 MW of high-density GPU capacity, with projected contract value in the hundreds of millions. That lands in a market already willing to fund infrastructure narratives. Fear & Greed has been holding in Greed territory, roughly 62 to 73, and altcoin momentum has been lifting mid-caps. Render and Akash have kept DePIN compute in the conversation through revenue and utilization metrics. Traders are looking for something sturdier than another abstract “AI demand” headline. Physical capacity is that something.
What stands out is the shift in emphasis. The market has spent a long stretch pricing decentralized compute as an option on future AI workloads. Programs that secure power, space, and enterprise-facing capacity force a more concrete question: can these networks move from token narrative to contract-backed infrastructure?
Why Capacity Matters More Than Another Price Spike
Institutional AI spending has not slowed in the broader technology complex. Training and inference still run into the same constraints: access to high-end GPUs, density, power, and reliable delivery. Centralized cloud providers remain the default. DePIN networks are trying to insert themselves as alternative or complementary supply, especially where workloads can be distributed or where cost and availability create openings.
Aethir’s ACCELERATE framing is useful because it is denominated in megawatts, not just roadmap language. Capacity targets can be overstated, and projected contract values can slip. Still, the market tends to reward projects that move the discussion from emissions and points to power, hardware, and customer pipeline. That is the core of the current bid across parts of GPU DePIN. Capital is less interested in pure thematic exposure and more interested in evidence that decentralized supply can be packaged into something enterprises will pay for.
Sector Context and Market Structure
Mid-cap infrastructure names often move hardest when two conditions overlap: broad risk appetite and a fresh catalyst that feels measurable. Both are present. Positive momentum across altcoins creates room for secondary leaders. A capacity announcement gives desks a number to debate.
Funding rates and open interest on related mid-cap perps become the tactical overlay. Modestly positive funding with rising interest can support continuation after digestion. Rapidly elevated funding after a vertical move raises the odds of a sharp squeeze in the opposite direction. Liquidity near recent highs also matters. If price probes those zones and finds acceptance, momentum traders stay engaged. If the highs are swept and rejected while open interest stays elevated, the move can unwind quickly.
For pro traders, the practical read is to separate the infrastructure thesis from the short-term positioning regime. The first can remain intact while the second turns. That distinction is where a lot of P&L is made or lost in these names.
On-Chain and Network Signals
Across GPU DePIN networks, the more useful metrics are still the unglamorous ones: node growth, utilization, active addresses, and whether supply dynamics favor participants who are actually providing work. Rising active addresses without utilization can mean marketing reach rather than demand. Utilization without durable pricing can mean activity that does not translate into sustainable revenue.
Supply behavior in compute tokens also deserves attention. Networks that dilute aggressively into a narrative peak often cap upside even when the product story is real. Networks that tie rewards more tightly to delivered compute have a cleaner long-term shape, though they can underperform in pure speculative phases. The data suggests investors are starting to make that distinction more carefully than they did in earlier AI-beta waves.
Aethir’s capacity plan should eventually show up in the same scorecard. Announced megawatts are an input. Deployed capacity, contracted usage, and realized revenue are the outputs that decide whether the re-rating holds.
Fundamentals, Risks, and Positioning
The fundamental case is straightforward. If decentralized GPU networks can assemble reliable capacity and sell it into enterprise or large-scale AI workflows, the sector graduates from speculative compute tokens toward infrastructure with backlog. Render and Akash have already helped the market understand that revenue traction is possible. Aethir’s ACCELERATE target is an attempt to scale that logic through physical buildout and high-density sites.
Risks are equally clear. Data-center timelines slip. Power is not abstract. Hardware procurement, deployment, and utilization can lag optimistic presentations. Competitive pressure from centralized providers remains intense on price and reliability. There is also market risk: if broader risk appetite fades, DePIN mid-caps will not be shielded by their megawatt targets.
For longer-term investors, the opportunity is in identifying which networks are building real supply and customer relationships rather than only harvesting narrative beta. For pro traders, the opportunity is in trading the gap between announcement momentum and operational delivery, with clear invalidation if price loses key post-catalyst structure while funding stays elevated.
Closing View
Aethir’s 20 MW ambition is not just another AI headline. It is a claim about physical capacity in a market that has been hungry for measurable infrastructure catalysts. The broader setup helps: greed-range sentiment, mid-cap participation, and existing DePIN revenue examples from peers. That does not make the projection destiny. It does explain why desks are treating capacity expansion as a more serious signal than pure token momentum.
What I'm watching from here is conversion. Sites and megawatt targets need to become deployed capacity, utilization, and contracts that survive outside a bullish tape. If that conversion happens, the decentralized GPU story becomes harder to dismiss as speculative packaging. If it does not, the market will likely treat ACCELERATE as another well-timed catalyst in a sector that still runs ahead of its balance sheet. The next phase belongs to the operators who can turn power into paid compute—and to the investors disciplined enough to wait for that evidence.
#Aethir
#ATH
#accelerate
#DePIN
$Acc
Aethir’s 20 MW Push Turns the Compute Narrative Physical
Most AI-token rallies still begin with a story. Aethir’s latest catalyst begins with sites and power. The ACCELERATE program is targeting up to 20 MW of high-density GPU capacity, with projected contract value in the hundreds of millions. That lands in a market already willing to fund infrastructure narratives. Fear & Greed has been holding in Greed territory, roughly 62 to 73, and altcoin momentum has been lifting mid-caps. Render and Akash have kept DePIN compute in the conversation through revenue and utilization metrics. Traders are looking for something sturdier than another abstract “AI demand” headline. Physical capacity is that something.
What stands out is the shift in emphasis. The market has spent a long stretch pricing decentralized compute as an option on future AI workloads. Programs that secure power, space, and enterprise-facing capacity force a more concrete question: can these networks move from token narrative to contract-backed infrastructure?
Why Capacity Matters More Than Another Price Spike
Institutional AI spending has not slowed in the broader technology complex. Training and inference still run into the same constraints: access to high-end GPUs, density, power, and reliable delivery. Centralized cloud providers remain the default. DePIN networks are trying to insert themselves as alternative or complementary supply, especially where workloads can be distributed or where cost and availability create openings.
Aethir’s ACCELERATE framing is useful because it is denominated in megawatts, not just roadmap language. Capacity targets can be overstated, and projected contract values can slip. Still, the market tends to reward projects that move the discussion from emissions and points to power, hardware, and customer pipeline. That is the core of the current bid across parts of GPU DePIN. Capital is less interested in pure thematic exposure and more interested in evidence that decentralized supply can be packaged into something enterprises will pay for.
Sector Context and Market Structure
Mid-cap infrastructure names often move hardest when two conditions overlap: broad risk appetite and a fresh catalyst that feels measurable. Both are present. Positive momentum across altcoins creates room for secondary leaders. A capacity announcement gives desks a number to debate.
Funding rates and open interest on related mid-cap perps become the tactical overlay. Modestly positive funding with rising interest can support continuation after digestion. Rapidly elevated funding after a vertical move raises the odds of a sharp squeeze in the opposite direction. Liquidity near recent highs also matters. If price probes those zones and finds acceptance, momentum traders stay engaged. If the highs are swept and rejected while open interest stays elevated, the move can unwind quickly.
For pro traders, the practical read is to separate the infrastructure thesis from the short-term positioning regime. The first can remain intact while the second turns. That distinction is where a lot of P&L is made or lost in these names.
On-Chain and Network Signals
Across GPU DePIN networks, the more useful metrics are still the unglamorous ones: node growth, utilization, active addresses, and whether supply dynamics favor participants who are actually providing work. Rising active addresses without utilization can mean marketing reach rather than demand. Utilization without durable pricing can mean activity that does not translate into sustainable revenue.
Supply behavior in compute tokens also deserves attention. Networks that dilute aggressively into a narrative peak often cap upside even when the product story is real. Networks that tie rewards more tightly to delivered compute have a cleaner long-term shape, though they can underperform in pure speculative phases. The data suggests investors are starting to make that distinction more carefully than they did in earlier AI-beta waves.
Aethir’s capacity plan should eventually show up in the same scorecard. Announced megawatts are an input. Deployed capacity, contracted usage, and realized revenue are the outputs that decide whether the re-rating holds.
Fundamentals, Risks, and Positioning
The fundamental case is straightforward. If decentralized GPU networks can assemble reliable capacity and sell it into enterprise or large-scale AI workflows, the sector graduates from speculative compute tokens toward infrastructure with backlog. Render and Akash have already helped the market understand that revenue traction is possible. Aethir’s ACCELERATE target is an attempt to scale that logic through physical buildout and high-density sites.
Risks are equally clear. Data-center timelines slip. Power is not abstract. Hardware procurement, deployment, and utilization can lag optimistic presentations. Competitive pressure from centralized providers remains intense on price and reliability. There is also market risk: if broader risk appetite fades, DePIN mid-caps will not be shielded by their megawatt targets.
For longer-term investors, the opportunity is in identifying which networks are building real supply and customer relationships rather than only harvesting narrative beta. For pro traders, the opportunity is in trading the gap between announcement momentum and operational delivery, with clear invalidation if price loses key post-catalyst structure while funding stays elevated.
Closing View
Aethir’s 20 MW ambition is not just another AI headline. It is a claim about physical capacity in a market that has been hungry for measurable infrastructure catalysts. The broader setup helps: greed-range sentiment, mid-cap participation, and existing DePIN revenue examples from peers. That does not make the projection destiny. It does explain why desks are treating capacity expansion as a more serious signal than pure token momentum.
What I'm watching from here is conversion. Sites and megawatt targets need to become deployed capacity, utilization, and contracts that survive outside a bullish tape. If that conversion happens, the decentralized GPU story becomes harder to dismiss as speculative packaging. If it does not, the market will likely treat ACCELERATE as another well-timed catalyst in a sector that still runs ahead of its balance sheet. The next phase belongs to the operators who can turn power into paid compute—and to the investors disciplined enough to wait for that evidence.
#Aethir
#ATH
#accelerate
#DePIN
$Acc
What stands out is the shift in emphasis. The market has spent a long stretch pricing decentralized compute as an option on future AI workloads. Programs that secure power, space, and enterprise-facing capacity force a more concrete question: can these networks move from token narrative to contract-backed infrastructure?
Why Capacity Matters More Than Another Price Spike
Institutional AI spending has not slowed in the broader technology complex. Training and inference still run into the same constraints: access to high-end GPUs, density, power, and reliable delivery. Centralized cloud providers remain the default. DePIN networks are trying to insert themselves as alternative or complementary supply, especially where workloads can be distributed or where cost and availability create openings.
Aethir’s ACCELERATE framing is useful because it is denominated in megawatts, not just roadmap language. Capacity targets can be overstated, and projected contract values can slip. Still, the market tends to reward projects that move the discussion from emissions and points to power, hardware, and customer pipeline. That is the core of the current bid across parts of GPU DePIN. Capital is less interested in pure thematic exposure and more interested in evidence that decentralized supply can be packaged into something enterprises will pay for.
Sector Context and Market Structure
Mid-cap infrastructure names often move hardest when two conditions overlap: broad risk appetite and a fresh catalyst that feels measurable. Both are present. Positive momentum across altcoins creates room for secondary leaders. A capacity announcement gives desks a number to debate.
Funding rates and open interest on related mid-cap perps become the tactical overlay. Modestly positive funding with rising interest can support continuation after digestion. Rapidly elevated funding after a vertical move raises the odds of a sharp squeeze in the opposite direction. Liquidity near recent highs also matters. If price probes those zones and finds acceptance, momentum traders stay engaged. If the highs are swept and rejected while open interest stays elevated, the move can unwind quickly.
For pro traders, the practical read is to separate the infrastructure thesis from the short-term positioning regime. The first can remain intact while the second turns. That distinction is where a lot of P&L is made or lost in these names.
On-Chain and Network Signals
Across GPU DePIN networks, the more useful metrics are still the unglamorous ones: node growth, utilization, active addresses, and whether supply dynamics favor participants who are actually providing work. Rising active addresses without utilization can mean marketing reach rather than demand. Utilization without durable pricing can mean activity that does not translate into sustainable revenue.
Supply behavior in compute tokens also deserves attention. Networks that dilute aggressively into a narrative peak often cap upside even when the product story is real. Networks that tie rewards more tightly to delivered compute have a cleaner long-term shape, though they can underperform in pure speculative phases. The data suggests investors are starting to make that distinction more carefully than they did in earlier AI-beta waves.
Aethir’s capacity plan should eventually show up in the same scorecard. Announced megawatts are an input. Deployed capacity, contracted usage, and realized revenue are the outputs that decide whether the re-rating holds.
Fundamentals, Risks, and Positioning
The fundamental case is straightforward. If decentralized GPU networks can assemble reliable capacity and sell it into enterprise or large-scale AI workflows, the sector graduates from speculative compute tokens toward infrastructure with backlog. Render and Akash have already helped the market understand that revenue traction is possible. Aethir’s ACCELERATE target is an attempt to scale that logic through physical buildout and high-density sites.
Risks are equally clear. Data-center timelines slip. Power is not abstract. Hardware procurement, deployment, and utilization can lag optimistic presentations. Competitive pressure from centralized providers remains intense on price and reliability. There is also market risk: if broader risk appetite fades, DePIN mid-caps will not be shielded by their megawatt targets.
For longer-term investors, the opportunity is in identifying which networks are building real supply and customer relationships rather than only harvesting narrative beta. For pro traders, the opportunity is in trading the gap between announcement momentum and operational delivery, with clear invalidation if price loses key post-catalyst structure while funding stays elevated.
Closing View
Aethir’s 20 MW ambition is not just another AI headline. It is a claim about physical capacity in a market that has been hungry for measurable infrastructure catalysts. The broader setup helps: greed-range sentiment, mid-cap participation, and existing DePIN revenue examples from peers. That does not make the projection destiny. It does explain why desks are treating capacity expansion as a more serious signal than pure token momentum.
What I'm watching from here is conversion. Sites and megawatt targets need to become deployed capacity, utilization, and contracts that survive outside a bullish tape. If that conversion happens, the decentralized GPU story becomes harder to dismiss as speculative packaging. If it does not, the market will likely treat ACCELERATE as another well-timed catalyst in a sector that still runs ahead of its balance sheet. The next phase belongs to the operators who can turn power into paid compute—and to the investors disciplined enough to wait for that evidence.
#Aethir
#ATH
#accelerate
#DePIN
$Acc
2
696
·
--
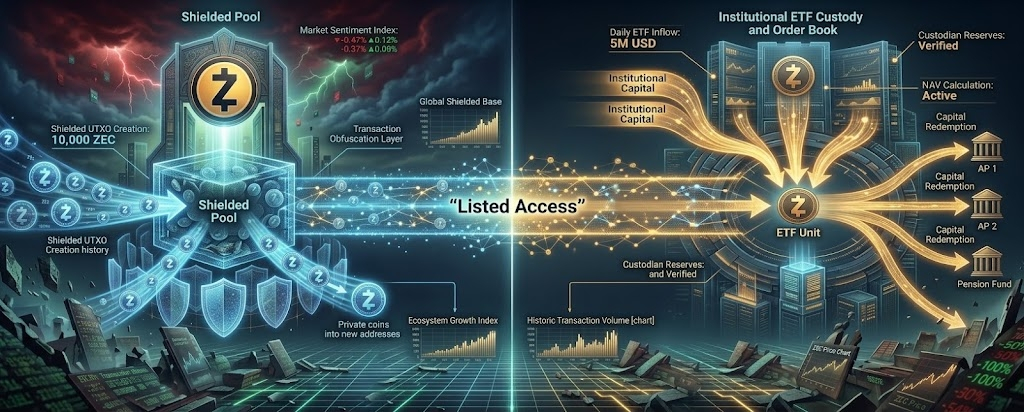
Article
Zcash’s ETF Bid Puts the Privacy Trade Back on the DeskPrivacy coins do not usually lead during greed phases. They more often sit on the edge of the market until a regulatory scare or a sudden narrative rotation pulls them forward. This time the catalyst is more structured. ZEC has advanced roughly 37% on the week and traded near the $1,500 area, while spot Zcash ETF products have logged a multi-week inflow streak above $358 million. Social volume has spiked. Paradigm’s disclosed exposure added another institutional signal to the tape. Fear & Greed has been running roughly 62 to 73, and the Altcoin Season Index has been approaching 50.
That combination is unusual. A mid-cap privacy asset is receiving both retail attention and sustained product-level inflows while broader risk appetite is elevated but not yet extreme. The market is testing whether institutional wrappers can change the normal volatility pattern of a name like ZEC.
Why This Moment Is Different
ETF flow is the cleanest part of the story. A multi-week streak above $358 million is not a one-day curiosity print. It suggests repeated allocation rather than a single headline-driven burst. When price rises alongside that kind of inflow, the first question is whether the product is absorbing demand or simply lagging a speculative run already in motion. Both can happen. The useful work is comparing the pace of AUM growth with the pace of the rally.
What stands out is the backdrop. Greed readings and a rising altcoin-season pulse usually favor higher-beta beta trades and narrative rotation. Privacy has often been a defensive or ideological sleeve. Here it is behaving more like a catalyst-driven mid-cap with an institutional bid underneath it. That is why pro traders are paying attention. The setup is not only “ZEC is up.” It is “ZEC is up while listed product keeps taking money.”
Technical Structure After the Squeeze
The weekly advance has left shorter-term indicators stretched. RSI near the high-60s, around 69, fits a market that has already traveled far in a short window. Recent short liquidations help explain part of the speed. Forced covering can flatten resistance and pull opportunistic longs in behind it. The same process can also leave the tape vulnerable once the liquidation fuel is gone.
Order-block support from the squeeze zone becomes the practical reference. If price can hold above the area where the forced buying accelerated, the structure remains constructive even if momentum cools. If the market slips back through that zone while ETF inflows slow, the advance starts to look more like a completed catalyst spike than the start of a durable re-rating.
Volume and social activity are elevated. That is consistent with a real impulse. It is also consistent with late participation. For active traders, the distinction matters more than the headline percentage gain.
On-Chain and Fundamental Layers
On-chain, the shielded pool remains the core of Zcash’s identity. Changes in shielded activity and exchange reserves help show whether coins are moving into privacy sets, onto venues for sale, or into longer-term holding patterns. Rising price with declining exchange reserves is usually healthier than rising price with expanding reserves. The ETF channel complicates that read slightly, because product creation and redemption flows can interact with underlying liquidity in ways that pure spot markets do not.
Fundamentally, the market is also looking ahead to the NU7 upgrade window targeting November. Upgrade timelines often support attention in privacy networks when the broader tape is already receptive. Mining economics relative to Bitcoin remain part of the longer-term picture as well. ZEC does not need to win a pure store-of-value contest with BTC to matter; it needs to remain credible as a privacy-preserving monetary network with enough liquidity and institutional access to stay relevant. The ETF layer is an attempt to solve the access part of that problem.
Risks, Opportunities, and Positioning
The central risk is classic mid-cap behavior dressed up in institutional clothing. Sustained inflows can support price. They do not eliminate drawdowns when sentiment turns or when a privacy-specific headline hits. Regulatory sensitivity remains higher for privacy assets than for mainstream large caps. A sharp shift in enforcement tone, exchange treatment, or product eligibility can move ZEC faster than flow data can offset.
There is also valuation and expectation risk. A 37% weekly move near stretched momentum readings prices in a lot of good news quickly. If inflows merely stabilize rather than accelerate, the market may need time to digest.
The opportunity is the other side of the same structure. If ETF demand remains persistent and on-chain behavior does not show heavy distribution into strength, ZEC can continue to trade as a distinct liquidity venue for the privacy narrative rather than as a pure speculative satellite. For pro traders, that means tracking three things together: inflow persistence, exchange-reserve direction, and whether price holds the post-squeeze support band. For longer-term investors, the question is whether listed access permanently widens the buyer base or only amplifies the current cycle.
Closing View
Zcash is not rallying in isolation. It is rallying with a multi-week ETF inflow streak, a clear privacy narrative, visible institutional mention, and a market already willing to fund altcoin risk. That is a stronger package than a social-volume spike alone. It is also a package that can unwind if flows fade and momentum buyers are left holding the move.
What the data suggests right now is a live test of whether product demand can impose a more durable bid on a historically volatile mid-cap privacy asset. The next useful signal is not another up day. It is whether inflows remain positive after the first serious pause in price, and whether on-chain behavior supports accumulation rather than distribution into strength. Until that becomes clearer, treating the rally as an important institutional experiment rather than a settled re-rating is the more disciplined stance.
#zcash
#zec
#PrivacyCoins
#ZcashETF
#CryptoETF
$ZEC
{spot}(ZECUSDT)
Zcash’s ETF Bid Puts the Privacy Trade Back on the Desk
Privacy coins do not usually lead during greed phases. They more often sit on the edge of the market until a regulatory scare or a sudden narrative rotation pulls them forward. This time the catalyst is more structured. ZEC has advanced roughly 37% on the week and traded near the $1,500 area, while spot Zcash ETF products have logged a multi-week inflow streak above $358 million. Social volume has spiked. Paradigm’s disclosed exposure added another institutional signal to the tape. Fear & Greed has been running roughly 62 to 73, and the Altcoin Season Index has been approaching 50.
That combination is unusual. A mid-cap privacy asset is receiving both retail attention and sustained product-level inflows while broader risk appetite is elevated but not yet extreme. The market is testing whether institutional wrappers can change the normal volatility pattern of a name like ZEC.
Why This Moment Is Different
ETF flow is the cleanest part of the story. A multi-week streak above $358 million is not a one-day curiosity print. It suggests repeated allocation rather than a single headline-driven burst. When price rises alongside that kind of inflow, the first question is whether the product is absorbing demand or simply lagging a speculative run already in motion. Both can happen. The useful work is comparing the pace of AUM growth with the pace of the rally.
What stands out is the backdrop. Greed readings and a rising altcoin-season pulse usually favor higher-beta beta trades and narrative rotation. Privacy has often been a defensive or ideological sleeve. Here it is behaving more like a catalyst-driven mid-cap with an institutional bid underneath it. That is why pro traders are paying attention. The setup is not only “ZEC is up.” It is “ZEC is up while listed product keeps taking money.”
Technical Structure After the Squeeze
The weekly advance has left shorter-term indicators stretched. RSI near the high-60s, around 69, fits a market that has already traveled far in a short window. Recent short liquidations help explain part of the speed. Forced covering can flatten resistance and pull opportunistic longs in behind it. The same process can also leave the tape vulnerable once the liquidation fuel is gone.
Order-block support from the squeeze zone becomes the practical reference. If price can hold above the area where the forced buying accelerated, the structure remains constructive even if momentum cools. If the market slips back through that zone while ETF inflows slow, the advance starts to look more like a completed catalyst spike than the start of a durable re-rating.
Volume and social activity are elevated. That is consistent with a real impulse. It is also consistent with late participation. For active traders, the distinction matters more than the headline percentage gain.
On-Chain and Fundamental Layers
On-chain, the shielded pool remains the core of Zcash’s identity. Changes in shielded activity and exchange reserves help show whether coins are moving into privacy sets, onto venues for sale, or into longer-term holding patterns. Rising price with declining exchange reserves is usually healthier than rising price with expanding reserves. The ETF channel complicates that read slightly, because product creation and redemption flows can interact with underlying liquidity in ways that pure spot markets do not.
Fundamentally, the market is also looking ahead to the NU7 upgrade window targeting November. Upgrade timelines often support attention in privacy networks when the broader tape is already receptive. Mining economics relative to Bitcoin remain part of the longer-term picture as well. ZEC does not need to win a pure store-of-value contest with BTC to matter; it needs to remain credible as a privacy-preserving monetary network with enough liquidity and institutional access to stay relevant. The ETF layer is an attempt to solve the access part of that problem.
Risks, Opportunities, and Positioning
The central risk is classic mid-cap behavior dressed up in institutional clothing. Sustained inflows can support price. They do not eliminate drawdowns when sentiment turns or when a privacy-specific headline hits. Regulatory sensitivity remains higher for privacy assets than for mainstream large caps. A sharp shift in enforcement tone, exchange treatment, or product eligibility can move ZEC faster than flow data can offset.
There is also valuation and expectation risk. A 37% weekly move near stretched momentum readings prices in a lot of good news quickly. If inflows merely stabilize rather than accelerate, the market may need time to digest.
The opportunity is the other side of the same structure. If ETF demand remains persistent and on-chain behavior does not show heavy distribution into strength, ZEC can continue to trade as a distinct liquidity venue for the privacy narrative rather than as a pure speculative satellite. For pro traders, that means tracking three things together: inflow persistence, exchange-reserve direction, and whether price holds the post-squeeze support band. For longer-term investors, the question is whether listed access permanently widens the buyer base or only amplifies the current cycle.
Closing View
Zcash is not rallying in isolation. It is rallying with a multi-week ETF inflow streak, a clear privacy narrative, visible institutional mention, and a market already willing to fund altcoin risk. That is a stronger package than a social-volume spike alone. It is also a package that can unwind if flows fade and momentum buyers are left holding the move.
What the data suggests right now is a live test of whether product demand can impose a more durable bid on a historically volatile mid-cap privacy asset. The next useful signal is not another up day. It is whether inflows remain positive after the first serious pause in price, and whether on-chain behavior supports accumulation rather than distribution into strength. Until that becomes clearer, treating the rally as an important institutional experiment rather than a settled re-rating is the more disciplined stance.
#zcash
#zec
#PrivacyCoins
#ZcashETF
#CryptoETF
$ZEC
That combination is unusual. A mid-cap privacy asset is receiving both retail attention and sustained product-level inflows while broader risk appetite is elevated but not yet extreme. The market is testing whether institutional wrappers can change the normal volatility pattern of a name like ZEC.
Why This Moment Is Different
ETF flow is the cleanest part of the story. A multi-week streak above $358 million is not a one-day curiosity print. It suggests repeated allocation rather than a single headline-driven burst. When price rises alongside that kind of inflow, the first question is whether the product is absorbing demand or simply lagging a speculative run already in motion. Both can happen. The useful work is comparing the pace of AUM growth with the pace of the rally.
What stands out is the backdrop. Greed readings and a rising altcoin-season pulse usually favor higher-beta beta trades and narrative rotation. Privacy has often been a defensive or ideological sleeve. Here it is behaving more like a catalyst-driven mid-cap with an institutional bid underneath it. That is why pro traders are paying attention. The setup is not only “ZEC is up.” It is “ZEC is up while listed product keeps taking money.”
Technical Structure After the Squeeze
The weekly advance has left shorter-term indicators stretched. RSI near the high-60s, around 69, fits a market that has already traveled far in a short window. Recent short liquidations help explain part of the speed. Forced covering can flatten resistance and pull opportunistic longs in behind it. The same process can also leave the tape vulnerable once the liquidation fuel is gone.
Order-block support from the squeeze zone becomes the practical reference. If price can hold above the area where the forced buying accelerated, the structure remains constructive even if momentum cools. If the market slips back through that zone while ETF inflows slow, the advance starts to look more like a completed catalyst spike than the start of a durable re-rating.
Volume and social activity are elevated. That is consistent with a real impulse. It is also consistent with late participation. For active traders, the distinction matters more than the headline percentage gain.
On-Chain and Fundamental Layers
On-chain, the shielded pool remains the core of Zcash’s identity. Changes in shielded activity and exchange reserves help show whether coins are moving into privacy sets, onto venues for sale, or into longer-term holding patterns. Rising price with declining exchange reserves is usually healthier than rising price with expanding reserves. The ETF channel complicates that read slightly, because product creation and redemption flows can interact with underlying liquidity in ways that pure spot markets do not.
Fundamentally, the market is also looking ahead to the NU7 upgrade window targeting November. Upgrade timelines often support attention in privacy networks when the broader tape is already receptive. Mining economics relative to Bitcoin remain part of the longer-term picture as well. ZEC does not need to win a pure store-of-value contest with BTC to matter; it needs to remain credible as a privacy-preserving monetary network with enough liquidity and institutional access to stay relevant. The ETF layer is an attempt to solve the access part of that problem.
Risks, Opportunities, and Positioning
The central risk is classic mid-cap behavior dressed up in institutional clothing. Sustained inflows can support price. They do not eliminate drawdowns when sentiment turns or when a privacy-specific headline hits. Regulatory sensitivity remains higher for privacy assets than for mainstream large caps. A sharp shift in enforcement tone, exchange treatment, or product eligibility can move ZEC faster than flow data can offset.
There is also valuation and expectation risk. A 37% weekly move near stretched momentum readings prices in a lot of good news quickly. If inflows merely stabilize rather than accelerate, the market may need time to digest.
The opportunity is the other side of the same structure. If ETF demand remains persistent and on-chain behavior does not show heavy distribution into strength, ZEC can continue to trade as a distinct liquidity venue for the privacy narrative rather than as a pure speculative satellite. For pro traders, that means tracking three things together: inflow persistence, exchange-reserve direction, and whether price holds the post-squeeze support band. For longer-term investors, the question is whether listed access permanently widens the buyer base or only amplifies the current cycle.
Closing View
Zcash is not rallying in isolation. It is rallying with a multi-week ETF inflow streak, a clear privacy narrative, visible institutional mention, and a market already willing to fund altcoin risk. That is a stronger package than a social-volume spike alone. It is also a package that can unwind if flows fade and momentum buyers are left holding the move.
What the data suggests right now is a live test of whether product demand can impose a more durable bid on a historically volatile mid-cap privacy asset. The next useful signal is not another up day. It is whether inflows remain positive after the first serious pause in price, and whether on-chain behavior supports accumulation rather than distribution into strength. Until that becomes clearer, treating the rally as an important institutional experiment rather than a settled re-rating is the more disciplined stance.
#zcash
#zec
#PrivacyCoins
#ZcashETF
#CryptoETF
$ZEC
344
·
--
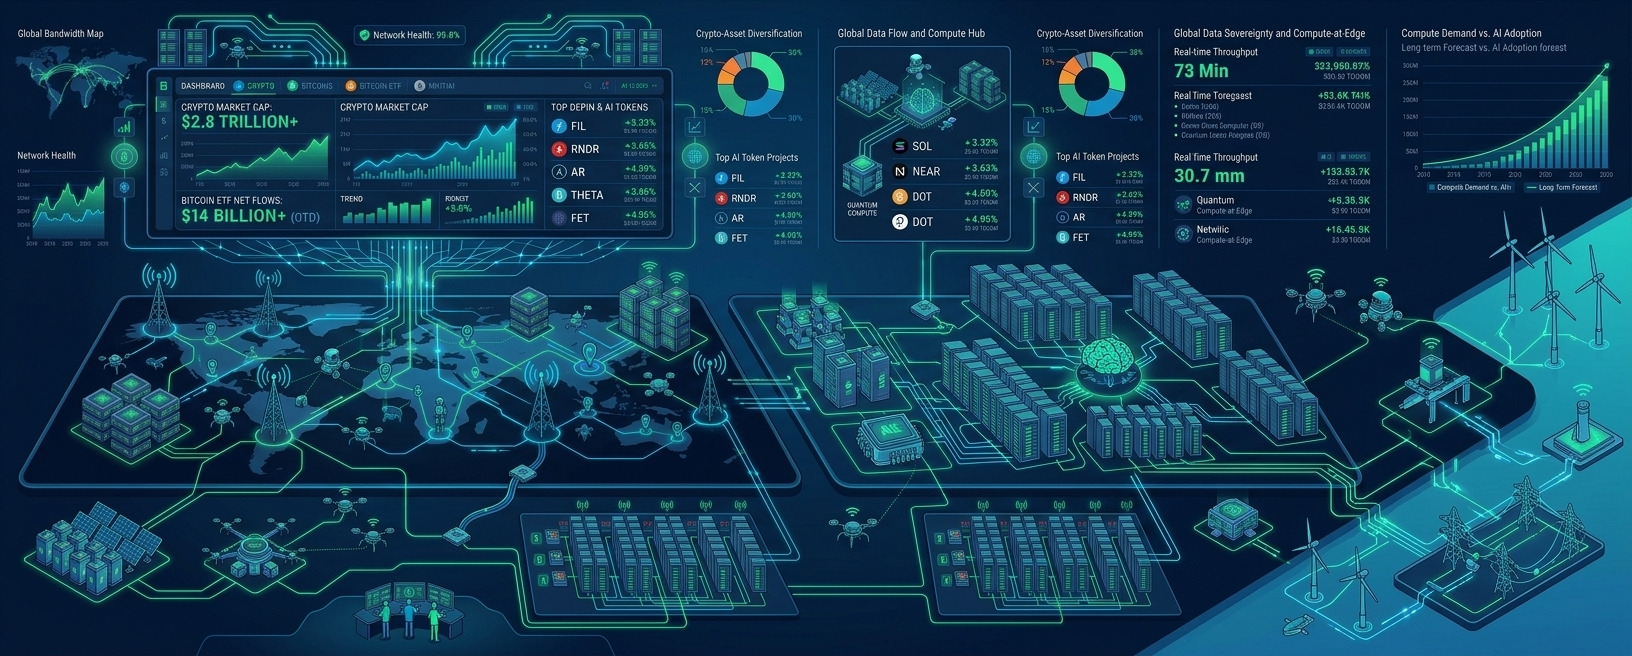
Article
DePIN and AI Infrastructure Quietly Take the BidWhile ETF flows and Bitcoin’s headline levels dominate the conversation, another part of the market has been doing the work. DePIN names have advanced roughly 5.5% at the sector level, with Geodnet jumping about 44.9%. AI-linked tokens continue to show elevated volume. Bittensor’s TAO is holding in a more neutral-to-greed sentiment band rather than an extreme reading. Broader crypto market cap has pushed above $2.8 trillion, and Layer-1 plus infrastructure names are participating.
What stands out is not just that these sectors are up. It is where the capital is going. Risk appetite is present—Fear & Greed has been running roughly 57 to 71—but the bid is landing more cleanly in real-utility infrastructure than in pure meme rotation. That creates a two-tier tape worth paying attention to.
Why the Rotation Matters Now
Bitcoin dominance near the high-50s, around 58%, still frames the market. Large-cap and ETF-related flows remain the main story for many desks. Underneath that, mid-cap DePIN and AI infrastructure are absorbing a meaningful share of speculative and thematic capital.
This is familiar in structure and different in content. In previous cycles, the second tier was often pure narrative beta. Here, the better-performing names are tied to physical networks, decentralized compute, sensor data, and AI-agent demand. Geodnet’s outsized move is a reminder that single-name catalysts inside DePIN can still reprice a token sharply when the sector is already in favor. TAO’s more measured sentiment reading suggests the AI complex is active without being fully one-sided.
For pro traders, the practical point is relative value. When BTC and the largest ETFs hold attention, liquidity in mid-cap infrastructure can move further on less size. That cuts both ways: upside can be faster, and drawdowns can be just as sharp.
Sector Structure and Technical Read
Relative strength in mid-cap DePIN versus Bitcoin has been visible in the recent stretch. That does not mean the group is immune to a BTC-led risk-off day. It does mean that, inside the current risk-on window, capital has been willing to pay for exposure lower down the curve.
Funding rates across related perpetual markets have stayed modestly positive. That is important. Aggressive positive funding after vertical moves often signals a crowded long. Modestly positive funding alongside sector gains is a healthier mix. It suggests leverage is participating without the market already being stretched to the same degree seen in the most crowded AI beta trades earlier in the year.
Volume in AI-linked tokens remains elevated relative to longer historical baselines. Elevated volume during strength is constructive. Elevated volume during the first serious pullback will be the test. If the group corrects on light activity and buyers reappear near prior breakout zones, the rotation thesis stays intact. If volume expands hard on the downside, the move starts to look like another short-cycle thematic spike.
On-Chain and Fundamental Context
DePIN market-cap indices had already shown strong monthly performance earlier in 2026. The latest advance sits on top of that context rather than appearing from nowhere. The fundamental hook remains consistent: AI systems need compute, data, and physical infrastructure. Centralized providers still dominate, but cost, availability, and control concerns leave room for decentralized alternatives. Networks that coordinate GPS, wireless, GPU, or other real-world resources are trying to turn that gap into a market.
Restaking TVL has cooled from peak levels, yet it remains a related security and yield layer for parts of the infrastructure stack. The cooling matters. It shows that not every adjacent narrative is still in pure expansion mode. Capital is becoming more selective. Projects that can point to usage, node growth, or service demand are better placed than those offering only thematic exposure.
What I'm seeing is a market that still likes the AI and DePIN story, but is starting to differentiate inside it. That differentiation is usually where the next phase of returns—and the next phase of underperformance—gets decided.
Risks, Opportunities, and Positioning
The main risk is correlation. If Bitcoin loses momentum and broader risk sentiment fades, mid-cap DePIN and AI names will not be protected by their utility narrative. They may even underperform on the way down because they are the higher-beta sleeve of the market. Single-name risk is also elevated. A 45% jump in a name like Geodnet can attract momentum buyers late and punish them quickly if the catalyst is fully priced.
The opportunity sits in the relative-value structure itself. While large-cap ETF flows dominate headlines, selective strength in infrastructure mid-caps can offer cleaner expression of the decentralized compute and physical-network thesis. For pro traders, that means watching sector relative strength against BTC, funding conditions, and whether leadership persists or rotates rapidly between names. For longer-term investors, it means separating networks with measurable real-world activity from those still priced mainly on narrative adjacency to AI.
A disciplined approach is to treat the sector bid as real but conditional. The condition is continued risk appetite and continued evidence that these networks are doing work, not just trading as AI proxies.
Closing View
DePIN and AI infrastructure are leading a meaningful slice of the market while Bitcoin and ETF flows still take most of the attention. Geodnet’s sharp advance shows how far single names can run inside that backdrop. TAO’s less extreme sentiment reading shows that not every AI-linked asset is being chased the same way. Market cap above $2.8 trillion and modestly positive funding complete the picture of a risk-on environment that is still selective rather than indiscriminate.
The data suggests a two-tier market: large-cap and ETF liquidity on one side, mid-cap infrastructure beta on the other. That structure can persist as long as risk appetite holds and the utility narrative keeps finding confirmation in usage metrics. It can also unwind quickly if BTC dominance rises hard or if the sector’s leaders fail to hold relative strength after the first serious down day. From here, the useful work is less about celebrating the sector label and more about tracking which names still look like infrastructure—and which ones only looked like it on the way up.
$TAO
#DePIN
#crypto
#bitcoin
#bittensor
#TAO
DePIN and AI Infrastructure Quietly Take the Bid
While ETF flows and Bitcoin’s headline levels dominate the conversation, another part of the market has been doing the work. DePIN names have advanced roughly 5.5% at the sector level, with Geodnet jumping about 44.9%. AI-linked tokens continue to show elevated volume. Bittensor’s TAO is holding in a more neutral-to-greed sentiment band rather than an extreme reading. Broader crypto market cap has pushed above $2.8 trillion, and Layer-1 plus infrastructure names are participating.
What stands out is not just that these sectors are up. It is where the capital is going. Risk appetite is present—Fear & Greed has been running roughly 57 to 71—but the bid is landing more cleanly in real-utility infrastructure than in pure meme rotation. That creates a two-tier tape worth paying attention to.
Why the Rotation Matters Now
Bitcoin dominance near the high-50s, around 58%, still frames the market. Large-cap and ETF-related flows remain the main story for many desks. Underneath that, mid-cap DePIN and AI infrastructure are absorbing a meaningful share of speculative and thematic capital.
This is familiar in structure and different in content. In previous cycles, the second tier was often pure narrative beta. Here, the better-performing names are tied to physical networks, decentralized compute, sensor data, and AI-agent demand. Geodnet’s outsized move is a reminder that single-name catalysts inside DePIN can still reprice a token sharply when the sector is already in favor. TAO’s more measured sentiment reading suggests the AI complex is active without being fully one-sided.
For pro traders, the practical point is relative value. When BTC and the largest ETFs hold attention, liquidity in mid-cap infrastructure can move further on less size. That cuts both ways: upside can be faster, and drawdowns can be just as sharp.
Sector Structure and Technical Read
Relative strength in mid-cap DePIN versus Bitcoin has been visible in the recent stretch. That does not mean the group is immune to a BTC-led risk-off day. It does mean that, inside the current risk-on window, capital has been willing to pay for exposure lower down the curve.
Funding rates across related perpetual markets have stayed modestly positive. That is important. Aggressive positive funding after vertical moves often signals a crowded long. Modestly positive funding alongside sector gains is a healthier mix. It suggests leverage is participating without the market already being stretched to the same degree seen in the most crowded AI beta trades earlier in the year.
Volume in AI-linked tokens remains elevated relative to longer historical baselines. Elevated volume during strength is constructive. Elevated volume during the first serious pullback will be the test. If the group corrects on light activity and buyers reappear near prior breakout zones, the rotation thesis stays intact. If volume expands hard on the downside, the move starts to look like another short-cycle thematic spike.
On-Chain and Fundamental Context
DePIN market-cap indices had already shown strong monthly performance earlier in 2026. The latest advance sits on top of that context rather than appearing from nowhere. The fundamental hook remains consistent: AI systems need compute, data, and physical infrastructure. Centralized providers still dominate, but cost, availability, and control concerns leave room for decentralized alternatives. Networks that coordinate GPS, wireless, GPU, or other real-world resources are trying to turn that gap into a market.
Restaking TVL has cooled from peak levels, yet it remains a related security and yield layer for parts of the infrastructure stack. The cooling matters. It shows that not every adjacent narrative is still in pure expansion mode. Capital is becoming more selective. Projects that can point to usage, node growth, or service demand are better placed than those offering only thematic exposure.
What I'm seeing is a market that still likes the AI and DePIN story, but is starting to differentiate inside it. That differentiation is usually where the next phase of returns—and the next phase of underperformance—gets decided.
Risks, Opportunities, and Positioning
The main risk is correlation. If Bitcoin loses momentum and broader risk sentiment fades, mid-cap DePIN and AI names will not be protected by their utility narrative. They may even underperform on the way down because they are the higher-beta sleeve of the market. Single-name risk is also elevated. A 45% jump in a name like Geodnet can attract momentum buyers late and punish them quickly if the catalyst is fully priced.
The opportunity sits in the relative-value structure itself. While large-cap ETF flows dominate headlines, selective strength in infrastructure mid-caps can offer cleaner expression of the decentralized compute and physical-network thesis. For pro traders, that means watching sector relative strength against BTC, funding conditions, and whether leadership persists or rotates rapidly between names. For longer-term investors, it means separating networks with measurable real-world activity from those still priced mainly on narrative adjacency to AI.
A disciplined approach is to treat the sector bid as real but conditional. The condition is continued risk appetite and continued evidence that these networks are doing work, not just trading as AI proxies.
Closing View
DePIN and AI infrastructure are leading a meaningful slice of the market while Bitcoin and ETF flows still take most of the attention. Geodnet’s sharp advance shows how far single names can run inside that backdrop. TAO’s less extreme sentiment reading shows that not every AI-linked asset is being chased the same way. Market cap above $2.8 trillion and modestly positive funding complete the picture of a risk-on environment that is still selective rather than indiscriminate.
The data suggests a two-tier market: large-cap and ETF liquidity on one side, mid-cap infrastructure beta on the other. That structure can persist as long as risk appetite holds and the utility narrative keeps finding confirmation in usage metrics. It can also unwind quickly if BTC dominance rises hard or if the sector’s leaders fail to hold relative strength after the first serious down day. From here, the useful work is less about celebrating the sector label and more about tracking which names still look like infrastructure—and which ones only looked like it on the way up.
$TAO
#DePIN
#crypto
#bitcoin
#bittensor
#TAO
What stands out is not just that these sectors are up. It is where the capital is going. Risk appetite is present—Fear & Greed has been running roughly 57 to 71—but the bid is landing more cleanly in real-utility infrastructure than in pure meme rotation. That creates a two-tier tape worth paying attention to.
Why the Rotation Matters Now
Bitcoin dominance near the high-50s, around 58%, still frames the market. Large-cap and ETF-related flows remain the main story for many desks. Underneath that, mid-cap DePIN and AI infrastructure are absorbing a meaningful share of speculative and thematic capital.
This is familiar in structure and different in content. In previous cycles, the second tier was often pure narrative beta. Here, the better-performing names are tied to physical networks, decentralized compute, sensor data, and AI-agent demand. Geodnet’s outsized move is a reminder that single-name catalysts inside DePIN can still reprice a token sharply when the sector is already in favor. TAO’s more measured sentiment reading suggests the AI complex is active without being fully one-sided.
For pro traders, the practical point is relative value. When BTC and the largest ETFs hold attention, liquidity in mid-cap infrastructure can move further on less size. That cuts both ways: upside can be faster, and drawdowns can be just as sharp.
Sector Structure and Technical Read
Relative strength in mid-cap DePIN versus Bitcoin has been visible in the recent stretch. That does not mean the group is immune to a BTC-led risk-off day. It does mean that, inside the current risk-on window, capital has been willing to pay for exposure lower down the curve.
Funding rates across related perpetual markets have stayed modestly positive. That is important. Aggressive positive funding after vertical moves often signals a crowded long. Modestly positive funding alongside sector gains is a healthier mix. It suggests leverage is participating without the market already being stretched to the same degree seen in the most crowded AI beta trades earlier in the year.
Volume in AI-linked tokens remains elevated relative to longer historical baselines. Elevated volume during strength is constructive. Elevated volume during the first serious pullback will be the test. If the group corrects on light activity and buyers reappear near prior breakout zones, the rotation thesis stays intact. If volume expands hard on the downside, the move starts to look like another short-cycle thematic spike.
On-Chain and Fundamental Context
DePIN market-cap indices had already shown strong monthly performance earlier in 2026. The latest advance sits on top of that context rather than appearing from nowhere. The fundamental hook remains consistent: AI systems need compute, data, and physical infrastructure. Centralized providers still dominate, but cost, availability, and control concerns leave room for decentralized alternatives. Networks that coordinate GPS, wireless, GPU, or other real-world resources are trying to turn that gap into a market.
Restaking TVL has cooled from peak levels, yet it remains a related security and yield layer for parts of the infrastructure stack. The cooling matters. It shows that not every adjacent narrative is still in pure expansion mode. Capital is becoming more selective. Projects that can point to usage, node growth, or service demand are better placed than those offering only thematic exposure.
What I'm seeing is a market that still likes the AI and DePIN story, but is starting to differentiate inside it. That differentiation is usually where the next phase of returns—and the next phase of underperformance—gets decided.
Risks, Opportunities, and Positioning
The main risk is correlation. If Bitcoin loses momentum and broader risk sentiment fades, mid-cap DePIN and AI names will not be protected by their utility narrative. They may even underperform on the way down because they are the higher-beta sleeve of the market. Single-name risk is also elevated. A 45% jump in a name like Geodnet can attract momentum buyers late and punish them quickly if the catalyst is fully priced.
The opportunity sits in the relative-value structure itself. While large-cap ETF flows dominate headlines, selective strength in infrastructure mid-caps can offer cleaner expression of the decentralized compute and physical-network thesis. For pro traders, that means watching sector relative strength against BTC, funding conditions, and whether leadership persists or rotates rapidly between names. For longer-term investors, it means separating networks with measurable real-world activity from those still priced mainly on narrative adjacency to AI.
A disciplined approach is to treat the sector bid as real but conditional. The condition is continued risk appetite and continued evidence that these networks are doing work, not just trading as AI proxies.
Closing View
DePIN and AI infrastructure are leading a meaningful slice of the market while Bitcoin and ETF flows still take most of the attention. Geodnet’s sharp advance shows how far single names can run inside that backdrop. TAO’s less extreme sentiment reading shows that not every AI-linked asset is being chased the same way. Market cap above $2.8 trillion and modestly positive funding complete the picture of a risk-on environment that is still selective rather than indiscriminate.
The data suggests a two-tier market: large-cap and ETF liquidity on one side, mid-cap infrastructure beta on the other. That structure can persist as long as risk appetite holds and the utility narrative keeps finding confirmation in usage metrics. It can also unwind quickly if BTC dominance rises hard or if the sector’s leaders fail to hold relative strength after the first serious down day. From here, the useful work is less about celebrating the sector label and more about tracking which names still look like infrastructure—and which ones only looked like it on the way up.
$TAO
#DePIN
#crypto
#bitcoin
#bittensor
#TAO
2
1.2k
·
--

Article
NEAR’s Confidential Perps Bet Meets Real VolumeA privacy feature rarely moves a large-cap L1 this fast. NEAR has climbed roughly 45% in three days, trading in the $3.20 to $3.45 range, after the rollout of confidential perpetual trading tied to Hyperliquid. HYPE has extended toward prior highs near $90. Sentiment across Fear & Greed trackers has been sitting in Greed territory, roughly 57 to 71. Risk appetite is there. The more important question is whether this is a short-lived catalyst trade or the first clear signal that private on-chain derivatives can attract meaningful size.
What makes the setup different is the pairing. Hyperliquid has been processing on the order of $240 billion in perps volume over the prior 30 days. NEAR Intents have been generating more than $5 million in monthly fees. Confidential mode is not being launched into an empty venue. It is being attached to an engine that already has liquidity and to an L1 that has been pushing hard into AI, agents, and privacy-preserving execution.
Why the Timing Matters
Broader market tone has been willing to fund growth narratives again. That helps any strong catalyst. But the NEAR move is more specific than a generic risk-on bounce. Confidential TVL in the relevant intents and secret-mode activity has crossed about $70 million, with incentive snapshots tied to that threshold. Multi-chain deposits from more than 35 networks are active. That points to capital arriving from outside a single ecosystem rather than pure native rotation.
For pro traders, the combination of a sharp price response, rising volume, and a measurable TVL print is the kind of package that forces a decision. Either the market is front-running a durable new use case, or it is pricing a product launch too aggressively before retention is proven. Both readings are still open.
Technical and Market Structure
NEAR’s volume has been reported up around 120% with the move, which supports the idea that the advance is not just thin short-covering. Momentum is clearly strong. That also means shorter-term indicators are stretched. Moves of this speed often need either consolidation or a deeper retest before the next clean leg.
HYPE’s push toward prior all-time-high resistance after consecutive daily gains adds a second axis. If Hyperliquid’s token is firm while confidential activity on NEAR is rising, the market is treating the integration as additive rather than zero-sum. Funding and open interest on Hyperliquid have remained constructive, which suggests leverage is still engaging with the complex rather than exiting into the spike.
The practical read is straightforward. Strength with expanding volume and constructive derivatives metrics favors continuation after digestion. Strength with fading volume and rapidly elevated funding would favor a more tactical fade. So far the former description fits better than the latter, but the window after a 45% run is where that assessment can change quickly.
On-Chain and Product Reality
The $70 million confidential TVL figure is the number that separates this from pure narrative. Incentive programs can inflate short-term deposits, and that risk should not be ignored. Still, crossing a clear threshold while multi-chain deposits are active is more useful than a press release alone.
Privacy-by-default perps aim at a real friction in on-chain trading. Public mempools and transparent positioning make certain strategies harder to execute without leakage. A setup that keeps execution details shielded while still routing into a deep order book tries to solve that without forcing traders onto a fully isolated venue. That is the hybrid the market is responding to: privacy where it matters for the trader, liquidity where it matters for the fill.
Whether that hybrid holds depends on retention after incentives, fee quality, and whether larger accounts actually keep flow in confidential mode once the initial campaign window passes. Early TVL is a start. Sustained usage is the test.
Fundamentals, Risks, and Positioning
From a fundamental angle, the addressable user is not only the retail perps trader. It includes participants who want on-chain settlement and self-custody characteristics without broadcasting every aspect of their positioning. Pure L2 offerings and centralized exchanges each solve part of that problem. The NEAR–Hyperliquid combination is an attempt to sit in the middle: high-throughput settlement and confidential intents on one side, a dominant perps execution environment on the other.
Risks are clear. Product launches in crypto often produce a front-loaded price response that decays if metrics stall. Confidential systems also add operational and trust assumptions; users and institutions will care about the exact privacy guarantees, auditability, and failure modes. Correlation risk is another factor. If broader risk sentiment turns, NEAR and HYPE can both give back gains regardless of product quality.
For pro traders, the cleaner approach is to separate the catalyst from the trend. The catalyst has already been expressed in price. The trend case requires follow-through in confidential TVL, fees, and open interest without an immediate collapse in momentum. For longer-term investors, the question is whether this becomes a repeatable liquidity venue for private strategy execution or remains a one-cycle narrative premium.
Closing View
NEAR’s rally is tied to something more concrete than a vague AI or privacy story. Confidential perps, a $70 million secret-mode TVL print, multi-chain deposit activity, and Hyperliquid’s existing volume base give the move a real product anchor. HYPE’s strength alongside it suggests the market sees the pairing as complementary.
That does not make the advance low-risk. A 45% move in three days discounts a lot of good news quickly. What I'm watching from here is whether confidential activity continues to build after the first incentive checkpoints and whether price can hold a higher range without relying on continuous new headline flow. If the product keeps attracting size, the privacy-liquidity hybrid thesis gets harder to dismiss. If TVL and volume fade with the news cycle, this will look like another well-marketed catalyst that outran usage. The next few weeks of retention data will matter more than the size of the initial candle.
#Near #Hyperliquid #CryptoPrivacy #defi #bullish
$NEAR
{spot}(NEARUSDT)
$HYPE
{future}(HYPEUSDT)
NEAR’s Confidential Perps Bet Meets Real Volume
A privacy feature rarely moves a large-cap L1 this fast. NEAR has climbed roughly 45% in three days, trading in the $3.20 to $3.45 range, after the rollout of confidential perpetual trading tied to Hyperliquid. HYPE has extended toward prior highs near $90. Sentiment across Fear & Greed trackers has been sitting in Greed territory, roughly 57 to 71. Risk appetite is there. The more important question is whether this is a short-lived catalyst trade or the first clear signal that private on-chain derivatives can attract meaningful size.
What makes the setup different is the pairing. Hyperliquid has been processing on the order of $240 billion in perps volume over the prior 30 days. NEAR Intents have been generating more than $5 million in monthly fees. Confidential mode is not being launched into an empty venue. It is being attached to an engine that already has liquidity and to an L1 that has been pushing hard into AI, agents, and privacy-preserving execution.
Why the Timing Matters
Broader market tone has been willing to fund growth narratives again. That helps any strong catalyst. But the NEAR move is more specific than a generic risk-on bounce. Confidential TVL in the relevant intents and secret-mode activity has crossed about $70 million, with incentive snapshots tied to that threshold. Multi-chain deposits from more than 35 networks are active. That points to capital arriving from outside a single ecosystem rather than pure native rotation.
For pro traders, the combination of a sharp price response, rising volume, and a measurable TVL print is the kind of package that forces a decision. Either the market is front-running a durable new use case, or it is pricing a product launch too aggressively before retention is proven. Both readings are still open.
Technical and Market Structure
NEAR’s volume has been reported up around 120% with the move, which supports the idea that the advance is not just thin short-covering. Momentum is clearly strong. That also means shorter-term indicators are stretched. Moves of this speed often need either consolidation or a deeper retest before the next clean leg.
HYPE’s push toward prior all-time-high resistance after consecutive daily gains adds a second axis. If Hyperliquid’s token is firm while confidential activity on NEAR is rising, the market is treating the integration as additive rather than zero-sum. Funding and open interest on Hyperliquid have remained constructive, which suggests leverage is still engaging with the complex rather than exiting into the spike.
The practical read is straightforward. Strength with expanding volume and constructive derivatives metrics favors continuation after digestion. Strength with fading volume and rapidly elevated funding would favor a more tactical fade. So far the former description fits better than the latter, but the window after a 45% run is where that assessment can change quickly.
On-Chain and Product Reality
The $70 million confidential TVL figure is the number that separates this from pure narrative. Incentive programs can inflate short-term deposits, and that risk should not be ignored. Still, crossing a clear threshold while multi-chain deposits are active is more useful than a press release alone.
Privacy-by-default perps aim at a real friction in on-chain trading. Public mempools and transparent positioning make certain strategies harder to execute without leakage. A setup that keeps execution details shielded while still routing into a deep order book tries to solve that without forcing traders onto a fully isolated venue. That is the hybrid the market is responding to: privacy where it matters for the trader, liquidity where it matters for the fill.
Whether that hybrid holds depends on retention after incentives, fee quality, and whether larger accounts actually keep flow in confidential mode once the initial campaign window passes. Early TVL is a start. Sustained usage is the test.
Fundamentals, Risks, and Positioning
From a fundamental angle, the addressable user is not only the retail perps trader. It includes participants who want on-chain settlement and self-custody characteristics without broadcasting every aspect of their positioning. Pure L2 offerings and centralized exchanges each solve part of that problem. The NEAR–Hyperliquid combination is an attempt to sit in the middle: high-throughput settlement and confidential intents on one side, a dominant perps execution environment on the other.
Risks are clear. Product launches in crypto often produce a front-loaded price response that decays if metrics stall. Confidential systems also add operational and trust assumptions; users and institutions will care about the exact privacy guarantees, auditability, and failure modes. Correlation risk is another factor. If broader risk sentiment turns, NEAR and HYPE can both give back gains regardless of product quality.
For pro traders, the cleaner approach is to separate the catalyst from the trend. The catalyst has already been expressed in price. The trend case requires follow-through in confidential TVL, fees, and open interest without an immediate collapse in momentum. For longer-term investors, the question is whether this becomes a repeatable liquidity venue for private strategy execution or remains a one-cycle narrative premium.
Closing View
NEAR’s rally is tied to something more concrete than a vague AI or privacy story. Confidential perps, a $70 million secret-mode TVL print, multi-chain deposit activity, and Hyperliquid’s existing volume base give the move a real product anchor. HYPE’s strength alongside it suggests the market sees the pairing as complementary.
That does not make the advance low-risk. A 45% move in three days discounts a lot of good news quickly. What I'm watching from here is whether confidential activity continues to build after the first incentive checkpoints and whether price can hold a higher range without relying on continuous new headline flow. If the product keeps attracting size, the privacy-liquidity hybrid thesis gets harder to dismiss. If TVL and volume fade with the news cycle, this will look like another well-marketed catalyst that outran usage. The next few weeks of retention data will matter more than the size of the initial candle.
#Near #Hyperliquid #CryptoPrivacy #defi #bullish
$NEAR
$HYPE
What makes the setup different is the pairing. Hyperliquid has been processing on the order of $240 billion in perps volume over the prior 30 days. NEAR Intents have been generating more than $5 million in monthly fees. Confidential mode is not being launched into an empty venue. It is being attached to an engine that already has liquidity and to an L1 that has been pushing hard into AI, agents, and privacy-preserving execution.
Why the Timing Matters
Broader market tone has been willing to fund growth narratives again. That helps any strong catalyst. But the NEAR move is more specific than a generic risk-on bounce. Confidential TVL in the relevant intents and secret-mode activity has crossed about $70 million, with incentive snapshots tied to that threshold. Multi-chain deposits from more than 35 networks are active. That points to capital arriving from outside a single ecosystem rather than pure native rotation.
For pro traders, the combination of a sharp price response, rising volume, and a measurable TVL print is the kind of package that forces a decision. Either the market is front-running a durable new use case, or it is pricing a product launch too aggressively before retention is proven. Both readings are still open.
Technical and Market Structure
NEAR’s volume has been reported up around 120% with the move, which supports the idea that the advance is not just thin short-covering. Momentum is clearly strong. That also means shorter-term indicators are stretched. Moves of this speed often need either consolidation or a deeper retest before the next clean leg.
HYPE’s push toward prior all-time-high resistance after consecutive daily gains adds a second axis. If Hyperliquid’s token is firm while confidential activity on NEAR is rising, the market is treating the integration as additive rather than zero-sum. Funding and open interest on Hyperliquid have remained constructive, which suggests leverage is still engaging with the complex rather than exiting into the spike.
The practical read is straightforward. Strength with expanding volume and constructive derivatives metrics favors continuation after digestion. Strength with fading volume and rapidly elevated funding would favor a more tactical fade. So far the former description fits better than the latter, but the window after a 45% run is where that assessment can change quickly.
On-Chain and Product Reality
The $70 million confidential TVL figure is the number that separates this from pure narrative. Incentive programs can inflate short-term deposits, and that risk should not be ignored. Still, crossing a clear threshold while multi-chain deposits are active is more useful than a press release alone.
Privacy-by-default perps aim at a real friction in on-chain trading. Public mempools and transparent positioning make certain strategies harder to execute without leakage. A setup that keeps execution details shielded while still routing into a deep order book tries to solve that without forcing traders onto a fully isolated venue. That is the hybrid the market is responding to: privacy where it matters for the trader, liquidity where it matters for the fill.
Whether that hybrid holds depends on retention after incentives, fee quality, and whether larger accounts actually keep flow in confidential mode once the initial campaign window passes. Early TVL is a start. Sustained usage is the test.
Fundamentals, Risks, and Positioning
From a fundamental angle, the addressable user is not only the retail perps trader. It includes participants who want on-chain settlement and self-custody characteristics without broadcasting every aspect of their positioning. Pure L2 offerings and centralized exchanges each solve part of that problem. The NEAR–Hyperliquid combination is an attempt to sit in the middle: high-throughput settlement and confidential intents on one side, a dominant perps execution environment on the other.
Risks are clear. Product launches in crypto often produce a front-loaded price response that decays if metrics stall. Confidential systems also add operational and trust assumptions; users and institutions will care about the exact privacy guarantees, auditability, and failure modes. Correlation risk is another factor. If broader risk sentiment turns, NEAR and HYPE can both give back gains regardless of product quality.
For pro traders, the cleaner approach is to separate the catalyst from the trend. The catalyst has already been expressed in price. The trend case requires follow-through in confidential TVL, fees, and open interest without an immediate collapse in momentum. For longer-term investors, the question is whether this becomes a repeatable liquidity venue for private strategy execution or remains a one-cycle narrative premium.
Closing View
NEAR’s rally is tied to something more concrete than a vague AI or privacy story. Confidential perps, a $70 million secret-mode TVL print, multi-chain deposit activity, and Hyperliquid’s existing volume base give the move a real product anchor. HYPE’s strength alongside it suggests the market sees the pairing as complementary.
That does not make the advance low-risk. A 45% move in three days discounts a lot of good news quickly. What I'm watching from here is whether confidential activity continues to build after the first incentive checkpoints and whether price can hold a higher range without relying on continuous new headline flow. If the product keeps attracting size, the privacy-liquidity hybrid thesis gets harder to dismiss. If TVL and volume fade with the news cycle, this will look like another well-marketed catalyst that outran usage. The next few weeks of retention data will matter more than the size of the initial candle.
#Near #Hyperliquid #CryptoPrivacy #defi #bullish
$NEAR
$HYPE
400
·
--

Article
BTC’s $81K Push Meets a Familiar Question: Inflow or Distribution?You've seen this pattern before. Price runs hard, shorts get squeezed, and then the tape starts sending mixed signals. Bitcoin reclaimed the $81,000 area with a roughly 4.6% to 5.9% move over 24 hours. Short liquidations dominated the recent totals, running into the hundreds of millions. At the same time, whale real-flow volume jumped about 71% above the seven-day average, and net exchange inflow printed near 4,999 BTC.
That combination is what makes this moment interesting. A clean short squeeze can mark the start of the next leg. It can also mark the point where larger players begin feeding supply into strength. Traders are trying to decide which version they're looking at.
Why This Setup Matters Now
Fear & Greed has been sitting in Greed territory, with readings across trackers roughly in the 57 to 71 range. Risk appetite is present. It is not extreme euphoria, but it is firm enough to support momentum trades.
The ETF side added another layer. U.S. spot Bitcoin ETFs logged about $433 million in net inflows on September 18, led by Fidelity’s FBTC at roughly $311 million and BlackRock’s IBIT at about $108 million. Ethereum ETFs also saw around $144 million in net inflows. That is real capital, not just perpetual leverage recycling itself.
What stands out is the contrast. ETF flows suggest institutional demand is still active. Exchange-bound whale flow suggests some large holders are moving coins to venues where they can be sold. Both can be true at once. The market is deciding which force is stronger in the near term.
Leverage, Funding, and the Liquidation Map
Funding rates have stayed positive, around 0.01% per interval, or roughly 11% annualized on major venues. That means longs are still paying shorts. Hyperliquid’s BTC open interest holding near $3.5 billion shows the derivatives complex remains heavily engaged.
Liquidation heatmaps have been tight around the $80,000 to $82,000 band. That helps explain the speed of the move. When price pushes into a dense cluster of short positions, the cascade can feed itself for a while. Once that fuel is spent, the next direction often depends on whether fresh demand appears or whether the market simply digests the squeeze.
Positive funding after a sharp rally is not automatically bearish. It does raise the cost of staying long and increases the chance of a sharp mean-reversion if spot demand slows. This is where things get interesting for pro traders: the same conditions that powered the squeeze can also amplify the pullback.
On-Chain: Whales, Reserves, and the Flow Signal
On-chain data shows elevated large-holder activity. Whale volume has been substantial, with reports pointing to more than 151,000 BTC in whale-related volume and thousands of transactions, including notable mega-whale activity at the 1,000 BTC and above level. Exchange reserves have been rising after a multi-day stretch of net inflows.
Rising exchange balances after a strong price advance are the classic caution flag. Coins do not move to exchanges for storage. They move there when someone wants optionality to sell. That does not guarantee immediate distribution. Some of the flow can be market-making, ETF-related inventory, or simple repositioning. Still, the direction of travel matters. Persistent net inflows into exchanges while price is elevated usually deserve more attention than the same flows during a quiet range.
The data suggests a market that is active at the top of the size distribution. Whether those whales are preparing to sell into strength or simply rotating collateral is the open question. Price action over the next several sessions will do more to answer it than any single print.
Technical Structure and Practical Levels
From a market-structure perspective, the move has the look of a liquidity sweep above recent highs, followed by a test of whether acceptance holds above the breakout zone. RSI has been pushing toward overbought territory after the short-liquidation cascade. That fits the speed of the advance. It also fits a market that may need time or a deeper retest before the next sustained leg.
The $76,000 to $78,000 region has been discussed as an area of prior order-block and support interest. If price holds higher and only dips shallowly, the squeeze-to-trend interpretation stays alive. If the market loses the post-breakout area and starts probing back toward those lower supports with rising exchange reserves, the distribution interpretation gains weight.
For pro traders, the practical implication is straightforward. The easy short-covering phase may already be behind us. From here, sizing and invalidation levels matter more than narrative. A continued grind higher with stable or declining exchange reserves would support the bullish case. A failure to hold the breakout area while whale inflows persist would argue for patience rather than chase.
Closing View
This is a classic post-squeeze decision point. ETF inflows and a reclaimed $81,000 handle show that demand has not disappeared. Net exchange inflow near 5,000 BTC and elevated whale activity show that supply is also becoming more available at these prices. Funding remains positive and open interest is still large, so leverage is still in the game.
What I'm seeing is less a clean breakout story and more a balance of forces. The market has cleared a layer of short liquidity. It has not yet proven that the next buyers are strong enough to absorb whatever large holders may offer. Until that becomes clearer, treating the rally as a completed squeeze rather than a guaranteed trend extension is the more disciplined read. The next decisive signal will likely come from the interaction between ETF flow persistence, exchange reserve direction, and whether price can hold above the zone it just reclaimed.
#BTCBreaks80K #BitcoinMarketCapTopsTesla #BTC走势分析
$BTC
{spot}(BTCUSDT)
BTC’s $81K Push Meets a Familiar Question: Inflow or Distribution?
You've seen this pattern before. Price runs hard, shorts get squeezed, and then the tape starts sending mixed signals. Bitcoin reclaimed the $81,000 area with a roughly 4.6% to 5.9% move over 24 hours. Short liquidations dominated the recent totals, running into the hundreds of millions. At the same time, whale real-flow volume jumped about 71% above the seven-day average, and net exchange inflow printed near 4,999 BTC.
That combination is what makes this moment interesting. A clean short squeeze can mark the start of the next leg. It can also mark the point where larger players begin feeding supply into strength. Traders are trying to decide which version they're looking at.
Why This Setup Matters Now
Fear & Greed has been sitting in Greed territory, with readings across trackers roughly in the 57 to 71 range. Risk appetite is present. It is not extreme euphoria, but it is firm enough to support momentum trades.
The ETF side added another layer. U.S. spot Bitcoin ETFs logged about $433 million in net inflows on September 18, led by Fidelity’s FBTC at roughly $311 million and BlackRock’s IBIT at about $108 million. Ethereum ETFs also saw around $144 million in net inflows. That is real capital, not just perpetual leverage recycling itself.
What stands out is the contrast. ETF flows suggest institutional demand is still active. Exchange-bound whale flow suggests some large holders are moving coins to venues where they can be sold. Both can be true at once. The market is deciding which force is stronger in the near term.
Leverage, Funding, and the Liquidation Map
Funding rates have stayed positive, around 0.01% per interval, or roughly 11% annualized on major venues. That means longs are still paying shorts. Hyperliquid’s BTC open interest holding near $3.5 billion shows the derivatives complex remains heavily engaged.
Liquidation heatmaps have been tight around the $80,000 to $82,000 band. That helps explain the speed of the move. When price pushes into a dense cluster of short positions, the cascade can feed itself for a while. Once that fuel is spent, the next direction often depends on whether fresh demand appears or whether the market simply digests the squeeze.
Positive funding after a sharp rally is not automatically bearish. It does raise the cost of staying long and increases the chance of a sharp mean-reversion if spot demand slows. This is where things get interesting for pro traders: the same conditions that powered the squeeze can also amplify the pullback.
On-Chain: Whales, Reserves, and the Flow Signal
On-chain data shows elevated large-holder activity. Whale volume has been substantial, with reports pointing to more than 151,000 BTC in whale-related volume and thousands of transactions, including notable mega-whale activity at the 1,000 BTC and above level. Exchange reserves have been rising after a multi-day stretch of net inflows.
Rising exchange balances after a strong price advance are the classic caution flag. Coins do not move to exchanges for storage. They move there when someone wants optionality to sell. That does not guarantee immediate distribution. Some of the flow can be market-making, ETF-related inventory, or simple repositioning. Still, the direction of travel matters. Persistent net inflows into exchanges while price is elevated usually deserve more attention than the same flows during a quiet range.
The data suggests a market that is active at the top of the size distribution. Whether those whales are preparing to sell into strength or simply rotating collateral is the open question. Price action over the next several sessions will do more to answer it than any single print.
Technical Structure and Practical Levels
From a market-structure perspective, the move has the look of a liquidity sweep above recent highs, followed by a test of whether acceptance holds above the breakout zone. RSI has been pushing toward overbought territory after the short-liquidation cascade. That fits the speed of the advance. It also fits a market that may need time or a deeper retest before the next sustained leg.
The $76,000 to $78,000 region has been discussed as an area of prior order-block and support interest. If price holds higher and only dips shallowly, the squeeze-to-trend interpretation stays alive. If the market loses the post-breakout area and starts probing back toward those lower supports with rising exchange reserves, the distribution interpretation gains weight.
For pro traders, the practical implication is straightforward. The easy short-covering phase may already be behind us. From here, sizing and invalidation levels matter more than narrative. A continued grind higher with stable or declining exchange reserves would support the bullish case. A failure to hold the breakout area while whale inflows persist would argue for patience rather than chase.
Closing View
This is a classic post-squeeze decision point. ETF inflows and a reclaimed $81,000 handle show that demand has not disappeared. Net exchange inflow near 5,000 BTC and elevated whale activity show that supply is also becoming more available at these prices. Funding remains positive and open interest is still large, so leverage is still in the game.
What I'm seeing is less a clean breakout story and more a balance of forces. The market has cleared a layer of short liquidity. It has not yet proven that the next buyers are strong enough to absorb whatever large holders may offer. Until that becomes clearer, treating the rally as a completed squeeze rather than a guaranteed trend extension is the more disciplined read. The next decisive signal will likely come from the interaction between ETF flow persistence, exchange reserve direction, and whether price can hold above the zone it just reclaimed.
#BTCBreaks80K #BitcoinMarketCapTopsTesla #BTC走势分析
$BTC
That combination is what makes this moment interesting. A clean short squeeze can mark the start of the next leg. It can also mark the point where larger players begin feeding supply into strength. Traders are trying to decide which version they're looking at.
Why This Setup Matters Now
Fear & Greed has been sitting in Greed territory, with readings across trackers roughly in the 57 to 71 range. Risk appetite is present. It is not extreme euphoria, but it is firm enough to support momentum trades.
The ETF side added another layer. U.S. spot Bitcoin ETFs logged about $433 million in net inflows on September 18, led by Fidelity’s FBTC at roughly $311 million and BlackRock’s IBIT at about $108 million. Ethereum ETFs also saw around $144 million in net inflows. That is real capital, not just perpetual leverage recycling itself.
What stands out is the contrast. ETF flows suggest institutional demand is still active. Exchange-bound whale flow suggests some large holders are moving coins to venues where they can be sold. Both can be true at once. The market is deciding which force is stronger in the near term.
Leverage, Funding, and the Liquidation Map
Funding rates have stayed positive, around 0.01% per interval, or roughly 11% annualized on major venues. That means longs are still paying shorts. Hyperliquid’s BTC open interest holding near $3.5 billion shows the derivatives complex remains heavily engaged.
Liquidation heatmaps have been tight around the $80,000 to $82,000 band. That helps explain the speed of the move. When price pushes into a dense cluster of short positions, the cascade can feed itself for a while. Once that fuel is spent, the next direction often depends on whether fresh demand appears or whether the market simply digests the squeeze.
Positive funding after a sharp rally is not automatically bearish. It does raise the cost of staying long and increases the chance of a sharp mean-reversion if spot demand slows. This is where things get interesting for pro traders: the same conditions that powered the squeeze can also amplify the pullback.
On-Chain: Whales, Reserves, and the Flow Signal
On-chain data shows elevated large-holder activity. Whale volume has been substantial, with reports pointing to more than 151,000 BTC in whale-related volume and thousands of transactions, including notable mega-whale activity at the 1,000 BTC and above level. Exchange reserves have been rising after a multi-day stretch of net inflows.
Rising exchange balances after a strong price advance are the classic caution flag. Coins do not move to exchanges for storage. They move there when someone wants optionality to sell. That does not guarantee immediate distribution. Some of the flow can be market-making, ETF-related inventory, or simple repositioning. Still, the direction of travel matters. Persistent net inflows into exchanges while price is elevated usually deserve more attention than the same flows during a quiet range.
The data suggests a market that is active at the top of the size distribution. Whether those whales are preparing to sell into strength or simply rotating collateral is the open question. Price action over the next several sessions will do more to answer it than any single print.
Technical Structure and Practical Levels
From a market-structure perspective, the move has the look of a liquidity sweep above recent highs, followed by a test of whether acceptance holds above the breakout zone. RSI has been pushing toward overbought territory after the short-liquidation cascade. That fits the speed of the advance. It also fits a market that may need time or a deeper retest before the next sustained leg.
The $76,000 to $78,000 region has been discussed as an area of prior order-block and support interest. If price holds higher and only dips shallowly, the squeeze-to-trend interpretation stays alive. If the market loses the post-breakout area and starts probing back toward those lower supports with rising exchange reserves, the distribution interpretation gains weight.
For pro traders, the practical implication is straightforward. The easy short-covering phase may already be behind us. From here, sizing and invalidation levels matter more than narrative. A continued grind higher with stable or declining exchange reserves would support the bullish case. A failure to hold the breakout area while whale inflows persist would argue for patience rather than chase.
Closing View
This is a classic post-squeeze decision point. ETF inflows and a reclaimed $81,000 handle show that demand has not disappeared. Net exchange inflow near 5,000 BTC and elevated whale activity show that supply is also becoming more available at these prices. Funding remains positive and open interest is still large, so leverage is still in the game.
What I'm seeing is less a clean breakout story and more a balance of forces. The market has cleared a layer of short liquidity. It has not yet proven that the next buyers are strong enough to absorb whatever large holders may offer. Until that becomes clearer, treating the rally as a completed squeeze rather than a guaranteed trend extension is the more disciplined read. The next decisive signal will likely come from the interaction between ETF flow persistence, exchange reserve direction, and whether price can hold above the zone it just reclaimed.
#BTCBreaks80K #BitcoinMarketCapTopsTesla #BTC走势分析
$BTC
285
·
--

Article
AI Tokens Find Bid as Compute Narrative Regains TractionYou've probably noticed the rotation. While much of the market has been choppy, a cluster of AI-linked and DePIN names has quietly pushed higher. The sector added roughly $1.6 billion in market value, taking the AI token complex toward $18.6 billion. NEAR led with a gain of about 20.8%. RENDER advanced around 10%. Broader AI and DePIN names rose between 5% and 9%.
Fear & Greed sitting near 57 helps explain the tone. Risk appetite is present without being euphoric. That is usually the window where capital tests growth narratives instead of chasing pure momentum. The question is whether this move is just another narrative bounce or whether it is starting to track something more durable: real demand for decentralized compute.
Why This Matters Now
What stands out is the combination of price and a few concrete signals. Confidential TVL on NEAR has moved past $70 million. That is not speculative volume; it is capital sitting inside privacy-preserving applications on a chain that has spent years positioning itself for AI and agentic workloads. At the same time, the market keeps returning to the same bottleneck: high-quality GPU capacity remains scarce and expensive.
DePIN projects that can coordinate real hardware and pay node operators in a transparent way sit at the intersection of those two forces. Traders are treating the latest strength as more than a meme rotation. They are treating it as an early read on whether decentralized compute can capture a slice of institutional and commercial demand that used to flow only to centralized cloud providers.
Funding rates and open interest in AI perpetual markets have expanded with the move. That tells you leverage is participating. It also tells you the move is no longer purely spot-driven. When OI rises alongside price, the next leg usually depends on whether new buyers keep showing up or whether the trade becomes crowded and mean-reverts.
Technical and On-Chain Picture
NEAR and RENDER both show RSI readings that are approaching overbought territory on shorter timeframes. That does not automatically mean the move is over. It does mean the easy part of the rally may be behind us. Order-block and prior-breakout retests become more important from here. If those zones hold on pullbacks, the structure stays constructive. If they fail quickly, the advance starts to look like a squeeze rather than a trend.
On-chain, the more interesting data is not just price. Active addresses in several GPU and compute-related tokens have risen. There are signs of whale accumulation in names tied to rendering and decentralized infrastructure. In DePIN networks, supply dynamics often favor longer-term holders when node growth and real usage increase, because emissions and rewards are at least partially tied to actual work rather than pure inflation. That does not remove drawdown risk. It does change the quality of the buyer.
What I'm watching closely is whether rising activity is concentrated in a few large wallets or whether it is broadening. Speculative runs often look the same on the surface. Sustainable ones usually show wider participation over time.
Fundamentals and Tokenomics Angle
The core claim behind this complex is straightforward. AI training and inference need compute. Centralized providers dominate today, but cost, availability, and, increasingly, concerns around control and data handling create room for alternatives. Decentralized physical infrastructure networks try to turn idle or distributed hardware into a market. Tokens sit in the middle as coordination and incentive layers.
NEAR's positioning around confidential computing and AI agents gives it a different flavor from pure GPU marketplaces. RENDER and similar names are more directly exposed to rendering and compute supply. The sector-wide bid suggests the market is not picking a single winner yet. It is re-rating the category.
Tokenomics still matter. High emissions without corresponding demand for the service can cap upside even when the narrative is strong. Networks that can show rising node counts, utilization, and fee or reward flows tied to real workloads have a clearer path. Those that only offer exposure to the AI story without usage metrics will likely lag once the initial rotation fades.
Risks, Opportunities, and Practical Implications
The main risk is obvious. AI and DePIN have already delivered several narrative-driven rallies that faded when usage did not follow price. Overbought technicals, rising leverage, and a still-moderate Fear & Greed reading leave room for a sharp pullback if broader risk sentiment turns or if the next wave of catalysts disappoints.
There is also concentration risk. A handful of names can dominate sector performance. When they correct, the entire basket often moves with them.
The opportunity sits on the other side of that. If institutional and commercial demand for decentralized or hybrid compute continues to grow, the tokens that sit closest to real hardware and real workloads can re-rate on fundamentals rather than pure narrative. For pro traders, that means treating strength as a signal to manage risk around technical levels and funding, not as a reason to abandon sizing discipline. For longer-term investors, it means separating projects with measurable network activity from those that mainly offer thematic exposure.
One practical approach is to watch three things together: price structure on pullbacks, on-chain activity and whale behavior, and any hard metrics around TVL, node growth, or compute utilization. When all three align, the case is stronger. When only price is rising, caution is warranted.
Closing View
This rally is real in market terms. AI-linked tokens have taken meaningful capital and attention. NEAR's relative strength and the confidential TVL print give the move more texture than a pure meme rotation. At the same time, the sector has a history of running ahead of adoption.
What the data suggests right now is a market willing to pay for exposure to decentralized compute while the broader tone remains risk-on but not euphoric. Whether that payment proves justified depends on the next set of usage and infrastructure signals, not on the size of the latest percentage move. The interesting phase is the one that comes after the easy bid—when the market has to decide which projects are still priced for narrative and which ones are starting to be priced for work.
#AI #DePIN #Near #crypto #DecentralizedCompute
AI Tokens Find Bid as Compute Narrative Regains Traction
You've probably noticed the rotation. While much of the market has been choppy, a cluster of AI-linked and DePIN names has quietly pushed higher. The sector added roughly $1.6 billion in market value, taking the AI token complex toward $18.6 billion. NEAR led with a gain of about 20.8%. RENDER advanced around 10%. Broader AI and DePIN names rose between 5% and 9%.
Fear & Greed sitting near 57 helps explain the tone. Risk appetite is present without being euphoric. That is usually the window where capital tests growth narratives instead of chasing pure momentum. The question is whether this move is just another narrative bounce or whether it is starting to track something more durable: real demand for decentralized compute.
Why This Matters Now
What stands out is the combination of price and a few concrete signals. Confidential TVL on NEAR has moved past $70 million. That is not speculative volume; it is capital sitting inside privacy-preserving applications on a chain that has spent years positioning itself for AI and agentic workloads. At the same time, the market keeps returning to the same bottleneck: high-quality GPU capacity remains scarce and expensive.
DePIN projects that can coordinate real hardware and pay node operators in a transparent way sit at the intersection of those two forces. Traders are treating the latest strength as more than a meme rotation. They are treating it as an early read on whether decentralized compute can capture a slice of institutional and commercial demand that used to flow only to centralized cloud providers.
Funding rates and open interest in AI perpetual markets have expanded with the move. That tells you leverage is participating. It also tells you the move is no longer purely spot-driven. When OI rises alongside price, the next leg usually depends on whether new buyers keep showing up or whether the trade becomes crowded and mean-reverts.
Technical and On-Chain Picture
NEAR and RENDER both show RSI readings that are approaching overbought territory on shorter timeframes. That does not automatically mean the move is over. It does mean the easy part of the rally may be behind us. Order-block and prior-breakout retests become more important from here. If those zones hold on pullbacks, the structure stays constructive. If they fail quickly, the advance starts to look like a squeeze rather than a trend.
On-chain, the more interesting data is not just price. Active addresses in several GPU and compute-related tokens have risen. There are signs of whale accumulation in names tied to rendering and decentralized infrastructure. In DePIN networks, supply dynamics often favor longer-term holders when node growth and real usage increase, because emissions and rewards are at least partially tied to actual work rather than pure inflation. That does not remove drawdown risk. It does change the quality of the buyer.
What I'm watching closely is whether rising activity is concentrated in a few large wallets or whether it is broadening. Speculative runs often look the same on the surface. Sustainable ones usually show wider participation over time.
Fundamentals and Tokenomics Angle
The core claim behind this complex is straightforward. AI training and inference need compute. Centralized providers dominate today, but cost, availability, and, increasingly, concerns around control and data handling create room for alternatives. Decentralized physical infrastructure networks try to turn idle or distributed hardware into a market. Tokens sit in the middle as coordination and incentive layers.
NEAR's positioning around confidential computing and AI agents gives it a different flavor from pure GPU marketplaces. RENDER and similar names are more directly exposed to rendering and compute supply. The sector-wide bid suggests the market is not picking a single winner yet. It is re-rating the category.
Tokenomics still matter. High emissions without corresponding demand for the service can cap upside even when the narrative is strong. Networks that can show rising node counts, utilization, and fee or reward flows tied to real workloads have a clearer path. Those that only offer exposure to the AI story without usage metrics will likely lag once the initial rotation fades.
Risks, Opportunities, and Practical Implications
The main risk is obvious. AI and DePIN have already delivered several narrative-driven rallies that faded when usage did not follow price. Overbought technicals, rising leverage, and a still-moderate Fear & Greed reading leave room for a sharp pullback if broader risk sentiment turns or if the next wave of catalysts disappoints.
There is also concentration risk. A handful of names can dominate sector performance. When they correct, the entire basket often moves with them.
The opportunity sits on the other side of that. If institutional and commercial demand for decentralized or hybrid compute continues to grow, the tokens that sit closest to real hardware and real workloads can re-rate on fundamentals rather than pure narrative. For pro traders, that means treating strength as a signal to manage risk around technical levels and funding, not as a reason to abandon sizing discipline. For longer-term investors, it means separating projects with measurable network activity from those that mainly offer thematic exposure.
One practical approach is to watch three things together: price structure on pullbacks, on-chain activity and whale behavior, and any hard metrics around TVL, node growth, or compute utilization. When all three align, the case is stronger. When only price is rising, caution is warranted.
Closing View
This rally is real in market terms. AI-linked tokens have taken meaningful capital and attention. NEAR's relative strength and the confidential TVL print give the move more texture than a pure meme rotation. At the same time, the sector has a history of running ahead of adoption.
What the data suggests right now is a market willing to pay for exposure to decentralized compute while the broader tone remains risk-on but not euphoric. Whether that payment proves justified depends on the next set of usage and infrastructure signals, not on the size of the latest percentage move. The interesting phase is the one that comes after the easy bid—when the market has to decide which projects are still priced for narrative and which ones are starting to be priced for work.
#AI #DePIN #Near #crypto #DecentralizedCompute
Fear & Greed sitting near 57 helps explain the tone. Risk appetite is present without being euphoric. That is usually the window where capital tests growth narratives instead of chasing pure momentum. The question is whether this move is just another narrative bounce or whether it is starting to track something more durable: real demand for decentralized compute.
Why This Matters Now
What stands out is the combination of price and a few concrete signals. Confidential TVL on NEAR has moved past $70 million. That is not speculative volume; it is capital sitting inside privacy-preserving applications on a chain that has spent years positioning itself for AI and agentic workloads. At the same time, the market keeps returning to the same bottleneck: high-quality GPU capacity remains scarce and expensive.
DePIN projects that can coordinate real hardware and pay node operators in a transparent way sit at the intersection of those two forces. Traders are treating the latest strength as more than a meme rotation. They are treating it as an early read on whether decentralized compute can capture a slice of institutional and commercial demand that used to flow only to centralized cloud providers.
Funding rates and open interest in AI perpetual markets have expanded with the move. That tells you leverage is participating. It also tells you the move is no longer purely spot-driven. When OI rises alongside price, the next leg usually depends on whether new buyers keep showing up or whether the trade becomes crowded and mean-reverts.
Technical and On-Chain Picture
NEAR and RENDER both show RSI readings that are approaching overbought territory on shorter timeframes. That does not automatically mean the move is over. It does mean the easy part of the rally may be behind us. Order-block and prior-breakout retests become more important from here. If those zones hold on pullbacks, the structure stays constructive. If they fail quickly, the advance starts to look like a squeeze rather than a trend.
On-chain, the more interesting data is not just price. Active addresses in several GPU and compute-related tokens have risen. There are signs of whale accumulation in names tied to rendering and decentralized infrastructure. In DePIN networks, supply dynamics often favor longer-term holders when node growth and real usage increase, because emissions and rewards are at least partially tied to actual work rather than pure inflation. That does not remove drawdown risk. It does change the quality of the buyer.
What I'm watching closely is whether rising activity is concentrated in a few large wallets or whether it is broadening. Speculative runs often look the same on the surface. Sustainable ones usually show wider participation over time.
Fundamentals and Tokenomics Angle
The core claim behind this complex is straightforward. AI training and inference need compute. Centralized providers dominate today, but cost, availability, and, increasingly, concerns around control and data handling create room for alternatives. Decentralized physical infrastructure networks try to turn idle or distributed hardware into a market. Tokens sit in the middle as coordination and incentive layers.
NEAR's positioning around confidential computing and AI agents gives it a different flavor from pure GPU marketplaces. RENDER and similar names are more directly exposed to rendering and compute supply. The sector-wide bid suggests the market is not picking a single winner yet. It is re-rating the category.
Tokenomics still matter. High emissions without corresponding demand for the service can cap upside even when the narrative is strong. Networks that can show rising node counts, utilization, and fee or reward flows tied to real workloads have a clearer path. Those that only offer exposure to the AI story without usage metrics will likely lag once the initial rotation fades.
Risks, Opportunities, and Practical Implications
The main risk is obvious. AI and DePIN have already delivered several narrative-driven rallies that faded when usage did not follow price. Overbought technicals, rising leverage, and a still-moderate Fear & Greed reading leave room for a sharp pullback if broader risk sentiment turns or if the next wave of catalysts disappoints.
There is also concentration risk. A handful of names can dominate sector performance. When they correct, the entire basket often moves with them.
The opportunity sits on the other side of that. If institutional and commercial demand for decentralized or hybrid compute continues to grow, the tokens that sit closest to real hardware and real workloads can re-rate on fundamentals rather than pure narrative. For pro traders, that means treating strength as a signal to manage risk around technical levels and funding, not as a reason to abandon sizing discipline. For longer-term investors, it means separating projects with measurable network activity from those that mainly offer thematic exposure.
One practical approach is to watch three things together: price structure on pullbacks, on-chain activity and whale behavior, and any hard metrics around TVL, node growth, or compute utilization. When all three align, the case is stronger. When only price is rising, caution is warranted.
Closing View
This rally is real in market terms. AI-linked tokens have taken meaningful capital and attention. NEAR's relative strength and the confidential TVL print give the move more texture than a pure meme rotation. At the same time, the sector has a history of running ahead of adoption.
What the data suggests right now is a market willing to pay for exposure to decentralized compute while the broader tone remains risk-on but not euphoric. Whether that payment proves justified depends on the next set of usage and infrastructure signals, not on the size of the latest percentage move. The interesting phase is the one that comes after the easy bid—when the market has to decide which projects are still priced for narrative and which ones are starting to be priced for work.
#AI #DePIN #Near #crypto #DecentralizedCompute
469
Log in to explore more content
Join global crypto users on Binance Square
⚡️ Get latest and useful information about crypto.
💬 Trusted by the world’s largest crypto exchange.
👍 Discover real insights from verified creators.
Email / Phone number
Trending Topics
UKFCAWinsCourtOrderToRecover851400Pounds
3,951 views
325 Discussing
🚨 CRYPTO REGULATION JUST ENTERED A NEW PHASE: THEY’RE NOT ONLY WRITING RULES — THEY’RE TAKING MONEY BACK.
The UK’s FCA has secured another court-backed asset recovery, reinforcing a broader enforcement push against unauthorized financial and crypto-related activity.
And look at what’s happening simultaneously:
🇬🇧 FCA → enforcement + asset recovery
🇺🇸 SEC → clearer rules for functional crypto assets
🇺🇸 Fed → formal stablecoin supervision under the GENIUS Act
That combination matters.
Regulators are no longer debating whether crypto belongs inside the financial system.
They’re increasingly deciding who gets access, what rules they follow, and what happens when those rules are broken.
The next crypto cycle may not be “regulation vs innovation.”
It may be regulated crypto vs everyone who can’t meet the standard. 👀
$COIN $CRCL $BTC
#ukfcawinscourtordertorecover851400pounds #ChainlinkLaunchesCCIP2WithEnterpriseVerification #GoldFallsTo$4144 #QNTFallsOver40%FromMorningHigh #USDTAdds845900HoldersInPast7Days
KimHotbae
·1 Likes
·2.8k views
ChainlinkLaunchesCCIP2WithEnterpriseVerification
15,444 views
608 Discussing
GoldFallsTo$4144
6,872 views
108 Discussing