EGLD/USDT ANALYSIS
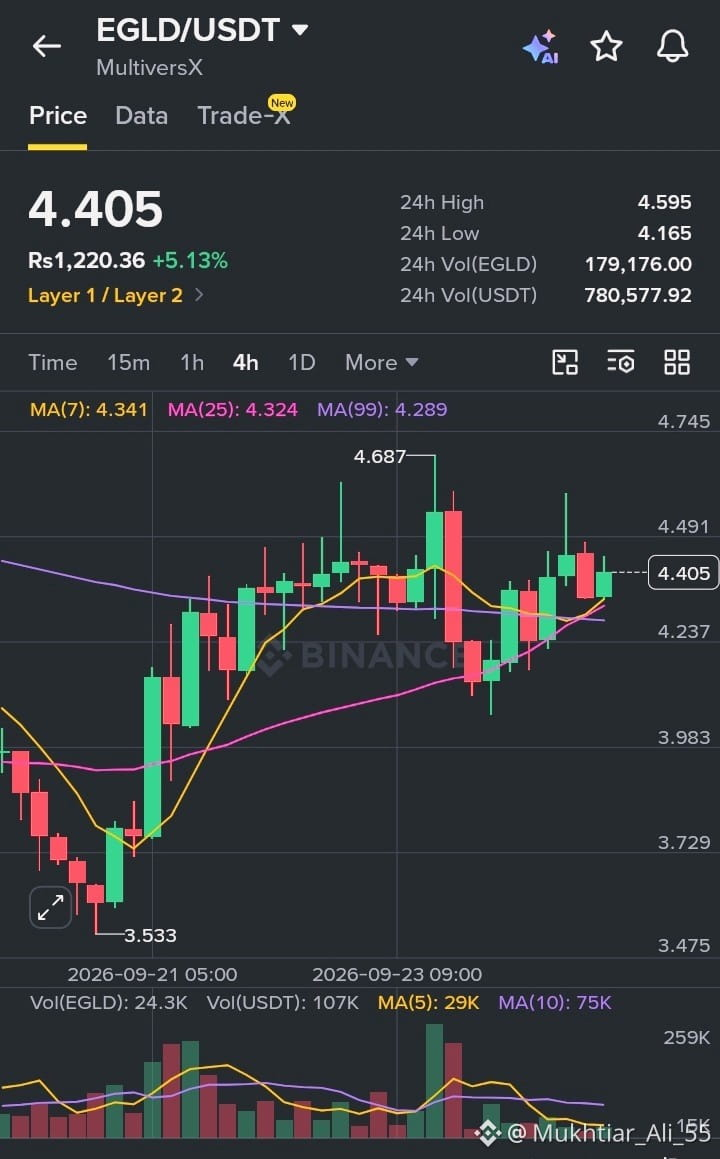
🚀 EGLD CONSOLIDATING ABOVE KEY MAs: WILL BULLS RETEST THE LOCAL HIGH? 📈🔥
EGLD | EGLD/USDT
💰 Price: 4.405
📈 24H Change: +5.13%
📊 24H High: 4.595
📉 24H Low: 4.165
💵 24H Volume (USDT): 780.57K
⚠️ Market Structure (4H Timeframe):
EGLD is holding steady in a higher-low structure after bouncing off the 3.533 floor
🔻 Price tested a local peak of 4.687 before experiencing dynamic resistance and pulling back
🔻 Recent candle wicks demonstrate steady absorption around the 4.230–4.300 demand zone
🔻 Current green candle shows buyers stepping in to maintain short-term trend control
📈 Moving Averages Alignment:
📌 MA(7): 4.341
📌 MA(25): 4.324
📌 MA(99): 4.289
✅ Price is trading above MA(7), MA(25), and MA(99)
✅ Short-term moving averages (7 & 25) have crossed above the long-term MA(99), signaling a bullish posture
✅ Moving averages are tightly clustered below price, offering solid trailing confluence support
📊 Volume Insight:
🟢 Modest, consistent volume backing the recent recovery move
💥 MA(5) volume holding at 29K with MA(10) at 75K
⚠️ Volume expansion above 4.500 will be required to spark a strong continuation move
🧠 What This Means:
Constructive range consolidation following a strong low-level reversal 🚀
🔹 Short-term trend: Bullish
🔹 Momentum: Steady
🔹 Market emotion: Patient Accumulation
🎯 Key Levels to Watch:
🟢 Support Zone: 4.289 – 4.341 (MA Cluster Support Zone)
🔴 Resistance Zone: 4.595 – 4.687 (24H High & Swing Peak)
📌 Sustaining above 4.340 keeps momentum intact for a retest of 4.600+
📌 A break below 4.280 would invalidate short-term strength and risk a slide toward 4.000
💡 Final Take:
🧨 EGLD is showing healthy, structured growth with strong moving average support
🧘 Look for confirmation around the MA cluster before taking high-conviction entries
🛡️ Always enforce proper risk management to protect your capital! 💎
#EGLD #MultiversX #CryptoAnalysis #TechnicalAnalysis #TradingSignals
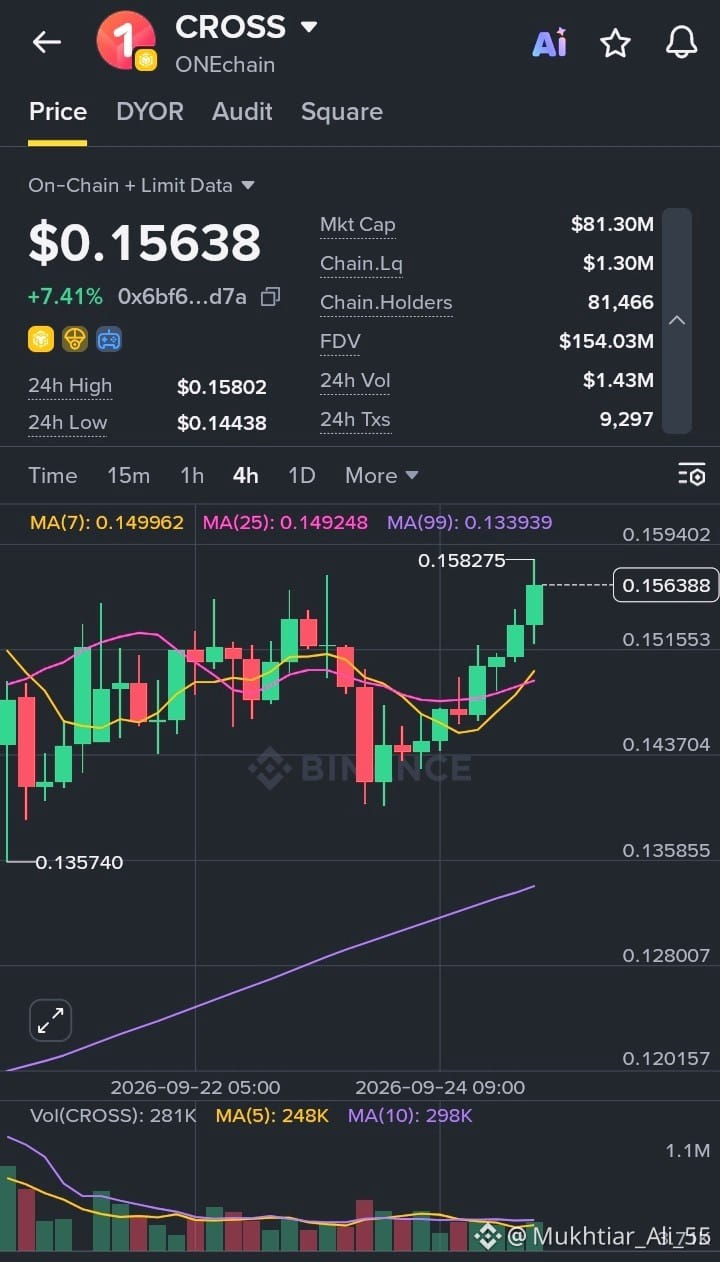
CROSS/USDT ANALYSIS
⚡ CROSS BREAKS OUT: BULLS TAKE CONTROL WITH STRONG UPWARD IMPULSE! 📊🚀
CROSS | CROSS/USDT
💰 Price: 0.15638
📈 24H Change: +7.41%
📊 24H High: 0.15802
📉 24H Low: 0.14438
💵 24H Volume: $1.43M
⚠️ Market Structure (4H Timeframe):
CROSS has broken out of a sideways consolidation band between 0.14300 and 0.15100
🔻 Consecutive green candles are pushing price toward the swing resistance high of 0.15827
🔻 Price structure is printing higher highs and higher lows on the 4H chart
🔻 Solid bullish expansion indicates active buyer pressure and short squeezing
📈 Moving Averages Alignment:
📌 MA(7): 0.14996
📌 MA(25): 0.14924
📌 MA(99): 0.13393
✅ Price is holding strong above MA(7), MA(25), and MA(99)
✅ MA(7) is curving upward aggressively over MA(25), reinforcing short-term bullish momentum
✅ MA(99) far below at 0.13393 confirms macro trend support
📊 Volume Insight:
🟢 Rising volume profile supporting the push past 0.15500
💥 MA(5) volume standing at 248K with MA(10) at 298K
⚠️ Healthy volume buildup validates buyer interest during this breakout leg
🧠 What This Means:
Trend breakout leg following base accumulation 🚀
🔹 Short-term trend: Strongly Bullish
🔹 Momentum: Accelerating
🔹 Market emotion: Breakout Expansion 📈
🎯 Key Levels to Watch:
🟢 Support Zone: 0.14924 – 0.15155 (MA7/MA25 Confluence & Breakout Retest Base)
🔴 Resistance Zone: 0.15827 – 0.16000 (Local High & Major Resistance)
📌 A clean 4H close above 0.15830 clears the path for targets toward 0.16500+
📌 Losing 0.14900 would break the immediate momentum and signal a deeper retest
💡 Final Take:
🧨 CROSS is displaying clear bullish momentum as buyers push through resistance
🧘 Avoid entering at the top of expansion candles; look for pullbacks to MA support
🛡️ Maintain disciplined risk parameters and manage exposure wisely! 💎
#ONEchain #CryptoNews #TechnicalAnalysis #AltcoinRally