$ETH
🚨Ethereum technical outlook: ETH faces $2,786 resistance🚨
Ethereum saw $224.7 million in liquidations over the past 24 hours, led by $191 million in short liquidations, according to Coinglass data.
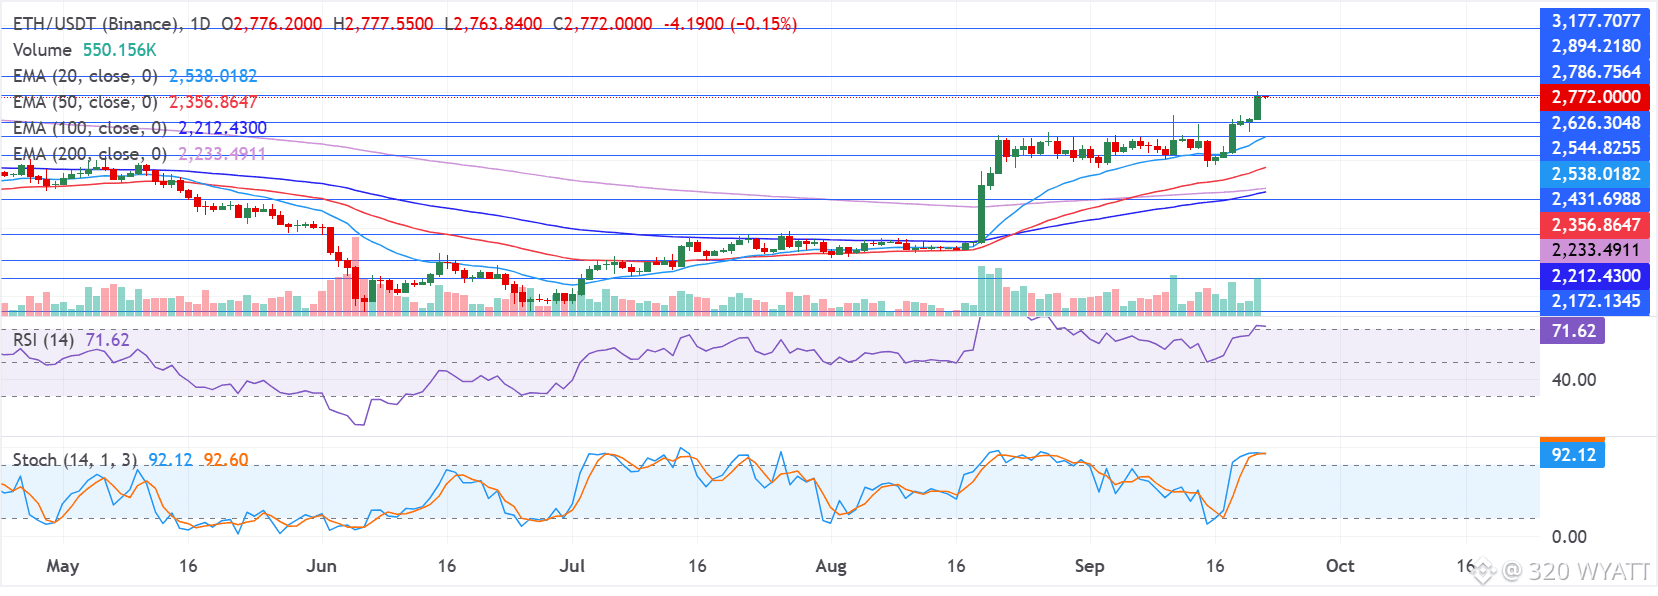
On the daily chart, ETH maintains a clear bullish bias as price holds well above the 20-, 50-, 100-, and 200-day Exponential Moving Averages (EMAs), with the 20-day EMA at $2,537 leading the short-term uptrend.
The 14-day Relative Strength Index (RSI) at 71 and the Stochastic Oscillator (Stoch) at 91 both sit in overbought territory, suggesting strong but potentially stretched upside momentum as price grinds toward nearby overhead levels.
On the topside, immediate resistance is located at the horizontal barrier at $2,786, which caps the latest advance for now before the $2,894 and $3,177 levels.
On the downside, initial support is seen at the recent structural floor around $2,626, followed by a dense demand zone formed by the $2,544 horizontal level and the 20-day EMA at $2,537. Below that, the $2,431 horizontal support aligns with the 50-day EMA at $2,356, while deeper pullbacks could target the 200- and 100-day EMA before the prior support band near $2,172.
#ETH320 #mr320 #Trendingissue #WriteToEarn2026 #eth
🚨Ethereum technical outlook: ETH faces $2,786 resistance🚨
Ethereum saw $224.7 million in liquidations over the past 24 hours, led by $191 million in short liquidations, according to Coinglass data.
On the daily chart, ETH maintains a clear bullish bias as price holds well above the 20-, 50-, 100-, and 200-day Exponential Moving Averages (EMAs), with the 20-day EMA at $2,537 leading the short-term uptrend.
The 14-day Relative Strength Index (RSI) at 71 and the Stochastic Oscillator (Stoch) at 91 both sit in overbought territory, suggesting strong but potentially stretched upside momentum as price grinds toward nearby overhead levels.
On the topside, immediate resistance is located at the horizontal barrier at $2,786, which caps the latest advance for now before the $2,894 and $3,177 levels.
On the downside, initial support is seen at the recent structural floor around $2,626, followed by a dense demand zone formed by the $2,544 horizontal level and the 20-day EMA at $2,537. Below that, the $2,431 horizontal support aligns with the 50-day EMA at $2,356, while deeper pullbacks could target the 200- and 100-day EMA before the prior support band near $2,172.
#ETH320 #mr320 #Trendingissue #WriteToEarn2026 #eth