
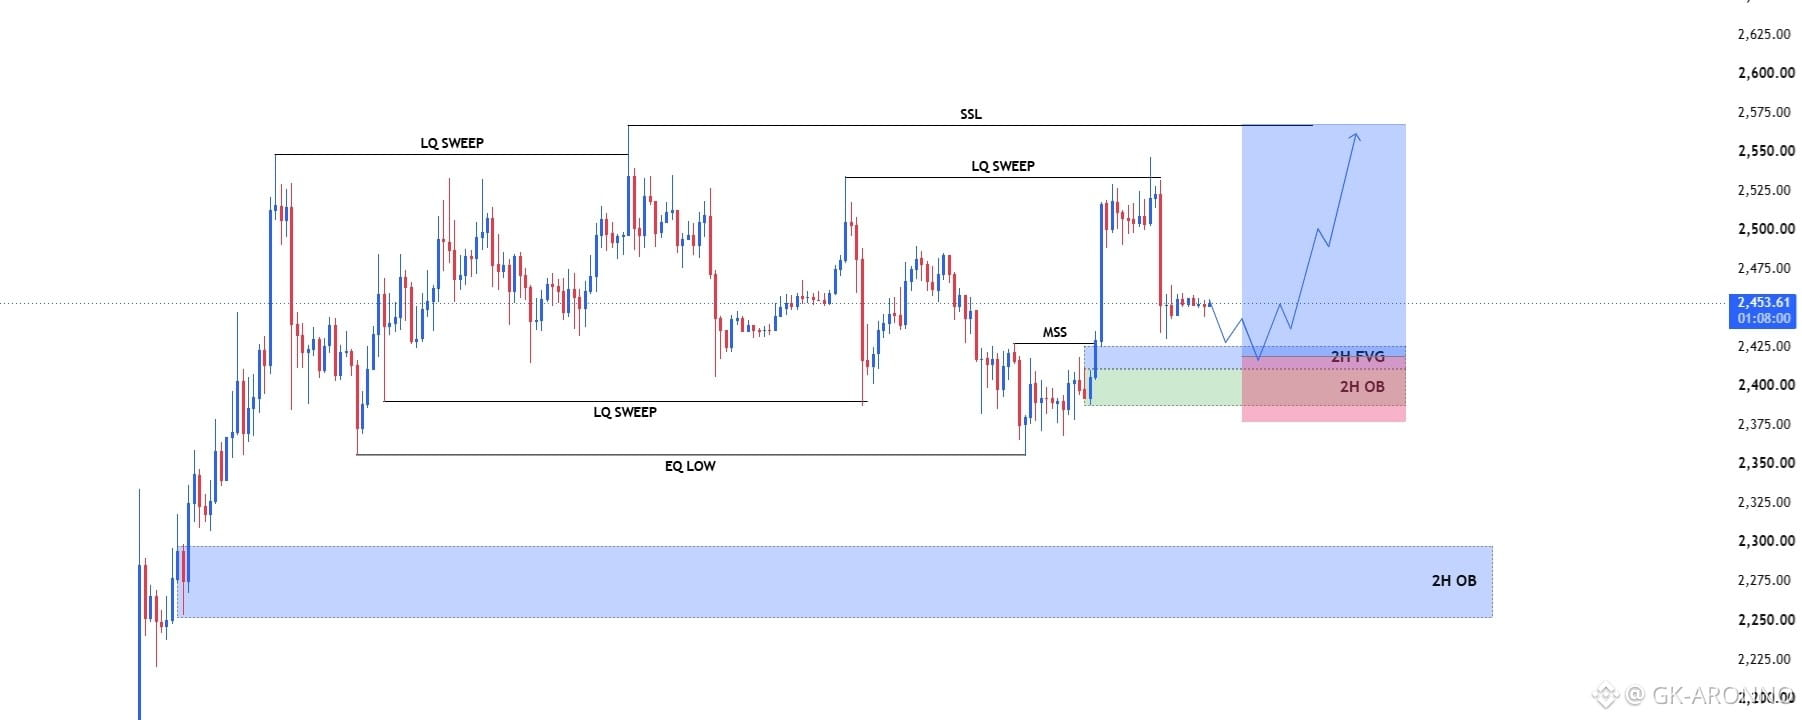


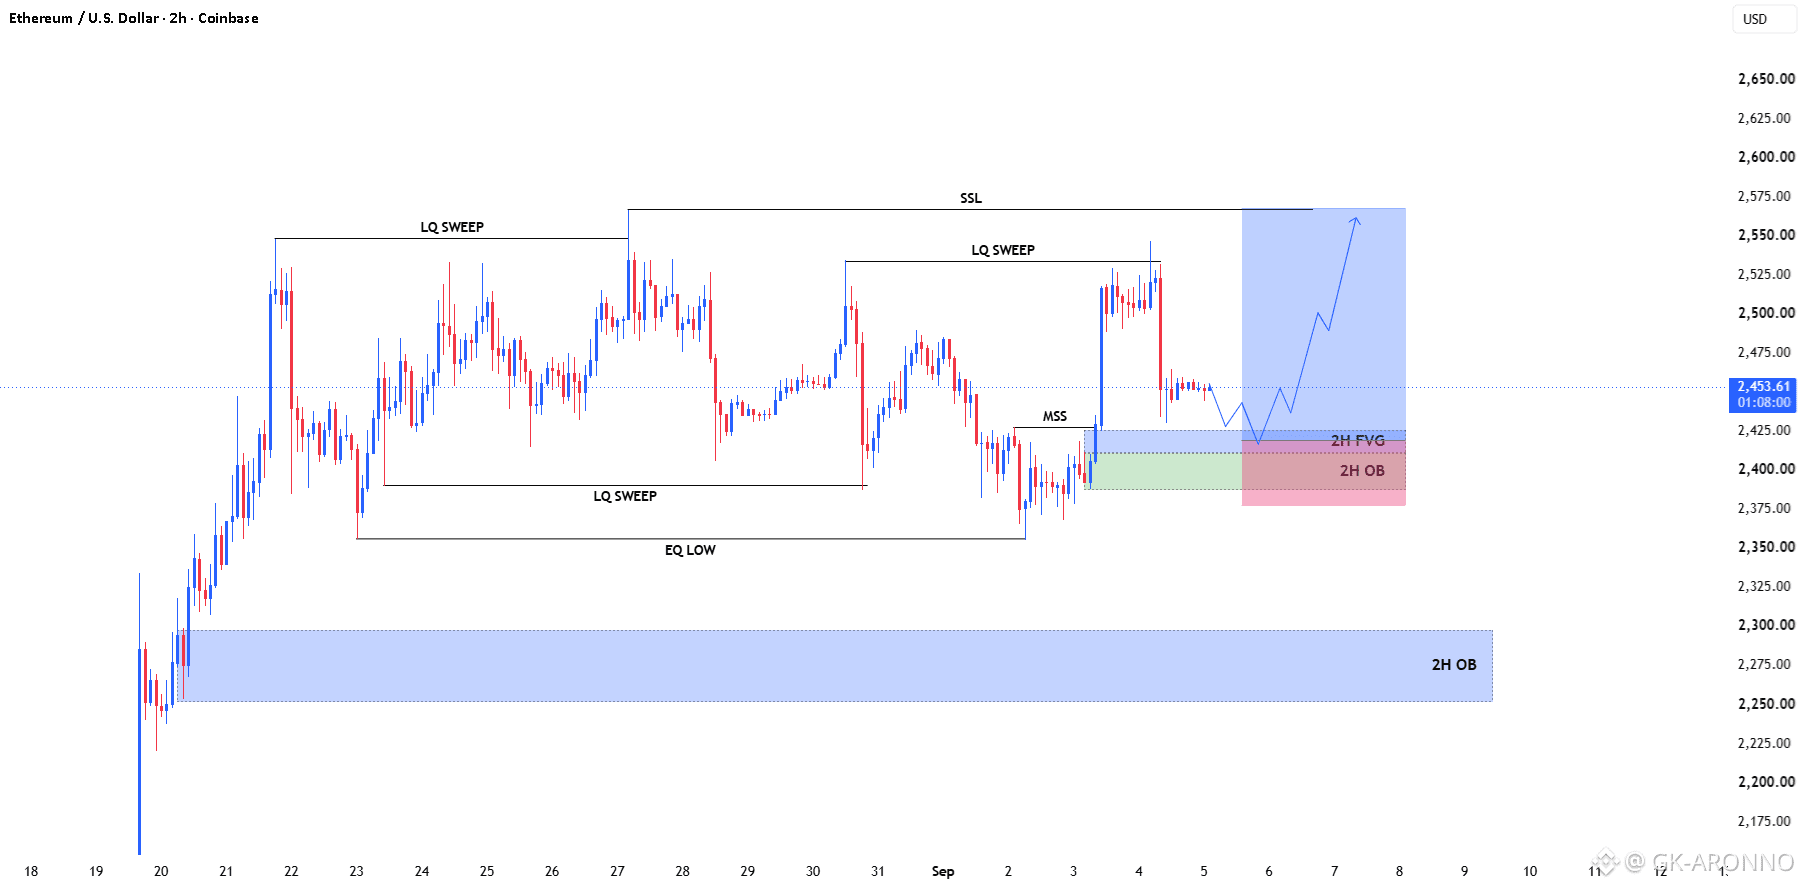
Market structure: ETH is trading around 2,453 after a liquidity sweep above the recent highs near 2,525–2,535. The chart then shows a sharp rejection and a Market Structure Shift (MSS), making the 2,400–2,430 area the key zone to watch for a potential reaction.
🔑 Key Levels
Current price: ~2,453
2H FVG: approximately 2,415–2,430
2H OB: approximately 2,390–2,415
Major 2H OB: 2,250–2,295
Upside liquidity / SSL: approximately 2,550–2,570
Recent liquidity high: 2,525–2,535
📈 Potential Bullish Scenario
If price retraces into the 2H FVG / 2H OB area (2,390–2,430) and produces a clear bullish reaction, the structure could support a move back toward:
2,475 → 2,525 → 2,550–2,570
The key is confirmation from price action rather than assuming the zone will hold.
⚠️ Invalidation / Bearish Scenario
A decisive 2H close below the 2H OB around 2,390 would weaken the bullish thesis. In that case, the next significant area shown on the chart is the 2H OB around 2,250–2,295...
