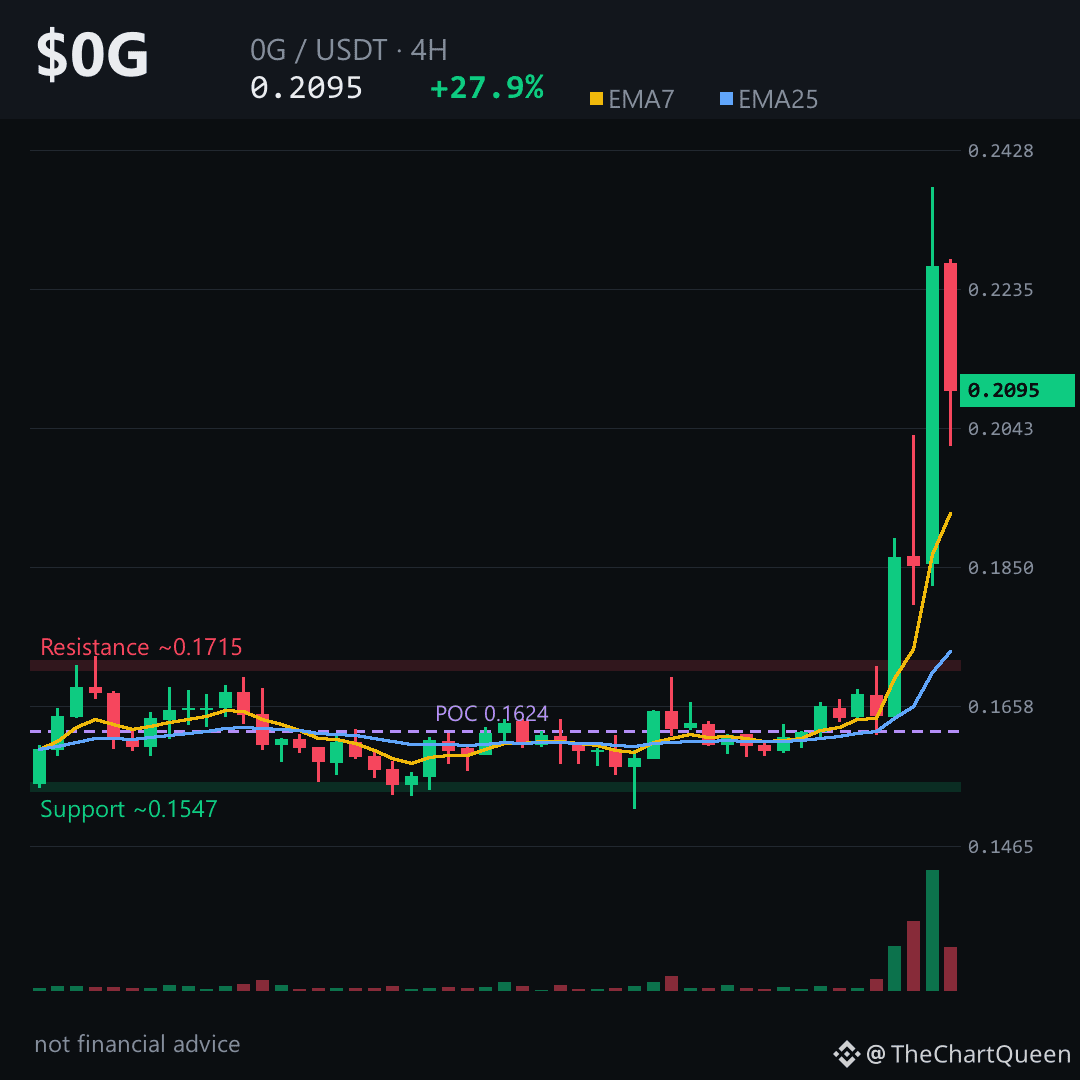
27.9% jump in 24 h catapulted $0G to 0.211, but the 4‑hour candle pattern is already hinting at a pull‑back.
The hype says “keep buying”, yet the chart tells a different story.
Price is hugging the 0.21 zone on a tight EMA7/EMA25 spread, while RSI hovers at 71 – a classic overbought warning. Meanwhile a bullish FVG sits between 0.172 and 0.180, but it’s already being eaten by sellers. Funding is negative and the long‑short ratio sits at 1.59, suggesting leveraged longs are paying to stay in.
On the 4‑hour picture the pivot is around 0.21. The invalidation sits near 0.199; a close below that would flip the bias. If $0G holds above the 0.199 zone, the next target lies near the 0.229 objective, echoing the recent high at 0.237. Lose the ~0.199 area on a 4‑hour close and this read is off the table. Tap $0G to pull up the chart and see these zones yourself.
My read: the market is likely to test the 0.199 floor before chasing the 0.229 ceiling.
Follow me for the next update when the 0.199 line finally decides the direction – you’ll want to know if the pull‑back holds.
What level are you watching for 0G? 👇
⚠️ Not financial advice. DYOR.
#0G #Crypto #BinanceSquare #TopGainer
The hype says “keep buying”, yet the chart tells a different story.
Price is hugging the 0.21 zone on a tight EMA7/EMA25 spread, while RSI hovers at 71 – a classic overbought warning. Meanwhile a bullish FVG sits between 0.172 and 0.180, but it’s already being eaten by sellers. Funding is negative and the long‑short ratio sits at 1.59, suggesting leveraged longs are paying to stay in.
On the 4‑hour picture the pivot is around 0.21. The invalidation sits near 0.199; a close below that would flip the bias. If $0G holds above the 0.199 zone, the next target lies near the 0.229 objective, echoing the recent high at 0.237. Lose the ~0.199 area on a 4‑hour close and this read is off the table. Tap $0G to pull up the chart and see these zones yourself.
My read: the market is likely to test the 0.199 floor before chasing the 0.229 ceiling.
Follow me for the next update when the 0.199 line finally decides the direction – you’ll want to know if the pull‑back holds.
What level are you watching for 0G? 👇
⚠️ Not financial advice. DYOR.
#0G #Crypto #BinanceSquare #TopGainer