


📊 Technical Analysis — VET/USDT
⏱️ Time Frame: 4D
📐 Pattern: Descending Channel
💰 Current Price: ± $0.006827
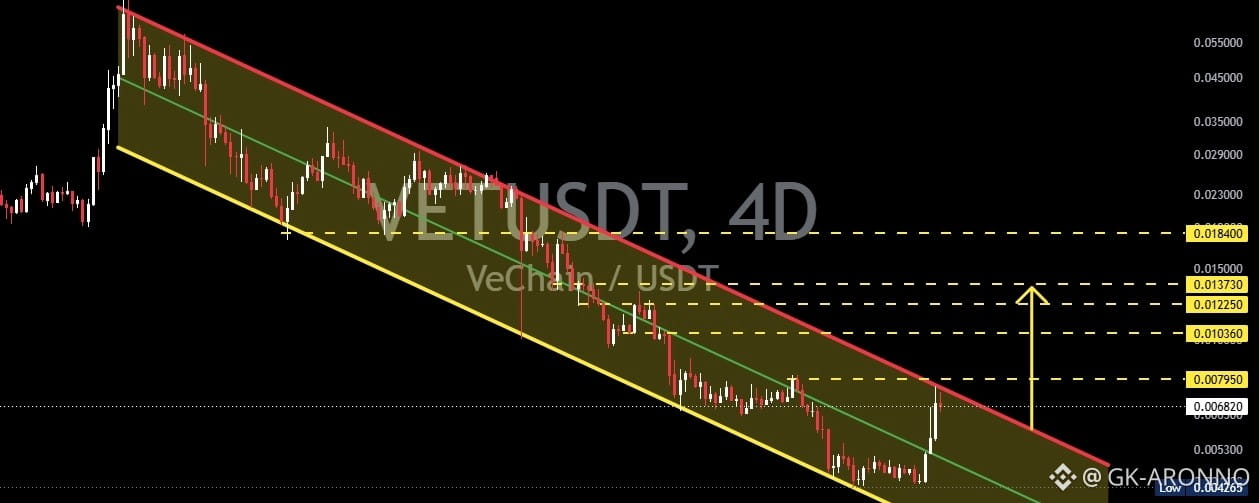
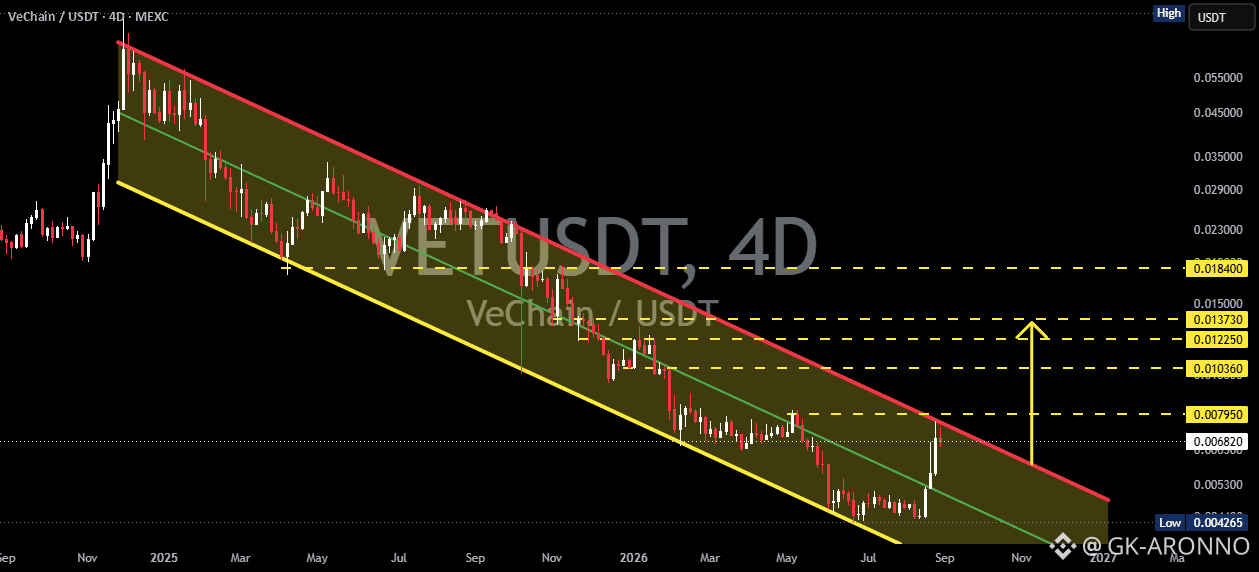
VeChain (VET) is still trading within a Descending Channel that has established a long-term bearish structure. The channel is clearly defined by the red resistance trendline and yellow support trendline, with the green line acting as the channel’s median/equilibrium level.
However, there is an important change in the latest price action: VET has made a strong rebound from the lower part of the channel and is now moving back toward the major resistance area.
---
📐 Pattern — Descending Channel
🔻 Descending Channel is a pattern formed when price creates a series of Lower Highs and Lower Lows while moving between two downward-sloping parallel trendlines.
On this chart:
🔴 Upper Trendline / Resistance
→ Acts as the primary dynamic resistance and has repeatedly limited VET’s recovery attempts.
🟡 Lower Trendline / Support
→ Acts as the main support area where buying pressure has previously emerged.
🟢 Middle Channel / Median Line
→ Represents the equilibrium area. Moving back above this line indicates improving bullish momentum, but it is not enough to confirm a full breakout.
📌 As long as price remains inside the channel, the broader structure remains bearish-to-neutral.
---
🟢 BULLISH SCENARIO — Descending Channel Breakout
The bullish scenario becomes significantly stronger if VET continues higher and eventually breaks and closes strongly above the red resistance trendline.
🚀 Key confirmations:
Price breaks above the upper descending trendline.
The 4D candle manages to close above resistance, rather than only producing a wick.
The former resistance successfully turns into support.
Trading volume increases to confirm the breakout.
If these conditions occur, the Descending Channel could experience a bullish breakout, potentially opening the way toward the next horizontal resistance levels.
🎯 Potential Bullish Targets
TP1 — $0.007950 🎯
→ Nearest resistance and initial upside target.
TP2 — $0.010360 🚀
→ Next significant resistance level.
TP3 — $0.012250 📈
→ Intermediate resistance area.
TP4 — $0.013730 🔥
→ Next major resistance and a potential profit-taking zone.
TP5 — $0.018400 🚀🚀
→ Major resistance and a more aggressive recovery target.
📌 Main chart target: $0.018400
If the channel breakout is fully confirmed, a move toward the $0.01373–$0.01840 area could become an interesting recovery scenario.
---
🔴 BEARISH SCENARIO — Rejection from Resistance
Although the latest rebound looks bullish, VET has not fully reversed its bearish structure as long as price remains below the red descending resistance trendline.
⚠️ The bearish scenario could regain control if:
Price experiences a strong rejection from the red trendline.
A new lower high is formed.
Price loses the green median/channel area.
Nearby support fails to hold.
Price moves back toward the lower channel boundary.
If rejection occurs before a breakout, the current rebound could simply become a relief rally within the existing bearish structure.
📉 In this situation, the main focus would return to the lower channel support, as losing that support could increase the probability of another new lower low.
---
🔑 KEY LEVELS
Level Function
🟢 $0.006827 Current price / current area
🟡 $0.007950 Resistance / initial target
🟡 $0.010360 Next resistance
🟡 $0.012250 Intermediate resistance
🟡 $0.013730 Major resistance
🔴 Descending Trendline Main dynamic resistance
🚀 $0.018400 Major upside target
🟡 Lower Channel Main dynamic support
---
🧠 MARKET STRUCTURE
There are currently two phases that need to be distinguished:
1️⃣ Short/Medium-Term: 🟢
The rebound from the lower channel indicates increasing buying pressure and the potential for further bullish continuation.
2️⃣ Higher Time Frame: 🔴
The structure remains bearish until price breaks and confirms above the descending resistance trendline.
Therefore, a rebound ≠ a confirmed reversal.
📌 A more valid reversal would occur if VET achieves a breakout + close above the upper trendline + successful retest.
---
🚨 KEY CONFIRMATION
🟢 Bullish Confirmation
Break + Close + Retest above the descending resistance 🔥
➡️ This could potentially shift the structure from bearish → bullish reversal.
🔴 Bearish Confirmation
Rejection + breakdown of support/channel 📉
➡️ This could maintain the Lower High → Lower Low structure.
---
🎯 CONCLUSION
VET is currently at a very interesting point within the Descending Channel.
📈 The rebound from the lower channel provides a potential bullish opportunity, but price still needs to overcome the major descending resistance.
🔥 A breakout above the red resistance trendline would be the most important technical catalyst, as it could invalidate the descending channel structure and open the path toward $0.00795 → $0.01036 → $0.01225 → $0.01373 → $0.01840.
⚠️ On the other hand, a rejection from resistance followed by a breakdown toward support would maintain the bearish structure and increase the possibility of a retest of the lower channel.
Overall Bias: 🟡 Neutral → Bullish on confirmed breakout
Pattern: 📉 Descending Channel
Key Trigger: 🚀 Breakout & 4D close above descending resistance
