
Despite an ongoing downfall in the Shiba Inu coin, the technical chart reflects a bullish continuation called a falling wedge pattern. Under the influence of this pattern, the buyers should start a fresh recovery rally upon the breakout of its trendline. Thus, this pattern could assist buyers in regaining trend control. The $0.000008 Level Stands As A High Accumulation Zone 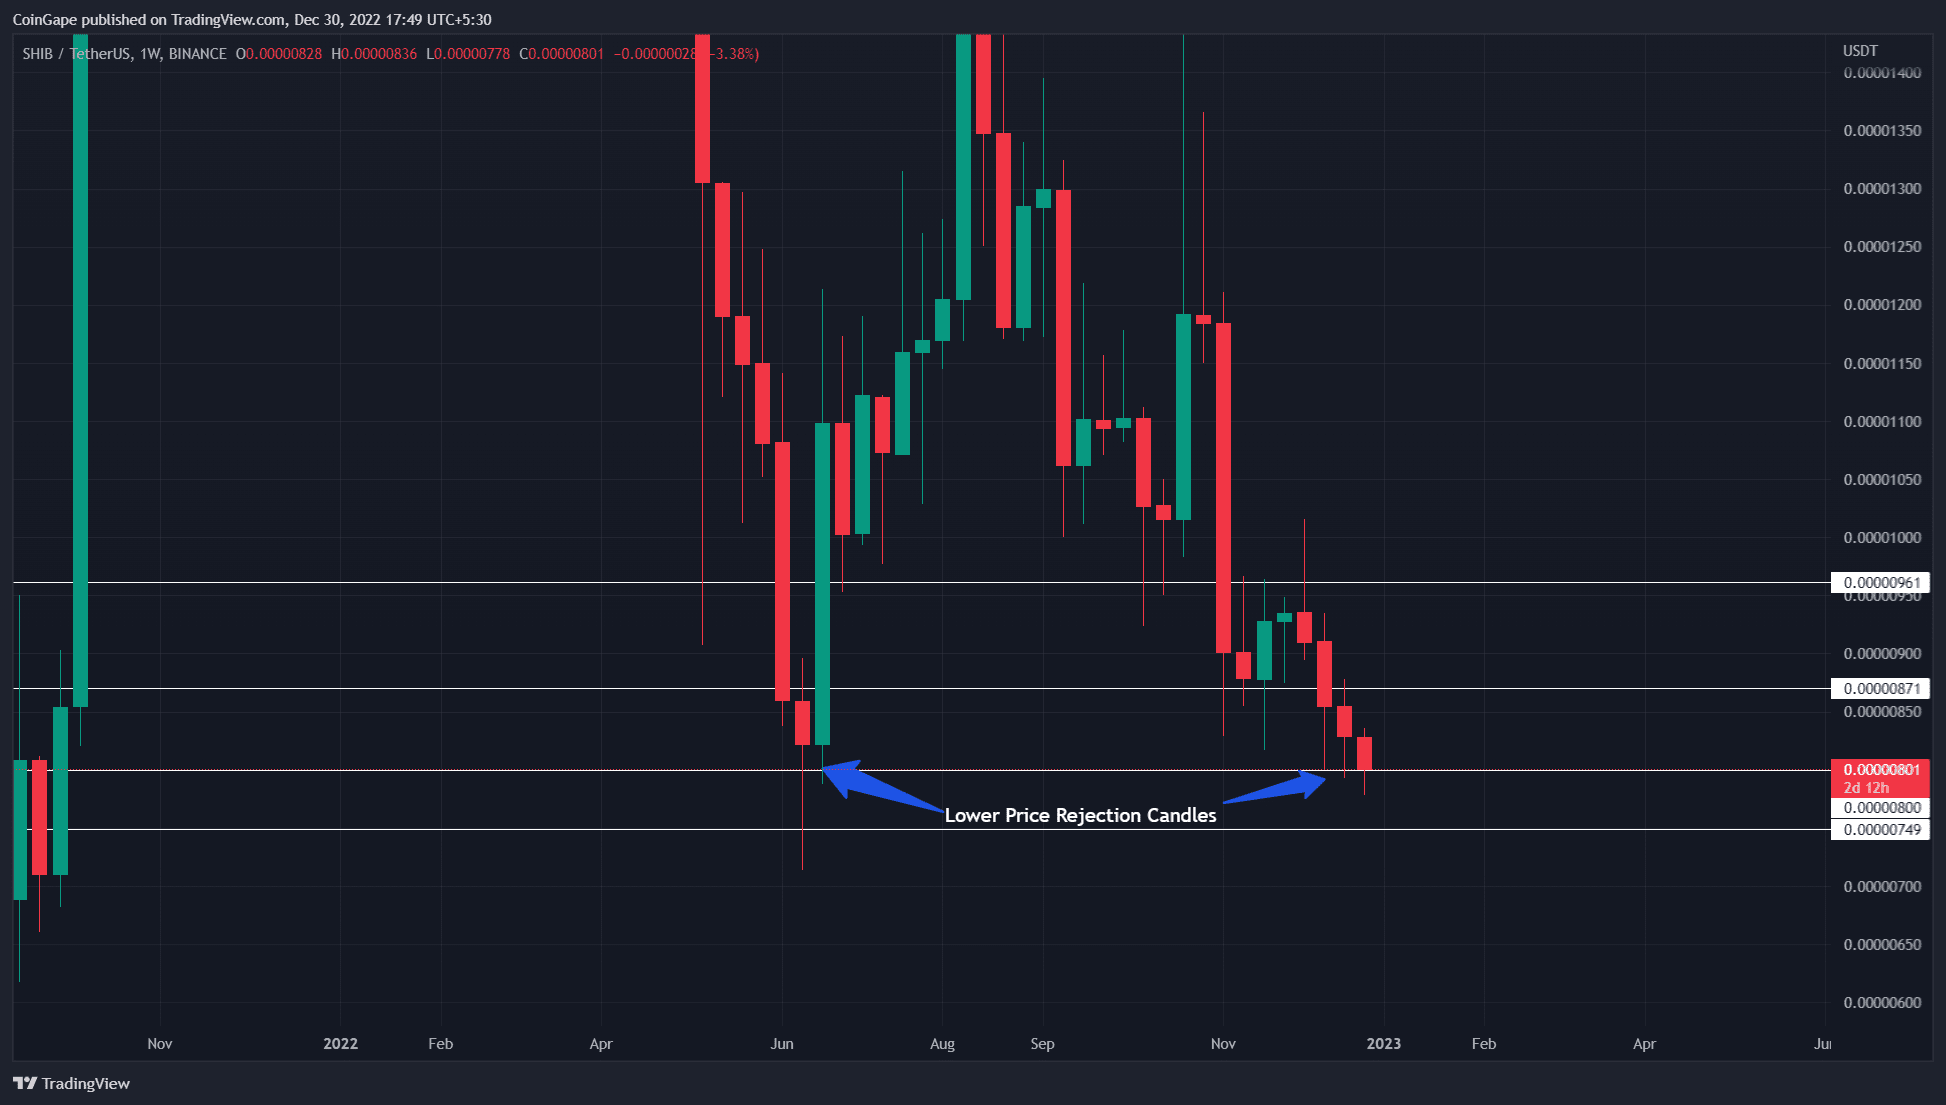 Source- Tradingview During June 2022, the Shiba Inu coin price showed a sharp bullish reversal from the $0.000008 support, which led to a 125% bull run to the $0.000018 mark. Moreover, over the past three weeks, this memecoin has three retested this support indicating the buyers are actively defending this level. In addition, the long lower price rejection wicks attached to the weekly candle accentuate the intense demand pressure at $0.000008. Thus, if the market condition improves, the SHIB price has a high possibility of rebounding from this level. Shiba Inu Coin Forms A Bullish pattern
  Source- Tradingview The last two months' downfall in Shib price Inu price has revealed the formation of a falling wedge pattern. In theory, this price action narrowing between two converging trendlines indicates the losing bearish momentum. The coin price gradually squeezing between the trendlines will soon provide a breakout opportunity. In ideal bullish conditions, an upside breakout from this resistance trendline will surge the prices 30% higher to $0.0000105. Also Read: Shiba Inu (SHIB) Price Soars 5%, Are Whales Buying Amid Shibarium Speculation Relative Strenght index The Relative Strenght index(RSI) indicates the strength of the recent price action. Concerning the lower low formation in SHIB price, the daily RSI slope rising higher indicate growth in underlying bullish momentum. Thus, a positive divergence between price action and indicator accentuates a higher possibility for a price rally. Current Price Action Amid the recent uncertainty in the crypto market, the SHIB price is plunged back to the pattern’s support trendline, hoping to replenish the bullish momentum. The possible reversal from this support trendline will drive the price 6% higher to rechallenge the overhead trendline.
Resistance Levels: $0.00000871 and $0.0000096
Support Levels: $0.000008 and $0.0000075