
#tokenprice
tokenprice
73,639 views
27 Discussing
Hot
Latest

There is a strong chance $B could rally all the way to the $1 milestone, following in the exact footsteps of $RIVER and $LAB ... 🚀
#Crypto #Altcoins #TokenPrice #CryptoCommunity #Bullish
{future}(BUSDT)
{future}(RIVERUSDT)
{future}(LABUSDT)
There is a strong chance $B could rally all the way to the $1 milestone, following in the exact footsteps of $RIVER and $LAB ... 🚀
#Crypto #Altcoins #TokenPrice #CryptoCommunity #Bullish
#Crypto #Altcoins #TokenPrice #CryptoCommunity #Bullish
159

·
--
ARB plunges below support.
Arbitrum breaks support – Is the recent ARB whale activity a lifeline or a trap?
The recent ARB whale activity may be a sign of a potential recovery, but traders are cautious as the token's price action suggests a deeper correction could be looming. A close below the current support level would confirm the bearish outlook. Traders are watching for a potential bounce or a further breakdown.
#Crypto #Arbitrum #WhaleActivity #TokenPrice
ARB plunges below support.
Arbitrum breaks support – Is the recent ARB whale activity a lifeline or a trap?
The recent ARB whale activity may be a sign of a potential recovery, but traders are cautious as the token's price action suggests a deeper correction could be looming. A close below the current support level would confirm the bearish outlook. Traders are watching for a potential bounce or a further breakdown.
#Crypto #Arbitrum #WhaleActivity #TokenPrice
Arbitrum breaks support – Is the recent ARB whale activity a lifeline or a trap?
The recent ARB whale activity may be a sign of a potential recovery, but traders are cautious as the token's price action suggests a deeper correction could be looming. A close below the current support level would confirm the bearish outlook. Traders are watching for a potential bounce or a further breakdown.
#Crypto #Arbitrum #WhaleActivity #TokenPrice
131

·
--
$FET AI BUBBLE EARLY WARNING TOKEN PRICE AND DOWNLOADS DECLINE 🔥
BCA Research strategists warn the AI investment cycle has entered overtime. The bubble is more visible in profit growth than valuations, with risk concentration expected around 2027.
The most actionable early signal right now is the decline in token prices combined with stagnating AI programming tool downloads. This shift suggests companies are moving from cutting-edge models toward cost control — a structural demand change. If the bubble bursts, equity markets could see a 30-50% correction.
Are you watching these four warning indicators in your AI token plays?
Not financial advice. Always manage your risk.
#FET #AIBubble #TokenPrice #MarketAnalysis #Crypto
🔥
$FET AI BUBBLE EARLY WARNING TOKEN PRICE AND DOWNLOADS DECLINE 🔥
BCA Research strategists warn the AI investment cycle has entered overtime. The bubble is more visible in profit growth than valuations, with risk concentration expected around 2027.
The most actionable early signal right now is the decline in token prices combined with stagnating AI programming tool downloads. This shift suggests companies are moving from cutting-edge models toward cost control — a structural demand change. If the bubble bursts, equity markets could see a 30-50% correction.
Are you watching these four warning indicators in your AI token plays?
Not financial advice. Always manage your risk.
#FET #AIBubble #TokenPrice #MarketAnalysis #Crypto
🔥
BCA Research strategists warn the AI investment cycle has entered overtime. The bubble is more visible in profit growth than valuations, with risk concentration expected around 2027.
The most actionable early signal right now is the decline in token prices combined with stagnating AI programming tool downloads. This shift suggests companies are moving from cutting-edge models toward cost control — a structural demand change. If the bubble bursts, equity markets could see a 30-50% correction.
Are you watching these four warning indicators in your AI token plays?
Not financial advice. Always manage your risk.
#FET #AIBubble #TokenPrice #MarketAnalysis #Crypto
🔥
164
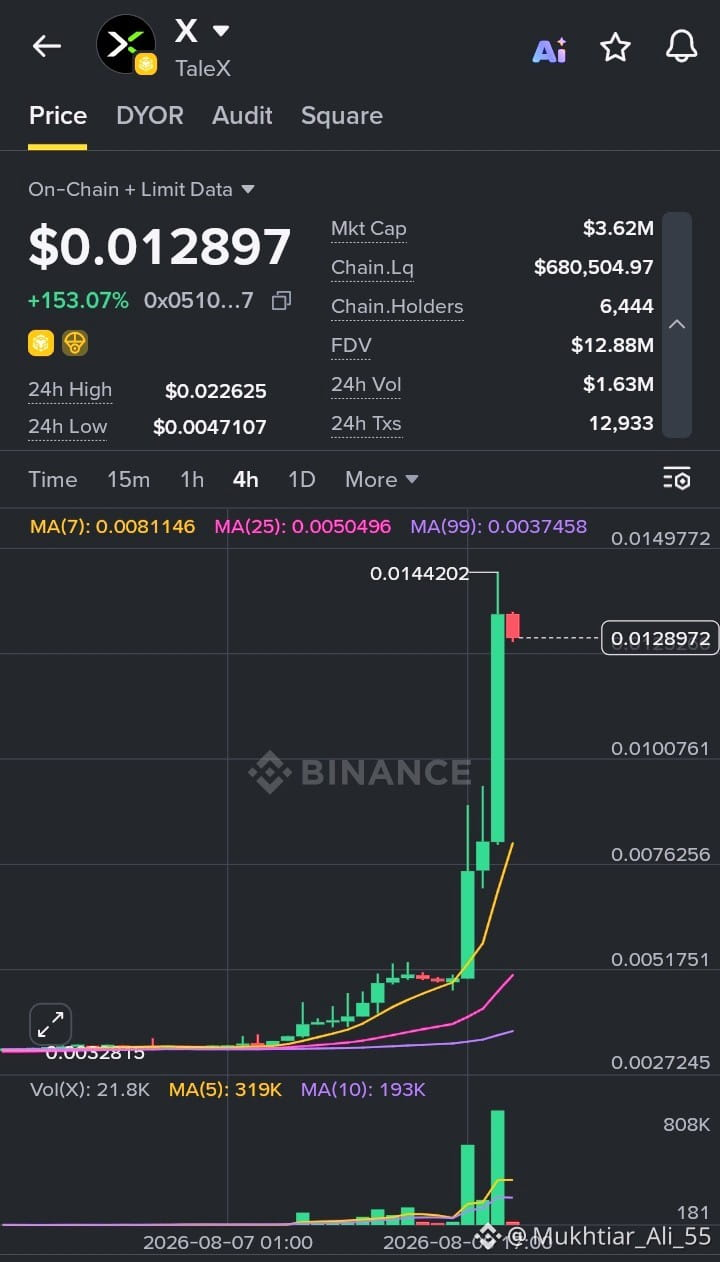
Massive Volatility: Token Skyrockets Over +150% in 24 Hours
The market just witnessed a parabolic breakout for this asset. The chart shows a dramatic price surge over the last 24 hours, taking it up an astonishing +153.07% to its current trading price of $0.012897.
This rally was marked by incredible volatility, with price swings ranging from a 24-hour low of $0.0047107 to a peak of $0.022625, indicating intense trader interest and dynamic price discovery.
Key performance indicators from this massive move:
📈 Current Price: $0.012897
📈 24h Change: +153.07%
📊 24h Trading Volume: $1.63 Million
🔒 Market Cap: $3.62 Million
👥 Holder Count: 6,444
🌊 On-Chain Liquidity: Over $680K
This level of price action is clearly visible on the 4-hour chart, with multiple large green candles signaling strong buying momentum that pushed the price well above the moving averages (MA 7, 25, 99). The significant spike in trading volume confirms that substantial capital has been flowing into this asset recently.
As always, with such parabolic moves and high volatility, caution is paramount. Remember to conduct your own due diligence before making any trading decisions based on these metrics.
#CryptoTrading #Altcoins #TechnicalAnalysis #TokenPrice #Volatility
$X
{alpha}(560x0510101ec6c49d24ed911f0011e22a0d697ee776)
Massive Volatility: Token Skyrockets Over +150% in 24 Hours
The market just witnessed a parabolic breakout for this asset. The chart shows a dramatic price surge over the last 24 hours, taking it up an astonishing +153.07% to its current trading price of $0.012897.
This rally was marked by incredible volatility, with price swings ranging from a 24-hour low of $0.0047107 to a peak of $0.022625, indicating intense trader interest and dynamic price discovery.
Key performance indicators from this massive move:
📈 Current Price: $0.012897
📈 24h Change: +153.07%
📊 24h Trading Volume: $1.63 Million
🔒 Market Cap: $3.62 Million
👥 Holder Count: 6,444
🌊 On-Chain Liquidity: Over $680K
This level of price action is clearly visible on the 4-hour chart, with multiple large green candles signaling strong buying momentum that pushed the price well above the moving averages (MA 7, 25, 99). The significant spike in trading volume confirms that substantial capital has been flowing into this asset recently.
As always, with such parabolic moves and high volatility, caution is paramount. Remember to conduct your own due diligence before making any trading decisions based on these metrics.
#CryptoTrading #Altcoins #TechnicalAnalysis #TokenPrice #Volatility
$X
The market just witnessed a parabolic breakout for this asset. The chart shows a dramatic price surge over the last 24 hours, taking it up an astonishing +153.07% to its current trading price of $0.012897.
This rally was marked by incredible volatility, with price swings ranging from a 24-hour low of $0.0047107 to a peak of $0.022625, indicating intense trader interest and dynamic price discovery.
Key performance indicators from this massive move:
📈 Current Price: $0.012897
📈 24h Change: +153.07%
📊 24h Trading Volume: $1.63 Million
🔒 Market Cap: $3.62 Million
👥 Holder Count: 6,444
🌊 On-Chain Liquidity: Over $680K
This level of price action is clearly visible on the 4-hour chart, with multiple large green candles signaling strong buying momentum that pushed the price well above the moving averages (MA 7, 25, 99). The significant spike in trading volume confirms that substantial capital has been flowing into this asset recently.
As always, with such parabolic moves and high volatility, caution is paramount. Remember to conduct your own due diligence before making any trading decisions based on these metrics.
#CryptoTrading #Altcoins #TechnicalAnalysis #TokenPrice #Volatility
$X
1
1
229
Log in to explore more content
Join global crypto users on Binance Square
⚡️ Get latest and useful information about crypto.
💬 Trusted by the world’s largest crypto exchange.
👍 Discover real insights from verified creators.
Email / Phone number
Trending Topics
1
#JobsReportRaisesHikeOdds
547,591 views
3,470 Discussing
2
#CPITestsDecemberRateOutlook
168,608 views
1,213 Discussing
3
#US Data Center Rules May Constrain AI Expansion
76,400 views
230 Discussing
4
#ARKPlans14ThematicETFsCoveringAIAndTokenizedMarkets
4,637 views
71 Discussing
5
#WillAnthropicListOnTime
167,572 views
1,430 Discussing
6
#WillUS-IranTensionsBoostSafe-HavenDemand?
78,420 views
562 Discussing
7
#BitcoinETFsSee$412MNetOutflows
16,597 views
78 Discussing
8
#HKSFCPlansToRestrictCryptoAndExchangeTerms
65,731 views
584 Discussing
9
#TradFiForBeginners
97,434 views
1,040 Discussing
10
#FinCENAndFedWithdraw$250CryptoTransferProposal
10,649 views
18 Discussing