
#priceactionanalysis
priceactionanalysis
482,034 views
892 Discussing
Hot
Latest

📊 $BTC
{future}(BTCUSDT)
Setup Update & Reality Check
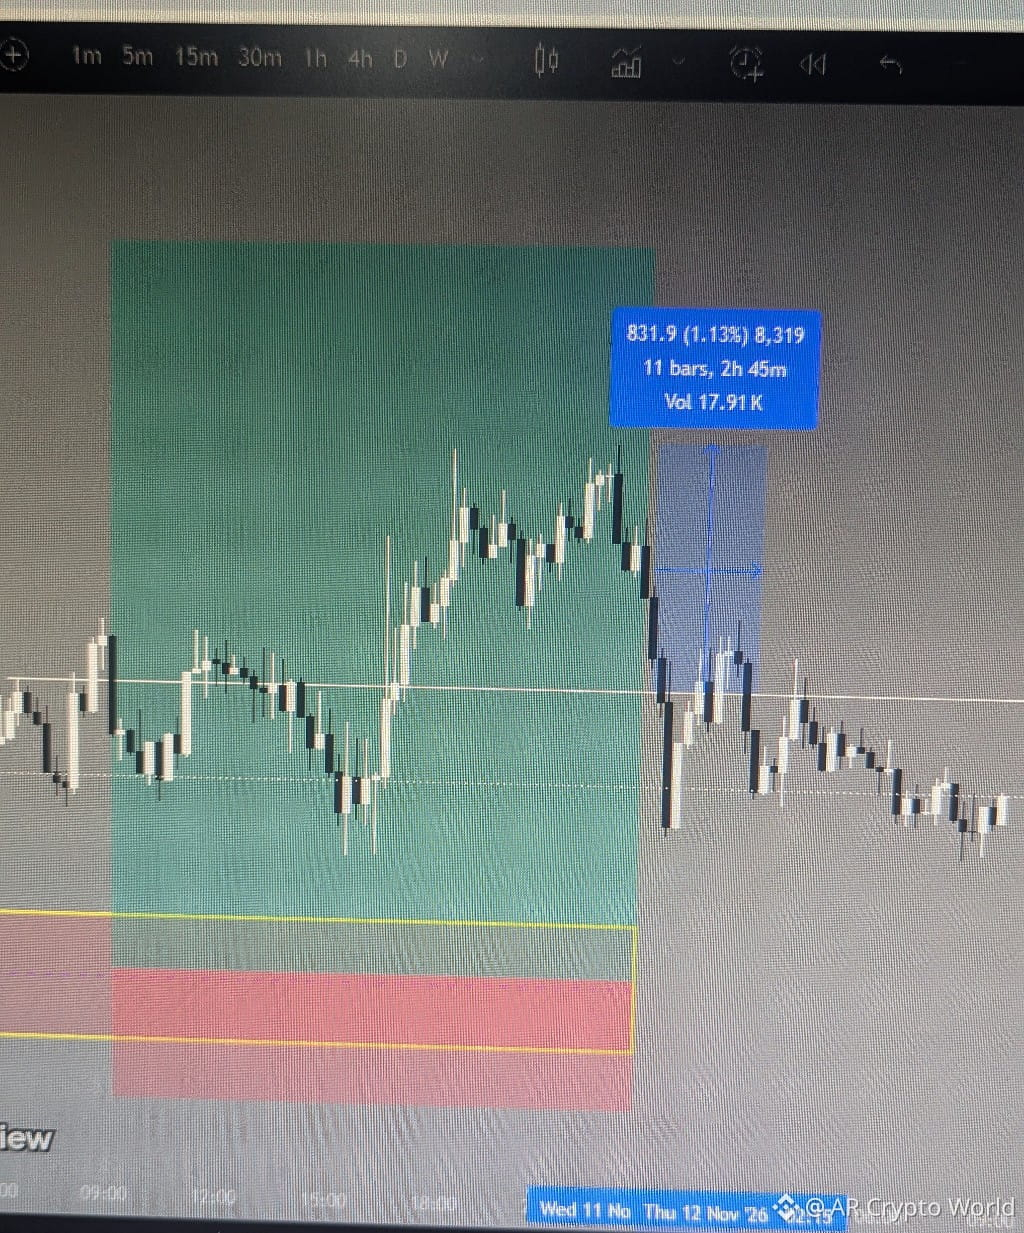
Yesterday’s $BTC analysis respected our directional bias moving +1.13% in our favor though it lacked the momentum to reach our final Take Profit target.
Managed my risk and closed the trade at Break-Even 🛡️
Always remember Nothing works 100% of the time in trading Anyone promising 100% accuracy is lying Protecting your capital comes first.
Daily setups & live updates 👉 Link in Bio 🔗
#BTC #Bitcoin #PriceActionAnalysis #RiskManagement
📊 $BTC
Setup Update & Reality Check
Yesterday’s $BTC analysis respected our directional bias moving +1.13% in our favor though it lacked the momentum to reach our final Take Profit target.
Managed my risk and closed the trade at Break-Even 🛡️
Always remember Nothing works 100% of the time in trading Anyone promising 100% accuracy is lying Protecting your capital comes first.
Daily setups & live updates 👉 Link in Bio 🔗
#BTC #Bitcoin #PriceActionAnalysis #RiskManagement
Setup Update & Reality Check
Yesterday’s $BTC analysis respected our directional bias moving +1.13% in our favor though it lacked the momentum to reach our final Take Profit target.
Managed my risk and closed the trade at Break-Even 🛡️
Always remember Nothing works 100% of the time in trading Anyone promising 100% accuracy is lying Protecting your capital comes first.
Daily setups & live updates 👉 Link in Bio 🔗
#BTC #Bitcoin #PriceActionAnalysis #RiskManagement
76

·
--
Bullish
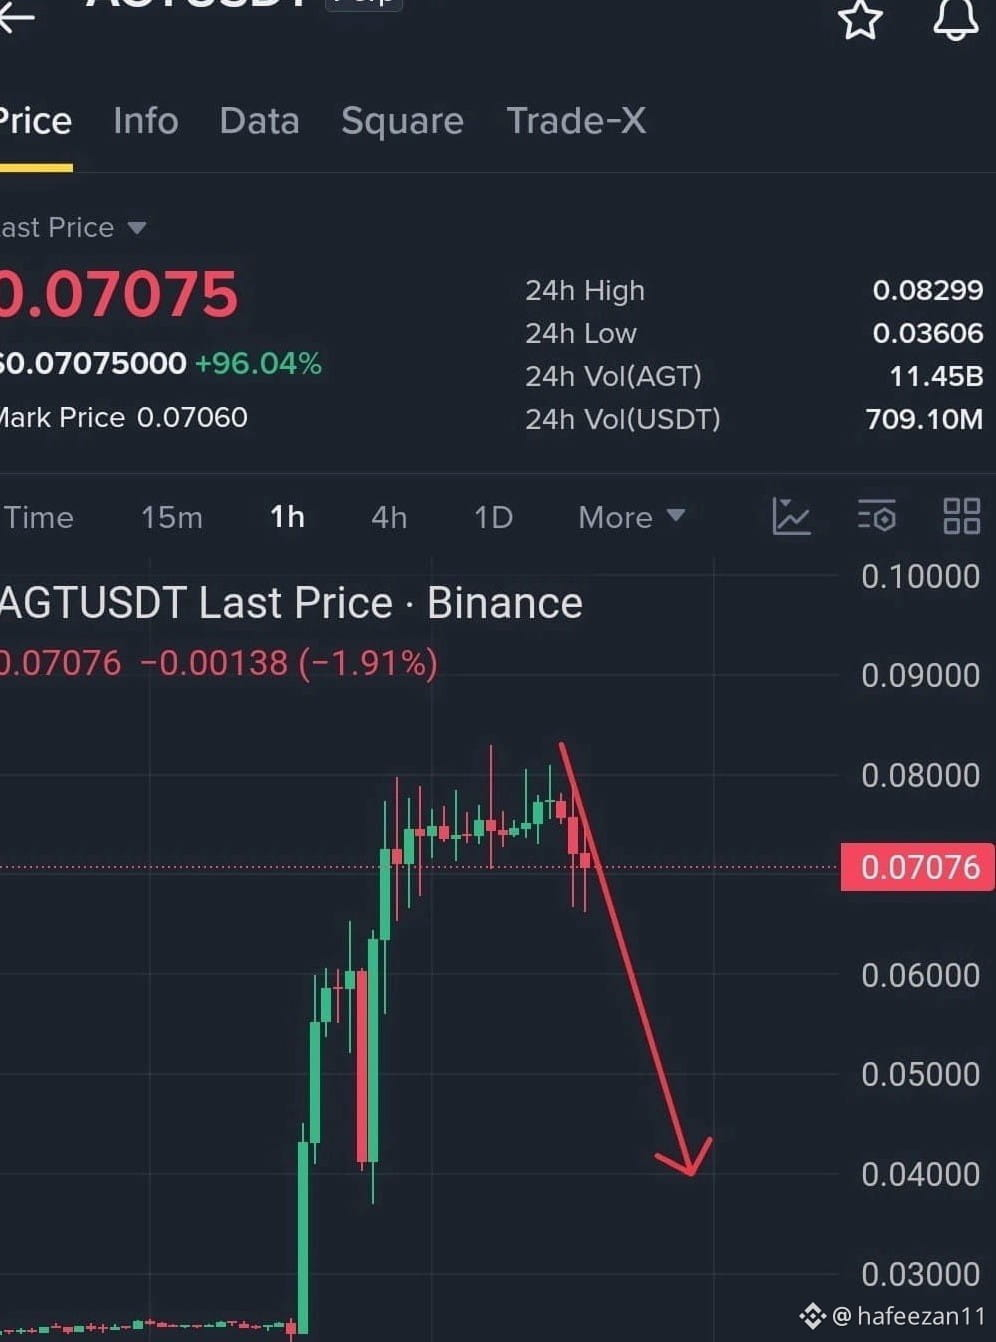
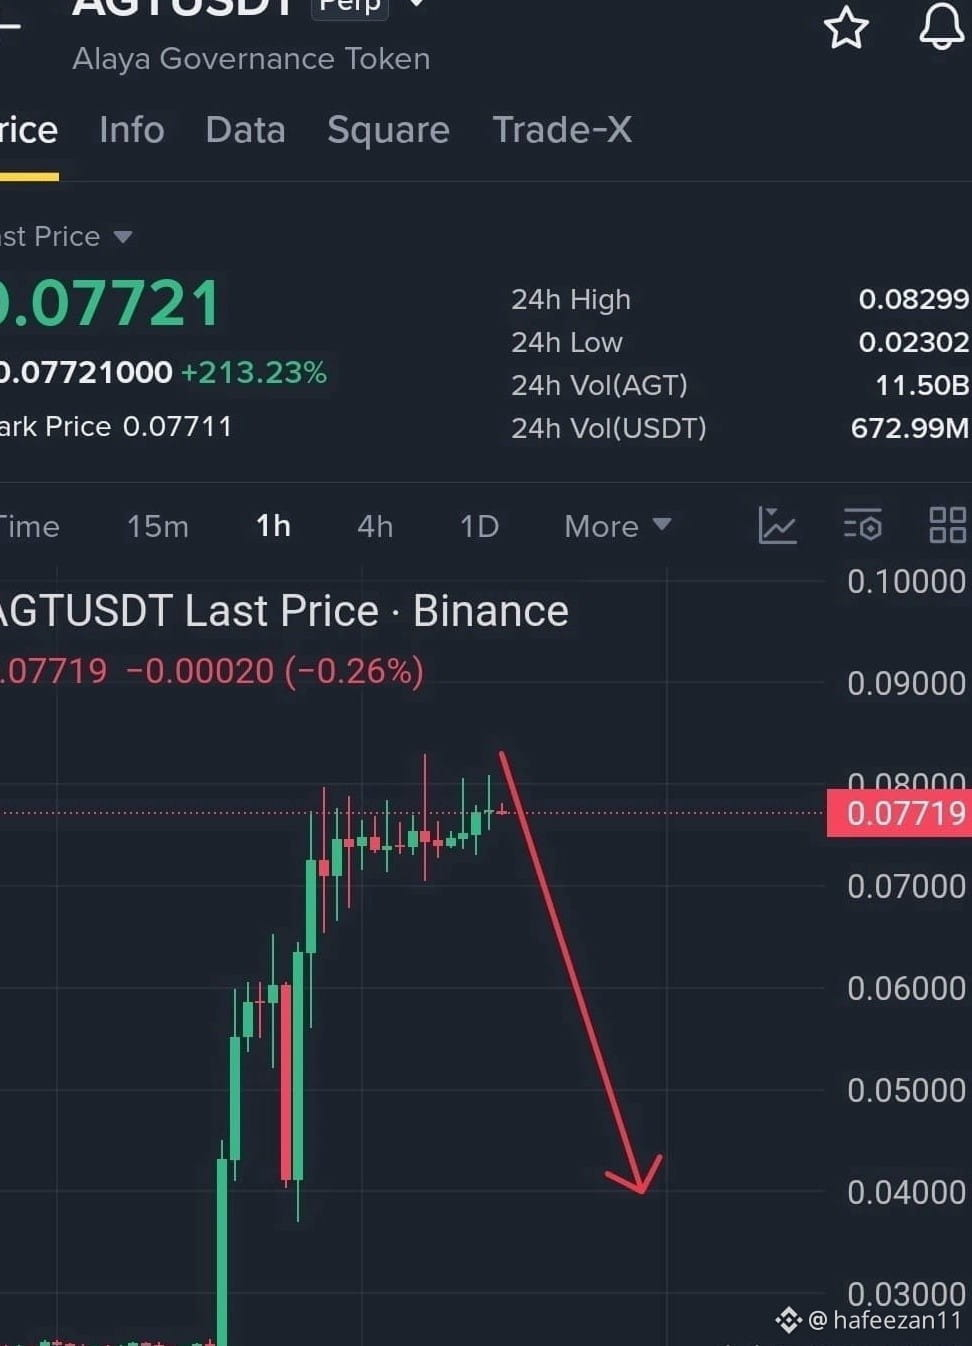
🎯 الهدف الثاني (TP2): 0.0500
🎯 الهدف الثالث (TP3): 0.0400
🛑 وقف الخسارة (SL): 0.0830
📊 التحليل الفني:
الارتفاع العمودي الذي سجلته عملة $AGT
{future}(AGTUSDT)
بنسبة 96% قد يكون قد جذب المشترين المتأخرين بالقرب من مناطق السيولة المرتفعة، قبل أن تبدأ ضغوط جني الأرباح بالظهور.
تُظهر حركة السوق تراجعًا ملحوظًا في الزخم الشرائي، بالتزامن مع ضعف أوامر الشراء عند المستويات الحالية، ما يزيد احتمالية حدوث تصحيح سعري باتجاه مناطق سعرية أدنى.
⚡ مؤشرات الزخم تُظهر علامات واضحة على الإرهاق الشرائي، وقد نشهد حركة تصحيحية قوية إذا استمر ضعف الطلب.
👀 السؤال الآن: هل ما زلت تحتفظ بصفقات الشراء على $AGT ، أم بدأت الاستعداد لاقتناص فرصة البيع مع التصحيح القادم؟
⚠️ هذا التحليل ليس نصيحة استثمارية. احرص دائمًا على إدارة المخاطر واستخدام وقف الخسارة.
#AGT #ShortSetup #SmartMoney #Crypto #PriceActionAnalysis #HuangRisksOusterOverReportedAffairWithSubordinate
🎯 الهدف الثاني (TP2): 0.0500
🎯 الهدف الثالث (TP3): 0.0400
🛑 وقف الخسارة (SL): 0.0830
📊 التحليل الفني:
الارتفاع العمودي الذي سجلته عملة $AGT
بنسبة 96% قد يكون قد جذب المشترين المتأخرين بالقرب من مناطق السيولة المرتفعة، قبل أن تبدأ ضغوط جني الأرباح بالظهور.
تُظهر حركة السوق تراجعًا ملحوظًا في الزخم الشرائي، بالتزامن مع ضعف أوامر الشراء عند المستويات الحالية، ما يزيد احتمالية حدوث تصحيح سعري باتجاه مناطق سعرية أدنى.
⚡ مؤشرات الزخم تُظهر علامات واضحة على الإرهاق الشرائي، وقد نشهد حركة تصحيحية قوية إذا استمر ضعف الطلب.
👀 السؤال الآن: هل ما زلت تحتفظ بصفقات الشراء على $AGT ، أم بدأت الاستعداد لاقتناص فرصة البيع مع التصحيح القادم؟
⚠️ هذا التحليل ليس نصيحة استثمارية. احرص دائمًا على إدارة المخاطر واستخدام وقف الخسارة.
#AGT #ShortSetup #SmartMoney #Crypto #PriceActionAnalysis #HuangRisksOusterOverReportedAffairWithSubordinate
🎯 الهدف الثالث (TP3): 0.0400
🛑 وقف الخسارة (SL): 0.0830
📊 التحليل الفني:
الارتفاع العمودي الذي سجلته عملة $AGT
بنسبة 96% قد يكون قد جذب المشترين المتأخرين بالقرب من مناطق السيولة المرتفعة، قبل أن تبدأ ضغوط جني الأرباح بالظهور.
تُظهر حركة السوق تراجعًا ملحوظًا في الزخم الشرائي، بالتزامن مع ضعف أوامر الشراء عند المستويات الحالية، ما يزيد احتمالية حدوث تصحيح سعري باتجاه مناطق سعرية أدنى.
⚡ مؤشرات الزخم تُظهر علامات واضحة على الإرهاق الشرائي، وقد نشهد حركة تصحيحية قوية إذا استمر ضعف الطلب.
👀 السؤال الآن: هل ما زلت تحتفظ بصفقات الشراء على $AGT ، أم بدأت الاستعداد لاقتناص فرصة البيع مع التصحيح القادم؟
⚠️ هذا التحليل ليس نصيحة استثمارية. احرص دائمًا على إدارة المخاطر واستخدام وقف الخسارة.
#AGT #ShortSetup #SmartMoney #Crypto #PriceActionAnalysis #HuangRisksOusterOverReportedAffairWithSubordinate
5

·
--
$HOT
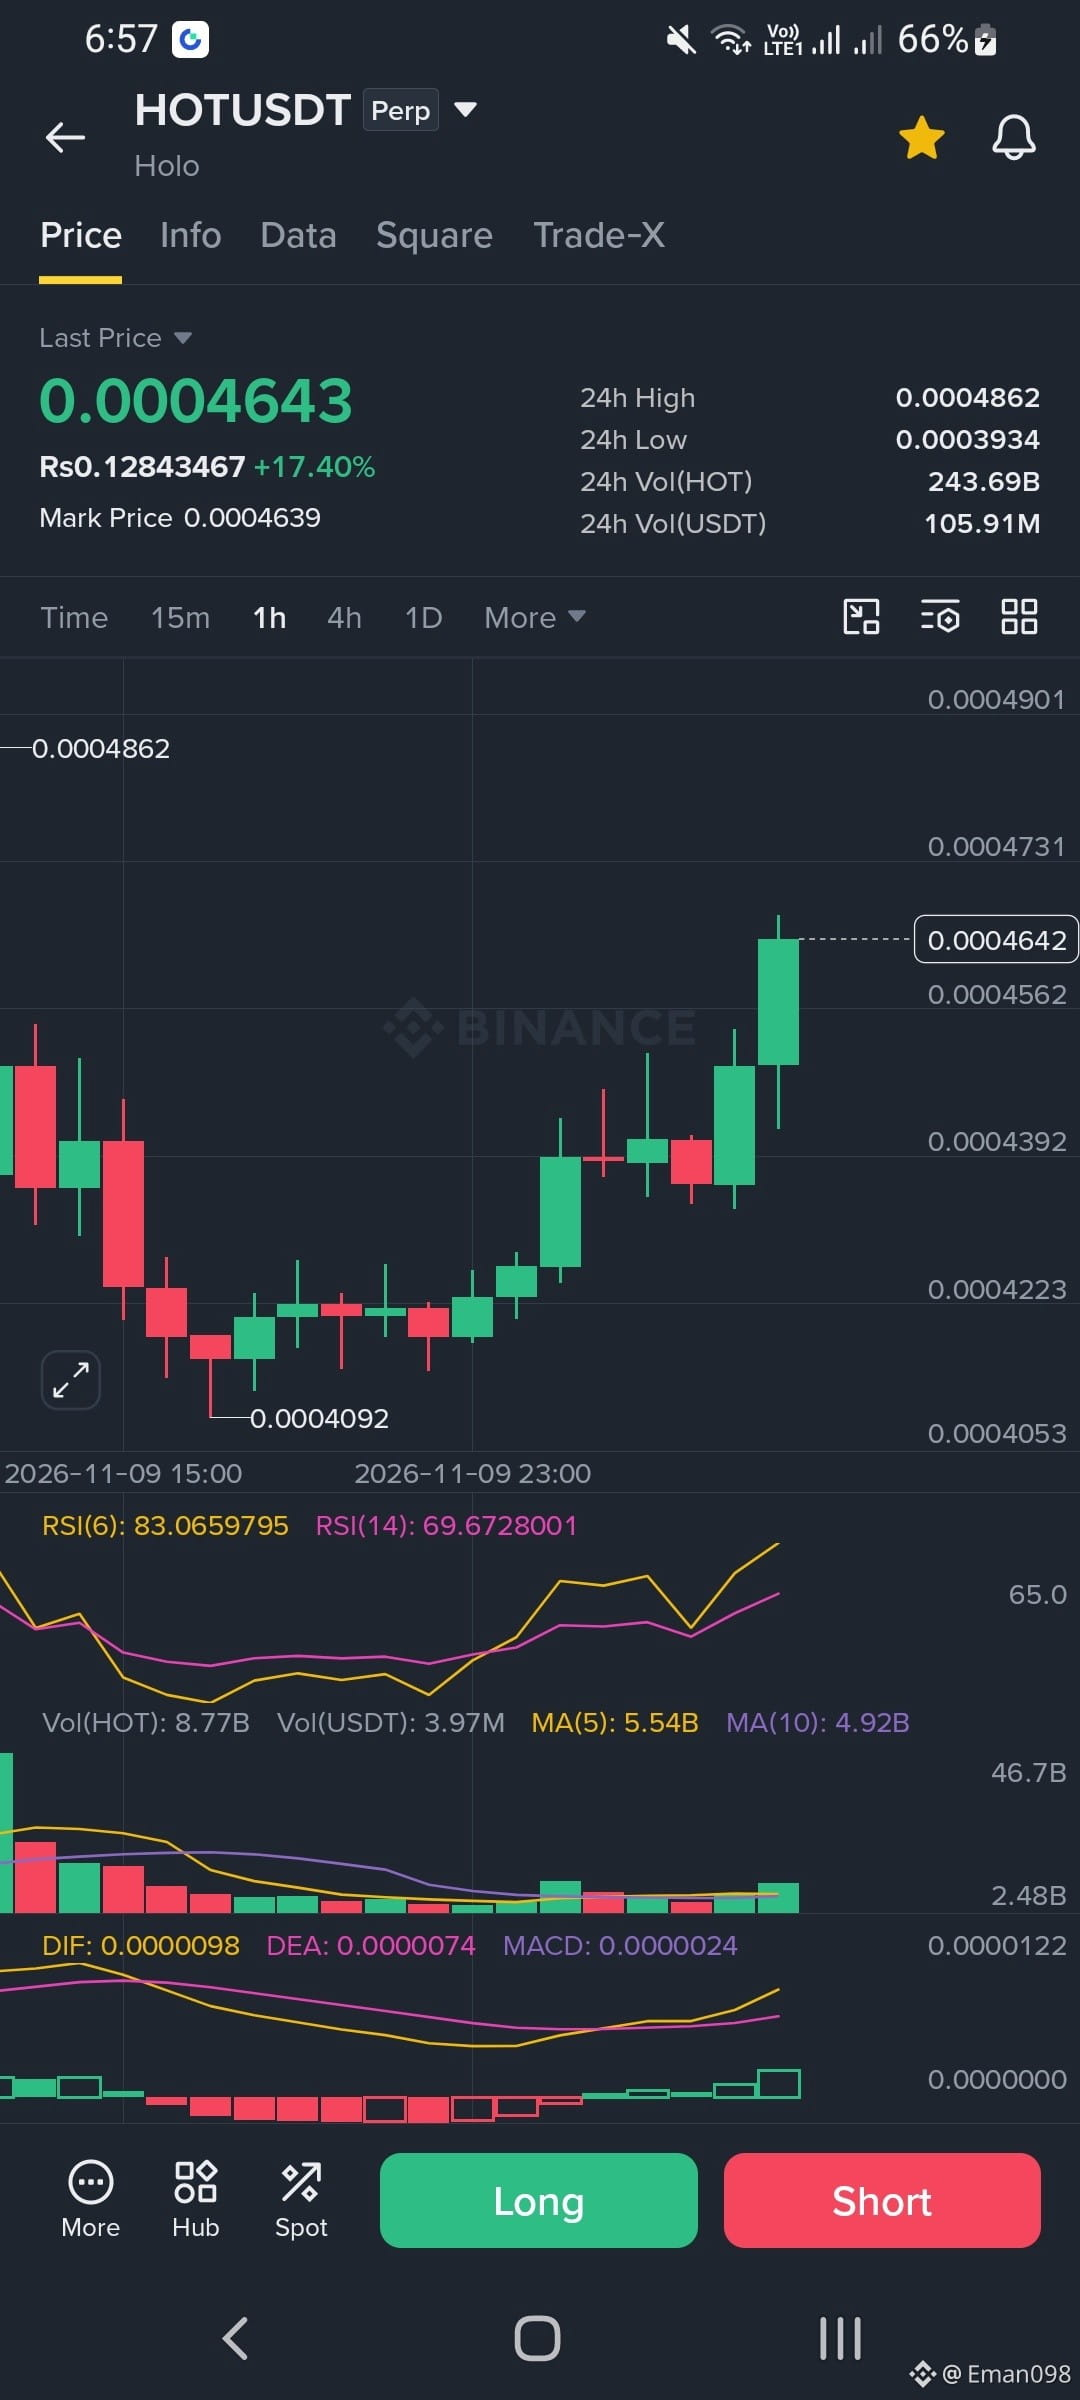
is bouncing hard right now. Price sits near 0.000464 and it is up 17 percent on the day. The last few green candles are strong and the 1h chart shows a clean recovery from the low at 0.000409. MACD just flipped bullish and volume is picking up a little. But RSI(6) is above 83 so the move looks stretched. A small pullback would not surprise me.
Support levels
First support is 0.000456. Next is 0.000439 where price broke out earlier. The big one is 0.000409 which is the recent low.
Resistance levels
First resistance is 0.000473. Then 0.000486 which is the 24h high. A close above that opens the way higher.
My view is simple. Trend is up but do not chase this candle. Wait for a dip to support or a clean break above the high. Keep your stop tight. This is not financial advice. Stay safe.
#CPITestsDecemberRateOutlook #AIChipSlumpNasdaq #PriceActionAnalysis
$HOT
is bouncing hard right now. Price sits near 0.000464 and it is up 17 percent on the day. The last few green candles are strong and the 1h chart shows a clean recovery from the low at 0.000409. MACD just flipped bullish and volume is picking up a little. But RSI(6) is above 83 so the move looks stretched. A small pullback would not surprise me.
Support levels
First support is 0.000456. Next is 0.000439 where price broke out earlier. The big one is 0.000409 which is the recent low.
Resistance levels
First resistance is 0.000473. Then 0.000486 which is the 24h high. A close above that opens the way higher.
My view is simple. Trend is up but do not chase this candle. Wait for a dip to support or a clean break above the high. Keep your stop tight. This is not financial advice. Stay safe.
#CPITestsDecemberRateOutlook #AIChipSlumpNasdaq #PriceActionAnalysis
is bouncing hard right now. Price sits near 0.000464 and it is up 17 percent on the day. The last few green candles are strong and the 1h chart shows a clean recovery from the low at 0.000409. MACD just flipped bullish and volume is picking up a little. But RSI(6) is above 83 so the move looks stretched. A small pullback would not surprise me.
Support levels
First support is 0.000456. Next is 0.000439 where price broke out earlier. The big one is 0.000409 which is the recent low.
Resistance levels
First resistance is 0.000473. Then 0.000486 which is the 24h high. A close above that opens the way higher.
My view is simple. Trend is up but do not chase this candle. Wait for a dip to support or a clean break above the high. Keep your stop tight. This is not financial advice. Stay safe.
#CPITestsDecemberRateOutlook #AIChipSlumpNasdaq #PriceActionAnalysis
4
233

·
--
Bearish
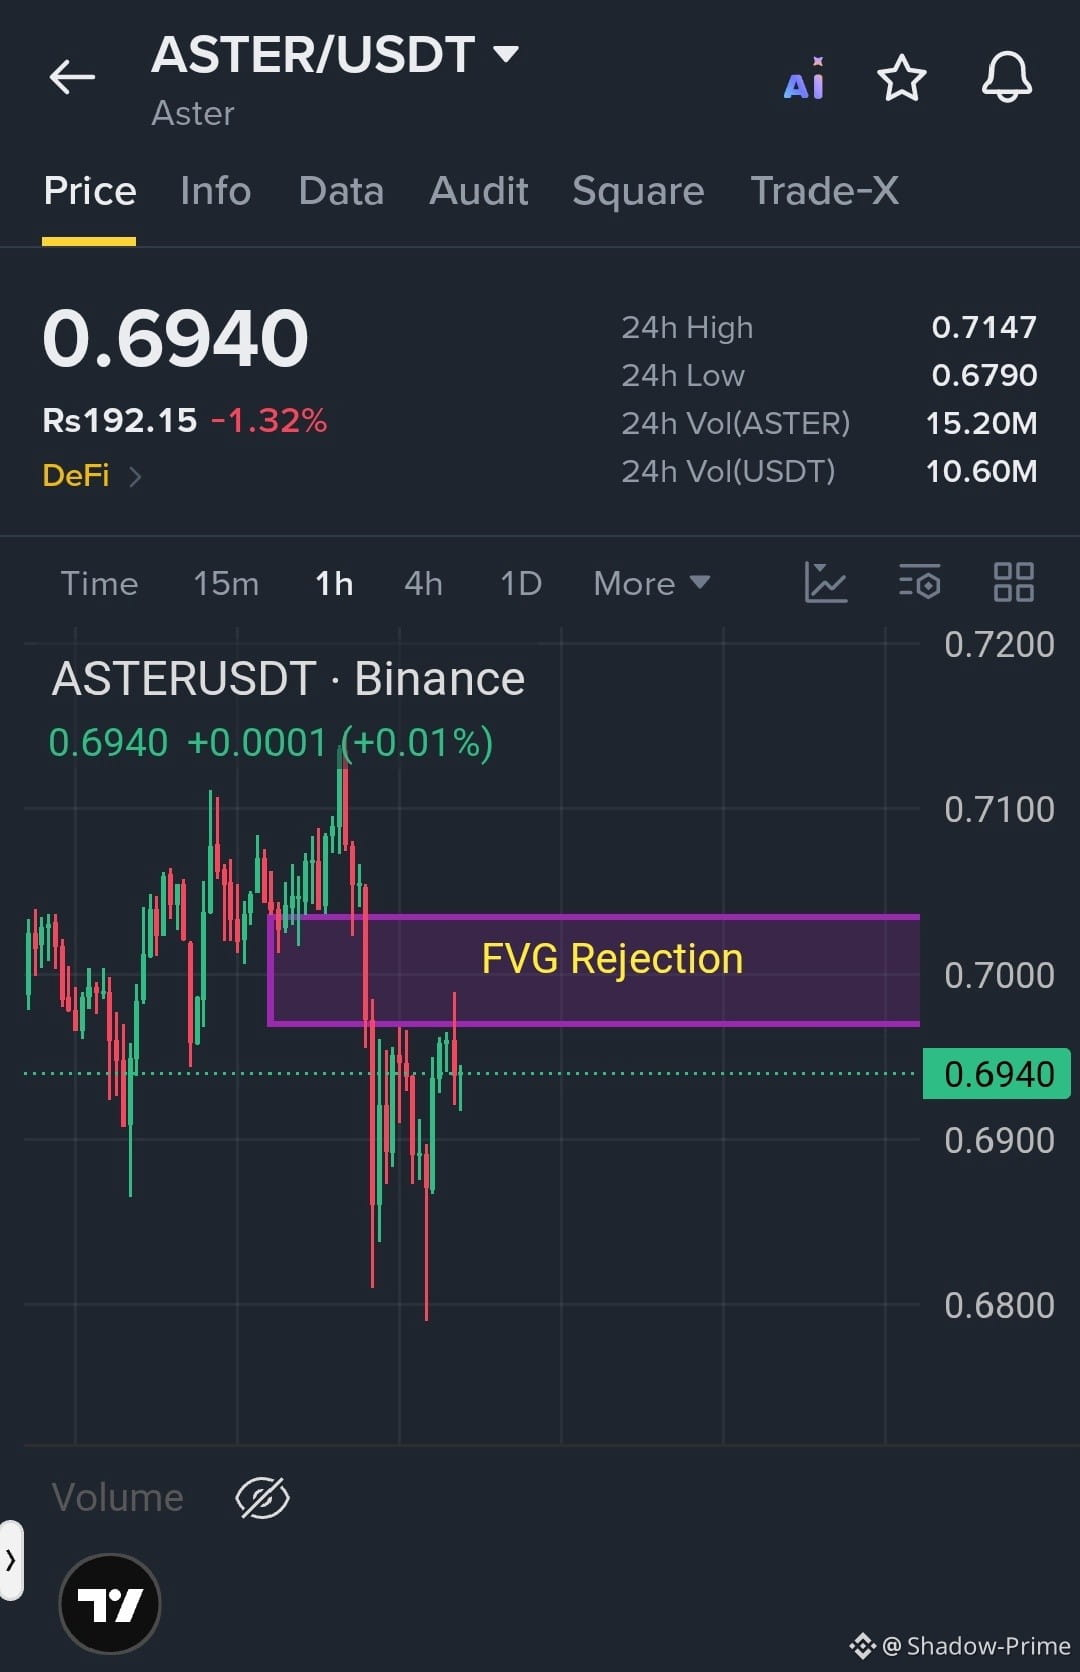
🔴 $ASTER – Bearish Opportunity!
ASTER is showing rejection from the 1H Fair Value Gap (FVG) zone around $0.6970–$0.7040.
My Market Opinion: The price failed to sustain above the FVG zone, suggesting sellers are still defending this area. The order book also currently shows stronger sell-side pressure.
📍 Potential Short Entry: $0.6970 – $0.7000 (wait for rejection)
🎯 TP1: $0.6900 🎯 TP2: $0.6850 🎯 TP3: $0.6800
🛑 SL: $0.7060
Important: Don't chase the price. Wait for a proper retest and bearish confirmation before entering. If price breaks and holds above the FVG, this bearish setup becomes invalid.
Trade with patience. Risk management always comes first.
Follow me for more market analysis.
#ASTERUSDT #cryptotrading #PriceActionAnalysis #FVGRejection
{future}(ASTERUSDT)
🔴 $ASTER – Bearish Opportunity!
ASTER is showing rejection from the 1H Fair Value Gap (FVG) zone around $0.6970–$0.7040.
My Market Opinion: The price failed to sustain above the FVG zone, suggesting sellers are still defending this area. The order book also currently shows stronger sell-side pressure.
📍 Potential Short Entry: $0.6970 – $0.7000 (wait for rejection)
🎯 TP1: $0.6900 🎯 TP2: $0.6850 🎯 TP3: $0.6800
🛑 SL: $0.7060
Important: Don't chase the price. Wait for a proper retest and bearish confirmation before entering. If price breaks and holds above the FVG, this bearish setup becomes invalid.
Trade with patience. Risk management always comes first.
Follow me for more market analysis.
#ASTERUSDT #cryptotrading #PriceActionAnalysis #FVGRejection
ASTER is showing rejection from the 1H Fair Value Gap (FVG) zone around $0.6970–$0.7040.
My Market Opinion: The price failed to sustain above the FVG zone, suggesting sellers are still defending this area. The order book also currently shows stronger sell-side pressure.
📍 Potential Short Entry: $0.6970 – $0.7000 (wait for rejection)
🎯 TP1: $0.6900 🎯 TP2: $0.6850 🎯 TP3: $0.6800
🛑 SL: $0.7060
Important: Don't chase the price. Wait for a proper retest and bearish confirmation before entering. If price breaks and holds above the FVG, this bearish setup becomes invalid.
Trade with patience. Risk management always comes first.
Follow me for more market analysis.
#ASTERUSDT #cryptotrading #PriceActionAnalysis #FVGRejection
1
303

·
--
Bullish
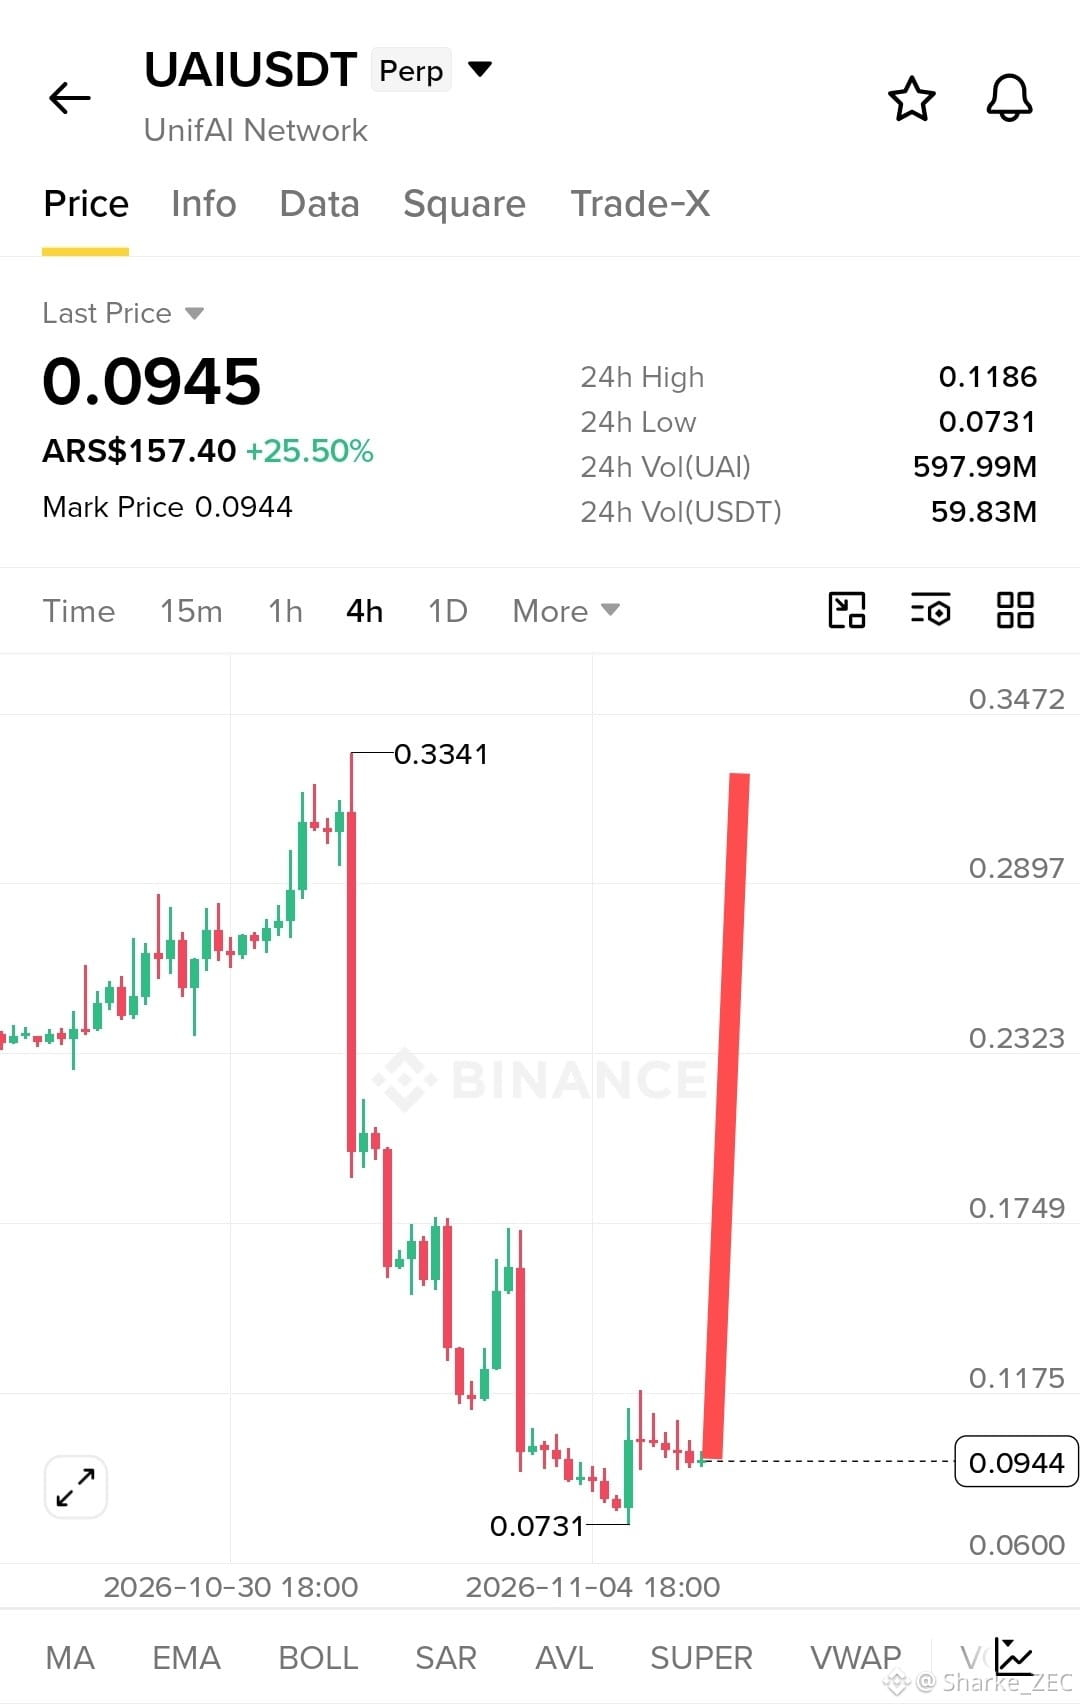
$UAI After a downtrend, it backed off with a green candle.
The chart says the coin will go higher.
I opened long
entry : 0.0947
tp : 0.1573
sl : 0.0864
ready big candle coming
#PriceActionAnalysis #TtadersLeague #Analisys
$UAI After a downtrend, it backed off with a green candle.
The chart says the coin will go higher.
I opened long
entry : 0.0947
tp : 0.1573
sl : 0.0864
ready big candle coming
#PriceActionAnalysis #TtadersLeague #Analisys
The chart says the coin will go higher.
I opened long
entry : 0.0947
tp : 0.1573
sl : 0.0864
ready big candle coming
#PriceActionAnalysis #TtadersLeague #Analisys
121

·
--
Bullish
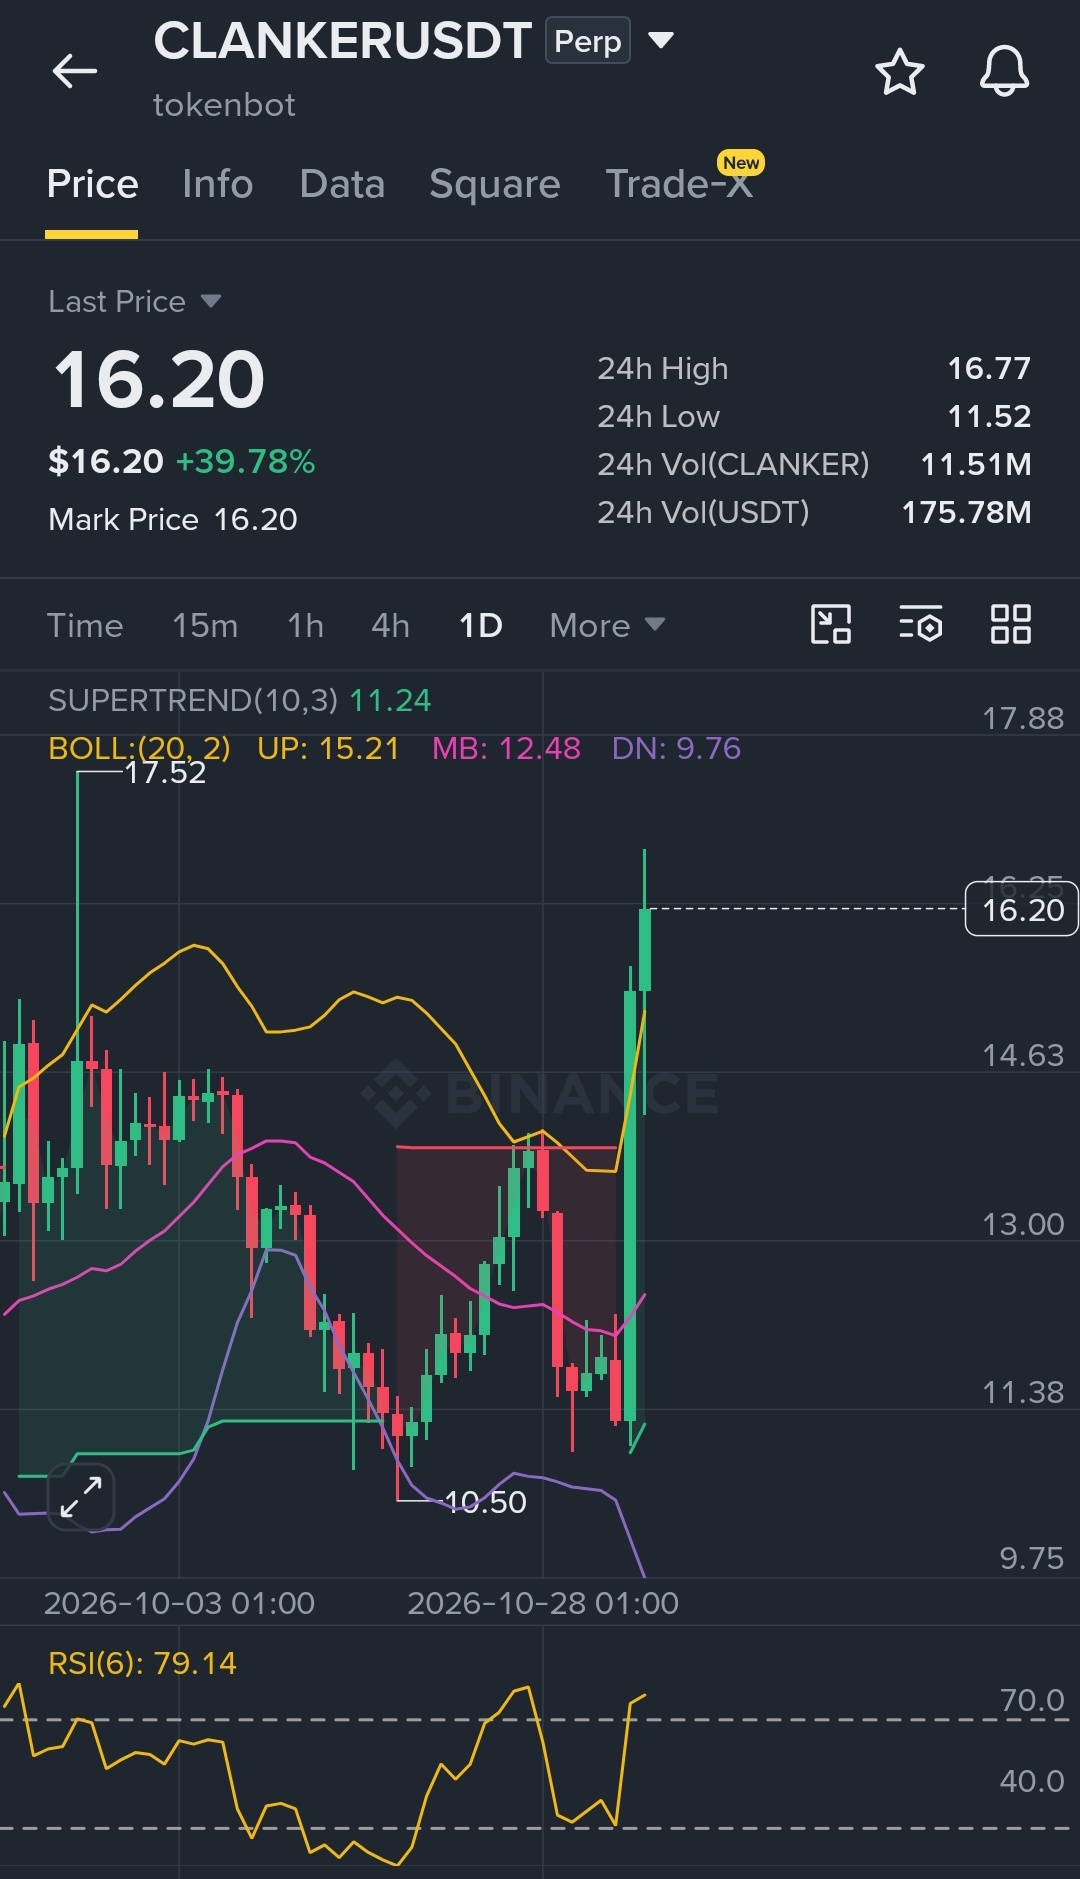
🟢 $CLANKER LONG TRADE IS DELIVERING!
What a move! Riding the rally from $12.30 to $16.74 as buyers push through resistance. 💥
The next level I'm watching is $20. If bullish momentum holds, could that be the next stop? 🎯
But here's where things get interesting, if you check the chart you'd see that
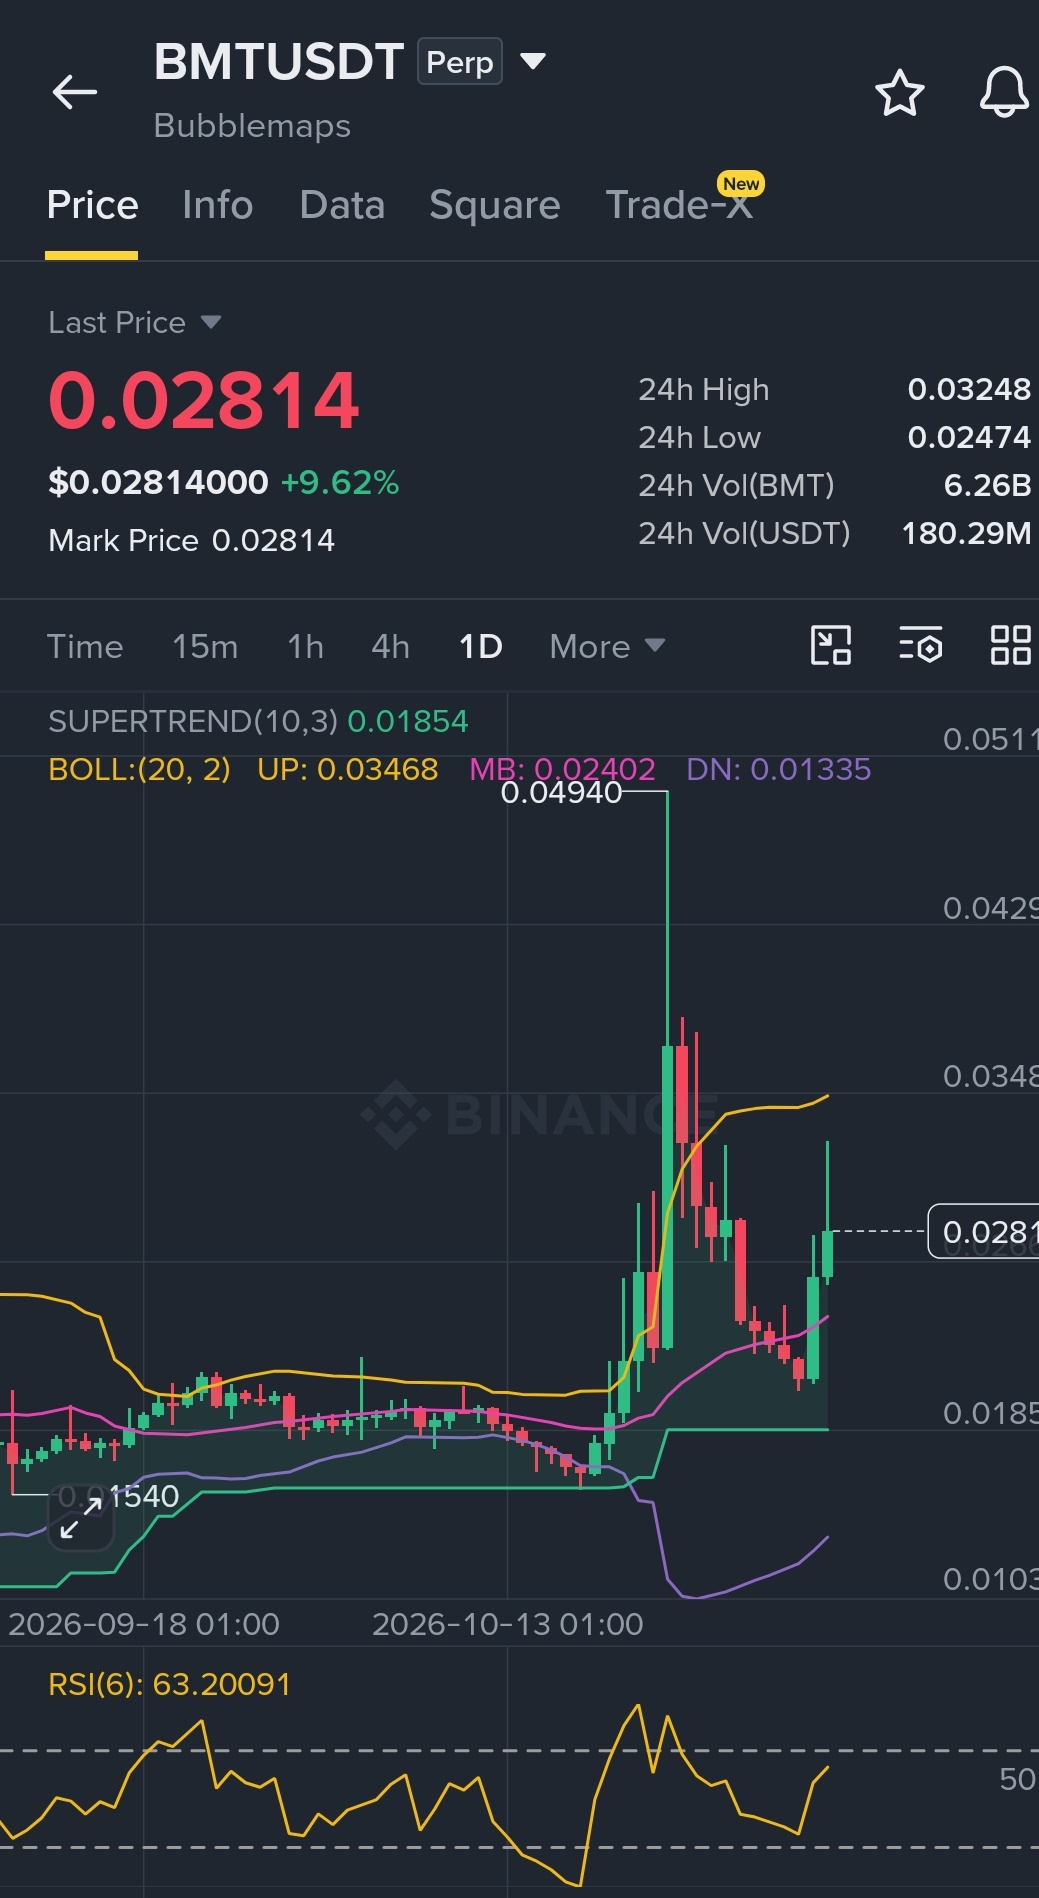
👀 $BMT is showing a similar pattern to CLANKER, while $HOT is telling a completely different story.
Three coins, three different setups.
Like 👍 Follow and share which chart looks most promising to you right now?
#PriceActionAnalysis
{future}(CLANKERUSDT)
{future}(BMTUSDT)
{future}(HOTUSDT)
🟢 $CLANKER LONG TRADE IS DELIVERING!
What a move! Riding the rally from $12.30 to $16.74 as buyers push through resistance. 💥
The next level I'm watching is $20. If bullish momentum holds, could that be the next stop? 🎯
But here's where things get interesting, if you check the chart you'd see that
👀 $BMT is showing a similar pattern to CLANKER, while $HOT is telling a completely different story.
Three coins, three different setups.
Like 👍 Follow and share which chart looks most promising to you right now?
#PriceActionAnalysis
What a move! Riding the rally from $12.30 to $16.74 as buyers push through resistance. 💥
The next level I'm watching is $20. If bullish momentum holds, could that be the next stop? 🎯
But here's where things get interesting, if you check the chart you'd see that
👀 $BMT is showing a similar pattern to CLANKER, while $HOT is telling a completely different story.
Three coins, three different setups.
Like 👍 Follow and share which chart looks most promising to you right now?
#PriceActionAnalysis
1
1
64
·
--
30D trade $NIL 2.2K USDT
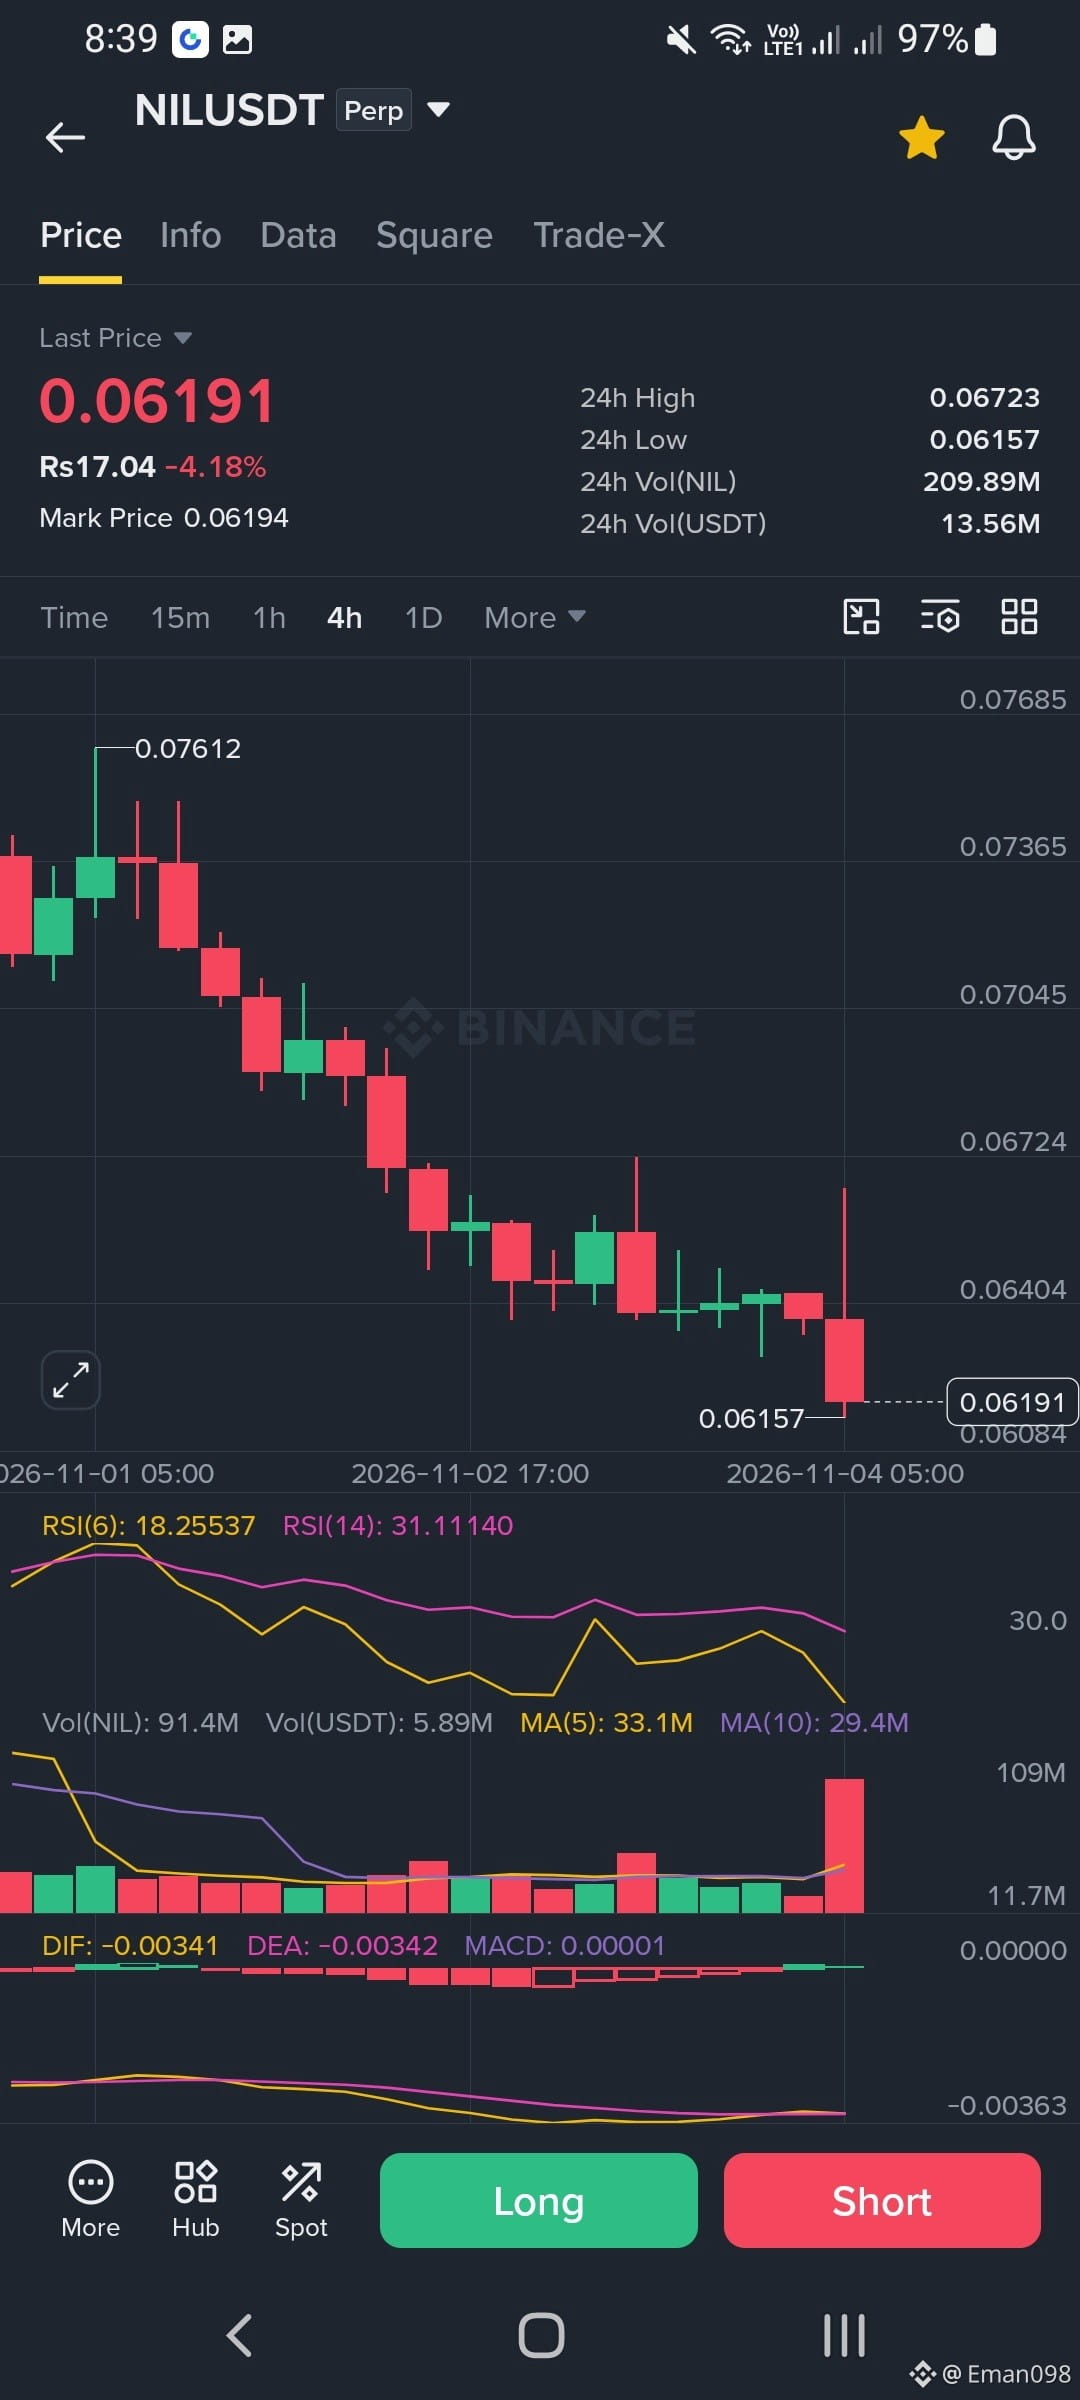
NILUSDT is in a clear downtrend on the 4h chart. Price fell from 0.07612 to 0.06191 with mostly red candles and lower highs. The latest candle is a big red one with strong volume, and the long wick above shows sellers pushed price down hard.
RSI(6) is at 18 and RSI(14) is near 31, so the coin is oversold. A small bounce can happen, but I would not call it a reversal yet. MACD is flat below zero, which means momentum is still weak.
Best levels:
Support is 0.06157 first, then 0.06084 below it.
Resistance is 0.06404 first, then 0.06724.
A long needs a 4h close above 0.06404. A short looks better only if price closes under 0.06157. Keep your stop loss tight because this is a risky perp trade.
$NIL
#PriceActionAnalysis #Market_Update
NILUSDT is in a clear downtrend on the 4h chart. Price fell from 0.07612 to 0.06191 with mostly red candles and lower highs. The latest candle is a big red one with strong volume, and the long wick above shows sellers pushed price down hard.
RSI(6) is at 18 and RSI(14) is near 31, so the coin is oversold. A small bounce can happen, but I would not call it a reversal yet. MACD is flat below zero, which means momentum is still weak.
Best levels:
Support is 0.06157 first, then 0.06084 below it.
Resistance is 0.06404 first, then 0.06724.
A long needs a 4h close above 0.06404. A short looks better only if price closes under 0.06157. Keep your stop loss tight because this is a risky perp trade.
$NIL
#PriceActionAnalysis #Market_Update
RSI(6) is at 18 and RSI(14) is near 31, so the coin is oversold. A small bounce can happen, but I would not call it a reversal yet. MACD is flat below zero, which means momentum is still weak.
Best levels:
Support is 0.06157 first, then 0.06084 below it.
Resistance is 0.06404 first, then 0.06724.
A long needs a 4h close above 0.06404. A short looks better only if price closes under 0.06157. Keep your stop loss tight because this is a risky perp trade.
$NIL
#PriceActionAnalysis #Market_Update
6
410
·
--
Bullish
🚀 MARKET MOMENTUM CAN LIFT PROJECTS, BUT THE CHARTS STILL MATTER!
$PARTI is attracting attention, and its backing capital is one of the reasons I'm watching it. With the broader market showing bullish strength, there's room for projects with solid support to gain momentum.
But not every chart is moving in the same direction. 👀
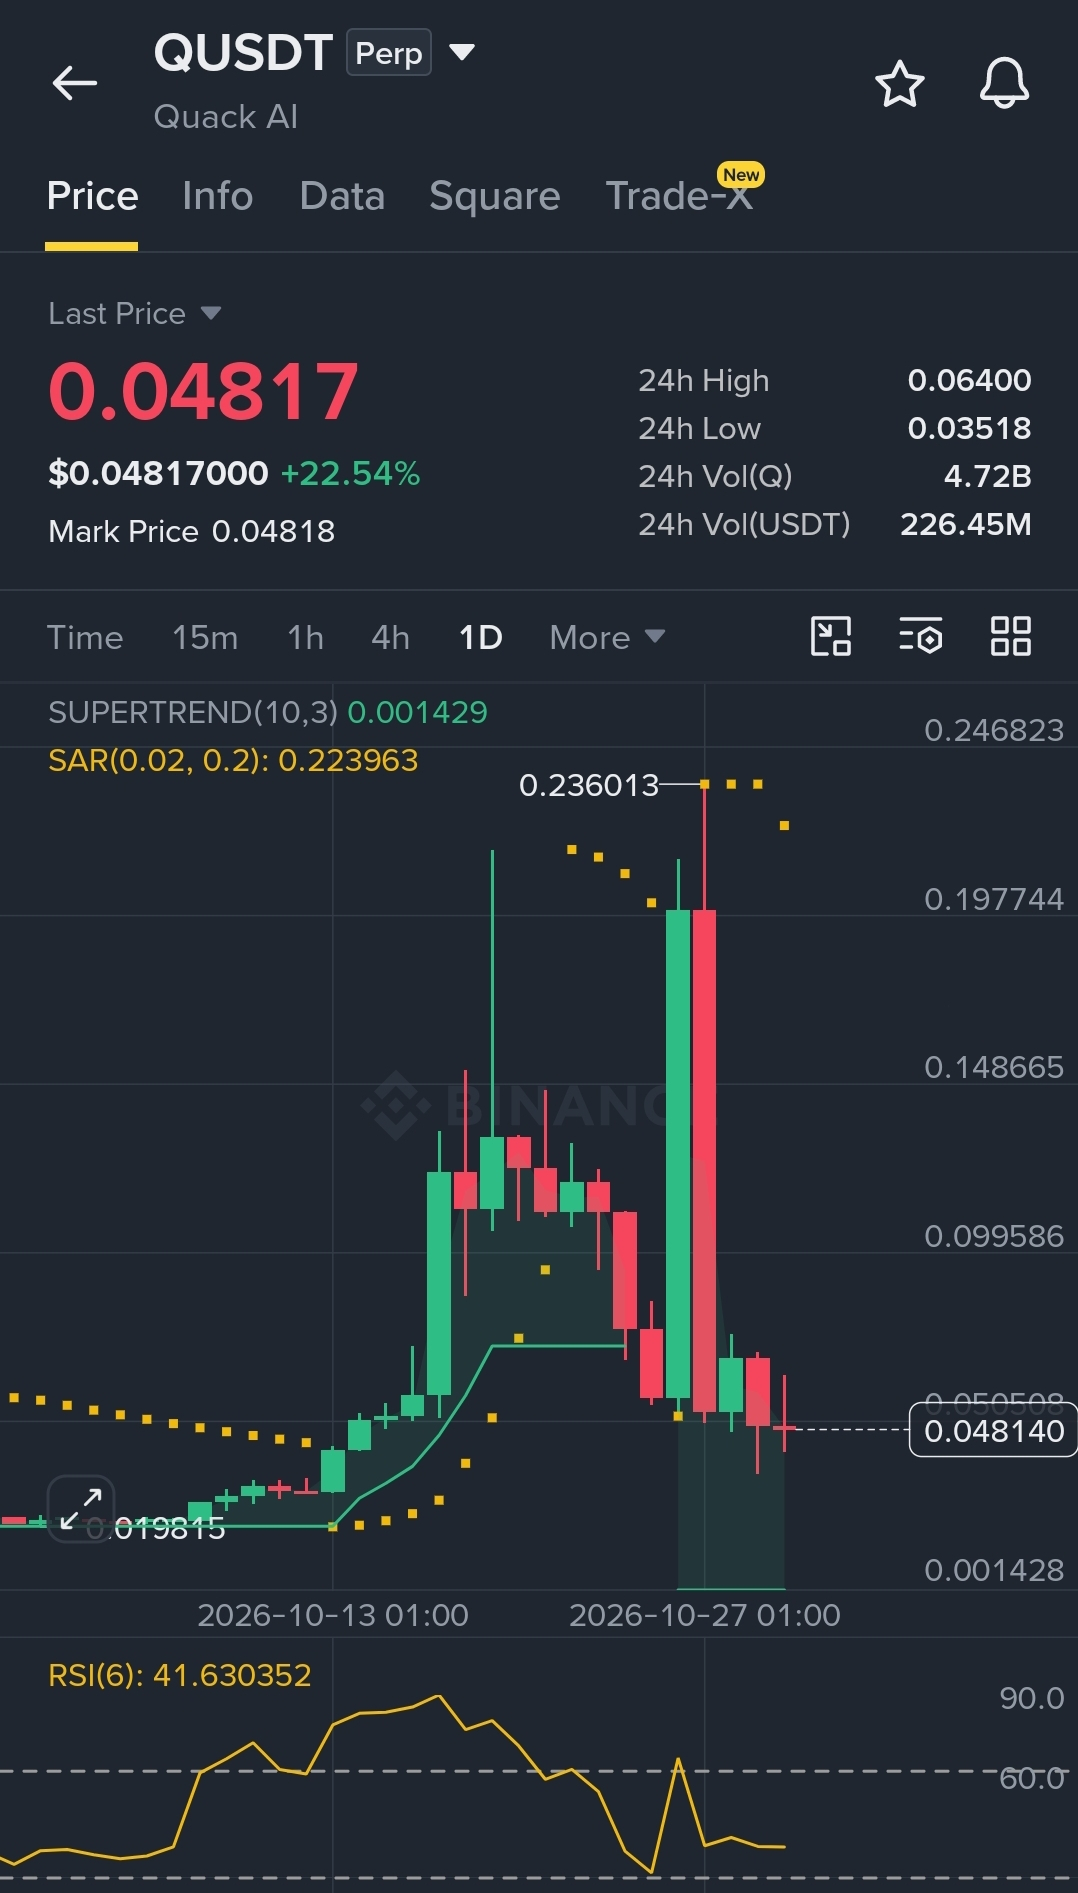
$Q is currently trading around $0.04676, a long way down from its $0.235 peak.
If the pattern confirms with a downside breakout, sellers could push the price lower.
Two different setups, two things to monitor: $PARTI's potential upside and $Q's risk of further decline.
💬 Which one are you keeping on your watchlist?
#PriceActionAnalysis
{future}(PARTIUSDT)
{future}(QUSDT)
🚀 MARKET MOMENTUM CAN LIFT PROJECTS, BUT THE CHARTS STILL MATTER!
$PARTI is attracting attention, and its backing capital is one of the reasons I'm watching it. With the broader market showing bullish strength, there's room for projects with solid support to gain momentum.
But not every chart is moving in the same direction. 👀
$Q is currently trading around $0.04676, a long way down from its $0.235 peak.
If the pattern confirms with a downside breakout, sellers could push the price lower.
Two different setups, two things to monitor: $PARTI 's potential upside and $Q's risk of further decline.
💬 Which one are you keeping on your watchlist?
#PriceActionAnalysis
$PARTI is attracting attention, and its backing capital is one of the reasons I'm watching it. With the broader market showing bullish strength, there's room for projects with solid support to gain momentum.
But not every chart is moving in the same direction. 👀
$Q is currently trading around $0.04676, a long way down from its $0.235 peak.
If the pattern confirms with a downside breakout, sellers could push the price lower.
Two different setups, two things to monitor: $PARTI 's potential upside and $Q's risk of further decline.
💬 Which one are you keeping on your watchlist?
#PriceActionAnalysis

1
331

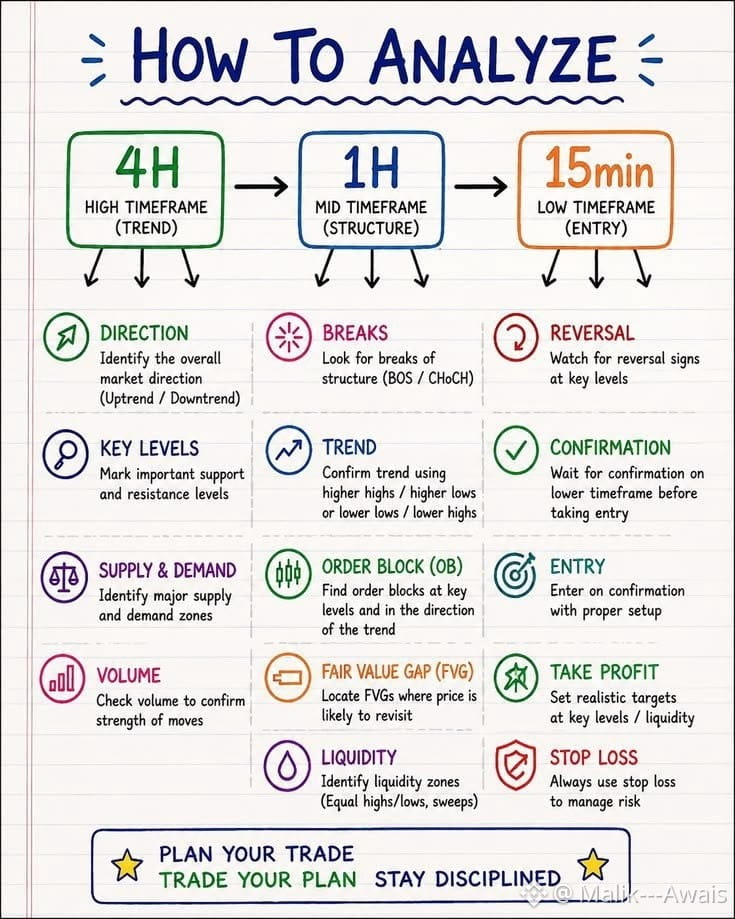
📊 HOW TO ANALYZE THE MARKET LIKE A SMART TRADER! 🎯$JCT
Stop entering trades randomly! 🚫📉
Before your next trade, follow this simple multi-timeframe analysis checklist 👇
🟢 4H — Find the Trend
• Identify bullish or bearish direction
• Mark key support and resistance
• Look for supply and demand zones
🔵 1H — Understand Market Structure
• Watch for BOS & CHoCH
• Identify Order Blocks and FVGs
• Check liquidity levels
🟠 15M — Plan Your Entry
• Wait for confirmation
• Set your stop-loss
• Plan your take-profit before entering
⚠️ Remember: No strategy guarantees profits. Manage your risk and never trade just because you see a signal.
💬 Your turn! Which timeframe do you use most?
A) 4H 📈
B) 1H 🎯
C) 15M ⚡
👇 Comment A, B, or C!
🔖 Save this post for your next market analysis.
#CryptoTrading #TechnicalAnalysis #PriceActionAnalysis #tradingeducation #BinanceSquare
📊 HOW TO ANALYZE THE MARKET LIKE A SMART TRADER! 🎯$JCT
Stop entering trades randomly! 🚫📉
Before your next trade, follow this simple multi-timeframe analysis checklist 👇
🟢 4H — Find the Trend
• Identify bullish or bearish direction
• Mark key support and resistance
• Look for supply and demand zones
🔵 1H — Understand Market Structure
• Watch for BOS & CHoCH
• Identify Order Blocks and FVGs
• Check liquidity levels
🟠 15M — Plan Your Entry
• Wait for confirmation
• Set your stop-loss
• Plan your take-profit before entering
⚠️ Remember: No strategy guarantees profits. Manage your risk and never trade just because you see a signal.
💬 Your turn! Which timeframe do you use most?
A) 4H 📈
B) 1H 🎯
C) 15M ⚡
👇 Comment A, B, or C!
🔖 Save this post for your next market analysis.
#CryptoTrading #TechnicalAnalysis #PriceActionAnalysis #tradingeducation #BinanceSquare
Stop entering trades randomly! 🚫📉
Before your next trade, follow this simple multi-timeframe analysis checklist 👇
🟢 4H — Find the Trend
• Identify bullish or bearish direction
• Mark key support and resistance
• Look for supply and demand zones
🔵 1H — Understand Market Structure
• Watch for BOS & CHoCH
• Identify Order Blocks and FVGs
• Check liquidity levels
🟠 15M — Plan Your Entry
• Wait for confirmation
• Set your stop-loss
• Plan your take-profit before entering
⚠️ Remember: No strategy guarantees profits. Manage your risk and never trade just because you see a signal.
💬 Your turn! Which timeframe do you use most?
A) 4H 📈
B) 1H 🎯
C) 15M ⚡
👇 Comment A, B, or C!
🔖 Save this post for your next market analysis.
#CryptoTrading #TechnicalAnalysis #PriceActionAnalysis #tradingeducation #BinanceSquare
278

Article
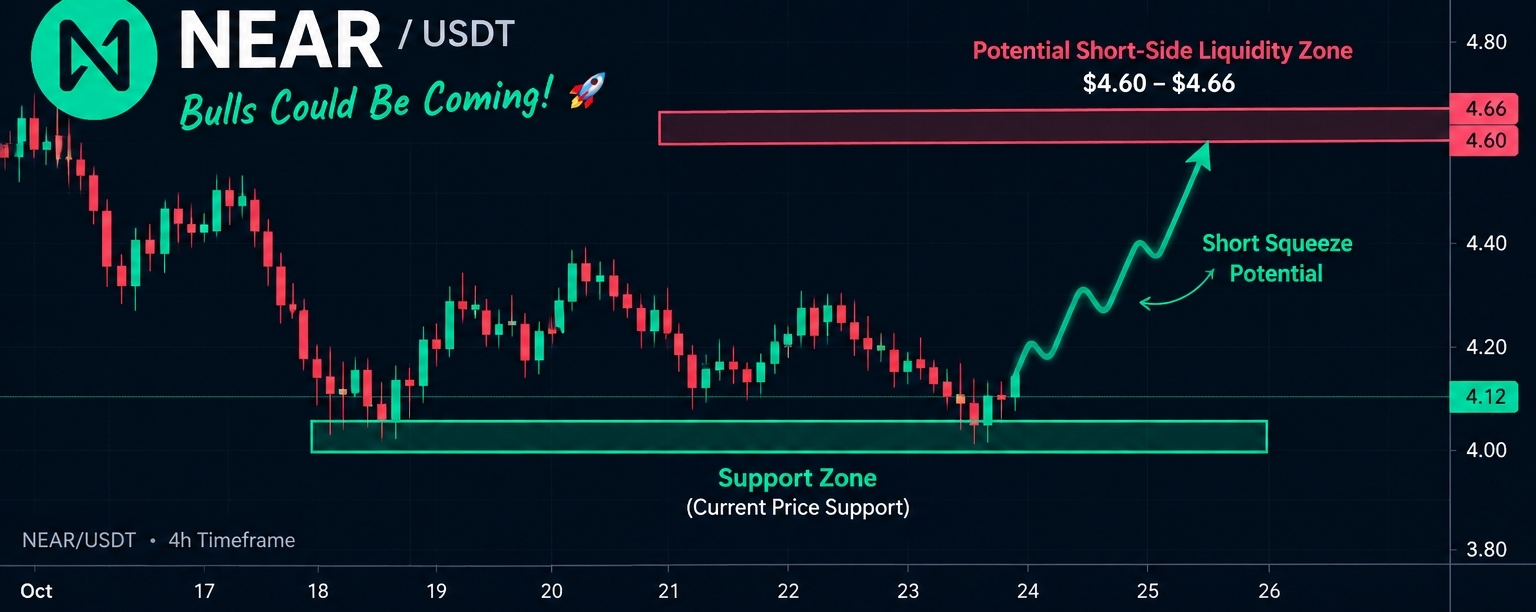
👀 $NEAR — A Bullish Bounce Could Be Coming! 🚀
I’m keeping a close eye on $NEAR as price continues👀 $NEAR — A Bullish Bounce Could Be Coming! 🚀
I’m keeping a close eye on $NEAR as price continues to test an important support zone. So far, this area looks interesting, and I’ll be watching closely to see whether buyers step in with enough strength to push the price higher.
🔥 My Key Observation:
There’s a potential liquidity zone around $4.60–$4.66. If bullish momentum starts building, we could see price move toward this area, potentially triggering a short squeeze along the way.
📈 What I’m Watching:
- Strong price reaction around the current support zone.
- Buyers stepping in with increasing momentum.
- A possible move toward the $4.60–$4.66 liquidity area.
- A potential volatility spike as the new trading week begins.
Sometimes the market stays quiet before making a sudden move. If buyers gain control, $NEAR could have room for a short-term bullish push. However, if support breaks, the setup could change completely.
🎯 Key Levels to Watch:
🟢 Support: Current price support zone
🔴 Potential upside target: $4.60–$4.66
This is the setup I’m watching closely. I’ll be looking for confirmation from price action before drawing any conclusions.
Stay focused, manage your risk, and let the market confirm the move. 📊
#NEAR #CryptoAnalysis #Altcoins #CryptoTrading #PriceActionAnalysis $NEAR
👀 $NEAR — A Bullish Bounce Could Be Coming! 🚀 I’m keeping a close eye on $NEAR as price continues
👀 $NEAR — A Bullish Bounce Could Be Coming! 🚀
I’m keeping a close eye on $NEAR as price continues to test an important support zone. So far, this area looks interesting, and I’ll be watching closely to see whether buyers step in with enough strength to push the price higher.
🔥 My Key Observation:
There’s a potential liquidity zone around $4.60–$4.66. If bullish momentum starts building, we could see price move toward this area, potentially triggering a short squeeze along the way.
📈 What I’m Watching:
- Strong price reaction around the current support zone.
- Buyers stepping in with increasing momentum.
- A possible move toward the $4.60–$4.66 liquidity area.
- A potential volatility spike as the new trading week begins.
Sometimes the market stays quiet before making a sudden move. If buyers gain control, $NEAR could have room for a short-term bullish push. However, if support breaks, the setup could change completely.
🎯 Key Levels to Watch:
🟢 Support: Current price support zone
🔴 Potential upside target: $4.60–$4.66
This is the setup I’m watching closely. I’ll be looking for confirmation from price action before drawing any conclusions.
Stay focused, manage your risk, and let the market confirm the move. 📊
#NEAR #CryptoAnalysis #Altcoins #CryptoTrading #PriceActionAnalysis $NEAR
I’m keeping a close eye on $NEAR as price continues to test an important support zone. So far, this area looks interesting, and I’ll be watching closely to see whether buyers step in with enough strength to push the price higher.
🔥 My Key Observation:
There’s a potential liquidity zone around $4.60–$4.66. If bullish momentum starts building, we could see price move toward this area, potentially triggering a short squeeze along the way.
📈 What I’m Watching:
- Strong price reaction around the current support zone.
- Buyers stepping in with increasing momentum.
- A possible move toward the $4.60–$4.66 liquidity area.
- A potential volatility spike as the new trading week begins.
Sometimes the market stays quiet before making a sudden move. If buyers gain control, $NEAR could have room for a short-term bullish push. However, if support breaks, the setup could change completely.
🎯 Key Levels to Watch:
🟢 Support: Current price support zone
🔴 Potential upside target: $4.60–$4.66
This is the setup I’m watching closely. I’ll be looking for confirmation from price action before drawing any conclusions.
Stay focused, manage your risk, and let the market confirm the move. 📊
#NEAR #CryptoAnalysis #Altcoins #CryptoTrading #PriceActionAnalysis $NEAR
2
927

·
--
Bearish
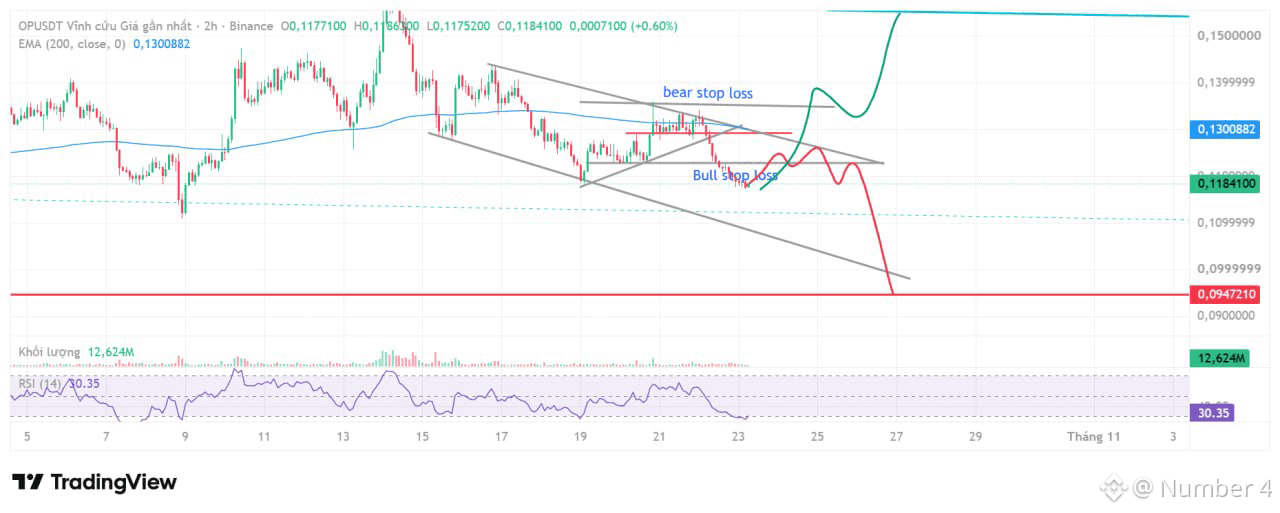
$OP Phe bò cầm cự được bao lâu trước cú break out về vùng 0.09xx? Cùng quan sát biểu đồ h2 như sau: 1. Kênh giảm giá phát huy tác dụng cực tốt mỗi lần giá chạm biên. 2. Vùng lơ lửng quanh 0.123xx-0.135 đã được xác nhận hướng đi là break down. 3. Hiện tại giá tiếp tục quanh quẩn vùng 0.118x. Kế hoạch chúng ta là gì? Ở đây plan đúng là đợi cú chạm lại trendline. Tìm mẫu hình nến phù hợp như hanggingman, brearish pinbar... hoặc 1 build up nhỏ mô hình M. Tiếp tục đánh theo trend đưa giá về lại 0.09xx. Phe gấu chỉ chịu thua khi bất thình lình bị đánh úp lên hẳn vùng 0.15xx. Với cấu trúc hiện tại, mình đánh giá khả năng này không cao! Còn các bạn, các bạn có quan điểm thế nào về #OP hãy để lại comment cùng trao đổi nhé. Lưu ý: Tồn tại quan trọng hơn đúng sai. Hãy bảo vệ vốn của bạn và kỹ lưỡng trong từng quyết định. Mến chúc các bạn thành công. Nếu thấy hay và hữu ích hãy like, share và nhấn follow để cập nhật những phân tích kỹ thuật mới nhất. Cảm ơn các bạn!: #OP #Optimism #PhanTichKyThuat #Crypto #Altcoin #PriceActionAnalysis #Trading #QuanTriRuiRo #BinanceSquare
$OP Phe bò cầm cự được bao lâu trước cú break out về vùng 0.09xx? Cùng quan sát biểu đồ h2 như sau: 1. Kênh giảm giá phát huy tác dụng cực tốt mỗi lần giá chạm biên. 2. Vùng lơ lửng quanh 0.123xx-0.135 đã được xác nhận hướng đi là break down. 3. Hiện tại giá tiếp tục quanh quẩn vùng 0.118x. Kế hoạch chúng ta là gì? Ở đây plan đúng là đợi cú chạm lại trendline. Tìm mẫu hình nến phù hợp như hanggingman, brearish pinbar... hoặc 1 build up nhỏ mô hình M. Tiếp tục đánh theo trend đưa giá về lại 0.09xx. Phe gấu chỉ chịu thua khi bất thình lình bị đánh úp lên hẳn vùng 0.15xx. Với cấu trúc hiện tại, mình đánh giá khả năng này không cao! Còn các bạn, các bạn có quan điểm thế nào về #OP hãy để lại comment cùng trao đổi nhé. Lưu ý: Tồn tại quan trọng hơn đúng sai. Hãy bảo vệ vốn của bạn và kỹ lưỡng trong từng quyết định. Mến chúc các bạn thành công. Nếu thấy hay và hữu ích hãy like, share và nhấn follow để cập nhật những phân tích kỹ thuật mới nhất. Cảm ơn các bạn!: #OP #Optimism #PhanTichKyThuat #Crypto #Altcoin #PriceActionAnalysis #Trading #QuanTriRuiRo #BinanceSquare
1
1.2k

·
--
Bearish
🔴$GTC faced a strong 'Bearish Engulfing' from its 0.38353 high on the 4H chart, indicating that the market drop will continue for the next 4 hours
Entry :0.29500
Stop :0.33000
Target :0.25700
#GTCUSDT #ShortSignal #PriceActionAnalysis #EarningsSeason
🔴$GTC faced a strong 'Bearish Engulfing' from its 0.38353 high on the 4H chart, indicating that the market drop will continue for the next 4 hours
Entry :0.29500
Stop :0.33000
Target :0.25700
#GTCUSDT #ShortSignal #PriceActionAnalysis #EarningsSeason
Entry :0.29500
Stop :0.33000
Target :0.25700
#GTCUSDT #ShortSignal #PriceActionAnalysis #EarningsSeason
1
294

·
--
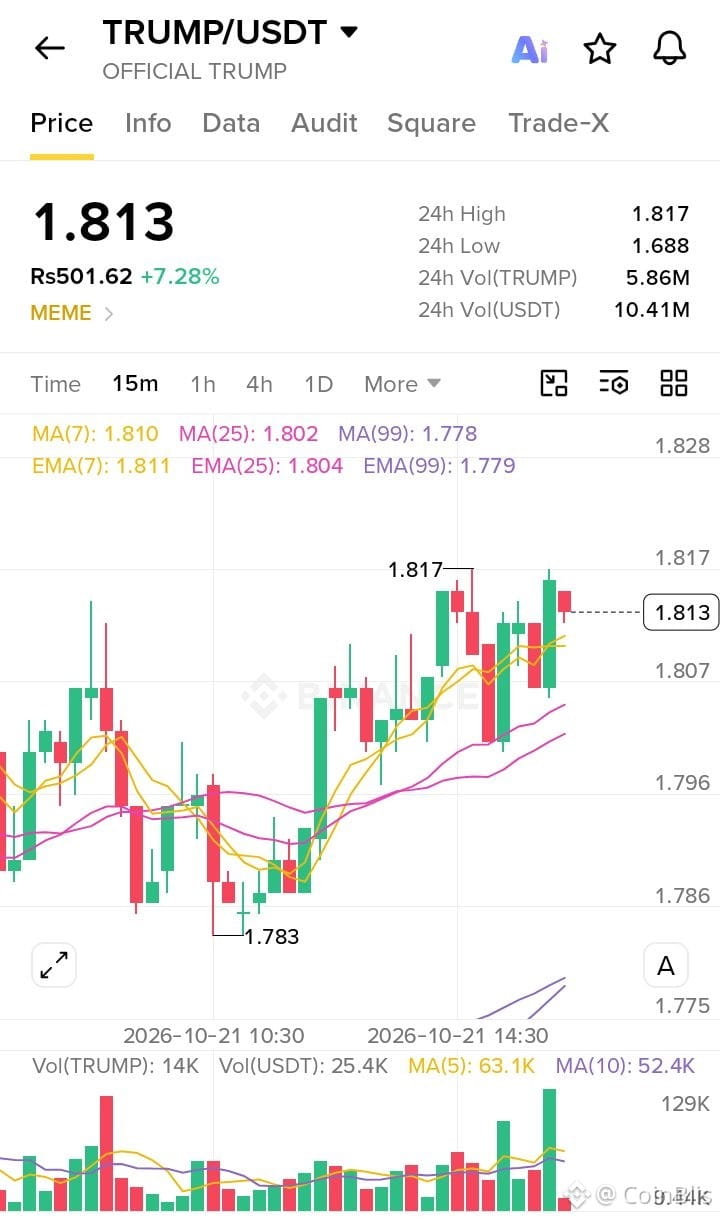
$TRUMP : Can Buyers Break the $1.817 Resistance? 👀
TRUMP is trading around $1.813 after recovering from the $1.783 low. Buyers are showing strength, but price is now testing resistance near $1.817.
Resistance: $1.817–$1.828
Support: $1.807
Next support: $1.802–$1.796
A 15-minute candle close above $1.817 with strong volume could open the way toward $1.828.
If price gets rejected, a pullback toward $1.807 or $1.802 is possible.
I’m watching the breakout confirmation instead of chasing the move. Meme coins can move fast in both directions, so manage risk carefully.
#TRUMP #CryptoAnalysis #PriceActionAnalysis #MEMECOİNS #BinanceSquare
$TRUMP : Can Buyers Break the $1.817 Resistance? 👀
TRUMP is trading around $1.813 after recovering from the $1.783 low. Buyers are showing strength, but price is now testing resistance near $1.817.
Resistance: $1.817–$1.828
Support: $1.807
Next support: $1.802–$1.796
A 15-minute candle close above $1.817 with strong volume could open the way toward $1.828.
If price gets rejected, a pullback toward $1.807 or $1.802 is possible.
I’m watching the breakout confirmation instead of chasing the move. Meme coins can move fast in both directions, so manage risk carefully.
#TRUMP #CryptoAnalysis #PriceActionAnalysis #MEMECOİNS #BinanceSquare
TRUMP is trading around $1.813 after recovering from the $1.783 low. Buyers are showing strength, but price is now testing resistance near $1.817.
Resistance: $1.817–$1.828
Support: $1.807
Next support: $1.802–$1.796
A 15-minute candle close above $1.817 with strong volume could open the way toward $1.828.
If price gets rejected, a pullback toward $1.807 or $1.802 is possible.
I’m watching the breakout confirmation instead of chasing the move. Meme coins can move fast in both directions, so manage risk carefully.
#TRUMP #CryptoAnalysis #PriceActionAnalysis #MEMECOİNS #BinanceSquare
50

Bitcoin is trading around $81,800, with price action showing uncertainty after its recent recovery. Bulls need stronger confirmation before a sustained move higher. 📉📈
🔹 Key Support Zones
• $81,000–$81,400
• $80,000–$80,400
🔹 Key Resistance Zones
• $82,400–$82,900
• $84,000–$84,500
🟢 Bullish Scenario: A confirmed breakout above $82,900 could open the door toward $84,000–$84,500.
🔴 Bearish Scenario: A breakdown below $81,000 could expose the $80,000 support zone.
$BTC
{future}(BTCUSDT)
🎯 My Trading Perspective: I’m watching liquidity sweeps, market structure shifts (MSS), and candle-close confirmation before forming a directional bias. No blind entries—confirmation matters.
💬 What do you think? Will BTC break above $83K or revisit $80K first?
#bitcoin #BTC☀️ #CryptoAnalysis" #PriceActionAnalysis #BinanceSquare
Bitcoin is trading around $81,800, with price action showing uncertainty after its recent recovery. Bulls need stronger confirmation before a sustained move higher. 📉📈
🔹 Key Support Zones
• $81,000–$81,400
• $80,000–$80,400
🔹 Key Resistance Zones
• $82,400–$82,900
• $84,000–$84,500
🟢 Bullish Scenario: A confirmed breakout above $82,900 could open the door toward $84,000–$84,500.
🔴 Bearish Scenario: A breakdown below $81,000 could expose the $80,000 support zone.
$BTC
🎯 My Trading Perspective: I’m watching liquidity sweeps, market structure shifts (MSS), and candle-close confirmation before forming a directional bias. No blind entries—confirmation matters.
💬 What do you think? Will BTC break above $83K or revisit $80K first?
#bitcoin #BTC☀️ #CryptoAnalysis" #PriceActionAnalysis #BinanceSquare
🔹 Key Support Zones
• $81,000–$81,400
• $80,000–$80,400
🔹 Key Resistance Zones
• $82,400–$82,900
• $84,000–$84,500
🟢 Bullish Scenario: A confirmed breakout above $82,900 could open the door toward $84,000–$84,500.
🔴 Bearish Scenario: A breakdown below $81,000 could expose the $80,000 support zone.
$BTC
🎯 My Trading Perspective: I’m watching liquidity sweeps, market structure shifts (MSS), and candle-close confirmation before forming a directional bias. No blind entries—confirmation matters.
💬 What do you think? Will BTC break above $83K or revisit $80K first?
#bitcoin #BTC☀️ #CryptoAnalysis" #PriceActionAnalysis #BinanceSquare
82

·
--
Bullish
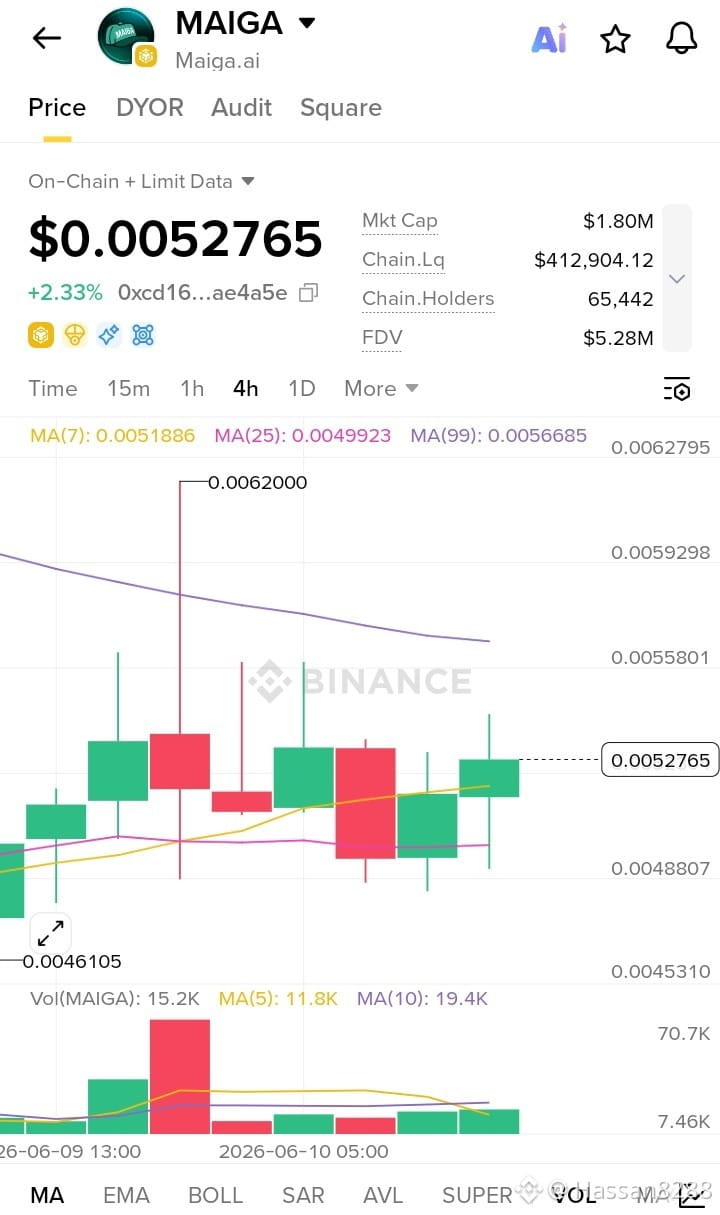
$MAIGA
MAIGA Market Update (4H)
🟢 Bullish Bias
MAIGA is showing signs of recovery on the 4H timeframe, currently trading around $0.00528 with steady buying pressure. Price remains above the short-term moving averages (MA7 & MA25), indicating that bulls are attempting to build momentum after the recent pullback.
The key resistance zone sits near $0.00560 - $0.00620. A successful breakout above this area could trigger further upside movement. On the downside, support is holding around $0.00490 - $0.00500, where buyers have recently stepped in.
Volume remains moderate, suggesting traders are watching closely for the next major move. As long as MAIGA stays above the short-term support levels, the bullish structure remains intact.
Sentiment: 🟢 Bullish
#MAIGA #Crypto #CryptoTradingInsights oin #altcoins emecoin #PriceActionAnalysis ding #Binance #TechnicalAnalysis #Bullish #MegadropLista ptoMarket #MemeWatch2024 dingSignals #DeFi #Web3 #AltSeason #CryptoCommunity #PriceAction
$MAIGA
MAIGA Market Update (4H)
🟢 Bullish Bias
MAIGA is showing signs of recovery on the 4H timeframe, currently trading around $0.00528 with steady buying pressure. Price remains above the short-term moving averages (MA7 & MA25), indicating that bulls are attempting to build momentum after the recent pullback.
The key resistance zone sits near $0.00560 - $0.00620. A successful breakout above this area could trigger further upside movement. On the downside, support is holding around $0.00490 - $0.00500, where buyers have recently stepped in.
Volume remains moderate, suggesting traders are watching closely for the next major move. As long as MAIGA stays above the short-term support levels, the bullish structure remains intact.
Sentiment: 🟢 Bullish
#MAIGA #Crypto #CryptoTradingInsights oin #altcoins emecoin #PriceActionAnalysis ding #Binance #TechnicalAnalysis #Bullish #MegadropLista ptoMarket #MemeWatch2024 dingSignals #DeFi #Web3 #AltSeason #CryptoCommunity #PriceAction
MAIGA Market Update (4H)
🟢 Bullish Bias
MAIGA is showing signs of recovery on the 4H timeframe, currently trading around $0.00528 with steady buying pressure. Price remains above the short-term moving averages (MA7 & MA25), indicating that bulls are attempting to build momentum after the recent pullback.
The key resistance zone sits near $0.00560 - $0.00620. A successful breakout above this area could trigger further upside movement. On the downside, support is holding around $0.00490 - $0.00500, where buyers have recently stepped in.
Volume remains moderate, suggesting traders are watching closely for the next major move. As long as MAIGA stays above the short-term support levels, the bullish structure remains intact.
Sentiment: 🟢 Bullish
#MAIGA #Crypto #CryptoTradingInsights oin #altcoins emecoin #PriceActionAnalysis ding #Binance #TechnicalAnalysis #Bullish #MegadropLista ptoMarket #MemeWatch2024 dingSignals #DeFi #Web3 #AltSeason #CryptoCommunity #PriceAction
505

📊⚔️ Precision. Patience. Execution. ⚔️📊
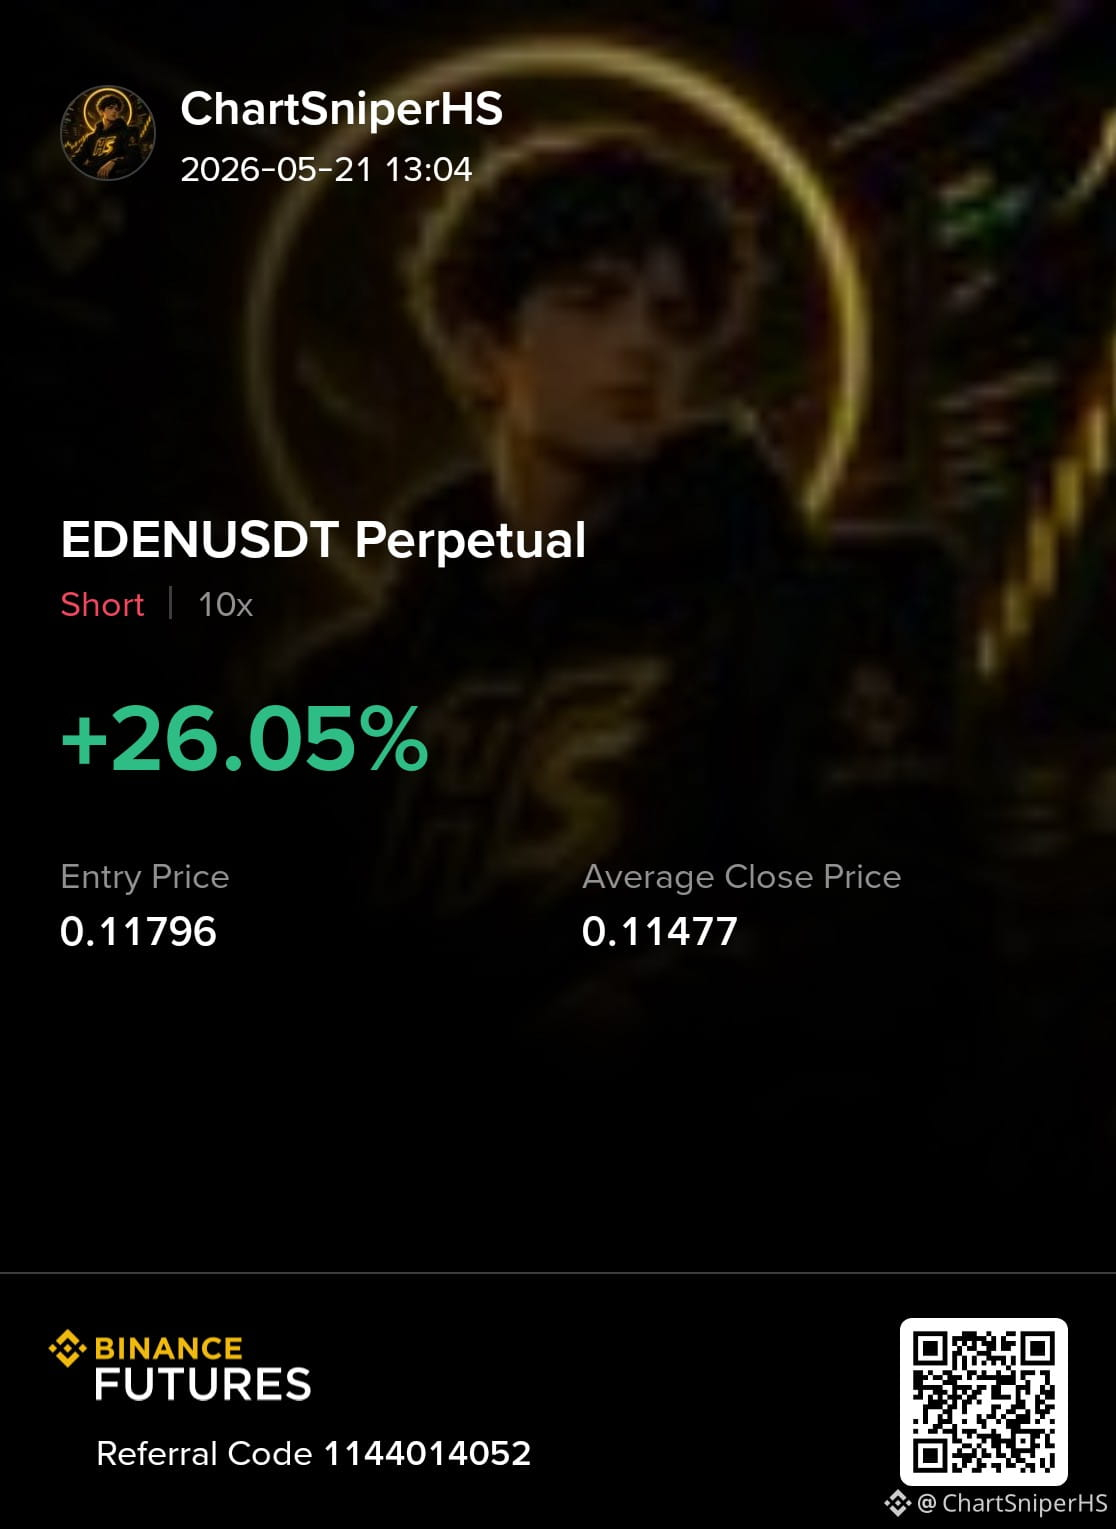
Another disciplined trade closed successfully by ChartSniperHS.
EDENUSDT SHORT delivered exactly as planned after clean bearish confirmation and proper market structure alignment. 📉
🔻 Trade Details:
• Pair: EDENUSDT Perpetual$EDEN
• Position: SHORT 10x
• Entry Price: 0.11796$EDEN
• Exit Price: 0.11477
• Profit Secured: +26.05% ✅$EDEN
No impulsive entries.
No emotional decisions.
Just strategy, confirmation, and disciplined execution. 🔥
Professional trading is not about catching every move —
it’s about waiting for high-probability setups and managing risk correctly. 🎯
Consistency over hype.
Discipline over emotion.
Execution over prediction. 🚀
#Futures_Signals #PriceActionAnalysis #SmartContracts #BinanceSquareFamily #cryptosignal
📊⚔️ Precision. Patience. Execution. ⚔️📊
Another disciplined trade closed successfully by ChartSniperHS.
EDENUSDT SHORT delivered exactly as planned after clean bearish confirmation and proper market structure alignment. 📉
🔻 Trade Details:
• Pair: EDENUSDT Perpetual$EDEN
• Position: SHORT 10x
• Entry Price: 0.11796$EDEN
• Exit Price: 0.11477
• Profit Secured: +26.05% ✅$EDEN
No impulsive entries.
No emotional decisions.
Just strategy, confirmation, and disciplined execution. 🔥
Professional trading is not about catching every move —
it’s about waiting for high-probability setups and managing risk correctly. 🎯
Consistency over hype.
Discipline over emotion.
Execution over prediction. 🚀
#Futures_Signals #PriceActionAnalysis #SmartContracts #BinanceSquareFamily #cryptosignal
Another disciplined trade closed successfully by ChartSniperHS.
EDENUSDT SHORT delivered exactly as planned after clean bearish confirmation and proper market structure alignment. 📉
🔻 Trade Details:
• Pair: EDENUSDT Perpetual$EDEN
• Position: SHORT 10x
• Entry Price: 0.11796$EDEN
• Exit Price: 0.11477
• Profit Secured: +26.05% ✅$EDEN
No impulsive entries.
No emotional decisions.
Just strategy, confirmation, and disciplined execution. 🔥
Professional trading is not about catching every move —
it’s about waiting for high-probability setups and managing risk correctly. 🎯
Consistency over hype.
Discipline over emotion.
Execution over prediction. 🚀
#Futures_Signals #PriceActionAnalysis #SmartContracts #BinanceSquareFamily #cryptosignal
1
1
181

·
--
Bearish
BNB/USDT 30min — Setup Short en cours | Ne pas entrer maintenant
La structure parle d'elle-même. BNB affiche une configuration clairement baissière sur le 30 min.
Ce que le graphique montre :
→ Triple MSB baissier confirmé
→ EMA 50 en pente descendante, prix en dessous
→ Deux Be-OB en zone rouge 700–725 $ résistances majeures toujours valides
→ Support Bu-OB daily identifié à 649,60 $
Le setup Short :
| | Niveau |
|---|---|
| 🎯 Entrée | Cassure + retest de 674 $ |
| ✅ TP1 | 660 $ |
| ✅ TP2 | 649,60 $ (Bu-OB daily) |
| 🛑 SL | Au-dessus de 682 $ |
| ⚖️ R:R | ≈ 1:2 |
**Pourquoi ne pas entrer maintenant ?**
Le prix est déjà engagé. Entrer ici c'est chasser le mouvement — risque de faux breakout baissier et R:R dégradé.
Le plan :** Attendre** une clôture 30 min sous 674 $** avec momentum, puis le retest de ce niveau comme résistance. La confirmation prime sur la précipitation.
La structure est là. La patience fait le reste. 🧠
⚠️ Ceci n'est pas un conseil financier. Tradez responsablement et gérez votre risque.
#bnb #crypto #PriceActionAnalysis #smartmoney $BNB
BNB/USDT 30min — Setup Short en cours | Ne pas entrer maintenant
La structure parle d'elle-même. BNB affiche une configuration clairement baissière sur le 30 min.
Ce que le graphique montre :
→ Triple MSB baissier confirmé
→ EMA 50 en pente descendante, prix en dessous
→ Deux Be-OB en zone rouge 700–725 $ résistances majeures toujours valides
→ Support Bu-OB daily identifié à 649,60 $
Le setup Short :
| | Niveau |
|---|---|
| 🎯 Entrée | Cassure + retest de 674 $ |
| ✅ TP1 | 660 $ |
| ✅ TP2 | 649,60 $ (Bu-OB daily) |
| 🛑 SL | Au-dessus de 682 $ |
| ⚖️ R:R | ≈ 1:2 |
**Pourquoi ne pas entrer maintenant ?**
Le prix est déjà engagé. Entrer ici c'est chasser le mouvement — risque de faux breakout baissier et R:R dégradé.
Le plan :** Attendre** une clôture 30 min sous 674 $** avec momentum, puis le retest de ce niveau comme résistance. La confirmation prime sur la précipitation.
La structure est là. La patience fait le reste. 🧠
⚠️ Ceci n'est pas un conseil financier. Tradez responsablement et gérez votre risque.
#bnb #crypto #PriceActionAnalysis #smartmoney $BNB
La structure parle d'elle-même. BNB affiche une configuration clairement baissière sur le 30 min.
Ce que le graphique montre :
→ Triple MSB baissier confirmé
→ EMA 50 en pente descendante, prix en dessous
→ Deux Be-OB en zone rouge 700–725 $ résistances majeures toujours valides
→ Support Bu-OB daily identifié à 649,60 $
Le setup Short :
| | Niveau |
|---|---|
| 🎯 Entrée | Cassure + retest de 674 $ |
| ✅ TP1 | 660 $ |
| ✅ TP2 | 649,60 $ (Bu-OB daily) |
| 🛑 SL | Au-dessus de 682 $ |
| ⚖️ R:R | ≈ 1:2 |
**Pourquoi ne pas entrer maintenant ?**
Le prix est déjà engagé. Entrer ici c'est chasser le mouvement — risque de faux breakout baissier et R:R dégradé.
Le plan :** Attendre** une clôture 30 min sous 674 $** avec momentum, puis le retest de ce niveau comme résistance. La confirmation prime sur la précipitation.
La structure est là. La patience fait le reste. 🧠
⚠️ Ceci n'est pas un conseil financier. Tradez responsablement et gérez votre risque.
#bnb #crypto #PriceActionAnalysis #smartmoney $BNB
259

·
--
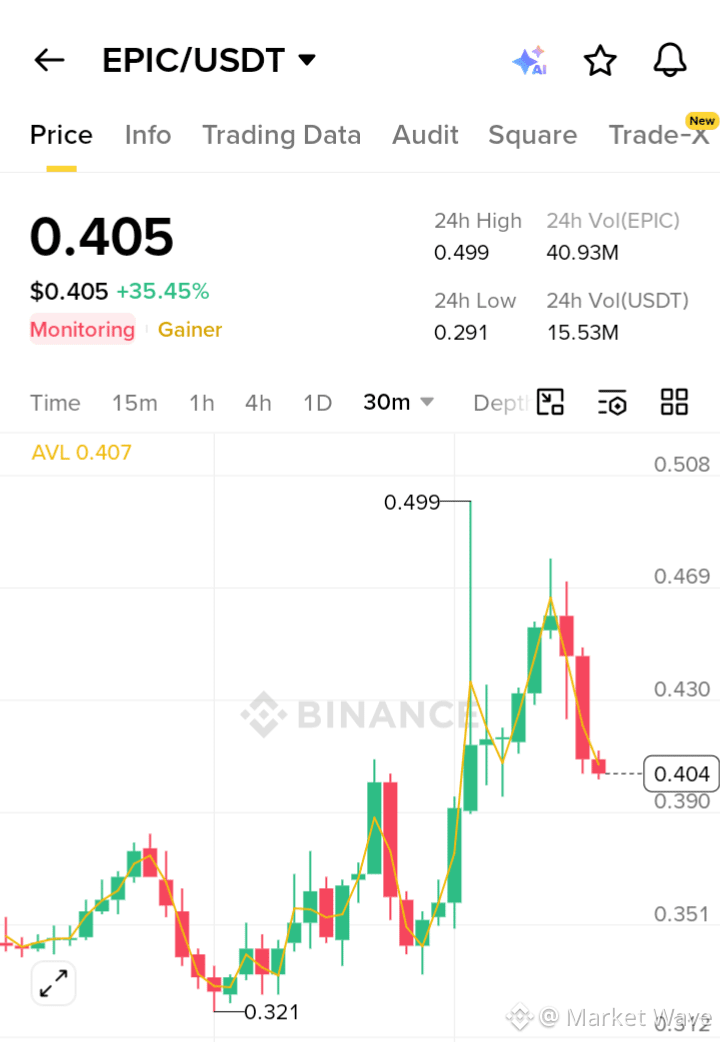
$EPIC/USDT: BULLISH CONTINUATION EXPECTED AFTER HEALTHY RETRACEMENT $EPIC
Trade Setup
Market Direction: Bullish
Target 1 (TP1): 0.435
Target 2 (TP2): 0.465
Target 3 (TP3): 0.495
Stop Loss (SL): 0.375
#CryptoTrading #TechnicalAnalysis #BullishSetup #cryptosignals #PriceActionAnalysis
$EPIC/USDT: BULLISH CONTINUATION EXPECTED AFTER HEALTHY RETRACEMENT $EPIC
Trade Setup
Market Direction: Bullish
Target 1 (TP1): 0.435
Target 2 (TP2): 0.465
Target 3 (TP3): 0.495
Stop Loss (SL): 0.375
#CryptoTrading #TechnicalAnalysis #BullishSetup #cryptosignals #PriceActionAnalysis
Trade Setup
Market Direction: Bullish
Target 1 (TP1): 0.435
Target 2 (TP2): 0.465
Target 3 (TP3): 0.495
Stop Loss (SL): 0.375
#CryptoTrading #TechnicalAnalysis #BullishSetup #cryptosignals #PriceActionAnalysis
52

⚡#
$BTC
$LITEB Lumentum Coin | Market Outlook
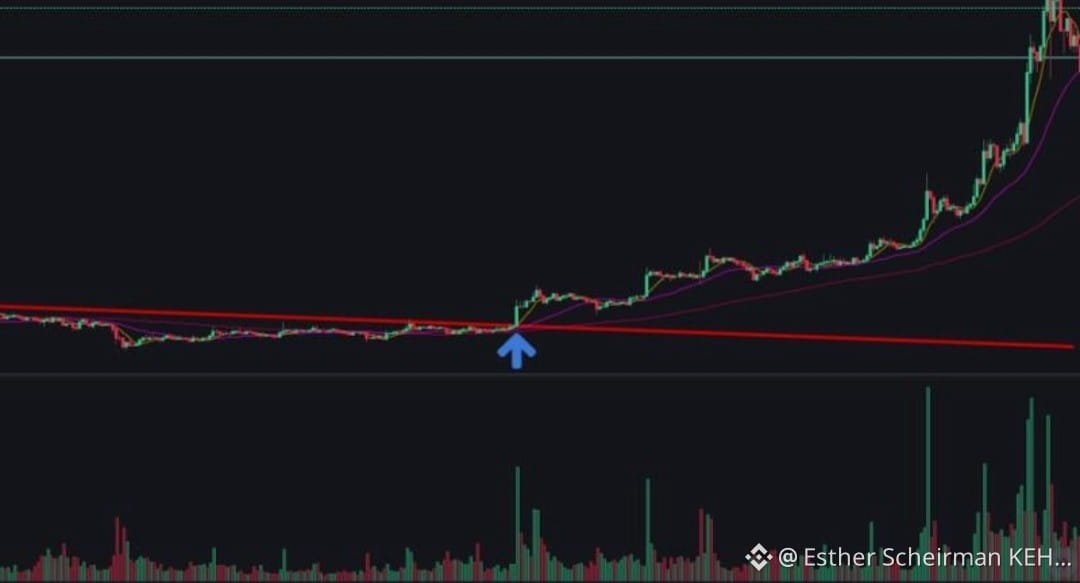
$LITEB is approaching a critical inflection point, where price structure and liquidity will likely determine the next directional move.
A sustained breakout above resistance, backed by strong volume, would signal renewed bullish momentum and could attract fresh market participation. Conversely, rejection at current levels may lead to a healthy retracement before buyers attempt to reclaim control.
Institutional Perspective ✔️ Trade the confirmation, not the speculation.
✔️ Let volume validate the breakout.
✔️ Capital preservation is just as important as capital growth.
The highest-probability trades come to those who wait for the market to reveal its intent.#GillibrandCallsForDigitalAssetEthicsBan
#PriceActionAnalysis #SmartMoney #Altcoins
⚡#
$BTC
$LITEB Lumentum Coin | Market Outlook
$LITEB is approaching a critical inflection point, where price structure and liquidity will likely determine the next directional move.
A sustained breakout above resistance, backed by strong volume, would signal renewed bullish momentum and could attract fresh market participation. Conversely, rejection at current levels may lead to a healthy retracement before buyers attempt to reclaim control.
Institutional Perspective ✔️ Trade the confirmation, not the speculation.
✔️ Let volume validate the breakout.
✔️ Capital preservation is just as important as capital growth.
The highest-probability trades come to those who wait for the market to reveal its intent.#GillibrandCallsForDigitalAssetEthicsBan
#PriceActionAnalysis #SmartMoney #Altcoins
$BTC
$LITEB Lumentum Coin | Market Outlook
$LITEB is approaching a critical inflection point, where price structure and liquidity will likely determine the next directional move.
A sustained breakout above resistance, backed by strong volume, would signal renewed bullish momentum and could attract fresh market participation. Conversely, rejection at current levels may lead to a healthy retracement before buyers attempt to reclaim control.
Institutional Perspective ✔️ Trade the confirmation, not the speculation.
✔️ Let volume validate the breakout.
✔️ Capital preservation is just as important as capital growth.
The highest-probability trades come to those who wait for the market to reveal its intent.#GillibrandCallsForDigitalAssetEthicsBan
#PriceActionAnalysis #SmartMoney #Altcoins
143
·
--
Bullish
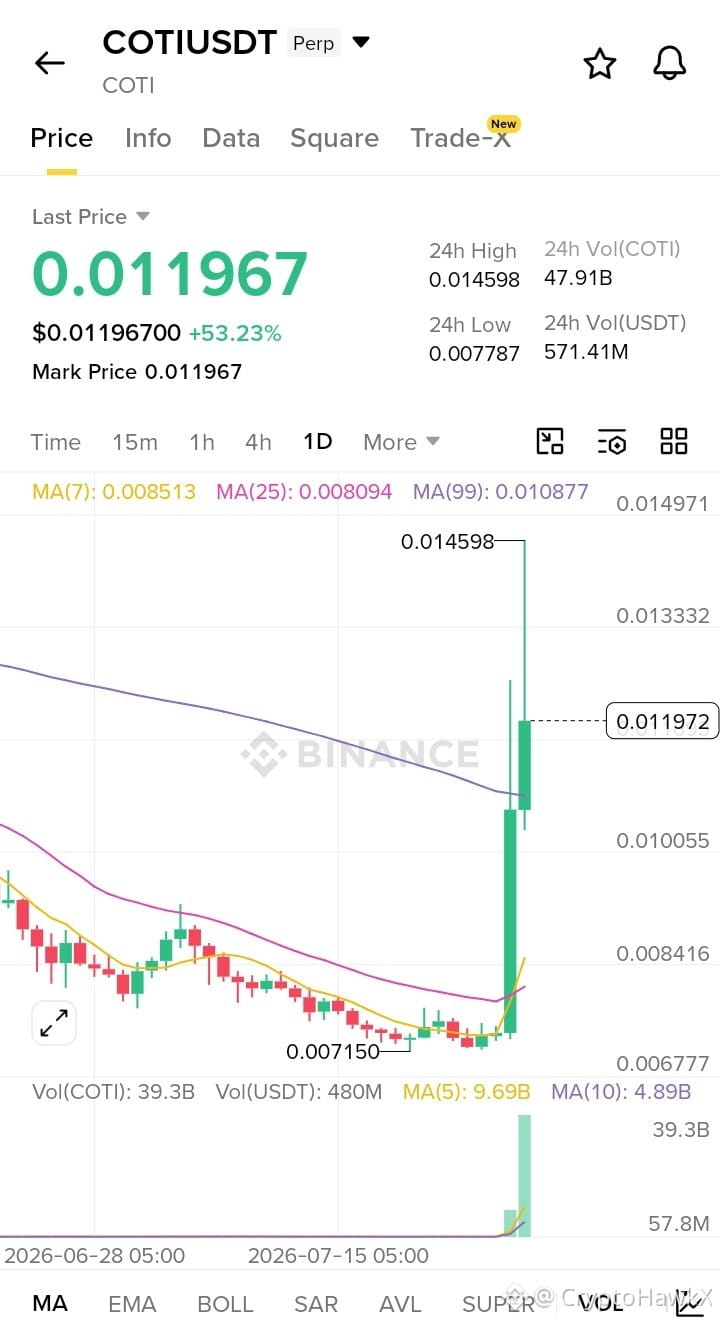
🚀 $COTI COTI/USDT Market Update (1D)
COTI has delivered a powerful breakout, surging over 50% with exceptionally strong buying volume. Price has moved above the 7-day, 25-day, and 99-day moving averages, signaling a major shift in momentum as buyers take control.
After such a sharp rally, short-term volatility and profit-taking are possible. If COTI holds above key breakout support, the uptrend could continue. Traders should watch for healthy pullbacks and confirmation before chasing extended moves.
Market Sentiment: 🟢 Bullish
#COTI #COTIUSDT #Crypto # #Binance #CourtUpdateXRP #PriceActionAnalysis #MarketSentimentToday #Bullish #TechTales
🚀 $COTI COTI/USDT Market Update (1D)
COTI has delivered a powerful breakout, surging over 50% with exceptionally strong buying volume. Price has moved above the 7-day, 25-day, and 99-day moving averages, signaling a major shift in momentum as buyers take control.
After such a sharp rally, short-term volatility and profit-taking are possible. If COTI holds above key breakout support, the uptrend could continue. Traders should watch for healthy pullbacks and confirmation before chasing extended moves.
Market Sentiment: 🟢 Bullish
#COTI #COTIUSDT #Crypto # #Binance #CourtUpdateXRP #PriceActionAnalysis #MarketSentimentToday #Bullish #TechTales
COTI has delivered a powerful breakout, surging over 50% with exceptionally strong buying volume. Price has moved above the 7-day, 25-day, and 99-day moving averages, signaling a major shift in momentum as buyers take control.
After such a sharp rally, short-term volatility and profit-taking are possible. If COTI holds above key breakout support, the uptrend could continue. Traders should watch for healthy pullbacks and confirmation before chasing extended moves.
Market Sentiment: 🟢 Bullish
#COTI #COTIUSDT #Crypto # #Binance #CourtUpdateXRP #PriceActionAnalysis #MarketSentimentToday #Bullish #TechTales
100
Log in to explore more content
Join global crypto users on Binance Square
⚡️ Get latest and useful information about crypto.
💬 Trusted by the world’s largest crypto exchange.
👍 Discover real insights from verified creators.
Email / Phone number
Trending Topics
1
#HuangExitNvidiaStrategyInFocus
89,396 views
994 Discussing
2
#AnthropicRejectsIPODelayValuationinQuestion
694,342 views
5,258 Discussing
3
#BitMineReports$6.3BNetLossForFiscal2026
11,601 views
123 Discussing
4
#ChipStocksExtendLossesAfterNvidiaCEOChange
36,720 views
437 Discussing
5
#ThailandProposes$148KDailyStablecoinDepositWithdrawalCaps
3,217 views
48 Discussing
6
#CoreWeaveJumps10%On168%RevenueGrowth
192,819 views
1,669 Discussing
7
#ZcashFallsBelow$1000ForFirstTimeSinceSeptember
89,642 views
263 Discussing
8
#MSCIRemovalMayCurbStrategy’sBitcoinBuying
56,387 views
600 Discussing
9
#TradFiForBeginners
533,379 views
3,700 Discussing
10
#USJoblessClaimsRise
19.1M views
7,812 Discussing