
#pnetwork
pnetwork
10,787 views
16 Discussing
Hot
Latest

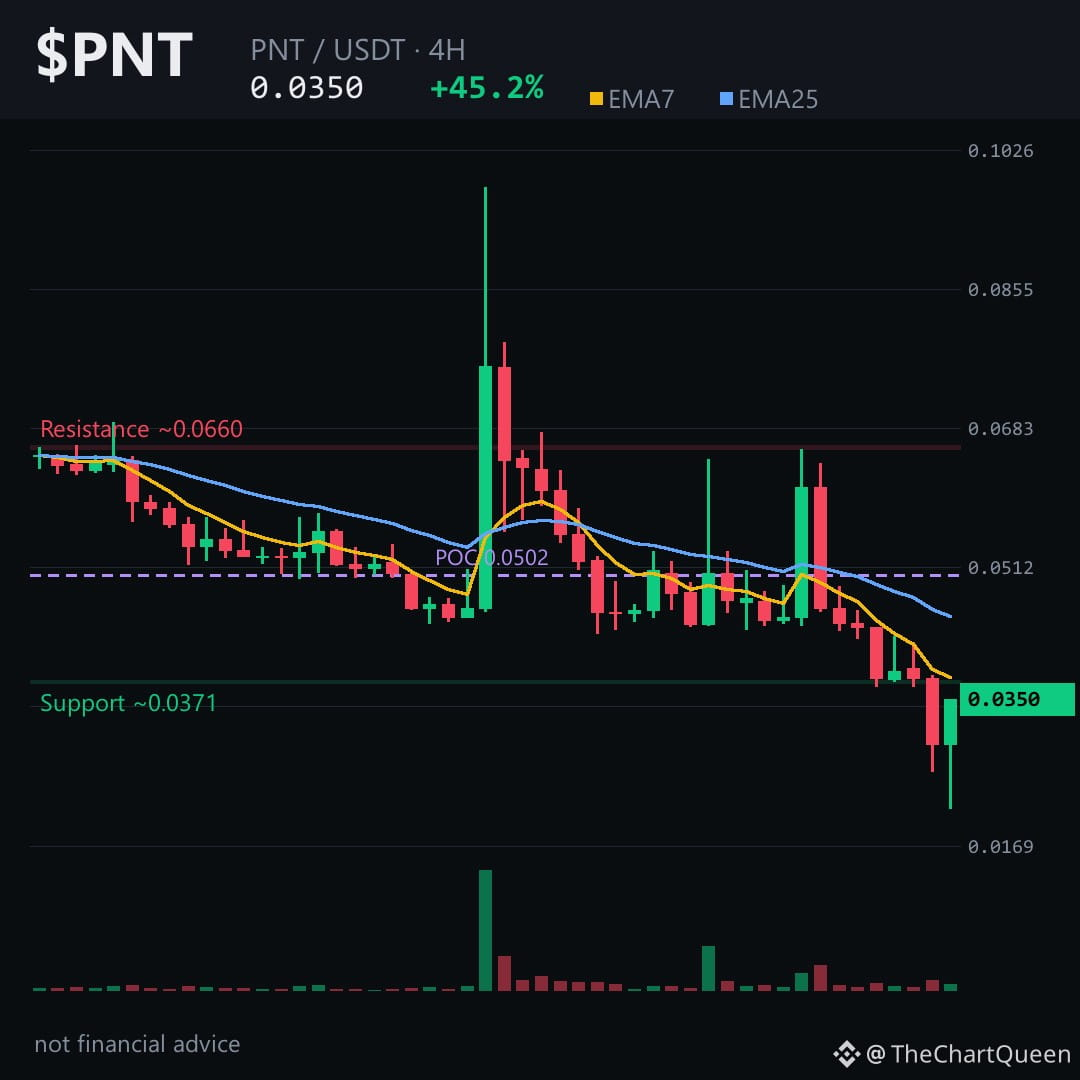
When a 4‑hour candle rockets from 0.045 to 0.061 and then crashes back to 0.035, the market is shouting “reverse”. $PNT is at a crossroads.
Price is clearly in a downtrend, yet the sudden 35% intraday spike left a lingering bullish imprint in the order flow. The EMA gap and a waning RSI around 40 suggest sellers are still in control, but the lingering bullish pressure could trap the next move.
On the 4‑hour chart $PNT is hugging the ~0.035 zone; a break above the ~0.0369 ceiling would flip the bias, while a slide toward the ~0.032 area looks like the next logical stop. Tap $PNT to pull up the chart and see these levels yourself.
I think the most probable path is a test of the low‑0.032 region, with the real danger if price re‑captures the ~0.0369 barrier.
Follow me for the next update when this zone either holds or collapses – you’ll see the next move before the market reacts. What level do you think will be the decisive test for PNT? 👇
⚠️ Not financial advice. DYOR.
#PNT #pNetwork #Crypto #BinanceSquare
When a 4‑hour candle rockets from 0.045 to 0.061 and then crashes back to 0.035, the market is shouting “reverse”. $PNT is at a crossroads.
Price is clearly in a downtrend, yet the sudden 35% intraday spike left a lingering bullish imprint in the order flow. The EMA gap and a waning RSI around 40 suggest sellers are still in control, but the lingering bullish pressure could trap the next move.
On the 4‑hour chart $PNT is hugging the ~0.035 zone; a break above the ~0.0369 ceiling would flip the bias, while a slide toward the ~0.032 area looks like the next logical stop. Tap $PNT to pull up the chart and see these levels yourself.
I think the most probable path is a test of the low‑0.032 region, with the real danger if price re‑captures the ~0.0369 barrier.
Follow me for the next update when this zone either holds or collapses – you’ll see the next move before the market reacts. What level do you think will be the decisive test for PNT? 👇
⚠️ Not financial advice. DYOR.
#PNT #pNetwork #Crypto #BinanceSquare
Price is clearly in a downtrend, yet the sudden 35% intraday spike left a lingering bullish imprint in the order flow. The EMA gap and a waning RSI around 40 suggest sellers are still in control, but the lingering bullish pressure could trap the next move.
On the 4‑hour chart $PNT is hugging the ~0.035 zone; a break above the ~0.0369 ceiling would flip the bias, while a slide toward the ~0.032 area looks like the next logical stop. Tap $PNT to pull up the chart and see these levels yourself.
I think the most probable path is a test of the low‑0.032 region, with the real danger if price re‑captures the ~0.0369 barrier.
Follow me for the next update when this zone either holds or collapses – you’ll see the next move before the market reacts. What level do you think will be the decisive test for PNT? 👇
⚠️ Not financial advice. DYOR.
#PNT #pNetwork #Crypto #BinanceSquare

·
--
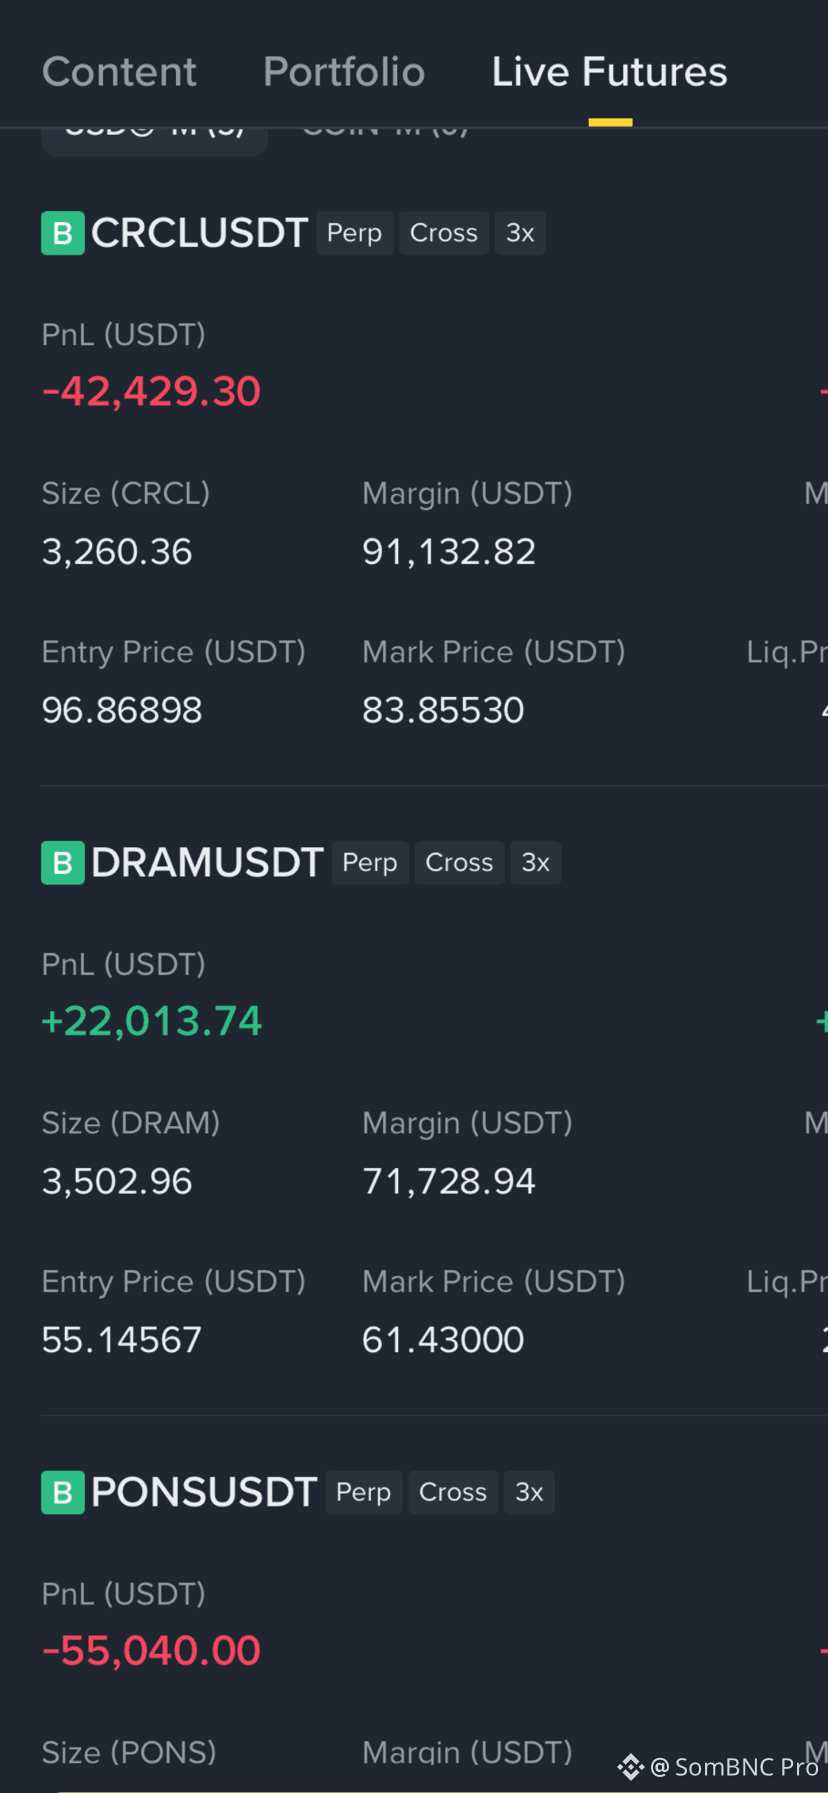
LIVE NOW — REAL FUTURES TRADING
📉 CRCL: -$42K
📈 DRAM: +$22K
📉 PONS: -$55K
Trading isn’t always about winning — it’s about learning, managing risk, and improving every trade.
🎙️ Join my LIVE as I break down these trades, entries, leverage & risk management.
👀 Come watch, learn & trade smarter.
💬 What should I analyze next? BTC, ETH or Altcoins?
⚠️ Educational purposes only. Futures trading involves high risk.
#BinanceLive #BinanceSquare #Crypto #FuturesTrading #Trading #CryptoTrading #pnetwork
LIVE NOW — REAL FUTURES TRADING
📉 CRCL: -$42K
📈 DRAM: +$22K
📉 PONS: -$55K
Trading isn’t always about winning — it’s about learning, managing risk, and improving every trade.
🎙️ Join my LIVE as I break down these trades, entries, leverage & risk management.
👀 Come watch, learn & trade smarter.
💬 What should I analyze next? BTC, ETH or Altcoins?
⚠️ Educational purposes only. Futures trading involves high risk.
#BinanceLive #BinanceSquare #Crypto #FuturesTrading #Trading #CryptoTrading #pnetwork
📉 CRCL: -$42K
📈 DRAM: +$22K
📉 PONS: -$55K
Trading isn’t always about winning — it’s about learning, managing risk, and improving every trade.
🎙️ Join my LIVE as I break down these trades, entries, leverage & risk management.
👀 Come watch, learn & trade smarter.
💬 What should I analyze next? BTC, ETH or Altcoins?
⚠️ Educational purposes only. Futures trading involves high risk.
#BinanceLive #BinanceSquare #Crypto #FuturesTrading #Trading #CryptoTrading #pnetwork
985
Log in to explore more content
Join global crypto users on Binance Square
⚡️ Get latest and useful information about crypto.
💬 Trusted by the world’s largest crypto exchange.
👍 Discover real insights from verified creators.
Email / Phone number
Trending Topics
1
#HuangRisksOusterOverReportedAffairWithSubordinate
7,517 views
136 Discussing
2
#AnthropicRejectsIPODelayValuationinQuestion
430,670 views
3,663 Discussing
3
#CoreWeaveJumps10%On168%RevenueGrowth
49,307 views
710 Discussing
4
#ZcashFallsBelow$1000ForFirstTimeSinceSeptember
25,480 views
136 Discussing
5
#CanNvidiaEarningsEaseMarketConcerns?
150,616 views
1,648 Discussing
6
#SolanaCompanyReports$3.4MQ3Revenue
102 views
5 Discussing
7
#StrategyMetaplanetLoseMSCIIndexMembership
1,390 views
46 Discussing
8
#tZEROWinsCFTCApprovalForRegulatedDerivativesExchange
169 views
8 Discussing
9
#HotCPIDecemberHikePriced
459,140 views
3,679 Discussing
10
#StablecoinSupplyDrops$14.2BIn30Days
407 views
8 Discussing