
#kstrusdt
kstrusdt
718 views
15 Discussing
Hot
Latest
·
--
🥨 Sự đan xen hoàn hảo của các tin tức tích cực đang tạo nên một cấu trúc tăng trưởng vô cùng bền vững và chắc chắn.
🔥 LONG $KSTR
Entry: 18.22
TP: 19.131 | SL: 16.398
👟 Các dự án Move-to-Earn kết hợp sức khỏe và thu nhập rất độc đáo.
📊 Chỉ báo Bull/Bear Power cho thấy phe bò đang chiếm quyền kiểm soát.
🛡️ Hãy tin vào bản thân mình nhưng đừng bao giờ quá tin vào các chỉ báo.
🍀 Chúc bạn luôn giữ vững tâm thế của người thắng cuộc trong mọi hoàn cảnh sàn.
#KSTRUSDT $KSTRUSDT
🥨 Sự đan xen hoàn hảo của các tin tức tích cực đang tạo nên một cấu trúc tăng trưởng vô cùng bền vững và chắc chắn.
🔥 LONG $KSTR
Entry: 18.22
TP: 19.131 | SL: 16.398
👟 Các dự án Move-to-Earn kết hợp sức khỏe và thu nhập rất độc đáo.
📊 Chỉ báo Bull/Bear Power cho thấy phe bò đang chiếm quyền kiểm soát.
🛡️ Hãy tin vào bản thân mình nhưng đừng bao giờ quá tin vào các chỉ báo.
🍀 Chúc bạn luôn giữ vững tâm thế của người thắng cuộc trong mọi hoàn cảnh sàn.
#KSTRUSDT $KSTRUSDT
🔥 LONG $KSTR
Entry: 18.22
TP: 19.131 | SL: 16.398
👟 Các dự án Move-to-Earn kết hợp sức khỏe và thu nhập rất độc đáo.
📊 Chỉ báo Bull/Bear Power cho thấy phe bò đang chiếm quyền kiểm soát.
🛡️ Hãy tin vào bản thân mình nhưng đừng bao giờ quá tin vào các chỉ báo.
🍀 Chúc bạn luôn giữ vững tâm thế của người thắng cuộc trong mọi hoàn cảnh sàn.
#KSTRUSDT $KSTRUSDT
36


·
--
Bullish
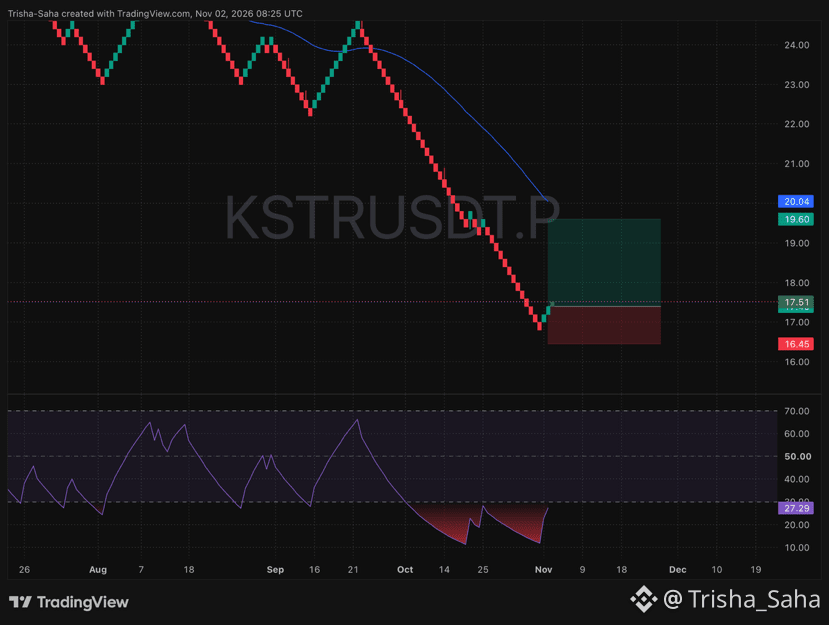
☄️ $KSTR DUMP HAS HIT ROCK BOTTOM! MASSIVE SNAP-BACK STARTING! 📈💥
📍 Trade Setup:
• Entry Zone: $17.20 – $17.51
• Stop Loss: $16.45
• Target: $19.60
📌 Chart Analysis:
• The non-stop bleeding finally hit a brick wall right around $16.80 as sellers completely ran out of coins to dump.
• Three straight green candles are firing off the floor right now, proving aggressive buyers have stepped in to flip the trend upward.
• The lower strength indicator just formed a clean double-bottom in the red bargain zone and hooked sharply up to 27.29, signaling a fast run toward the blue line.
🔐 Lock in a 100% risk-free ride by sliding your Stop Loss straight to your entry price once we hit +3% to +4% profit!
My bags are packed and my order is live. Who is banking this bounce to $19.60 with me? Drop a 🚀 below! 👇
#KSTR #KSTRUSDT #CryptoTrading #BinanceSquare
{future}(KSTRUSDT)
☄️ $KSTR DUMP HAS HIT ROCK BOTTOM! MASSIVE SNAP-BACK STARTING! 📈💥
📍 Trade Setup:
• Entry Zone: $17.20 – $17.51
• Stop Loss: $16.45
• Target: $19.60
📌 Chart Analysis:
• The non-stop bleeding finally hit a brick wall right around $16.80 as sellers completely ran out of coins to dump.
• Three straight green candles are firing off the floor right now, proving aggressive buyers have stepped in to flip the trend upward.
• The lower strength indicator just formed a clean double-bottom in the red bargain zone and hooked sharply up to 27.29, signaling a fast run toward the blue line.
🔐 Lock in a 100% risk-free ride by sliding your Stop Loss straight to your entry price once we hit +3% to +4% profit!
My bags are packed and my order is live. Who is banking this bounce to $19.60 with me? Drop a 🚀 below! 👇
#KSTR #KSTRUSDT #CryptoTrading #BinanceSquare
📍 Trade Setup:
• Entry Zone: $17.20 – $17.51
• Stop Loss: $16.45
• Target: $19.60
📌 Chart Analysis:
• The non-stop bleeding finally hit a brick wall right around $16.80 as sellers completely ran out of coins to dump.
• Three straight green candles are firing off the floor right now, proving aggressive buyers have stepped in to flip the trend upward.
• The lower strength indicator just formed a clean double-bottom in the red bargain zone and hooked sharply up to 27.29, signaling a fast run toward the blue line.
🔐 Lock in a 100% risk-free ride by sliding your Stop Loss straight to your entry price once we hit +3% to +4% profit!
My bags are packed and my order is live. Who is banking this bounce to $19.60 with me? Drop a 🚀 below! 👇
#KSTR #KSTRUSDT #CryptoTrading #BinanceSquare
191

·
--
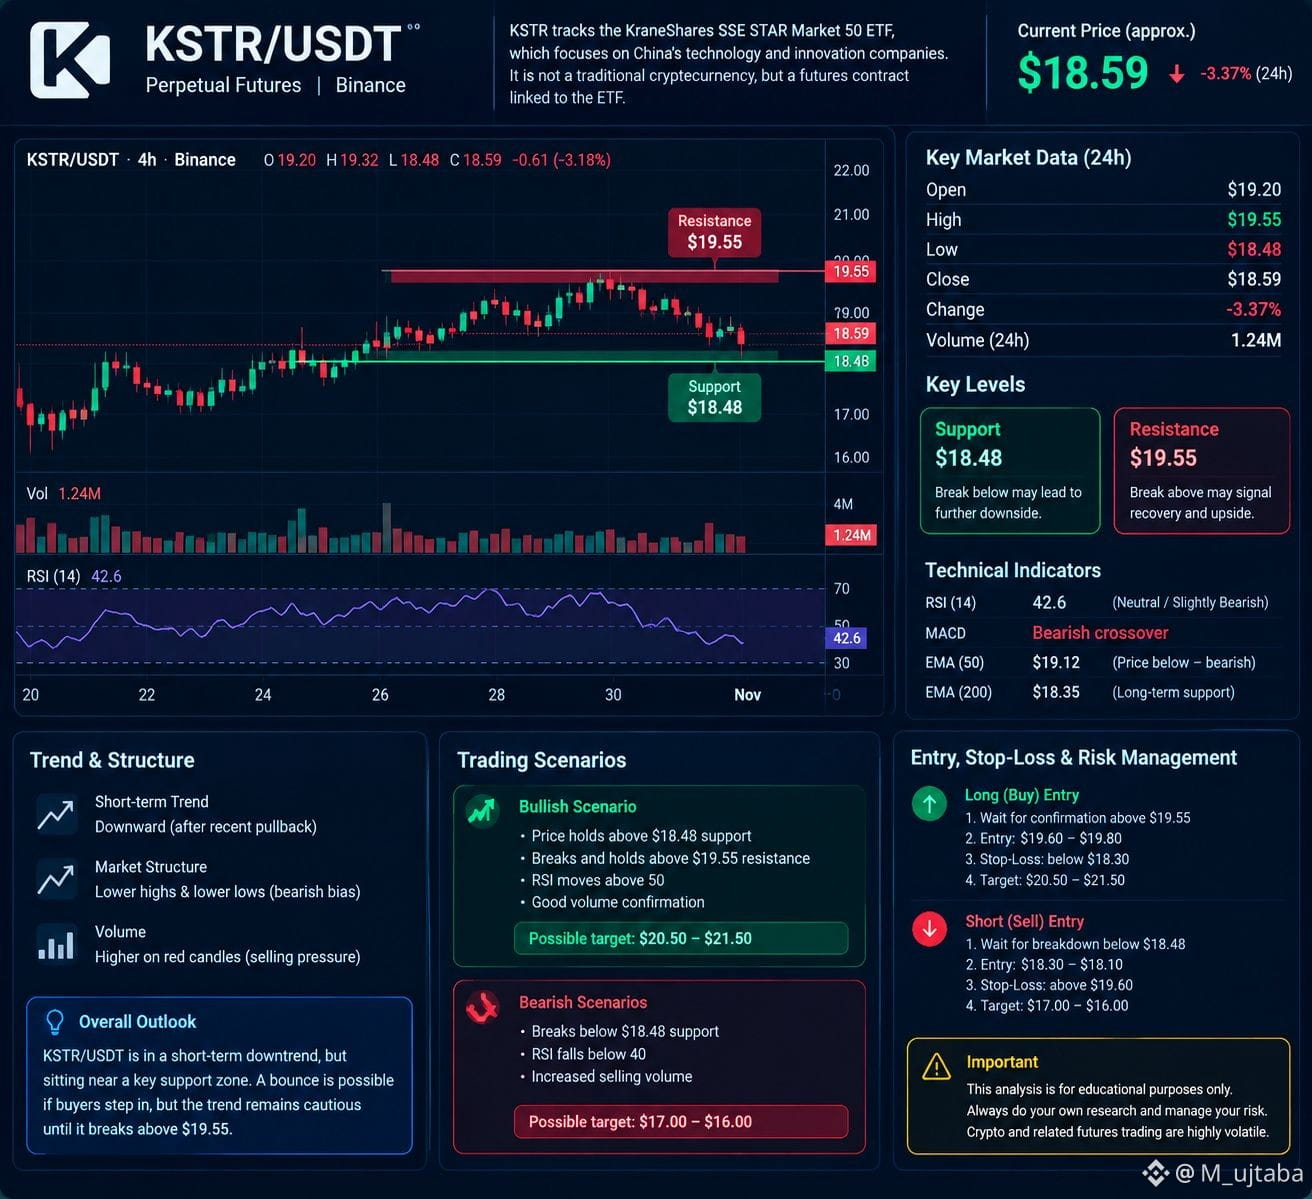
#KSTRUSDT KSTRUSDT is a market pair that needs to be checked against the exact exchange listing before making a trade. I can explain the bullish and bearish setups, but I can’t confirm a live entry price without current chart data.
Chart picture
My analysis
Short-term trend: Bearish — price has pulled back.
Support: $18.48.
Resistance: $19.55.
Bullish signal: Price breaks above $19.55 and holds.
Bearish signal: Price breaks below $18.48 and stays below.
My view: The setup looks cautious to bearish based on the illustrated chart. The levels shown are illustrative, not verified live market data, so don't use them as current trading signals without checking your exchange.
Are you planning to open a LONG or SHORT trade?
{future}(KSTRUSDT)
#KSTRUSDT KSTRUSDT is a market pair that needs to be checked against the exact exchange listing before making a trade. I can explain the bullish and bearish setups, but I can’t confirm a live entry price without current chart data.
Chart picture
My analysis
Short-term trend: Bearish — price has pulled back.
Support: $18.48.
Resistance: $19.55.
Bullish signal: Price breaks above $19.55 and holds.
Bearish signal: Price breaks below $18.48 and stays below.
My view: The setup looks cautious to bearish based on the illustrated chart. The levels shown are illustrative, not verified live market data, so don't use them as current trading signals without checking your exchange.
Are you planning to open a LONG or SHORT trade?
Chart picture
My analysis
Short-term trend: Bearish — price has pulled back.
Support: $18.48.
Resistance: $19.55.
Bullish signal: Price breaks above $19.55 and holds.
Bearish signal: Price breaks below $18.48 and stays below.
My view: The setup looks cautious to bearish based on the illustrated chart. The levels shown are illustrative, not verified live market data, so don't use them as current trading signals without checking your exchange.
Are you planning to open a LONG or SHORT trade?
207

·
--
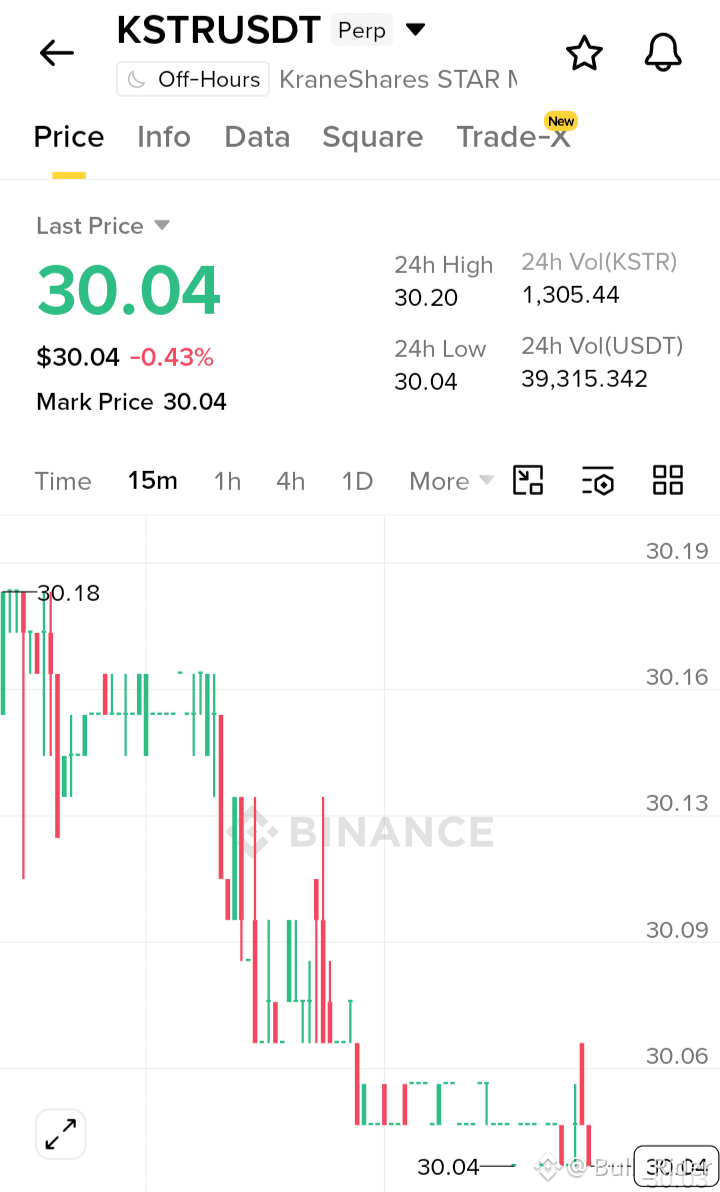
$KSTR is trading around the $30.04 level after a relatively stable session, showing signs of consolidation near short-term support. A sustained hold above this zone could attract fresh buying interest and open the door for a move toward higher resistance levels. Traders should watch for increasing volume to confirm the next directional breakout.
Target 1: $30.30
Target 2: $30.65
Target 3: $31.00
#KSTR #KSTRUSDT #Binance
$KSTR is trading around the $30.04 level after a relatively stable session, showing signs of consolidation near short-term support. A sustained hold above this zone could attract fresh buying interest and open the door for a move toward higher resistance levels. Traders should watch for increasing volume to confirm the next directional breakout.
Target 1: $30.30
Target 2: $30.65
Target 3: $31.00
#KSTR #KSTRUSDT #Binance
Target 1: $30.30
Target 2: $30.65
Target 3: $31.00
#KSTR #KSTRUSDT #Binance
1
122

·
--
$KSTR 🟢 تحليل سريع | KSTR/USDT
انخفض معدل التمويل (Funding Rate) إلى -0.1002%، ما يشير إلى هيمنة مراكز البيع (Short) بشكل ملحوظ، وهو وضع قد يزيد احتمالية حدوث Short Squeeze إذا دخل المشترون بقوة.
📊 السيناريو المتوقع: 🔹 استمرار التمويل السلبي مع ظهور حجم شراء قوي قد يدفع السعر إلى ارتداد صاعد. 🔹 أما إذا استمر الضغط البيعي وكُسرت مستويات الدعم، فقد يواصل السعر الهبوط.
✅ التوصية: الميل حاليًا إلى لونغ (Long) ولكن بعد تأكيد الارتداد وعدم الدخول قبل ظهور إشارة فنية واضحة.
⚠️ إدارة رأس المال ووقف الخسارة أمران أساسيان.
#KSTR #KSTRUSDT #Binance #Crypto
$KSTR 🟢 تحليل سريع | KSTR/USDT
انخفض معدل التمويل (Funding Rate) إلى -0.1002%، ما يشير إلى هيمنة مراكز البيع (Short) بشكل ملحوظ، وهو وضع قد يزيد احتمالية حدوث Short Squeeze إذا دخل المشترون بقوة.
📊 السيناريو المتوقع: 🔹 استمرار التمويل السلبي مع ظهور حجم شراء قوي قد يدفع السعر إلى ارتداد صاعد. 🔹 أما إذا استمر الضغط البيعي وكُسرت مستويات الدعم، فقد يواصل السعر الهبوط.
✅ التوصية: الميل حاليًا إلى لونغ (Long) ولكن بعد تأكيد الارتداد وعدم الدخول قبل ظهور إشارة فنية واضحة.
⚠️ إدارة رأس المال ووقف الخسارة أمران أساسيان.
#KSTR #KSTRUSDT #Binance #Crypto
انخفض معدل التمويل (Funding Rate) إلى -0.1002%، ما يشير إلى هيمنة مراكز البيع (Short) بشكل ملحوظ، وهو وضع قد يزيد احتمالية حدوث Short Squeeze إذا دخل المشترون بقوة.
📊 السيناريو المتوقع: 🔹 استمرار التمويل السلبي مع ظهور حجم شراء قوي قد يدفع السعر إلى ارتداد صاعد. 🔹 أما إذا استمر الضغط البيعي وكُسرت مستويات الدعم، فقد يواصل السعر الهبوط.
✅ التوصية: الميل حاليًا إلى لونغ (Long) ولكن بعد تأكيد الارتداد وعدم الدخول قبل ظهور إشارة فنية واضحة.
⚠️ إدارة رأس المال ووقف الخسارة أمران أساسيان.
#KSTR #KSTRUSDT #Binance #Crypto
1
51

·
--
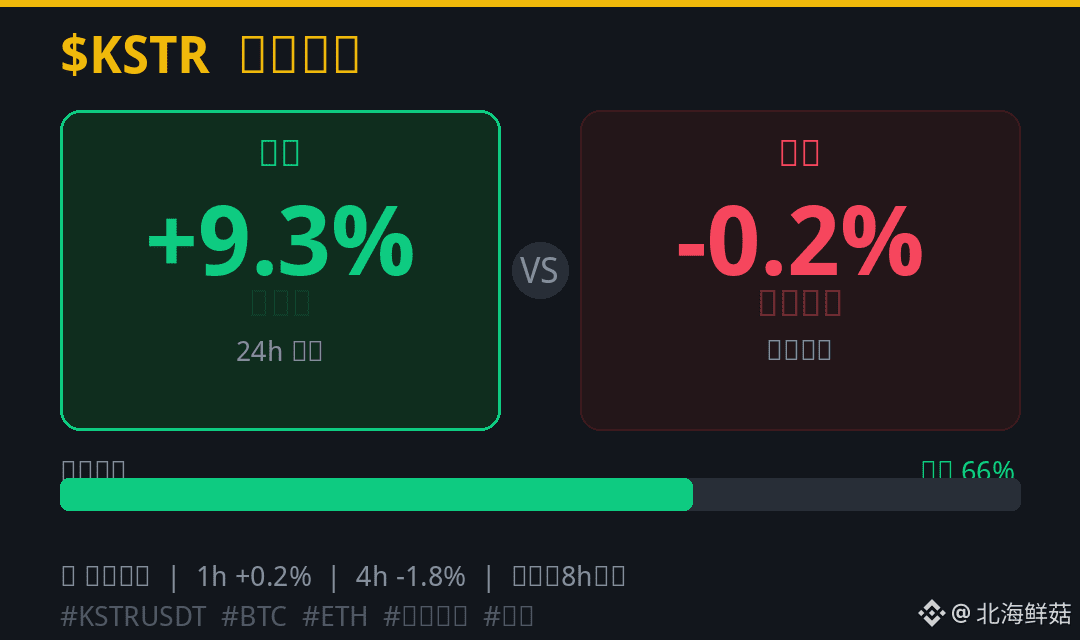
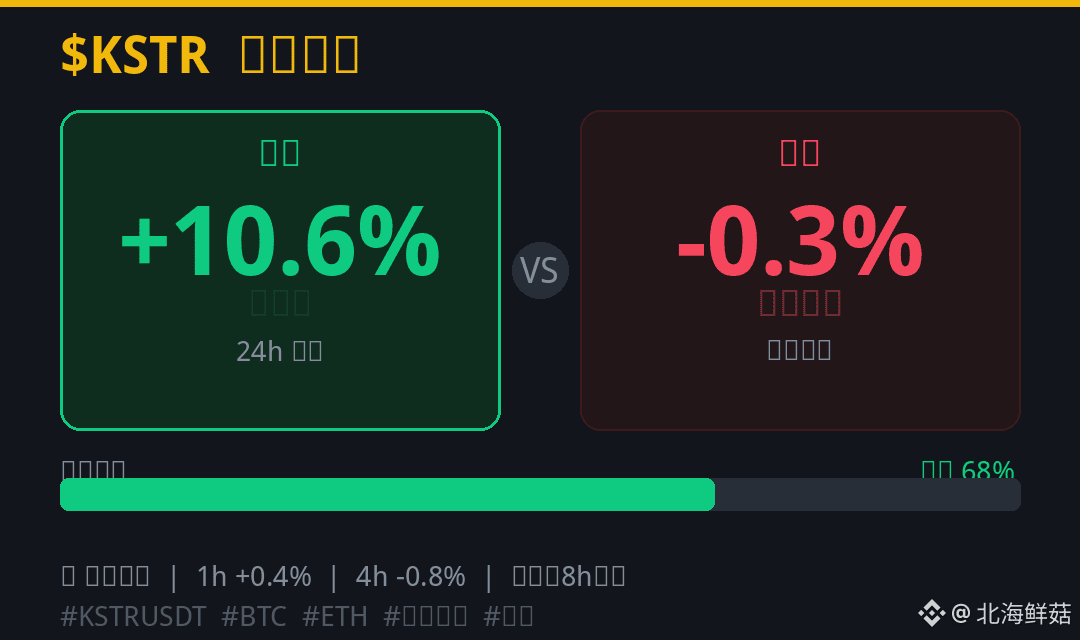
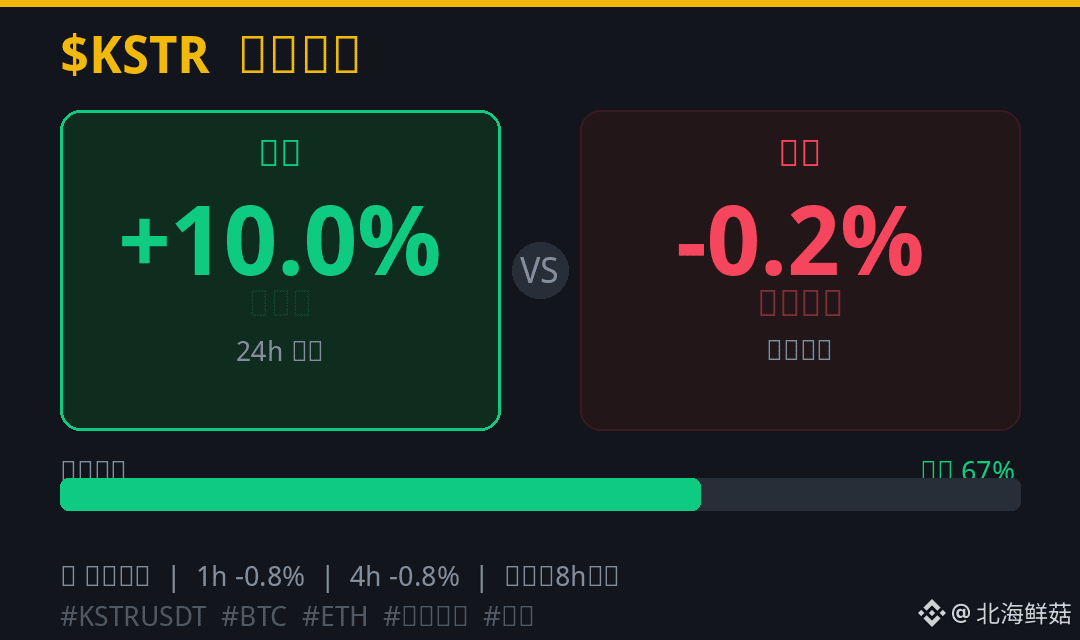
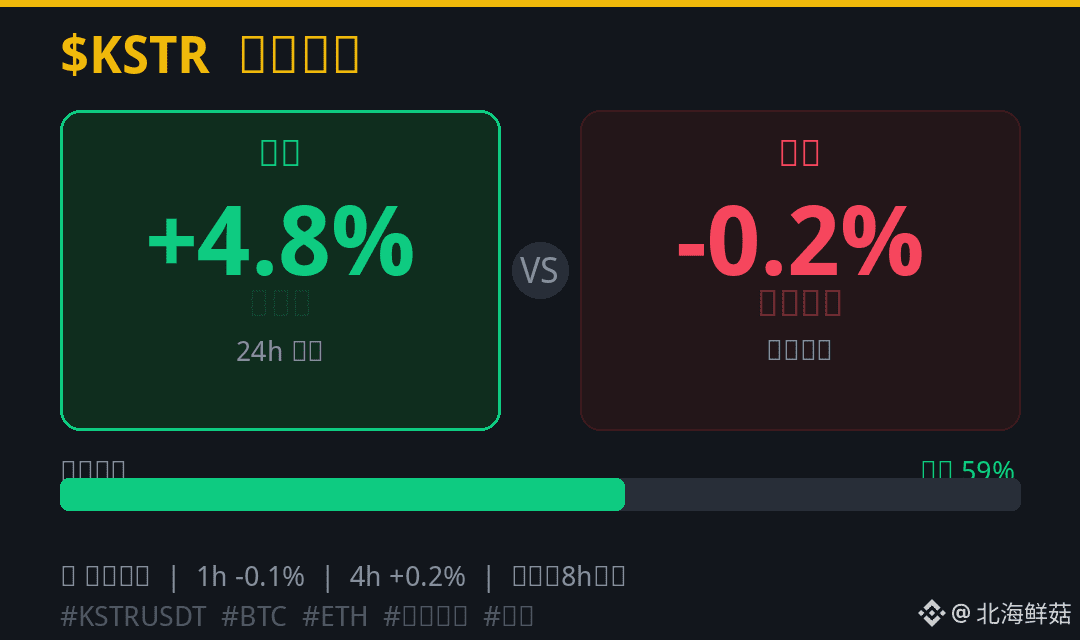
🍳 Khởi đầu ngày mới đầy áp lực mang lại niềm tuyệt vọng lớn khi nhìn sắc đỏ bao phủ.
💹 SHORT $KSTR
Entry: 27.47
TP: 26.0965 | SL: 30.217
🔧 Sự linh hoạt của smart contract cho phép tạo ra mọi ứng dụng tài chính.
📉 Nhịp điều chỉnh nhẹ vừa qua đã giúp thị trường loại bỏ đòn bẩy.
🧘 Hãy sống một cuộc sống cân bằng để có đủ sức mạnh chinh phục thị trường.
💎 Chúc bạn luôn là người tiên phong đón đầu những làn sóng lớn nhất sàn.
#KSTRUSDT $KSTRUSDT
🍳 Khởi đầu ngày mới đầy áp lực mang lại niềm tuyệt vọng lớn khi nhìn sắc đỏ bao phủ.
💹 SHORT $KSTR
Entry: 27.47
TP: 26.0965 | SL: 30.217
🔧 Sự linh hoạt của smart contract cho phép tạo ra mọi ứng dụng tài chính.
📉 Nhịp điều chỉnh nhẹ vừa qua đã giúp thị trường loại bỏ đòn bẩy.
🧘 Hãy sống một cuộc sống cân bằng để có đủ sức mạnh chinh phục thị trường.
💎 Chúc bạn luôn là người tiên phong đón đầu những làn sóng lớn nhất sàn.
#KSTRUSDT $KSTRUSDT
💹 SHORT $KSTR
Entry: 27.47
TP: 26.0965 | SL: 30.217
🔧 Sự linh hoạt của smart contract cho phép tạo ra mọi ứng dụng tài chính.
📉 Nhịp điều chỉnh nhẹ vừa qua đã giúp thị trường loại bỏ đòn bẩy.
🧘 Hãy sống một cuộc sống cân bằng để có đủ sức mạnh chinh phục thị trường.
💎 Chúc bạn luôn là người tiên phong đón đầu những làn sóng lớn nhất sàn.
#KSTRUSDT $KSTRUSDT
54

·
--
老狗扫了眼KSTR的盘面,24小时跌了1.816%,价格挂在23.25。有意思的不是跌幅本身,而是它的资金费率:0.00035515,还是正的。价格在跌,但持多仓的人还在向空头付费。在半导体/AI这条资金热衷的赛道上,这个组合不太寻常。
通常,板块内的联动看龙头脸色,但KSTR作为perp衍生品,更像是为那部分既想参与半导体叙事、又不愿直接交易现货或股期货的资金准备的杠杆工具。Funding rate为正,直接说明一件事:当前市场里,做多的头寸比做空的拥挤。多头在付钱给空头,换取持仓。但价格没撑住,反而下跌。这种多头付费却跌价的结构,老狗见过的不多,通常意味着多头仓位里,有不少是在更高位置建仓、现在硬扛亏损和费率双重成本的套牢盘。他们没割,是因为还没到止损点,或者还在赌板块回调后能拉回去。可一旦价格继续下行,这些扛单的杠杆多头就会面临双重压力:浮亏扩大,同时持续被抽资金费。
我的判断是,当前KSTR的盘面处于一个脆弱的平衡。价格下跌与正资金费率并存,暗示多头阵营内部的分歧和承压状态。这种结构下,任何向下的价格波动都可能触发一批止损盘,而止损盘的连锁反应会放大跌幅,因为承接盘可能并不厚。这不是一个适合持多的窗口,反而要警惕多头踩踏的风险。最明确的做空信号,是看到资金费率在价格阴跌中依然维持高位,那说明多头死扛的决心还在,但子弹却在持续消耗。
反共识的角度在于,不少人看到正费率会简单认为多头强势,但老狗更看重费率与价格趋势的配合度。价格涨、费率正,才是多头真强势;价格跌、费率正,更像是多头在挖坑埋自己。目前KSTR的做多逻辑是建立在半导体/AI板块长期叙事上的,但短期的流动性价格和资金成本已经背离了这个逻辑。
交易标签:#BinanceFutures #TradFi #USDⓈM #KSTR #KSTRUSDT $KSTR
老狗扫了眼KSTR的盘面,24小时跌了1.816%,价格挂在23.25。有意思的不是跌幅本身,而是它的资金费率:0.00035515,还是正的。价格在跌,但持多仓的人还在向空头付费。在半导体/AI这条资金热衷的赛道上,这个组合不太寻常。
通常,板块内的联动看龙头脸色,但KSTR作为perp衍生品,更像是为那部分既想参与半导体叙事、又不愿直接交易现货或股期货的资金准备的杠杆工具。Funding rate为正,直接说明一件事:当前市场里,做多的头寸比做空的拥挤。多头在付钱给空头,换取持仓。但价格没撑住,反而下跌。这种多头付费却跌价的结构,老狗见过的不多,通常意味着多头仓位里,有不少是在更高位置建仓、现在硬扛亏损和费率双重成本的套牢盘。他们没割,是因为还没到止损点,或者还在赌板块回调后能拉回去。可一旦价格继续下行,这些扛单的杠杆多头就会面临双重压力:浮亏扩大,同时持续被抽资金费。
我的判断是,当前KSTR的盘面处于一个脆弱的平衡。价格下跌与正资金费率并存,暗示多头阵营内部的分歧和承压状态。这种结构下,任何向下的价格波动都可能触发一批止损盘,而止损盘的连锁反应会放大跌幅,因为承接盘可能并不厚。这不是一个适合持多的窗口,反而要警惕多头踩踏的风险。最明确的做空信号,是看到资金费率在价格阴跌中依然维持高位,那说明多头死扛的决心还在,但子弹却在持续消耗。
反共识的角度在于,不少人看到正费率会简单认为多头强势,但老狗更看重费率与价格趋势的配合度。价格涨、费率正,才是多头真强势;价格跌、费率正,更像是多头在挖坑埋自己。目前KSTR的做多逻辑是建立在半导体/AI板块长期叙事上的,但短期的流动性价格和资金成本已经背离了这个逻辑。
交易标签:#BinanceFutures #TradFi #USDⓈM #KSTR #KSTRUSDT $KSTR
通常,板块内的联动看龙头脸色,但KSTR作为perp衍生品,更像是为那部分既想参与半导体叙事、又不愿直接交易现货或股期货的资金准备的杠杆工具。Funding rate为正,直接说明一件事:当前市场里,做多的头寸比做空的拥挤。多头在付钱给空头,换取持仓。但价格没撑住,反而下跌。这种多头付费却跌价的结构,老狗见过的不多,通常意味着多头仓位里,有不少是在更高位置建仓、现在硬扛亏损和费率双重成本的套牢盘。他们没割,是因为还没到止损点,或者还在赌板块回调后能拉回去。可一旦价格继续下行,这些扛单的杠杆多头就会面临双重压力:浮亏扩大,同时持续被抽资金费。
我的判断是,当前KSTR的盘面处于一个脆弱的平衡。价格下跌与正资金费率并存,暗示多头阵营内部的分歧和承压状态。这种结构下,任何向下的价格波动都可能触发一批止损盘,而止损盘的连锁反应会放大跌幅,因为承接盘可能并不厚。这不是一个适合持多的窗口,反而要警惕多头踩踏的风险。最明确的做空信号,是看到资金费率在价格阴跌中依然维持高位,那说明多头死扛的决心还在,但子弹却在持续消耗。
反共识的角度在于,不少人看到正费率会简单认为多头强势,但老狗更看重费率与价格趋势的配合度。价格涨、费率正,才是多头真强势;价格跌、费率正,更像是多头在挖坑埋自己。目前KSTR的做多逻辑是建立在半导体/AI板块长期叙事上的,但短期的流动性价格和资金成本已经背离了这个逻辑。
交易标签:#BinanceFutures #TradFi #USDⓈM #KSTR #KSTRUSDT $KSTR
133
·
--
$KSTR 现价 24.43,24h 涨 1.243%,资金费率 0.00016862,持仓量 64283。老狗先看这个组合,涨是涨了,但多头付着正费率,等于每多拿一会儿都在交利息。半导体/AI 链上美股这个方向还有资金愿意付费做多,情绪不算冷,可涨幅只给到 1.243%,说明付费的多头还没等到加速。
我的判断很直接:这种正费率加小阳线,追多不划算。正费率意味着多头比空头拥挤,后续只要价格横住,多头先被成本磨损,更别说价格小回踩。板块同业对照这轮输入里没有给出可复核数据,老狗不拿别的币来凑,单用 $KSTR 自己的信号也够用。
最强反证是 funding 0.00016862 绝对值很低,持仓量 64283 也不算极端拥挤,如果价格接下来放量重新向上,说明付费做多是有效的,我立刻放弃看回撤。二阶影响在于,这里继续拉高会让更多资金进入多头,而成本都在费率这一侧,一旦价格走平,平多盘会比追空盘更早出现,流动性可能先向下测试。
交易标签:#BinanceFutures #TradFi #USDⓈM #KSTR #KSTRUSDT $KSTR
$KSTR 现价 24.43,24h 涨 1.243%,资金费率 0.00016862,持仓量 64283。老狗先看这个组合,涨是涨了,但多头付着正费率,等于每多拿一会儿都在交利息。半导体/AI 链上美股这个方向还有资金愿意付费做多,情绪不算冷,可涨幅只给到 1.243%,说明付费的多头还没等到加速。
我的判断很直接:这种正费率加小阳线,追多不划算。正费率意味着多头比空头拥挤,后续只要价格横住,多头先被成本磨损,更别说价格小回踩。板块同业对照这轮输入里没有给出可复核数据,老狗不拿别的币来凑,单用 $KSTR 自己的信号也够用。
最强反证是 funding 0.00016862 绝对值很低,持仓量 64283 也不算极端拥挤,如果价格接下来放量重新向上,说明付费做多是有效的,我立刻放弃看回撤。二阶影响在于,这里继续拉高会让更多资金进入多头,而成本都在费率这一侧,一旦价格走平,平多盘会比追空盘更早出现,流动性可能先向下测试。
交易标签:#BinanceFutures #TradFi #USDⓈM #KSTR #KSTRUSDT $KSTR
我的判断很直接:这种正费率加小阳线,追多不划算。正费率意味着多头比空头拥挤,后续只要价格横住,多头先被成本磨损,更别说价格小回踩。板块同业对照这轮输入里没有给出可复核数据,老狗不拿别的币来凑,单用 $KSTR 自己的信号也够用。
最强反证是 funding 0.00016862 绝对值很低,持仓量 64283 也不算极端拥挤,如果价格接下来放量重新向上,说明付费做多是有效的,我立刻放弃看回撤。二阶影响在于,这里继续拉高会让更多资金进入多头,而成本都在费率这一侧,一旦价格走平,平多盘会比追空盘更早出现,流动性可能先向下测试。
交易标签:#BinanceFutures #TradFi #USDⓈM #KSTR #KSTRUSDT $KSTR
152
·
--
[M1_mag7]
老狗扫了眼 $KSTR 的盘面,24小时走了个独立行情,跌了将近2.8%,收在22.21。资金费率是0,多空暂时没分出高下,但持仓量有10.9万张,成交量91.5万。这结构有点意思,价格在动,资金费率却没反应,和美股大盘的节奏脱节了。
按M1_mag7的角度,这货本该是Mag7在链上的映射,beta应该跟着SPY或QQQ走。但现在看,2.758%的跌幅和今早美股指数期货的小幅波动对不上号,板块beta这条腿暂时瘸了。它更像是在自己挖的坑里调整,没跟着大哥们走。链上合约流动性目前看还行,OI没崩,成交量也过得去,说明筹码还没彻底散掉,但独立下跌本身就说明此刻它没被当成纯正的大盘代理来交易。
我的判断是,$KSTR 当前处于一个与美股基准脱钩的独立调整期。资金费率持平(0%)意味着杠杆多空双方都没展现出压倒性的方向意愿,这不是拥挤交易该有的状态,更像是双方都在等外部信号。反过来说,这种平衡很脆弱,任何一边的异常资金流入都能快速打破。最强反证就是,如果今晚美股开盘后Mag7集体拉升,而 $KSTR 资金费率瞬间转正且OI放大,那就说明我判断的脱钩是错的,它的锚定效应只是延迟了。二阶影响上,如果它持续走独立弱势,那些用它做Mag7指数替代的策略资金可能会被迫减仓或转向其他相关性更高的标的,做市商的对冲头寸也会相应调整。
老狗的动作很明确:先看不动。如果价格能稳在22附近,且资金费率继续保持中性或小幅转负,我可能会轻仓试多,赌它回归板块beta。但如果它带着0费率和中等OI继续阴跌,跌破21关口,那我会彻底转空,因为那意味着它的锚属性正在被市场抛弃。失效条件也简单:只要它能重新跟上美股指数日内1%以上的同向波动,哪怕资金费率还是0,我就认为脱钩状态解除,逻辑需要重写。
交易标签:#BinanceFutures #TradFi #USDⓈM #KSTR #KSTRUSDT $KSTR
[M1_mag7]
老狗扫了眼 $KSTR 的盘面,24小时走了个独立行情,跌了将近2.8%,收在22.21。资金费率是0,多空暂时没分出高下,但持仓量有10.9万张,成交量91.5万。这结构有点意思,价格在动,资金费率却没反应,和美股大盘的节奏脱节了。
按M1_mag7的角度,这货本该是Mag7在链上的映射,beta应该跟着SPY或QQQ走。但现在看,2.758%的跌幅和今早美股指数期货的小幅波动对不上号,板块beta这条腿暂时瘸了。它更像是在自己挖的坑里调整,没跟着大哥们走。链上合约流动性目前看还行,OI没崩,成交量也过得去,说明筹码还没彻底散掉,但独立下跌本身就说明此刻它没被当成纯正的大盘代理来交易。
我的判断是,$KSTR 当前处于一个与美股基准脱钩的独立调整期。资金费率持平(0%)意味着杠杆多空双方都没展现出压倒性的方向意愿,这不是拥挤交易该有的状态,更像是双方都在等外部信号。反过来说,这种平衡很脆弱,任何一边的异常资金流入都能快速打破。最强反证就是,如果今晚美股开盘后Mag7集体拉升,而 $KSTR 资金费率瞬间转正且OI放大,那就说明我判断的脱钩是错的,它的锚定效应只是延迟了。二阶影响上,如果它持续走独立弱势,那些用它做Mag7指数替代的策略资金可能会被迫减仓或转向其他相关性更高的标的,做市商的对冲头寸也会相应调整。
老狗的动作很明确:先看不动。如果价格能稳在22附近,且资金费率继续保持中性或小幅转负,我可能会轻仓试多,赌它回归板块beta。但如果它带着0费率和中等OI继续阴跌,跌破21关口,那我会彻底转空,因为那意味着它的锚属性正在被市场抛弃。失效条件也简单:只要它能重新跟上美股指数日内1%以上的同向波动,哪怕资金费率还是0,我就认为脱钩状态解除,逻辑需要重写。
交易标签:#BinanceFutures #TradFi #USDⓈM #KSTR #KSTRUSDT $KSTR
老狗扫了眼 $KSTR 的盘面,24小时走了个独立行情,跌了将近2.8%,收在22.21。资金费率是0,多空暂时没分出高下,但持仓量有10.9万张,成交量91.5万。这结构有点意思,价格在动,资金费率却没反应,和美股大盘的节奏脱节了。
按M1_mag7的角度,这货本该是Mag7在链上的映射,beta应该跟着SPY或QQQ走。但现在看,2.758%的跌幅和今早美股指数期货的小幅波动对不上号,板块beta这条腿暂时瘸了。它更像是在自己挖的坑里调整,没跟着大哥们走。链上合约流动性目前看还行,OI没崩,成交量也过得去,说明筹码还没彻底散掉,但独立下跌本身就说明此刻它没被当成纯正的大盘代理来交易。
我的判断是,$KSTR 当前处于一个与美股基准脱钩的独立调整期。资金费率持平(0%)意味着杠杆多空双方都没展现出压倒性的方向意愿,这不是拥挤交易该有的状态,更像是双方都在等外部信号。反过来说,这种平衡很脆弱,任何一边的异常资金流入都能快速打破。最强反证就是,如果今晚美股开盘后Mag7集体拉升,而 $KSTR 资金费率瞬间转正且OI放大,那就说明我判断的脱钩是错的,它的锚定效应只是延迟了。二阶影响上,如果它持续走独立弱势,那些用它做Mag7指数替代的策略资金可能会被迫减仓或转向其他相关性更高的标的,做市商的对冲头寸也会相应调整。
老狗的动作很明确:先看不动。如果价格能稳在22附近,且资金费率继续保持中性或小幅转负,我可能会轻仓试多,赌它回归板块beta。但如果它带着0费率和中等OI继续阴跌,跌破21关口,那我会彻底转空,因为那意味着它的锚属性正在被市场抛弃。失效条件也简单:只要它能重新跟上美股指数日内1%以上的同向波动,哪怕资金费率还是0,我就认为脱钩状态解除,逻辑需要重写。
交易标签:#BinanceFutures #TradFi #USDⓈM #KSTR #KSTRUSDT $KSTR
152
Log in to explore more content
Join global crypto users on Binance Square
⚡️ Get latest and useful information about crypto.
💬 Trusted by the world’s largest crypto exchange.
👍 Discover real insights from verified creators.
Email / Phone number
Trending Topics
1
#JobsReportRaisesHikeOdds
318,605 views
2,430 Discussing
2
#CPITestsDecemberRateOutlook
48,664 views
579 Discussing
3
#BitcoinRebounds$75KAsChipsLead
25,915 views
253 Discussing
4
#US Data Center Rules May Constrain AI Expansion
47,678 views
180 Discussing
5
#ARKPlans14ThematicETFsCoveringAIAndTokenizedMarkets
593 views
28 Discussing
6
#WillAnthropicListOnTime
84,153 views
976 Discussing
7
#WillUS-IranTensionsBoostSafe-HavenDemand?
24,453 views
243 Discussing
8
#BitcoinETFsSee$412MNetOutflows
6,265 views
47 Discussing
9
#HKSFCPlansToRestrictCryptoAndExchangeTerms
21,858 views
339 Discussing
10
#TradFiForBeginners
51,389 views
754 Discussing