Binance Square
#etf

etf

990.8M views
5.4M Discussing
0xcris
·
--
🚨 Bitcoin ETFs Bleed $465M In Just Two Days! - U.S. spot Bitcoin ETFs saw a massive $465 million in outflows over the last two sessions, reversing a recent positive trend. - This sell-off breaks a strong seven-day streak of inflows that had brought over $1 billion into the funds, with even BlackRock's IBIT seeing withdrawals. - For traders, this signals rising caution in the market, likely driven by fears of Fed rate hikes and renewed geopolitical tensions, putting pressure on the BTC price. What's your Bitcoin price prediction for the end of the month? Share your thoughts below! 👇 $BTC #Bitcoin #CryptoNews #ETF Disclaimer: This is not financial advice. DYOR.
🚨 Bitcoin ETFs Bleed $465M In Just Two Days!

- U.S. spot Bitcoin ETFs saw a massive $465 million in outflows over the last two sessions, reversing a recent positive trend.

- This sell-off breaks a strong seven-day streak of inflows that had brought over $1 billion into the funds, with even BlackRock's IBIT seeing withdrawals.

- For traders, this signals rising caution in the market, likely driven by fears of Fed rate hikes and renewed geopolitical tensions, putting pressure on the BTC price.

What's your Bitcoin price prediction for the end of the month? Share your thoughts below! 👇

$BTC

#Bitcoin #CryptoNews #ETF

Disclaimer: This is not financial advice. DYOR.
·
--
🚨 Why Did Bitcoin ETFs Suddenly Bleed $465 Million? - Mixed Signals: Despite the late-week drama, US spot Bitcoin ETFs still secured a third consecutive week of net inflows, showing sustained institutional demand. - The Outflow Shock: However, the end of the week saw a major reversal with a massive $465 million pulled out. The majority of this, nearly $415 million, came from BlackRock's IBIT fund alone. - What It Means: This indicates significant profit-taking or a potential short-term shift in sentiment from major players, even as the overall weekly trend remained positive. Is this a temporary dip or a sign of a bigger correction for $BTC? Share your thoughts below! 👇 $BTC $ETH #Bitcoin #ETF #CryptoNews Disclaimer: This is not financial advice. DYOR.
🚨 Why Did Bitcoin ETFs Suddenly Bleed $465 Million?

- Mixed Signals: Despite the late-week drama, US spot Bitcoin ETFs still secured a third consecutive week of net inflows, showing sustained institutional demand.

- The Outflow Shock: However, the end of the week saw a major reversal with a massive $465 million pulled out. The majority of this, nearly $415 million, came from BlackRock's IBIT fund alone.

- What It Means: This indicates significant profit-taking or a potential short-term shift in sentiment from major players, even as the overall weekly trend remained positive.

Is this a temporary dip or a sign of a bigger correction for $BTC ? Share your thoughts below! 👇

$BTC $ETH #Bitcoin #ETF #CryptoNews

Disclaimer: This is not financial advice. DYOR.
🚨 JUST IN: $SOL ETFs recorded $7.1M in net inflows last week. Institutional capital continues flowing into Solana, signaling growing confidence in its long-term potential. Smart money isn't waiting on the sidelines... it's accumulating. SOL could be gearing up for its next major move. ⚡️📈 #solana #sol #crypto #etf $DEXE {future}(DEXEUSDT) $LAB SOL {future}(SOLUSDT)
🚨 JUST IN: $SOL ETFs recorded $7.1M in net inflows last week.

Institutional capital continues flowing into Solana, signaling growing confidence in its long-term potential.

Smart money isn't waiting on the sidelines... it's accumulating.

SOL could be gearing up for its next major move. ⚡️📈

#solana #sol #crypto #etf $DEXE
$LAB SOL
·
--
🚨 ETH ETF INFLOWS CRUSHING BITCOIN'S? - Core Event: Newly launched Ethereum ETFs are seeing significant net inflows, while Bitcoin ETFs have recently experienced periods of net outflows. - Market Implications: This signals a potential rotation of institutional capital, with investors moving from the more established BTC products to the fresh opportunity in ETH. - Why It Matters: This "flippening" in ETF flows could be an early bullish indicator for $ETH. With the broader market turning green, this new wave of capital could drive its price higher relative to $BTC. What's your price target for ETH by the end of this month? Drop your prediction in the comments! 👇 $ETH $BTC #CryptoNews #ETF #Altcoins Disclaimer: This is not financial advice. DYOR.
🚨 ETH ETF INFLOWS CRUSHING BITCOIN'S?

- Core Event: Newly launched Ethereum ETFs are seeing significant net inflows, while Bitcoin ETFs have recently experienced periods of net outflows.

- Market Implications: This signals a potential rotation of institutional capital, with investors moving from the more established BTC products to the fresh opportunity in ETH.

- Why It Matters: This "flippening" in ETF flows could be an early bullish indicator for $ETH . With the broader market turning green, this new wave of capital could drive its price higher relative to $BTC .

What's your price target for ETH by the end of this month? Drop your prediction in the comments! 👇

$ETH $BTC
#CryptoNews #ETF #Altcoins

Disclaimer: This is not financial advice. DYOR.
Bitcoin Price Prediction: ETF Inflow Streak Ends and Turns Negative $BTC Bitcoin's price remained steady around 65,077 despite reports that the recent streak of positive inflows into spot Bitcoin exchange‑traded funds (ETFs) has ended and turned negative, according to market observers. Analysts note that the ETF inflow trend had been a notable driver of short‑term price momentum earlier in the year, with consecutive weeks of net new money flowing into the products. The end of the ETF inflow streak matters because it tests the hypothesis that institutional fund flows are a primary short‑term driver of Bitcoin's price. Market participants are monitoring several key data points in the coming days. First, the daily ETF flow reports will reveal whether the negative reading is an isolated event or the start of a longer trend. $BTC #BTC #ETF #CryptoNews
Bitcoin Price Prediction: ETF Inflow Streak Ends and Turns Negative $BTC

Bitcoin's price remained steady around 65,077 despite reports that the recent streak of positive inflows into spot Bitcoin exchange‑traded funds (ETFs) has ended and turned negative, according to market observers.

Analysts note that the ETF inflow trend had been a notable driver of short‑term price momentum earlier in the year, with consecutive weeks of net new money flowing into the products.

The end of the ETF inflow streak matters because it tests the hypothesis that institutional fund flows are a primary short‑term driver of Bitcoin's price.

Market participants are monitoring several key data points in the coming days. First, the daily ETF flow reports will reveal whether the negative reading is an isolated event or the start of a longer trend.

$BTC #BTC #ETF #CryptoNews
Market sentiment shifting Bitcoin ETFs recorded $465 million in outflows over two days, breaking a recent $1 billion inflow streak. BlackRock's IBIT led the exit as geopolitical tensions and Fed rate-hike concerns impacted investor sentiment. #Bitcoin #ETF ‎
Market sentiment shifting

Bitcoin ETFs recorded $465 million in outflows over two days, breaking a recent $1 billion inflow streak. BlackRock's IBIT led the exit as geopolitical tensions and Fed rate-hike concerns impacted investor sentiment.

#Bitcoin #ETF
BTC-2.28%
IBITETF-0.96%
How an Alabama RIA is playing the crypto ETF rotation $XRP EverSource Wealth Advisors, a Birmingham-based registered investment advisor overseeing 3. 6 billion in client assets, disclosed new positions in XRP exchange-traded fu… EverSource is not a crypto-native firm. It is a traditional wealth manager serving high-net-worth clients from a suburban Birmingham office park. The XRP ETF positions arrive at a moment when institutional adoption of the products is accelerating but still concentrated among a handful of large filers. The Q2 portfolio data tells a nuanced story about conviction. $XRP #XRP #ETF #CryptoNews
How an Alabama RIA is playing the crypto ETF rotation $XRP

EverSource Wealth Advisors, a Birmingham-based registered investment advisor overseeing 3. 6 billion in client assets, disclosed new positions in XRP exchange-traded fu…

EverSource is not a crypto-native firm. It is a traditional wealth manager serving high-net-worth clients from a suburban Birmingham office park.

The XRP ETF positions arrive at a moment when institutional adoption of the products is accelerating but still concentrated among a handful of large filers.

The Q2 portfolio data tells a nuanced story about conviction.

$XRP #XRP #ETF #CryptoNews
Last week, Bitcoin looked calm at $64,000, but the ETF tape was telling a much quieter story. For traders, this is the annoying zone: price holds up, headlines still say “inflows,” but momentum feels thin. That’s where FOMO entries can get trapped if demand is not actually expanding. Here’s the case study. Bitcoin ETF volume fell to $8.05 billion for the week, the lowest full-week level since October 2024. The strange part is that this happened while ETFs still recorded a third straight week of inflows, which sounds bullish on the surface for $BTC. But the flow breakdown matters. Around $499.1 million came in during the first three sessions, then $225.2 million left on Thursday and another $240.1 million left on Friday. By the end of the week, net inflows were only $33.8 million, meaning most of the early demand got wiped out before the close. This reminds me of past ETF-driven stretches where the headline number looked strong, but follow-through faded fast. Compared with earlier $BTC accumulation phases, this looks less like aggressive institutional buying and more like cautious rotation. If liquidity stays weak, even strong names like $ETH and $SOL may struggle to get clean upside confirmation from Bitcoin leadership. Is this just a quiet reset before demand returns, or the first sign ETF buyers are losing conviction? #Bitcoin #CryptoMarkets #ETFಾಂ
Last week, Bitcoin looked calm at $64,000, but the ETF tape was telling a much quieter story.

For traders, this is the annoying zone: price holds up, headlines still say “inflows,” but momentum feels thin. That’s where FOMO entries can get trapped if demand is not actually expanding.

Here’s the case study. Bitcoin ETF volume fell to $8.05 billion for the week, the lowest full-week level since October 2024. The strange part is that this happened while ETFs still recorded a third straight week of inflows, which sounds bullish on the surface for $BTC .

But the flow breakdown matters. Around $499.1 million came in during the first three sessions, then $225.2 million left on Thursday and another $240.1 million left on Friday. By the end of the week, net inflows were only $33.8 million, meaning most of the early demand got wiped out before the close.

This reminds me of past ETF-driven stretches where the headline number looked strong, but follow-through faded fast. Compared with earlier $BTC accumulation phases, this looks less like aggressive institutional buying and more like cautious rotation. If liquidity stays weak, even strong names like $ETH and $SOL may struggle to get clean upside confirmation from Bitcoin leadership.

Is this just a quiet reset before demand returns, or the first sign ETF buyers are losing conviction?

#Bitcoin #CryptoMarkets #ETFಾಂ
CRYPTOCURRENCY ETFs OVERVIEW (7D) #iShares #Bitwise #21Shares #InvescoGalaxy    Total Assets under management: $94.84B Total Net Flow: + $169.00M #ETF #Bitcoin $BTC #Ethereum $ETH
CRYPTOCURRENCY ETFs OVERVIEW (7D)

#iShares #Bitwise #21Shares #InvescoGalaxy

Total Assets under management: $94.84B
Total Net Flow: + $169.00M

#ETF #Bitcoin $BTC #Ethereum $ETH
BTC-2.28%
ETH-2.88%
ETHAETF+1.21%
The quietest full week for Bitcoin ETF volume since October 2024 is happening while $BTC still trades near $64,000. That’s the kind of setup that traps impatient traders. You see price holding up, feel FOMO creeping in, and forget that low volume can make every breakout look more convincing than it really is. ETF volume is basically a window into institutional demand. When it drops to multi-month lows, it doesn’t automatically mean “bear market,” but it does mean the market has less fuel behind the current move. I’ve seen this before in past cycles: price stays strong on the surface, traders get comfortable, then thin liquidity starts punishing late entries. The lesson is simple. When $BTC is steady but ETF activity is fading, don’t just stare at price. Watch whether buyers return with volume, or whether the market starts rotating risk into names like $ETH and $SOL without real conviction. Quiet markets are where bad habits get expensive. Are you treating this as consolidation before the next leg, or a warning sign that demand is cooling? #Bitcoin #CryptoTrading #ETF
The quietest full week for Bitcoin ETF volume since October 2024 is happening while $BTC still trades near $64,000.

That’s the kind of setup that traps impatient traders. You see price holding up, feel FOMO creeping in, and forget that low volume can make every breakout look more convincing than it really is.

ETF volume is basically a window into institutional demand. When it drops to multi-month lows, it doesn’t automatically mean “bear market,” but it does mean the market has less fuel behind the current move. I’ve seen this before in past cycles: price stays strong on the surface, traders get comfortable, then thin liquidity starts punishing late entries.

The lesson is simple. When $BTC is steady but ETF activity is fading, don’t just stare at price. Watch whether buyers return with volume, or whether the market starts rotating risk into names like $ETH and $SOL without real conviction. Quiet markets are where bad habits get expensive.

Are you treating this as consolidation before the next leg, or a warning sign that demand is cooling? #Bitcoin #CryptoTrading #ETF
Last week, Bitcoin gave us a classic “price looks fine, demand looks tired” setup. The hard part for traders is knowing whether weak volume is just noise or the first sign that buyers are stepping back. That’s where people get trapped chasing $BTC at the top or exiting too early before the next leg. Here’s the case study: Bitcoin ETF volume fell to its lowest full week since October 2024, even while $BTC was still trading around $64,000. Weekly volume came in at $8.05 billion, but the real story was the mismatch between inflows and conviction. ETFs had their third straight week of inflows, with about $499.1 million entering during the first three sessions. Then the tone flipped. Thursday saw $225.2 million leave, followed by another $240.1 million out on Friday, leaving the week with just $33.8 million in net inflows. Compared with earlier ETF-driven rallies, this looks less like aggressive accumulation and more like hesitant demand. When $BTC led past cycles, strong ETF volume often pulled liquidity into majors like $ETH and $SOL too. This time, the market feels more cautious, almost like buyers are waiting for confirmation instead of forcing the breakout. Is this just a quiet reset before the next move, or an early warning that ETF momentum is fading? #Bitcoin #CryptoMarkets #ETF
Last week, Bitcoin gave us a classic “price looks fine, demand looks tired” setup.

The hard part for traders is knowing whether weak volume is just noise or the first sign that buyers are stepping back. That’s where people get trapped chasing $BTC at the top or exiting too early before the next leg.

Here’s the case study: Bitcoin ETF volume fell to its lowest full week since October 2024, even while $BTC was still trading around $64,000. Weekly volume came in at $8.05 billion, but the real story was the mismatch between inflows and conviction.

ETFs had their third straight week of inflows, with about $499.1 million entering during the first three sessions. Then the tone flipped. Thursday saw $225.2 million leave, followed by another $240.1 million out on Friday, leaving the week with just $33.8 million in net inflows.

Compared with earlier ETF-driven rallies, this looks less like aggressive accumulation and more like hesitant demand. When $BTC led past cycles, strong ETF volume often pulled liquidity into majors like $ETH and $SOL too. This time, the market feels more cautious, almost like buyers are waiting for confirmation instead of forcing the breakout.

Is this just a quiet reset before the next move, or an early warning that ETF momentum is fading?

#Bitcoin #CryptoMarkets #ETF
Here’s what happened when Bitcoin ETF volume went quiet while $BTC was still sitting near $64,000. The tricky part for traders is that “inflows” can look bullish on the surface, but weak participation often tells a different story. That’s where FOMO entries get dangerous, especially when the tape looks green but conviction is fading. Bitcoin ETF volume fell to its lowest full week since October 2024, with only $8.05 billion traded across the week. The strange part? This happened during a third straight week of inflows, which usually sounds like healthy demand. But the case study gets interesting when you zoom in. Around $499.1 million came in during the first three sessions, then $225.2 million left on Thursday and another $240.1 million exited on Friday. Net result: weekly inflows collapsed to just $33.8 million. That feels similar to past post-hype phases, where the headline stays bullish but liquidity quietly thins out. We saw versions of this after earlier $BTC ETF excitement, and even around $ETH narratives, where the first wave brings attention but the second wave needs real follow-through. Without that, price can drift even if the story still sounds strong. What’s your take on $BTC here: quiet accumulation, or demand starting to cool? #Bitcoin #CryptoMarkets #ETF
Here’s what happened when Bitcoin ETF volume went quiet while $BTC was still sitting near $64,000.

The tricky part for traders is that “inflows” can look bullish on the surface, but weak participation often tells a different story. That’s where FOMO entries get dangerous, especially when the tape looks green but conviction is fading.

Bitcoin ETF volume fell to its lowest full week since October 2024, with only $8.05 billion traded across the week. The strange part? This happened during a third straight week of inflows, which usually sounds like healthy demand.

But the case study gets interesting when you zoom in. Around $499.1 million came in during the first three sessions, then $225.2 million left on Thursday and another $240.1 million exited on Friday. Net result: weekly inflows collapsed to just $33.8 million.

That feels similar to past post-hype phases, where the headline stays bullish but liquidity quietly thins out. We saw versions of this after earlier $BTC ETF excitement, and even around $ETH narratives, where the first wave brings attention but the second wave needs real follow-through. Without that, price can drift even if the story still sounds strong.

What’s your take on $BTC here: quiet accumulation, or demand starting to cool? #Bitcoin #CryptoMarkets #ETF
$XRP is trading around $1.10 today, up slightly over the past 24 hours after a choppy few weeks for the wider crypto market. But the more interesting story is under the hood. Spot XRP ETFs have shown real resilience lately — logging their biggest daily inflow of July at $6.78M even as $XRP dipped, and pushing cumulative inflows since the November 2025 launch to nearly $1.49B across 7 US-listed funds (Bitwise, Franklin Templeton, Canary Capital, Grayscale and others). On-chain data adds to the picture: Binance whale outflows fell to an 885M XRP low, the quietest large-holder activity in over two months — a sign sellers may be stepping back. The $XRP Ledger also just crossed 8 million activated accounts, a steady usage milestone. 📊 Verdict: Neutral-to-Bullish. Recent price action looks tied to broader market weakness (BTC and ETH ETFs have swung too), not XRP-specific selling. Sustained ETF demand plus cooling whale outflows could set up a bounce — but a real breakout still needs confirmation. Are you buying this dip or waiting it out? 👇 {future}(XRPUSDT) #XRP #CryptoNews #ETF
$XRP is trading around $1.10 today, up slightly over the past 24 hours after a choppy few weeks for the wider crypto market. But the more interesting story is under the hood.

Spot XRP ETFs have shown real resilience lately — logging their biggest daily inflow of July at $6.78M even as $XRP dipped, and pushing cumulative inflows since the November 2025 launch to nearly $1.49B across 7 US-listed funds (Bitwise, Franklin Templeton, Canary Capital, Grayscale and others).

On-chain data adds to the picture: Binance whale outflows fell to an 885M XRP low, the quietest large-holder activity in over two months — a sign sellers may be stepping back. The $XRP Ledger also just crossed 8 million activated accounts, a steady usage milestone.

📊 Verdict: Neutral-to-Bullish. Recent price action looks tied to broader market weakness (BTC and ETH ETFs have swung too), not XRP-specific selling. Sustained ETF demand plus cooling whale outflows could set up a bounce — but a real breakout still needs confirmation.

Are you buying this dip or waiting it out? 👇
#XRP #CryptoNews #ETF
Record Capital Surge in XRP ETFs Fails to Overcome Spot Market $XRP Institutional demand for XRP-backed financial instruments continues to hit new milestones, as capital flows into exchange-traded funds tracking the asset set another record. However, the impressive performance in the fund market contrasts sharply with behavior on spot crypto exchanges. In recent trading, XRP attempted a technical breakout aimed at pushing past recent range bounds. That upward momentum was swiftly rejected, halting the asset's rally in its tracks and returning price action to familiar territory. The failure to sustain a higher move points to a primary challenge currently facing the token: heavy overhead supply and persistent liquidations on spot trading venues. $XRP #XRP #ETF #CryptoNews
Record Capital Surge in XRP ETFs Fails to Overcome Spot Market $XRP

Institutional demand for XRP-backed financial instruments continues to hit new milestones, as capital flows into exchange-traded funds tracking the asset set another record.

However, the impressive performance in the fund market contrasts sharply with behavior on spot crypto exchanges.

In recent trading, XRP attempted a technical breakout aimed at pushing past recent range bounds. That upward momentum was swiftly rejected, halting the asset's rally in its tracks and returning price action to familiar territory.

The failure to sustain a higher move points to a primary challenge currently facing the token: heavy overhead supply and persistent liquidations on spot trading venues.

$XRP #XRP #ETF #CryptoNews
July’s ETF tape is better, but not healed. Inflows have returned in bursts, yet they still lean heavily on a few big funds; that usually marks a recovery in sentiment, not a full regime shift. If breadth improves beyond IBIT and the week-to-week swings soften, the market can finally claim a sturdier floor. $IBIT.ETF $BTC #ReadMeI033 #CoinVahini #Bitcoin #ETF
July’s ETF tape is better, but not healed. Inflows have returned in bursts, yet they still lean heavily on a few big funds; that usually marks a recovery in sentiment, not a full regime shift. If breadth improves beyond IBIT and the week-to-week swings soften, the market can finally claim a sturdier floor.

$IBIT.ETF $BTC #ReadMeI033 #CoinVahini #Bitcoin #ETF
Verified
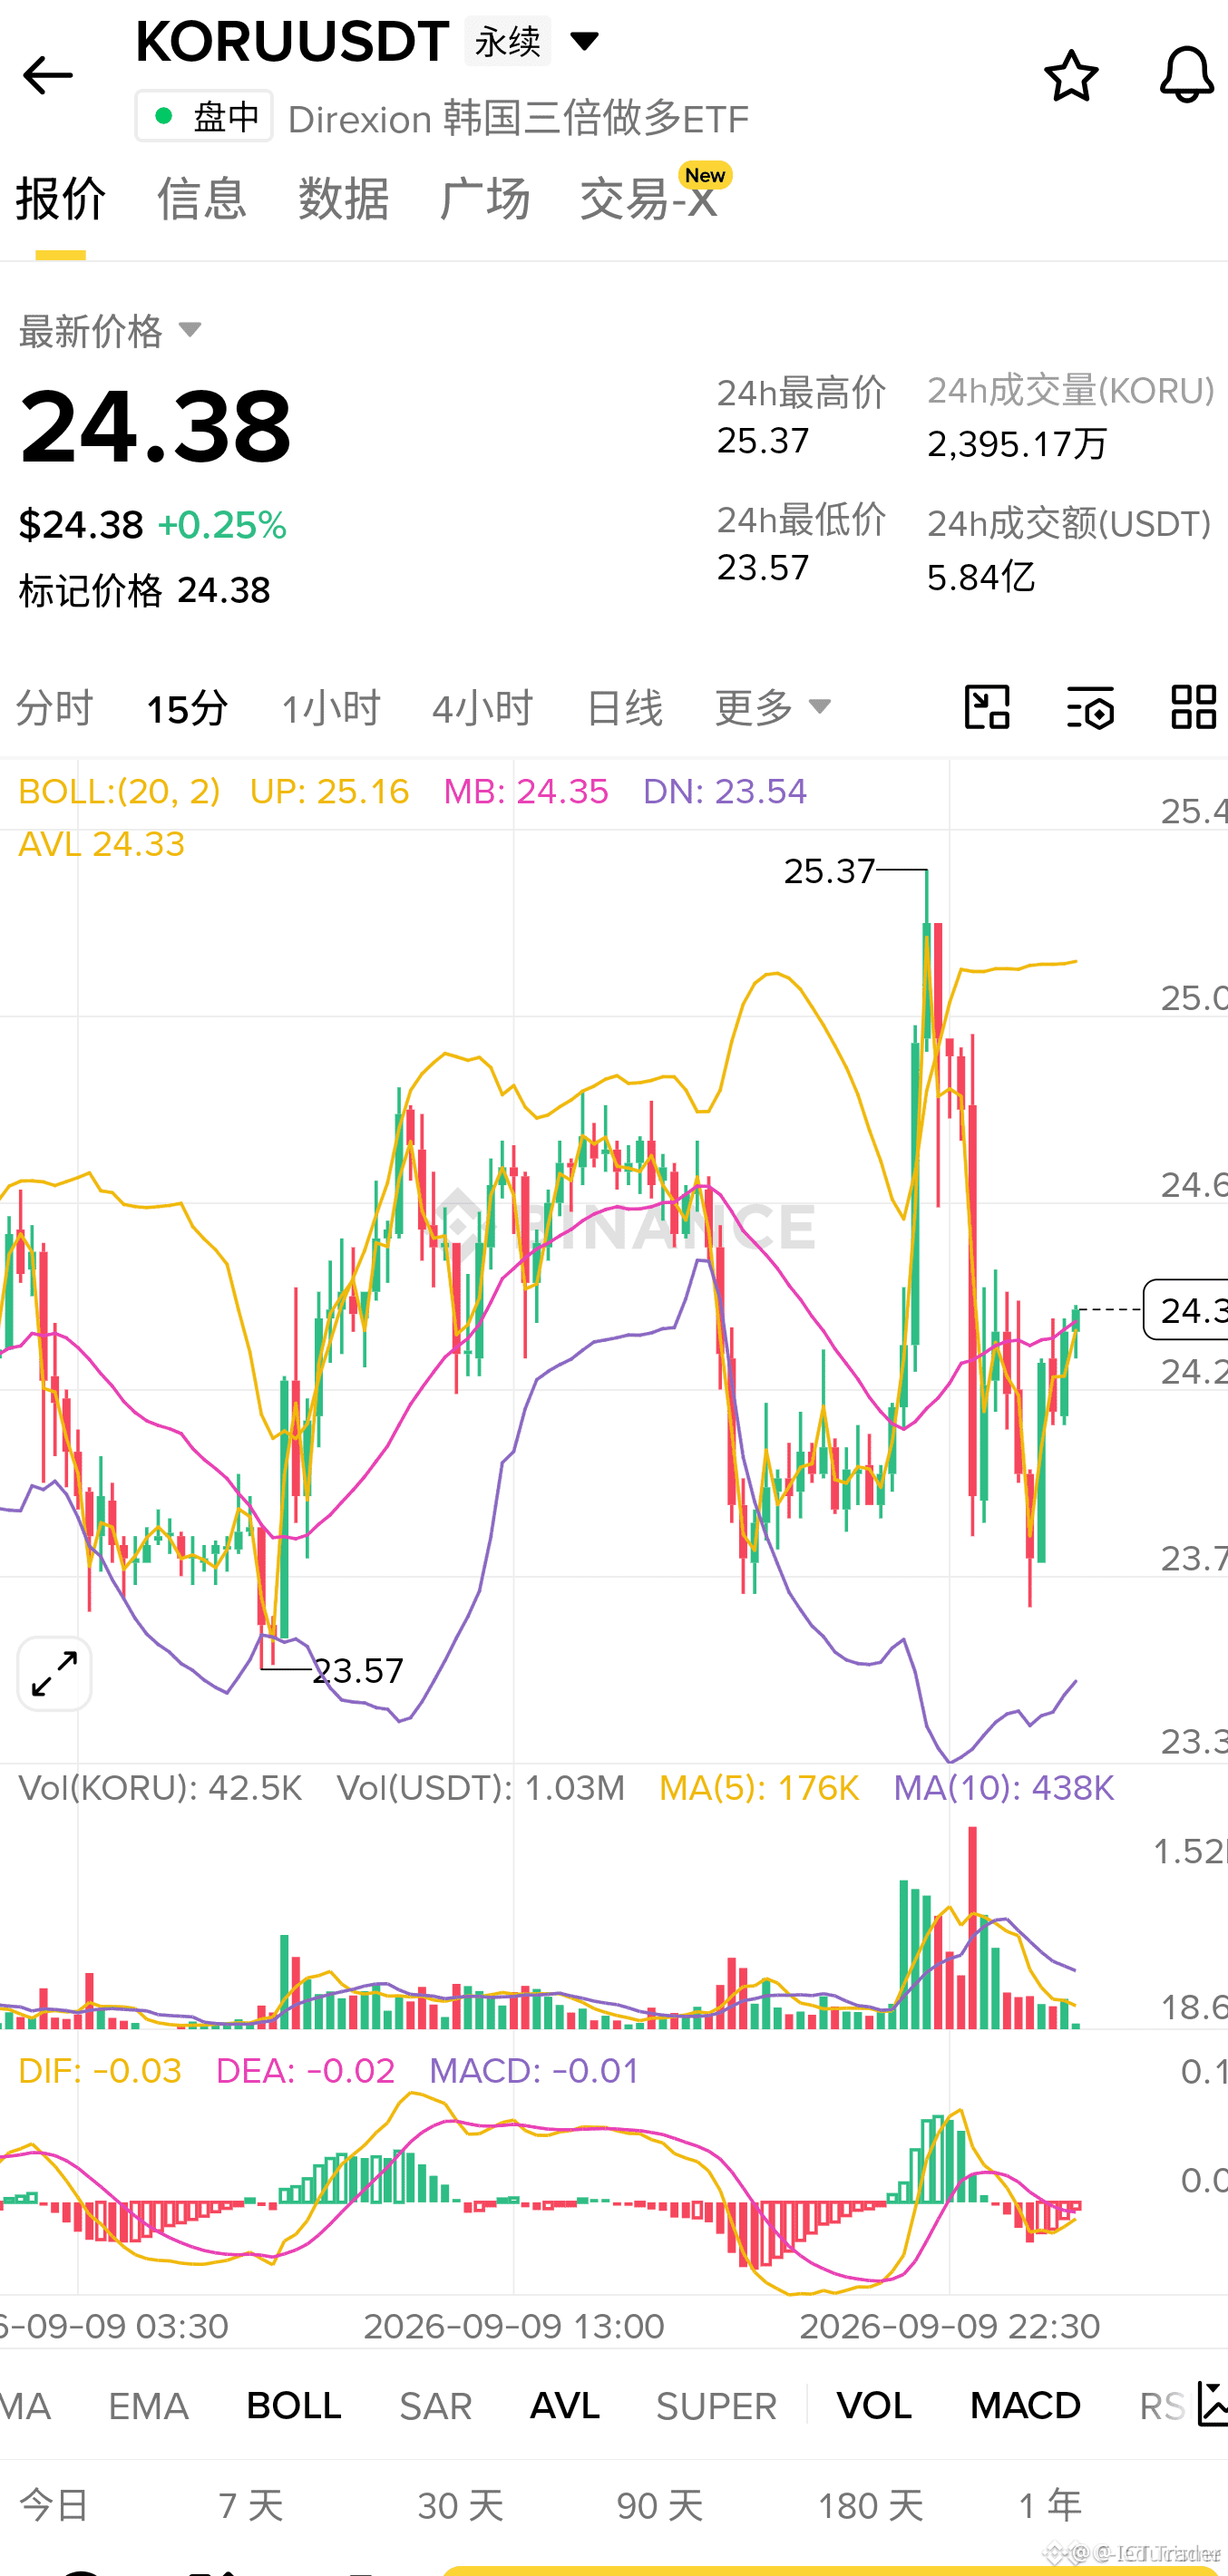
先别急着冲,$KORU 今天跌了 15.98%,而韩国 Kospi 指数却因伊朗停火谈判跳涨——这个反差藏着什么?$KORU是 Direxion 韩国 3 倍做多 ETF 的代币化合约,走势挂钩韩国股市,但杠杆倍数放大了日内波动。一边是今天 Kospi 因油价急跌和地缘缓和走高,另一边 $KORU 却大跌,更像是前期获利盘涌出导致杠杆 ETF 的净值回撤。上周花旗刚唱多 Kospi 有望反弹至 10000 点,但韩国总统近日引用日本泡沫警示国内地产风险,多空信号交织。3 倍杠杆下,方向犹疑期容易出现这种背离行情。关注今晚 FOMC 后韩股方向确认,$KORU 的波动才可能收敛。 #代币化股票 #TradFi #ETF {future}(KORUUSDT)
先别急着冲,$KORU 今天跌了 15.98%,而韩国 Kospi 指数却因伊朗停火谈判跳涨——这个反差藏着什么?$KORU 是 Direxion 韩国 3 倍做多 ETF 的代币化合约,走势挂钩韩国股市,但杠杆倍数放大了日内波动。一边是今天 Kospi 因油价急跌和地缘缓和走高,另一边 $KORU 却大跌,更像是前期获利盘涌出导致杠杆 ETF 的净值回撤。上周花旗刚唱多 Kospi 有望反弹至 10000 点,但韩国总统近日引用日本泡沫警示国内地产风险,多空信号交织。3 倍杠杆下,方向犹疑期容易出现这种背离行情。关注今晚 FOMC 后韩股方向确认,$KORU 的波动才可能收敛。

#代币化股票 #TradFi #ETF
·
--
Bullish
Ethereum ETFs hit a speed bump. 🤯omg US spot Ethereum ETFs recorded $70.62M in net outflows on Friday, ending a 5-day inflow streak. Still, the bigger picture remains positive: 🔹 $103.9M net inflows for the week 🔹 3 consecutive weeks of positive flows 🔹 $337.74M in net inflows so far this month Institutional interest hasn't disappeared—it simply paused after several strong sessions. ETF flows remain one of the key indicators to watch for long-term demand in the crypto market. #Ethereum #ETH #ETF #Crypto #Investing $ETH {future}(ETHUSDT)
Ethereum ETFs hit a speed bump. 🤯omg

US spot Ethereum ETFs recorded $70.62M in net outflows on Friday, ending a 5-day inflow streak.

Still, the bigger picture remains positive: 🔹 $103.9M net inflows for the week
🔹 3 consecutive weeks of positive flows
🔹 $337.74M in net inflows so far this month

Institutional interest hasn't disappeared—it simply paused after several strong sessions. ETF flows remain one of the key indicators to watch for long-term demand in the crypto market.

#Ethereum #ETH #ETF #Crypto #Investing $ETH
Bitcoin ETFs Shed $465M Over Two Days, Led by BlackRock's IBIT Fuente: Decrypt https://decrypt.co/374354/bitcoin-etfs-shed-465m-over-two-days-led-by-blackrocks-ibit Si te interesa el mercado cripto, sígueme para más contenido así. 📈 ⚠️ Esto es contenido informativo, no es consejo financiero. Siempre haz tu propia investigación (DYOR). $BTC #Crypto #ETF
Bitcoin ETFs Shed $465M Over Two Days, Led by BlackRock's IBIT

Fuente: Decrypt
https://decrypt.co/374354/bitcoin-etfs-shed-465m-over-two-days-led-by-blackrocks-ibit

Si te interesa el mercado cripto, sígueme para más contenido así. 📈

⚠️ Esto es contenido informativo, no es consejo financiero. Siempre haz tu propia investigación (DYOR).

$BTC #Crypto #ETF
Holding ETH0.1U
🚀 #BTC Según Ark Invest, la oferta de titulares a largo plazo de Bitcoin alcanzó un máximo histórico de 14,85 millones de BTC al final del primer trimestre. La confianza sigue creciendo. 📈 El S&P 500 borra todas sus ganancias y entra en terreno negativo. 📊 Actualización del 27 de julio: ETF de Bitcoin: Flujo neto a 1 día: -3.824 $BTC (-246,68 millones de dólares) Flujo neto a 7 días: +253 BTC (+16,65 millones de dólares) ETF de Ethereum: Flujo neto de 1 día: -43 284 ETH (-83,23 millones de dólares) Flujo neto a 7 días: +46 190 $ETH (+88,82 millones de dólares) 📊 El BTC se ha recuperado de los 64 000 $ a los 65 100 $, pero sigue moviéndose dentro de un rango. La reducción del apalancamiento, las salidas de fondos de los #etf y la escasa actividad en la cadena de bloques apuntan a una consolidación cautelosa, a pesar de la resistencia de los tenedores. #ETH #SP500 #ballenas $SPY
🚀 #BTC Según Ark Invest, la oferta de titulares a largo plazo de Bitcoin alcanzó un máximo histórico de 14,85 millones de BTC al final del primer trimestre. La confianza sigue creciendo.

📈 El S&P 500 borra todas sus ganancias y entra en terreno negativo.

📊 Actualización del 27 de julio:

ETF de Bitcoin:
Flujo neto a 1 día: -3.824 $BTC (-246,68 millones de dólares)
Flujo neto a 7 días: +253 BTC (+16,65 millones de dólares)

ETF de Ethereum:
Flujo neto de 1 día: -43 284 ETH (-83,23 millones de dólares)
Flujo neto a 7 días: +46 190 $ETH (+88,82 millones de dólares)

📊 El BTC se ha recuperado de los 64 000 $ a los 65 100 $, pero sigue moviéndose dentro de un rango. La reducción del apalancamiento, las salidas de fondos de los #etf y la escasa actividad en la cadena de bloques apuntan a una consolidación cautelosa, a pesar de la resistencia de los tenedores.

#ETH #SP500 #ballenas $SPY
Los ETF de $ETH triplican en flujos a los de $BTC esta semana Los ETF spot de $BTC cortaron su racha de 7 días de entradas: -US$240M el viernes 24 de julio y -US$225M el jueves 23, aunque la semana completa cerró en verde (+US$33,8M). Los de $ETH hicieron lo contrario: sumaron +US$103,9M en la semana y ya acumulan +US$337,74M en julio, su mejor mes desde abril. Hoy $ETH tocó máximo de 2 meses cerca de US$1.970 (Bloomberg, CoinDesk, Farside, 27 jul). ¿Rotación real hacia ETH o solo un respiro de BTC antes del FOMC? 👇 #ETF #Bitcoin #Ethereum
Los ETF de $ETH triplican en flujos a los de $BTC esta semana

Los ETF spot de $BTC cortaron su racha de 7 días de entradas: -US$240M el viernes 24 de julio y -US$225M el jueves 23, aunque la semana completa cerró en verde (+US$33,8M). Los de $ETH hicieron lo contrario: sumaron +US$103,9M en la semana y ya acumulan +US$337,74M en julio, su mejor mes desde abril. Hoy $ETH tocó máximo de 2 meses cerca de US$1.970 (Bloomberg, CoinDesk, Farside, 27 jul).

¿Rotación real hacia ETH o solo un respiro de BTC antes del FOMC? 👇

#ETF #Bitcoin #Ethereum
Log in to explore more content
Join global crypto users on Binance Square
⚡️ Get latest and useful information about crypto.
💬 Trusted by the world’s largest crypto exchange.
👍 Discover real insights from verified creators.
Email / Phone number