
#soxlb
soxlb
72,819 views
2,756 Discussing
Hot
Latest

·
--
🔻 $SOXLB SHORT SETUP 🔴
Sellers are stepping in — here's the setup. ⚡
SOXLB has demonstrated a significant -8.753% price depreciation over the last 24 hours, accompanied by robust trading volume, which strongly signals entrenched selling pressure. This pronounced bearish momentum is expected to persist, driving the asset towards retesting lower support levels as sellers maintain control.
📊 24h: -8.75% | Vol: $67,909,249
Trade Plan
Entry: 50.56
Stop Loss: 51.32
TP1: 49.81
TP2: 49.04
TP3: 47.98
⚖️ Risk:Reward (TP1) — 1:0.99
Trigger:
Execute SHORT upon confirmation of bearish candle close below 50.56, anticipating further downside continuation.
Risk Note:
Given the asset's current high volatility, disciplined risk management is paramount. Traders must strictly adhere to the stop-loss and adjust position sizing to safeguard capital against potential rapid price reversals.
Trade the plan, not your emotions.
#SOXLB #soxlb
🔻 $SOXLB SHORT SETUP 🔴
Sellers are stepping in — here's the setup. ⚡
SOXLB has demonstrated a significant -8.753% price depreciation over the last 24 hours, accompanied by robust trading volume, which strongly signals entrenched selling pressure. This pronounced bearish momentum is expected to persist, driving the asset towards retesting lower support levels as sellers maintain control.
📊 24h: -8.75% | Vol: $67,909,249
Trade Plan
Entry: 50.56
Stop Loss: 51.32
TP1: 49.81
TP2: 49.04
TP3: 47.98
⚖️ Risk:Reward (TP1) — 1:0.99
Trigger:
Execute SHORT upon confirmation of bearish candle close below 50.56, anticipating further downside continuation.
Risk Note:
Given the asset's current high volatility, disciplined risk management is paramount. Traders must strictly adhere to the stop-loss and adjust position sizing to safeguard capital against potential rapid price reversals.
Trade the plan, not your emotions.
#SOXLB #soxlb
Sellers are stepping in — here's the setup. ⚡
SOXLB has demonstrated a significant -8.753% price depreciation over the last 24 hours, accompanied by robust trading volume, which strongly signals entrenched selling pressure. This pronounced bearish momentum is expected to persist, driving the asset towards retesting lower support levels as sellers maintain control.
📊 24h: -8.75% | Vol: $67,909,249
Trade Plan
Entry: 50.56
Stop Loss: 51.32
TP1: 49.81
TP2: 49.04
TP3: 47.98
⚖️ Risk:Reward (TP1) — 1:0.99
Trigger:
Execute SHORT upon confirmation of bearish candle close below 50.56, anticipating further downside continuation.
Risk Note:
Given the asset's current high volatility, disciplined risk management is paramount. Traders must strictly adhere to the stop-loss and adjust position sizing to safeguard capital against potential rapid price reversals.
Trade the plan, not your emotions.
#SOXLB #soxlb
32

Today's Losers 📊
1. $ZIL: -10.39%
💰 $0.000914 | Vol: $3.98M
2. $KAVA: -8.42%
💰 $0.03 | Vol: $3.78M
3. $SNXXB: -7.46%
💰 $3.10 | Vol: $5.20M
4. KMNO: -7.20%
💰 $0.03 | Vol: $1.12M
5. OMNI: -6.51%
💰 $3.88 | Vol: $1.11M
6. KORUB: -6.44%
💰 $6.83 | Vol: $12.32M
7. $牛来: -6.44%
💰 $0.05 | Vol: $3.55M
8. BABAB: -5.73%
💰 $88.23 | Vol: $1.01M
9. SOXLB: -5.54%
💰 $51.98 | Vol: $64.16M
10. TQQQB: -5.46%
💰 $53.98 | Vol: $3.90M
🟢 Bullish
What do you think?
#OMNI #SOXLB #TQQQB #News #MarketUpdate
📱 Follow @PoorCryptoMan
Today's Losers 📊
1. $ZIL : -10.39%
💰 $0.000914 | Vol: $3.98M
2. $KAVA : -8.42%
💰 $0.03 | Vol: $3.78M
3. $SNXXB : -7.46%
💰 $3.10 | Vol: $5.20M
4. KMNO: -7.20%
💰 $0.03 | Vol: $1.12M
5. OMNI: -6.51%
💰 $3.88 | Vol: $1.11M
6. KORUB: -6.44%
💰 $6.83 | Vol: $12.32M
7. $牛来: -6.44%
💰 $0.05 | Vol: $3.55M
8. BABAB: -5.73%
💰 $88.23 | Vol: $1.01M
9. SOXLB: -5.54%
💰 $51.98 | Vol: $64.16M
10. TQQQB: -5.46%
💰 $53.98 | Vol: $3.90M
🟢 Bullish
What do you think?
#OMNI #SOXLB #TQQQB #News #MarketUpdate
📱 Follow @PoorCryptoMan
1. $ZIL : -10.39%
💰 $0.000914 | Vol: $3.98M
2. $KAVA : -8.42%
💰 $0.03 | Vol: $3.78M
3. $SNXXB : -7.46%
💰 $3.10 | Vol: $5.20M
4. KMNO: -7.20%
💰 $0.03 | Vol: $1.12M
5. OMNI: -6.51%
💰 $3.88 | Vol: $1.11M
6. KORUB: -6.44%
💰 $6.83 | Vol: $12.32M
7. $牛来: -6.44%
💰 $0.05 | Vol: $3.55M
8. BABAB: -5.73%
💰 $88.23 | Vol: $1.01M
9. SOXLB: -5.54%
💰 $51.98 | Vol: $64.16M
10. TQQQB: -5.46%
💰 $53.98 | Vol: $3.90M
🟢 Bullish
What do you think?
#OMNI #SOXLB #TQQQB #News #MarketUpdate
📱 Follow @PoorCryptoMan

🚨 WHY BOTH LONG AND SHORT LEVERAGED TOKENS LIKE $SOXLB BLED DURING HIGH VOLATILITY 📉
📊 Structural decay in leveraged products like $SOXLB is a masterclass in mathematical drag. When underlying assets experience violent intraday whipsaws, the daily reset mechanism relentlessly bleeds capital from both directional camps. ⚡
We watched $SOXLB plunge from 65 to under 41 before violently ripping back to 70 within days, yet both long and short tokens finished net negative. These instruments are engineered exclusively for short-term momentum capture, never for parking capital through choppy range expansions.
💬 Have you factored daily volatility decay into your portfolio management when trading leveraged assets? 👇
⚠️ Not financial advice. Always manage your risk. 🛡️
🏷️ #SOXLB #TradingPsychology #RiskManagement #Crypto
🎯 🦈
🚨 WHY BOTH LONG AND SHORT LEVERAGED TOKENS LIKE $SOXLB BLED DURING HIGH VOLATILITY 📉
📊 Structural decay in leveraged products like $SOXLB is a masterclass in mathematical drag. When underlying assets experience violent intraday whipsaws, the daily reset mechanism relentlessly bleeds capital from both directional camps. ⚡
We watched $SOXLB plunge from 65 to under 41 before violently ripping back to 70 within days, yet both long and short tokens finished net negative. These instruments are engineered exclusively for short-term momentum capture, never for parking capital through choppy range expansions.
💬 Have you factored daily volatility decay into your portfolio management when trading leveraged assets? 👇
⚠️ Not financial advice. Always manage your risk. 🛡️
🏷️ #SOXLB #TradingPsychology #RiskManagement #Crypto
🎯 🦈
📊 Structural decay in leveraged products like $SOXLB is a masterclass in mathematical drag. When underlying assets experience violent intraday whipsaws, the daily reset mechanism relentlessly bleeds capital from both directional camps. ⚡
We watched $SOXLB plunge from 65 to under 41 before violently ripping back to 70 within days, yet both long and short tokens finished net negative. These instruments are engineered exclusively for short-term momentum capture, never for parking capital through choppy range expansions.
💬 Have you factored daily volatility decay into your portfolio management when trading leveraged assets? 👇
⚠️ Not financial advice. Always manage your risk. 🛡️
🏷️ #SOXLB #TradingPsychology #RiskManagement #Crypto
🎯 🦈

14

·
--
🔥 $SOXLB Technical Update: Key Levels & Momentum Breakdown
📊 1. Market Snapshot
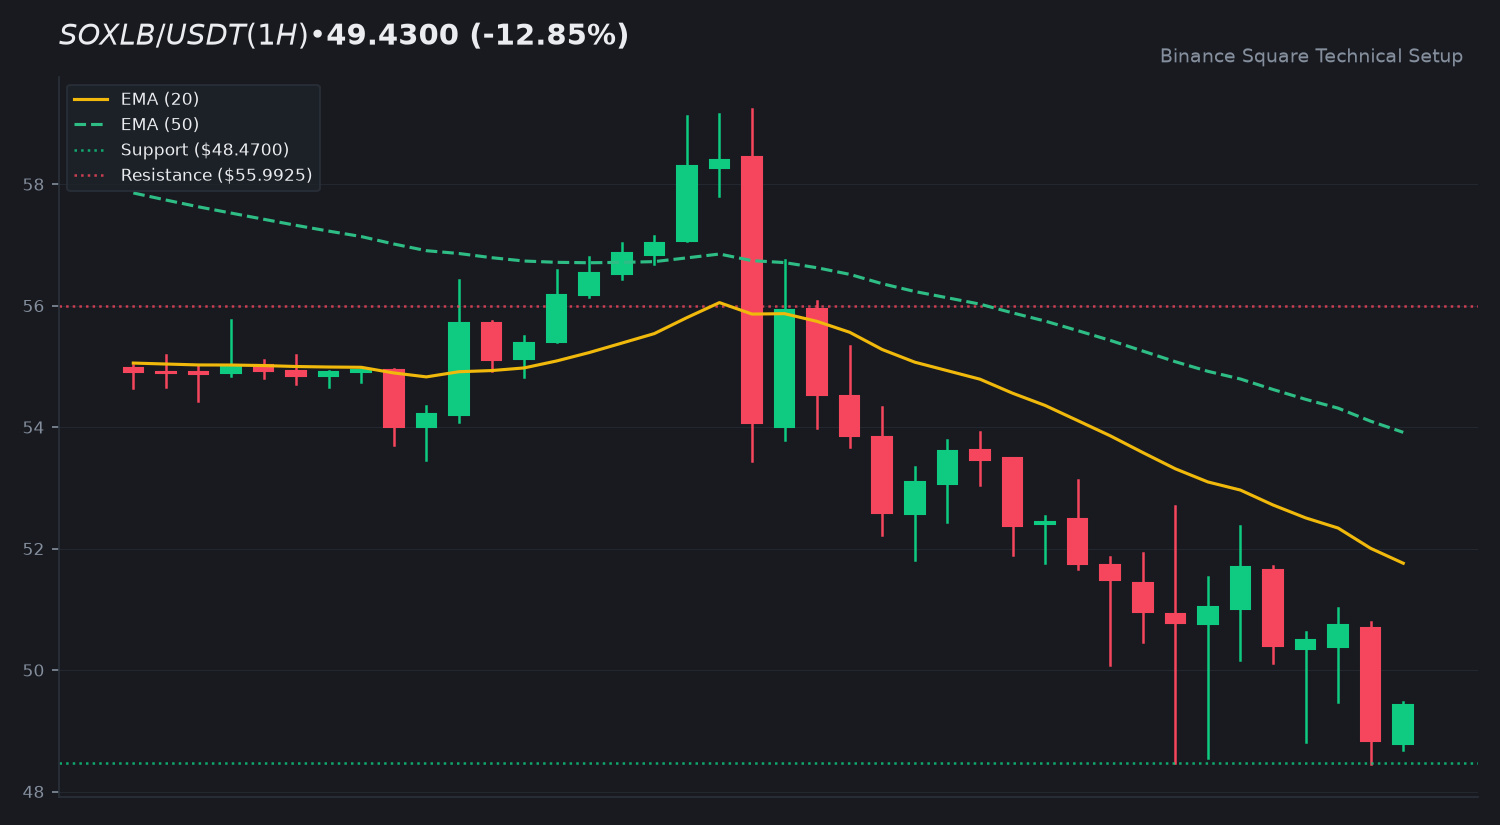
The asset $SOXLB is currently trading at 49.4300 USDT, reflecting a 24h change of -12.85%. Market activity is characterized by a 24h quote volume of 70,807,400 USDT. Current volume remains low, sitting at 0.22x relative to the 20-SMA, suggesting a period of weak conviction and consolidation within the broader trend.
📈 2. Technical Momentum & Indicator Bias
The price action for $SOXLB is currently positioned below both the EMA 20 at 51.7586 and the EMA 50 at 53.9139, indicating a persistent downward trend. The RSI (14) is currently at 33.86, approaching oversold territory but currently lacking a bullish divergence. The MACD histogram sits at -0.2129, with the MACD line beneath the signal line, confirming the current bearish momentum bias.
🎯 3. Key Technical Levels to Watch
• 🟢 Resistance Zone: Initial resistance is identified at 55.9925, with a secondary extension level at 59.3150.
• 🔴 Support Zone: The immediate support floor is established at 48.4700.
• 🛡️ Pivot Confluence: The EMA 20 at 51.7586 serves as the primary pivot for any potential trend reversal.
💡 4. Technical Takeaway & Risk Management
Traders are monitoring the interaction between price and the EMA levels. A reclaim of the 51.7586 level would be required to shift the current short-term sentiment. Given the low volume, participants are watching for a potential increase in liquidity before assessing a trend shift.
💬 5. Community Discussion
What is your technical outlook for $SOXLB this week? Are you accumulating or waiting for confirmation? Drop your thoughts below! 👇
⚠️ 6. Disclaimer
Educational technical analysis only. Not financial advice (NFA). Crypto markets involve risk. Always DYOR.
$SOXLB #SOXLB #BinanceSquare
🔥 $SOXLB Technical Update: Key Levels & Momentum Breakdown
📊 1. Market Snapshot
The asset $SOXLB is currently trading at 49.4300 USDT, reflecting a 24h change of -12.85%. Market activity is characterized by a 24h quote volume of 70,807,400 USDT. Current volume remains low, sitting at 0.22x relative to the 20-SMA, suggesting a period of weak conviction and consolidation within the broader trend.
📈 2. Technical Momentum & Indicator Bias
The price action for $SOXLB is currently positioned below both the EMA 20 at 51.7586 and the EMA 50 at 53.9139, indicating a persistent downward trend. The RSI (14) is currently at 33.86, approaching oversold territory but currently lacking a bullish divergence. The MACD histogram sits at -0.2129, with the MACD line beneath the signal line, confirming the current bearish momentum bias.
🎯 3. Key Technical Levels to Watch
• 🟢 Resistance Zone: Initial resistance is identified at 55.9925, with a secondary extension level at 59.3150.
• 🔴 Support Zone: The immediate support floor is established at 48.4700.
• 🛡️ Pivot Confluence: The EMA 20 at 51.7586 serves as the primary pivot for any potential trend reversal.
💡 4. Technical Takeaway & Risk Management
Traders are monitoring the interaction between price and the EMA levels. A reclaim of the 51.7586 level would be required to shift the current short-term sentiment. Given the low volume, participants are watching for a potential increase in liquidity before assessing a trend shift.
💬 5. Community Discussion
What is your technical outlook for $SOXLB this week? Are you accumulating or waiting for confirmation? Drop your thoughts below! 👇
⚠️ 6. Disclaimer
Educational technical analysis only. Not financial advice (NFA). Crypto markets involve risk. Always DYOR.
$SOXLB #SOXLB #BinanceSquare
📊 1. Market Snapshot
The asset $SOXLB is currently trading at 49.4300 USDT, reflecting a 24h change of -12.85%. Market activity is characterized by a 24h quote volume of 70,807,400 USDT. Current volume remains low, sitting at 0.22x relative to the 20-SMA, suggesting a period of weak conviction and consolidation within the broader trend.
📈 2. Technical Momentum & Indicator Bias
The price action for $SOXLB is currently positioned below both the EMA 20 at 51.7586 and the EMA 50 at 53.9139, indicating a persistent downward trend. The RSI (14) is currently at 33.86, approaching oversold territory but currently lacking a bullish divergence. The MACD histogram sits at -0.2129, with the MACD line beneath the signal line, confirming the current bearish momentum bias.
🎯 3. Key Technical Levels to Watch
• 🟢 Resistance Zone: Initial resistance is identified at 55.9925, with a secondary extension level at 59.3150.
• 🔴 Support Zone: The immediate support floor is established at 48.4700.
• 🛡️ Pivot Confluence: The EMA 20 at 51.7586 serves as the primary pivot for any potential trend reversal.
💡 4. Technical Takeaway & Risk Management
Traders are monitoring the interaction between price and the EMA levels. A reclaim of the 51.7586 level would be required to shift the current short-term sentiment. Given the low volume, participants are watching for a potential increase in liquidity before assessing a trend shift.
💬 5. Community Discussion
What is your technical outlook for $SOXLB this week? Are you accumulating or waiting for confirmation? Drop your thoughts below! 👇
⚠️ 6. Disclaimer
Educational technical analysis only. Not financial advice (NFA). Crypto markets involve risk. Always DYOR.
$SOXLB #SOXLB #BinanceSquare
13

·
--
$SOXLB -11.46% | $SOXSB +10.79% | $MUB -5.34%
#SOXLB trades at $49.77, slipping 11.46% despite a hefty $68.3 M of volume.
#SOXSB sits at $58.30, climbing 10.79% on a modest $5.5 M flow.
#MUB is priced at $724.00, down 5.34% with $39.7 M changing hands.
👀 The divergent moves between SOXLB’s heavy volume drop and SOXSB’s lighter‑volume rally could signal a short‑term sector shift.
#Write2Earn #Binance
$SOXLB -11.46% | $SOXSB +10.79% | $MUB -5.34%
#SOXLB trades at $49.77, slipping 11.46% despite a hefty $68.3 M of volume.
#SOXSB sits at $58.30, climbing 10.79% on a modest $5.5 M flow.
#MUB is priced at $724.00, down 5.34% with $39.7 M changing hands.
👀 The divergent moves between SOXLB’s heavy volume drop and SOXSB’s lighter‑volume rally could signal a short‑term sector shift.
#Write2Earn #Binance
#SOXLB trades at $49.77, slipping 11.46% despite a hefty $68.3 M of volume.
#SOXSB sits at $58.30, climbing 10.79% on a modest $5.5 M flow.
#MUB is priced at $724.00, down 5.34% with $39.7 M changing hands.
👀 The divergent moves between SOXLB’s heavy volume drop and SOXSB’s lighter‑volume rally could signal a short‑term sector shift.
#Write2Earn #Binance
7

·
--
$SOXLB Moving Averages Stack Downward as Price Falls
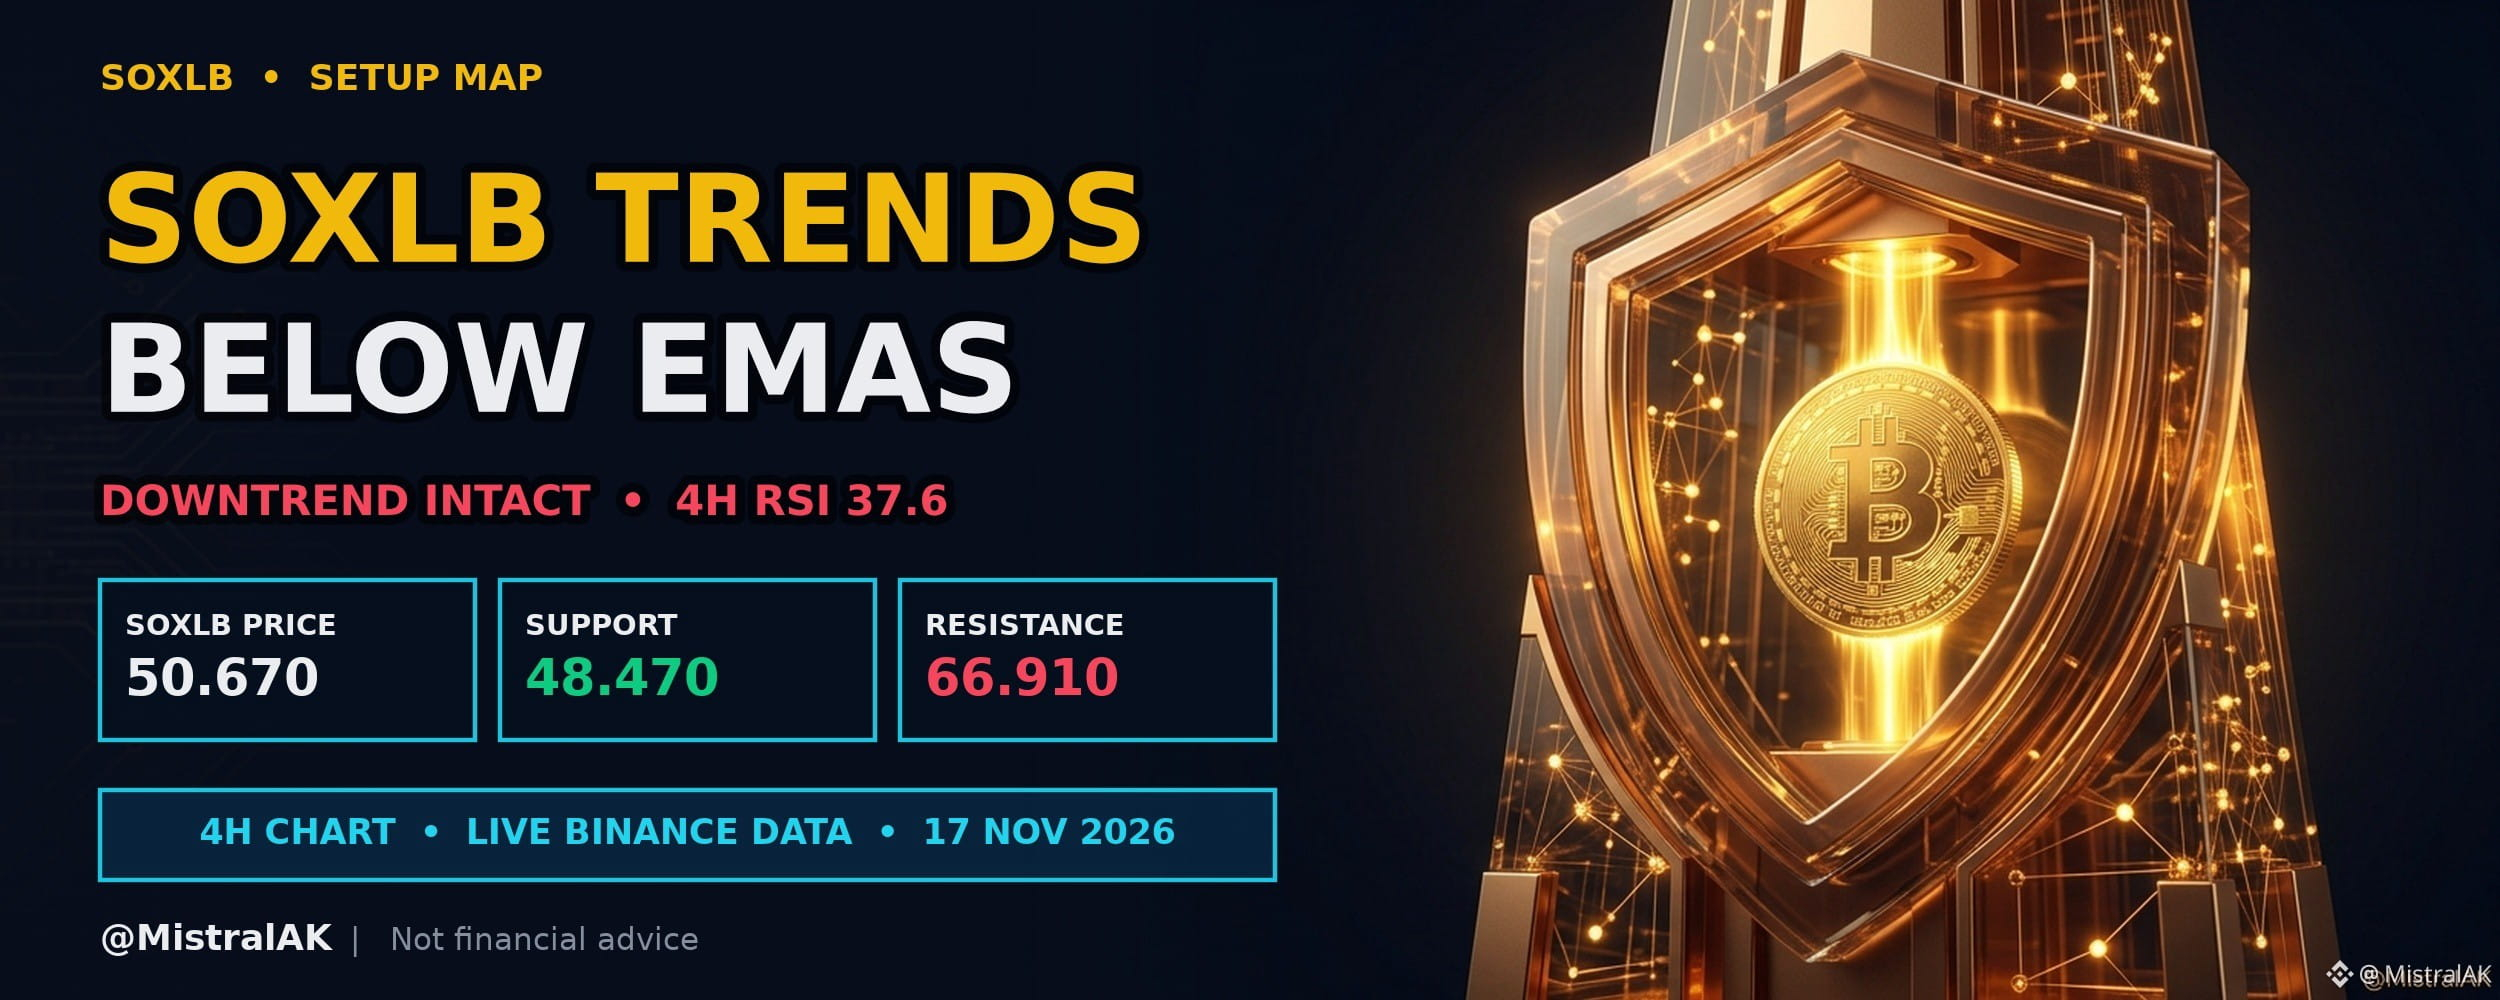
$SOXLB trades at 50.670 USD, down 9.8% over the past 24 hours, with 4H RSI at 37.6 (neutral).
Price moved lower over the past twenty-four hours, remaining beneath both short and medium exponential moving averages on the four-hour chart. Momentum on the four-hour chart sits in a balanced zone while price stays below both averages.
KEY LEVELS
▪️ Resistance: 66.910 USD (20-candle 4H swing high)
▪️ Support: 48.470 USD (20-candle 4H swing low)
▪️ EMA 20 / EMA 50: 55.117 / 57.178 USD (short-term trend filter)
WHAT WOULD CONFIRM WEAKNESS
▪️ Rallies rejected near EMA 20 (55.117 USD)
▪️ A 4H close below 48.470 USD
WHAT WOULD INVALIDATE IT
▪️ A 4H close above EMA 50 (57.178 USD)
▪️ A move through 66.910 USD would break the lower-high structure
Do you expect the moving average structure to keep pressure on price, or is a recovery forming?
Not financial advice. Always DYOR.
Like & Follow for Daily Trade Analytics & Insider News. @MistralAK
#SOXLB #TrendingTopic #TechnicalAnalysis
{spot}(SOXLBUSDT)
$SOXLB Moving Averages Stack Downward as Price Falls
$SOXLB trades at 50.670 USD, down 9.8% over the past 24 hours, with 4H RSI at 37.6 (neutral).
Price moved lower over the past twenty-four hours, remaining beneath both short and medium exponential moving averages on the four-hour chart. Momentum on the four-hour chart sits in a balanced zone while price stays below both averages.
KEY LEVELS
▪️ Resistance: 66.910 USD (20-candle 4H swing high)
▪️ Support: 48.470 USD (20-candle 4H swing low)
▪️ EMA 20 / EMA 50: 55.117 / 57.178 USD (short-term trend filter)
WHAT WOULD CONFIRM WEAKNESS
▪️ Rallies rejected near EMA 20 (55.117 USD)
▪️ A 4H close below 48.470 USD
WHAT WOULD INVALIDATE IT
▪️ A 4H close above EMA 50 (57.178 USD)
▪️ A move through 66.910 USD would break the lower-high structure
Do you expect the moving average structure to keep pressure on price, or is a recovery forming?
Not financial advice. Always DYOR.
Like & Follow for Daily Trade Analytics & Insider News. @MistralAK
#SOXLB #TrendingTopic #TechnicalAnalysis
$SOXLB trades at 50.670 USD, down 9.8% over the past 24 hours, with 4H RSI at 37.6 (neutral).
Price moved lower over the past twenty-four hours, remaining beneath both short and medium exponential moving averages on the four-hour chart. Momentum on the four-hour chart sits in a balanced zone while price stays below both averages.
KEY LEVELS
▪️ Resistance: 66.910 USD (20-candle 4H swing high)
▪️ Support: 48.470 USD (20-candle 4H swing low)
▪️ EMA 20 / EMA 50: 55.117 / 57.178 USD (short-term trend filter)
WHAT WOULD CONFIRM WEAKNESS
▪️ Rallies rejected near EMA 20 (55.117 USD)
▪️ A 4H close below 48.470 USD
WHAT WOULD INVALIDATE IT
▪️ A 4H close above EMA 50 (57.178 USD)
▪️ A move through 66.910 USD would break the lower-high structure
Do you expect the moving average structure to keep pressure on price, or is a recovery forming?
Not financial advice. Always DYOR.
Like & Follow for Daily Trade Analytics & Insider News. @MistralAK
#SOXLB #TrendingTopic #TechnicalAnalysis
112

·
--
🚨 $SOXLB AND $SOXSB BOTH BLEEDING PROVES WHY DAILY LEVERAGED DECAY EATS YOUR CAPITAL! 💥
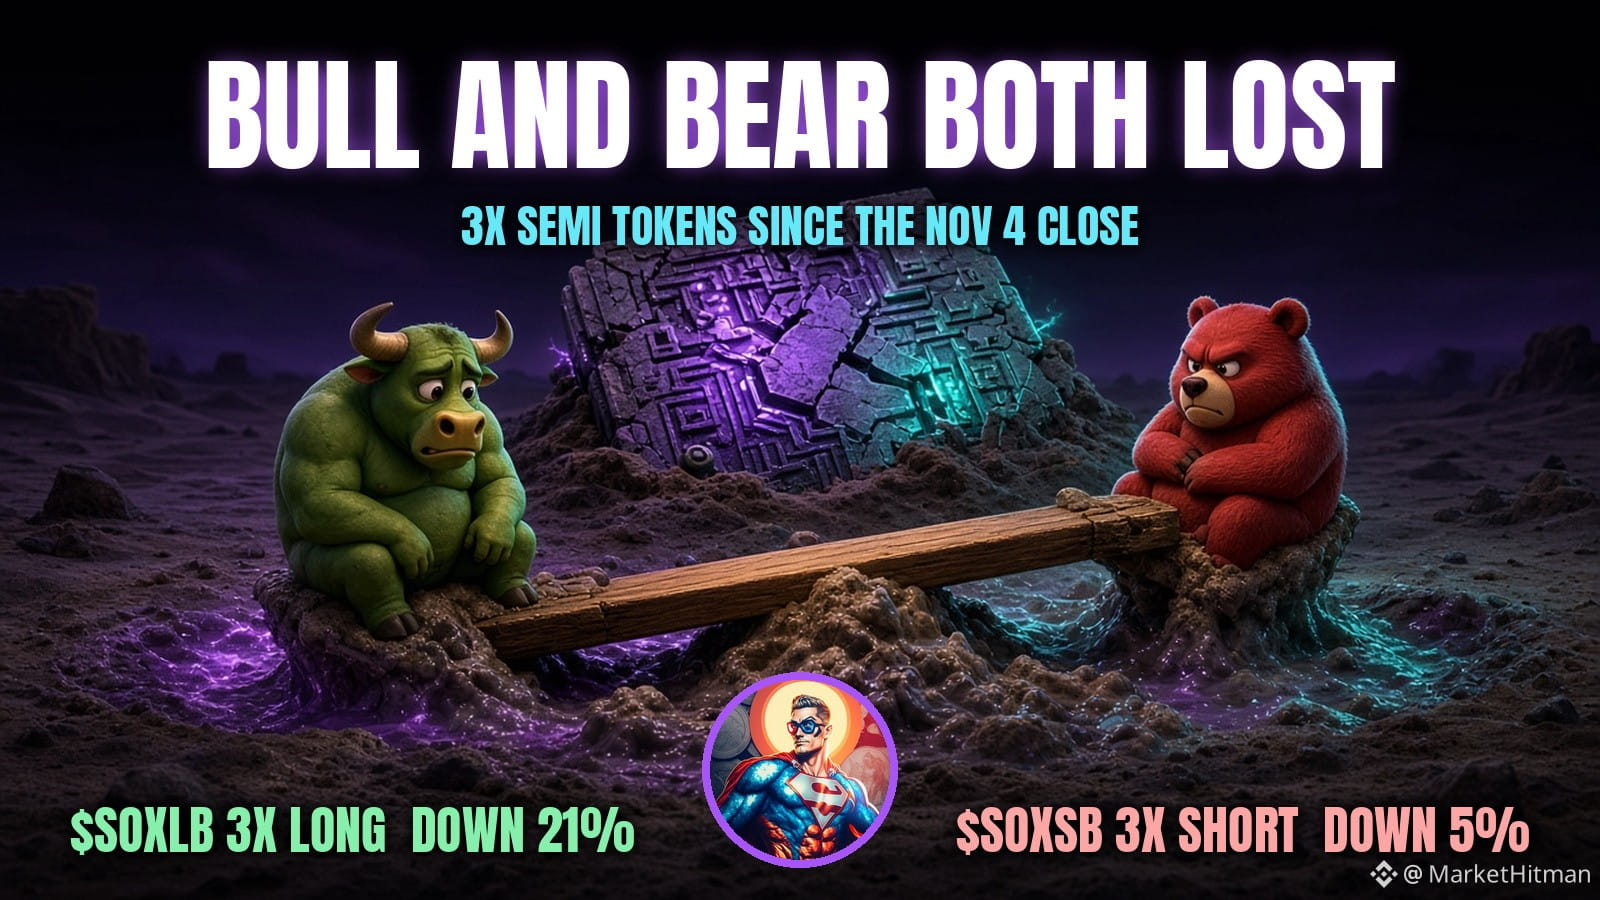
📊 Watching both sides of a 3x leveraged semiconductor trade take heavy losses while chopping around is a masterclass in volatility erosion. When $SOXLB crashed from 65 to 41 before ripping back to 70, every violent swing back and forth taxed the daily reset mechanism, dragging down both longs and shorts over time.
💡 These instruments are engineered for surgical strikes during clean, one-way momentum phases, never for parking capital through choppy market consolidation. 💬 Do you treat leveraged tokens as swing tools or avoid the daily reset trap entirely? 👇
⚠️ Not financial advice. Always manage your risk. 🛡️
🏷️ #SOXLB #SOXSB #TradingStrategy #MarketDynamics #RiskManagement
🔥 💎
🚨 $SOXLB AND $SOXSB BOTH BLEEDING PROVES WHY DAILY LEVERAGED DECAY EATS YOUR CAPITAL! 💥
📊 Watching both sides of a 3x leveraged semiconductor trade take heavy losses while chopping around is a masterclass in volatility erosion. When $SOXLB crashed from 65 to 41 before ripping back to 70, every violent swing back and forth taxed the daily reset mechanism, dragging down both longs and shorts over time.
💡 These instruments are engineered for surgical strikes during clean, one-way momentum phases, never for parking capital through choppy market consolidation. 💬 Do you treat leveraged tokens as swing tools or avoid the daily reset trap entirely? 👇
⚠️ Not financial advice. Always manage your risk. 🛡️
🏷️ #SOXLB #SOXSB #TradingStrategy #MarketDynamics #RiskManagement
🔥 💎
📊 Watching both sides of a 3x leveraged semiconductor trade take heavy losses while chopping around is a masterclass in volatility erosion. When $SOXLB crashed from 65 to 41 before ripping back to 70, every violent swing back and forth taxed the daily reset mechanism, dragging down both longs and shorts over time.
💡 These instruments are engineered for surgical strikes during clean, one-way momentum phases, never for parking capital through choppy market consolidation. 💬 Do you treat leveraged tokens as swing tools or avoid the daily reset trap entirely? 👇
⚠️ Not financial advice. Always manage your risk. 🛡️
🏷️ #SOXLB #SOXSB #TradingStrategy #MarketDynamics #RiskManagement
🔥 💎
25

·
--
Bearish
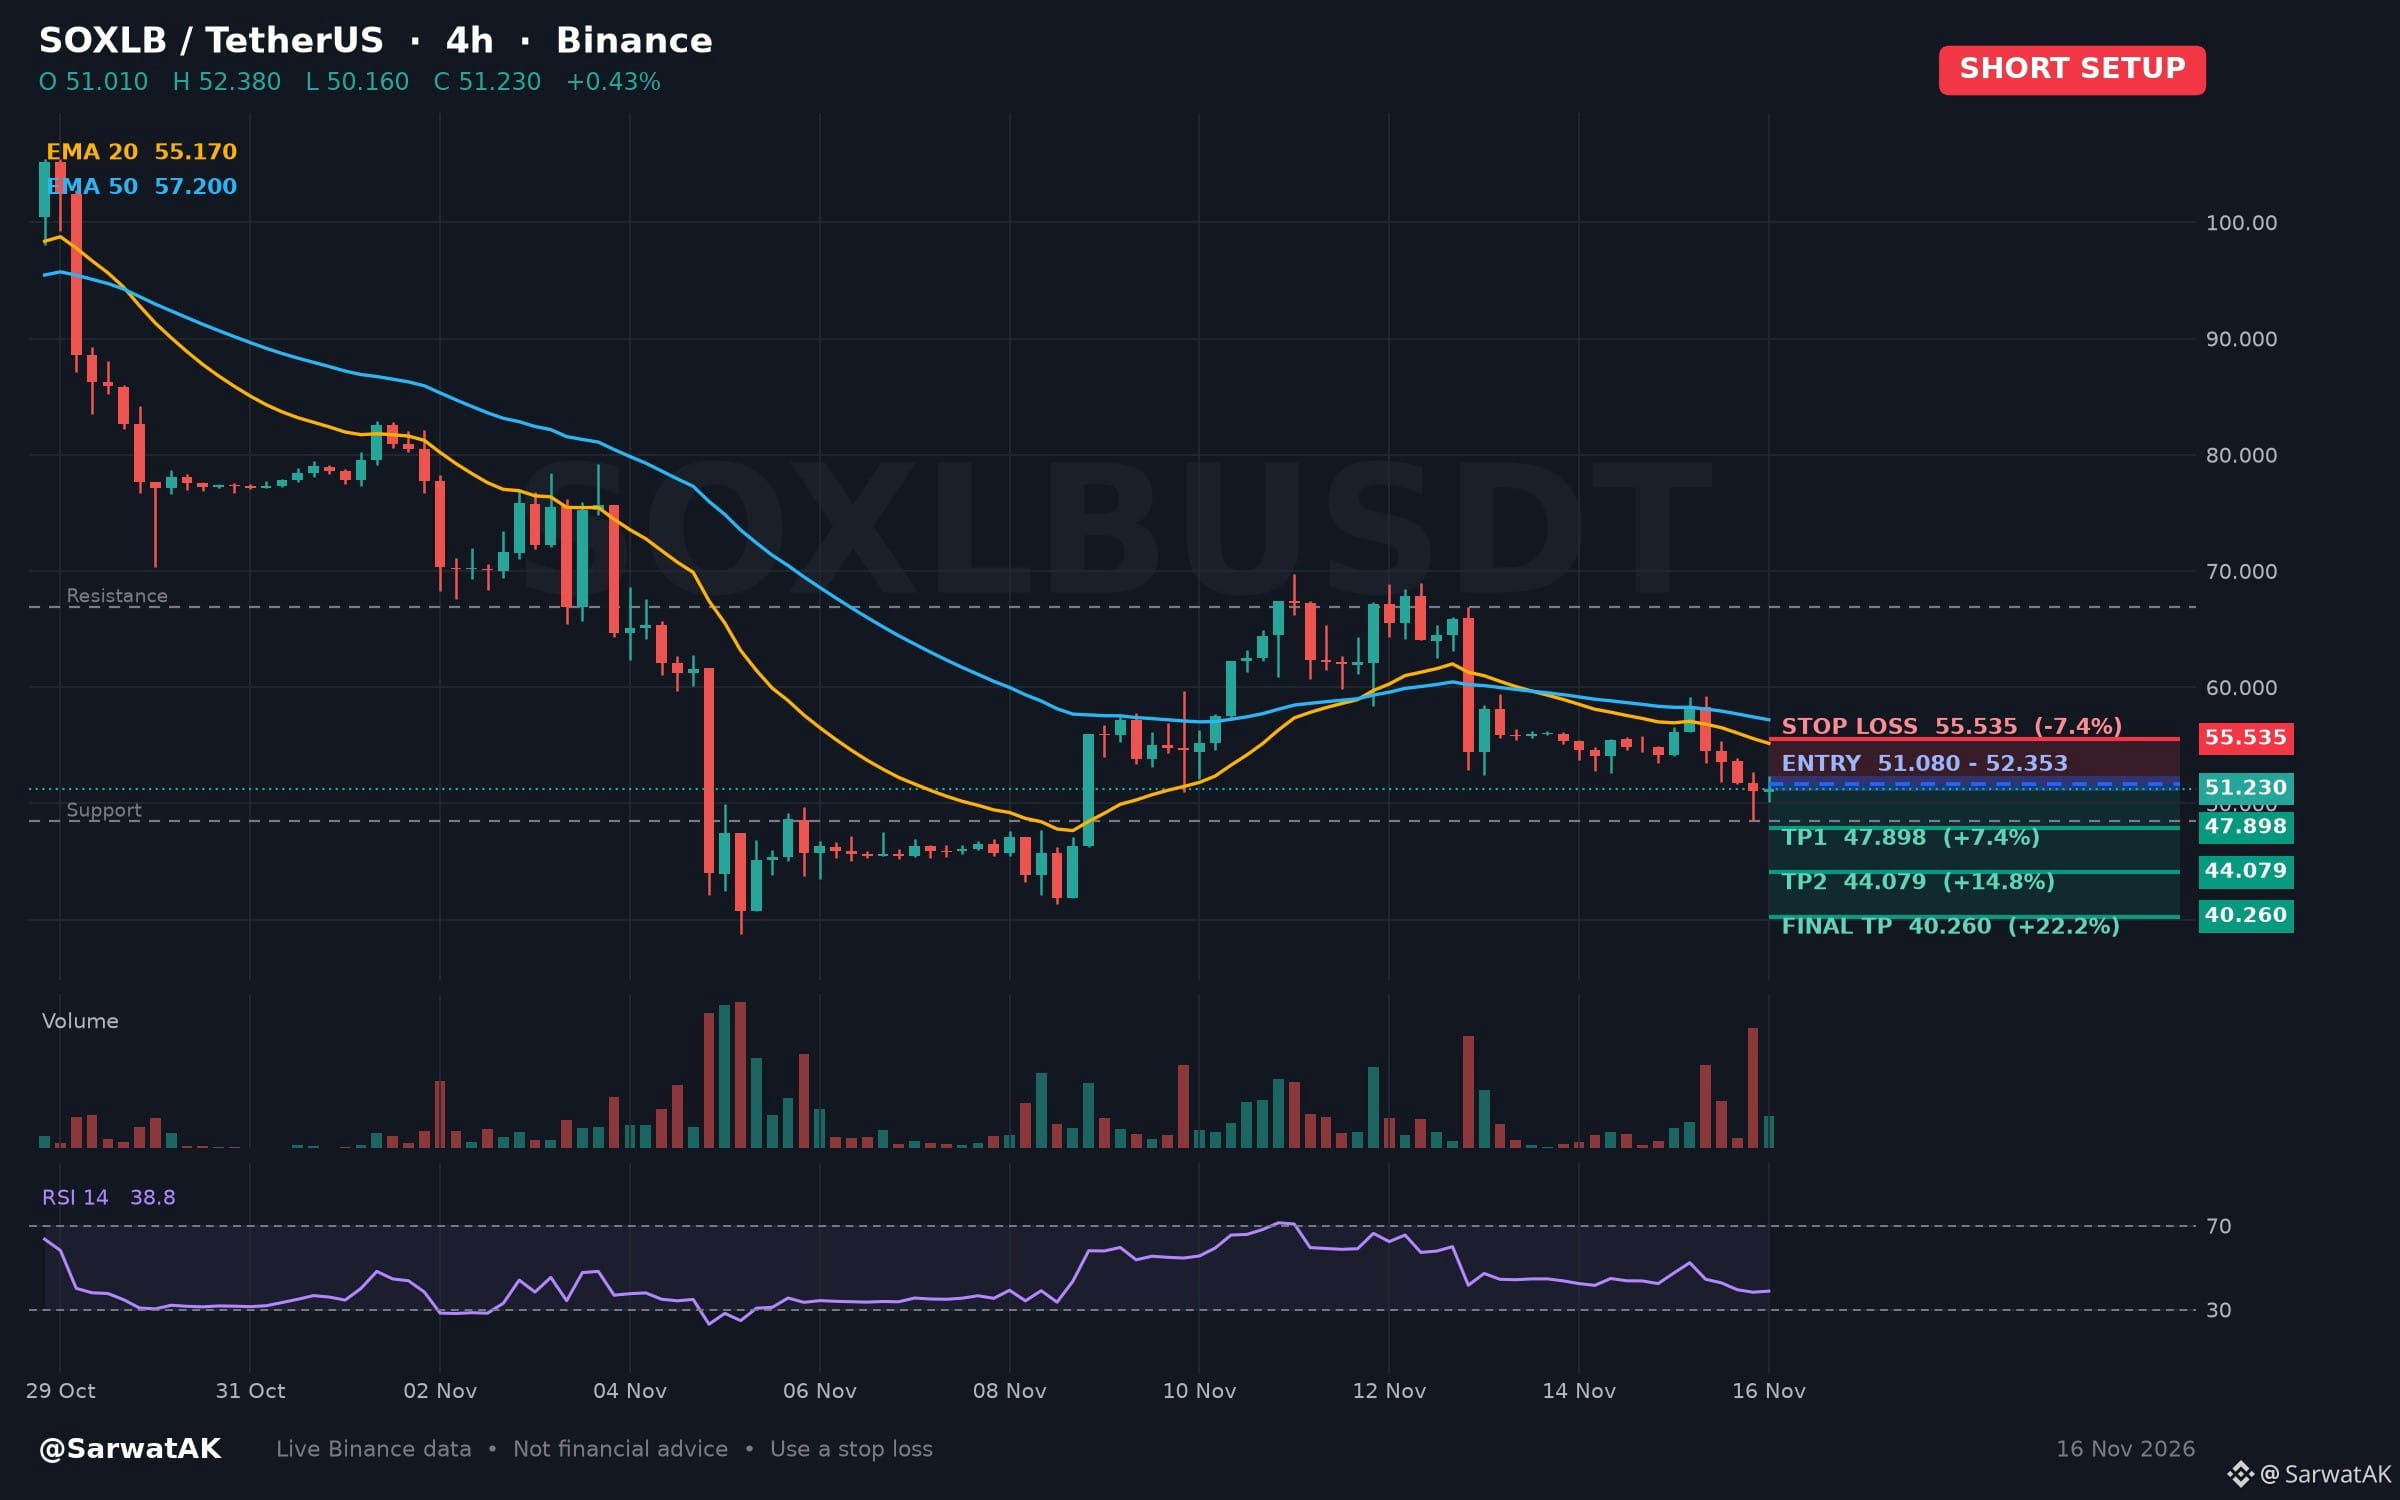
$SOXLB SHORT SETUP ... NEXT TARGET 40.260
Moving Average Alignment Signals Bearish Structure on Four-Hour Chart
Entry: 51.080 - 52.353 (Short)
TP1: 47.898
TP2: 44.079
Final TP: 40.260
SL: 55.535
Price trades below aligned exponential moving averages following downward movement over the past twenty-four hours. With the four-hour relative strength index in neutral territory, traders watch for momentum shifts rather than overbought conditions.
As long as price stays below 52.353, structure stays heavy
Must use stop loss while trading
Trade $SOXLB
Not financial advice. Always DYOR.
🙏 Tips are always welcome and truly appreciated. Thank you for supporting Open to Discussion.
Like & Follow for Daily Trade Analytics & Insider News. @SarwatAK
#SOXLB #TrendingTopic #AnthropicIPOTestsInvestorAppetiteForAI
$SOXLB SHORT SETUP ... NEXT TARGET 40.260
Moving Average Alignment Signals Bearish Structure on Four-Hour Chart
Entry: 51.080 - 52.353 (Short)
TP1: 47.898
TP2: 44.079
Final TP: 40.260
SL: 55.535
Price trades below aligned exponential moving averages following downward movement over the past twenty-four hours. With the four-hour relative strength index in neutral territory, traders watch for momentum shifts rather than overbought conditions.
As long as price stays below 52.353, structure stays heavy
Must use stop loss while trading
Trade $SOXLB
Not financial advice. Always DYOR.
🙏 Tips are always welcome and truly appreciated. Thank you for supporting Open to Discussion.
Like & Follow for Daily Trade Analytics & Insider News. @SarwatAK
#SOXLB #TrendingTopic #AnthropicIPOTestsInvestorAppetiteForAI
Moving Average Alignment Signals Bearish Structure on Four-Hour Chart
Entry: 51.080 - 52.353 (Short)
TP1: 47.898
TP2: 44.079
Final TP: 40.260
SL: 55.535
Price trades below aligned exponential moving averages following downward movement over the past twenty-four hours. With the four-hour relative strength index in neutral territory, traders watch for momentum shifts rather than overbought conditions.
As long as price stays below 52.353, structure stays heavy
Must use stop loss while trading
Trade $SOXLB
Not financial advice. Always DYOR.
🙏 Tips are always welcome and truly appreciated. Thank you for supporting Open to Discussion.
Like & Follow for Daily Trade Analytics & Insider News. @SarwatAK
#SOXLB #TrendingTopic #AnthropicIPOTestsInvestorAppetiteForAI
83

·
--
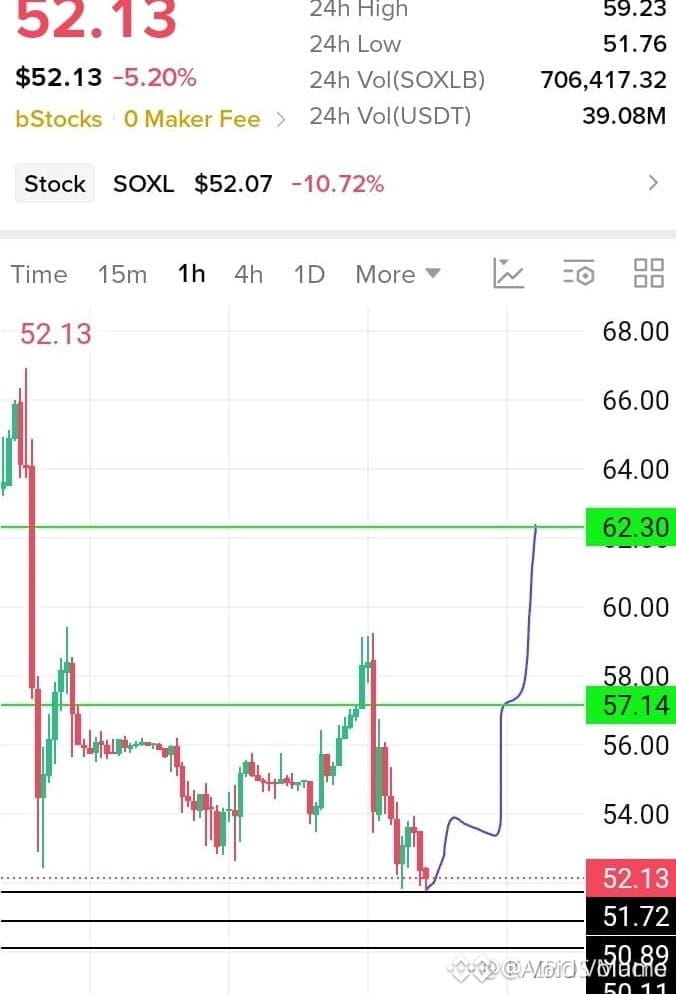
🚨 $SOXLB APPROACHING CRITICAL LIQUIDITY POOLS AS SMART MONEY TESTS THE 52 ZONE! 🦈
Entry: 52.20 ⚡
Target: 61.50 🚀
Stop Loss: 46.00 ⚠️
Price action is consolidating tightly around 52.20 while order flow indicates aggressive absorption near key structural support. 📊 Smart money positioning suggests a measured expansion toward higher liquidity pockets as volatility prepares to compress. ⚡
Maintaining strict risk parameters at 46.00 is essential while navigating these intermediate market fluctuations without emotional interference. 💡 Are you positioned for this structural rotation or waiting for confirmation closer to the range high? 👇
⚠️ Not financial advice. Always manage your risk. 🛡️
🏷️ #SOXLB #MarketStructure #SmartMoney #Crypto #PriceAction
🔥 💎
🚨 $SOXLB APPROACHING CRITICAL LIQUIDITY POOLS AS SMART MONEY TESTS THE 52 ZONE! 🦈
Entry: 52.20 ⚡
Target: 61.50 🚀
Stop Loss: 46.00 ⚠️
Price action is consolidating tightly around 52.20 while order flow indicates aggressive absorption near key structural support. 📊 Smart money positioning suggests a measured expansion toward higher liquidity pockets as volatility prepares to compress. ⚡
Maintaining strict risk parameters at 46.00 is essential while navigating these intermediate market fluctuations without emotional interference. 💡 Are you positioned for this structural rotation or waiting for confirmation closer to the range high? 👇
⚠️ Not financial advice. Always manage your risk. 🛡️
🏷️ #SOXLB #MarketStructure #SmartMoney #Crypto #PriceAction
🔥 💎
Entry: 52.20 ⚡
Target: 61.50 🚀
Stop Loss: 46.00 ⚠️
Price action is consolidating tightly around 52.20 while order flow indicates aggressive absorption near key structural support. 📊 Smart money positioning suggests a measured expansion toward higher liquidity pockets as volatility prepares to compress. ⚡
Maintaining strict risk parameters at 46.00 is essential while navigating these intermediate market fluctuations without emotional interference. 💡 Are you positioned for this structural rotation or waiting for confirmation closer to the range high? 👇
⚠️ Not financial advice. Always manage your risk. 🛡️
🏷️ #SOXLB #MarketStructure #SmartMoney #Crypto #PriceAction
🔥 💎
2
·
--
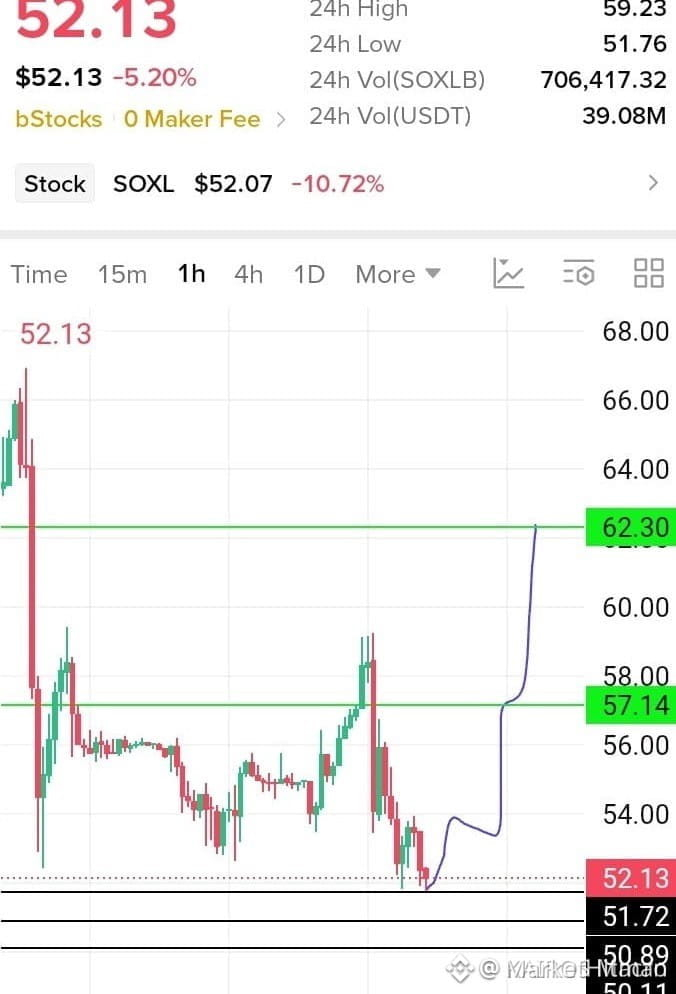
🚨 $SOXLB IS LOADING A MASSIVE BREAKOUT SETUP RIGHT INTO THE KEY RESISTANCE ZONE! 💥
Entry: 52.20 ⚡
Target: 56.80 / 61.50 🚀
Stop Loss: 46.00 ⚠️
The next four hours are critical as momentum compresses tightly below resistance. Buyers are quietly building a solid base while weak hands get shaken out of their positions. 📊
Controlling emotions during these high-voltage squeezes separates consistent execution from reactive panic. Stick to the plan and protect capital ruthlessly. 💡
Are you positioning for the leg up or waiting for a deeper retest? 👇
⚠️ Not financial advice. Always manage your risk. 🛡️
🏷️ #SOXLB #TradingSetup #Breakout #Crypto
🔥 💎
🚨 $SOXLB IS LOADING A MASSIVE BREAKOUT SETUP RIGHT INTO THE KEY RESISTANCE ZONE! 💥
Entry: 52.20 ⚡
Target: 56.80 / 61.50 🚀
Stop Loss: 46.00 ⚠️
The next four hours are critical as momentum compresses tightly below resistance. Buyers are quietly building a solid base while weak hands get shaken out of their positions. 📊
Controlling emotions during these high-voltage squeezes separates consistent execution from reactive panic. Stick to the plan and protect capital ruthlessly. 💡
Are you positioning for the leg up or waiting for a deeper retest? 👇
⚠️ Not financial advice. Always manage your risk. 🛡️
🏷️ #SOXLB #TradingSetup #Breakout #Crypto
🔥 💎
Entry: 52.20 ⚡
Target: 56.80 / 61.50 🚀
Stop Loss: 46.00 ⚠️
The next four hours are critical as momentum compresses tightly below resistance. Buyers are quietly building a solid base while weak hands get shaken out of their positions. 📊
Controlling emotions during these high-voltage squeezes separates consistent execution from reactive panic. Stick to the plan and protect capital ruthlessly. 💡
Are you positioning for the leg up or waiting for a deeper retest? 👇
⚠️ Not financial advice. Always manage your risk. 🛡️
🏷️ #SOXLB #TradingSetup #Breakout #Crypto
🔥 💎
12

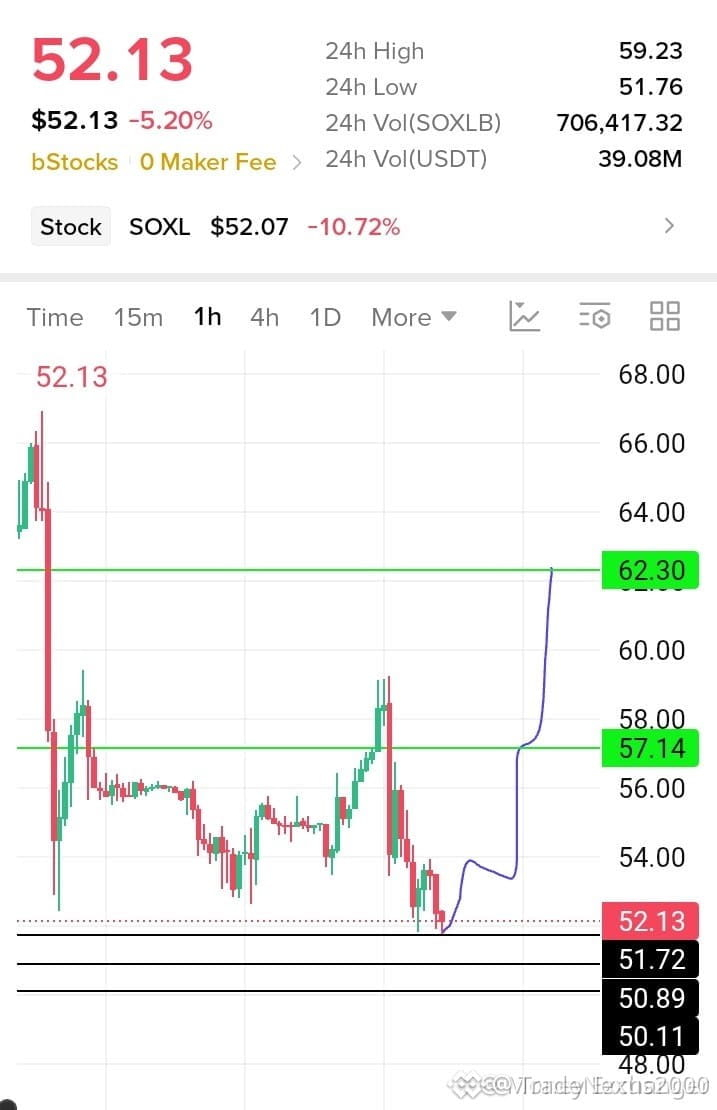
🦈 $SOXLB APPROACHING KEY LIQUIDITY ZONES AHEAD OF THE SESSION OPEN! ⚡
Entry: 52.20 ⚡
Target: 61.50 🚀
Stop Loss: 46.00 ⚠️
📌 Institutional order flow around the 52.20 support level suggests smart money accumulation is active as market participants position for the upcoming session open. 📊
🌊 Order book imbalances and structural inefficiency point toward an aggressive expansion phase targeting the 61.50 liquidity pool, with higher resistance clustering near 65.00. 💡
💬 Are you anticipating an immediate upside breakout or a liquidity sweep of support before the main push? 🤔
⚠️ Not financial advice. Always manage your risk. 🛡️
🏷️ #SOXLB #MarketStructure #Liquidity #Trading #SmartMoney
🔥 🦈
🦈 $SOXLB APPROACHING KEY LIQUIDITY ZONES AHEAD OF THE SESSION OPEN! ⚡
Entry: 52.20 ⚡
Target: 61.50 🚀
Stop Loss: 46.00 ⚠️
📌 Institutional order flow around the 52.20 support level suggests smart money accumulation is active as market participants position for the upcoming session open. 📊
🌊 Order book imbalances and structural inefficiency point toward an aggressive expansion phase targeting the 61.50 liquidity pool, with higher resistance clustering near 65.00. 💡
💬 Are you anticipating an immediate upside breakout or a liquidity sweep of support before the main push? 🤔
⚠️ Not financial advice. Always manage your risk. 🛡️
🏷️ #SOXLB #MarketStructure #Liquidity #Trading #SmartMoney
🔥 🦈
Entry: 52.20 ⚡
Target: 61.50 🚀
Stop Loss: 46.00 ⚠️
📌 Institutional order flow around the 52.20 support level suggests smart money accumulation is active as market participants position for the upcoming session open. 📊
🌊 Order book imbalances and structural inefficiency point toward an aggressive expansion phase targeting the 61.50 liquidity pool, with higher resistance clustering near 65.00. 💡
💬 Are you anticipating an immediate upside breakout or a liquidity sweep of support before the main push? 🤔
⚠️ Not financial advice. Always manage your risk. 🛡️
🏷️ #SOXLB #MarketStructure #Liquidity #Trading #SmartMoney
🔥 🦈
11

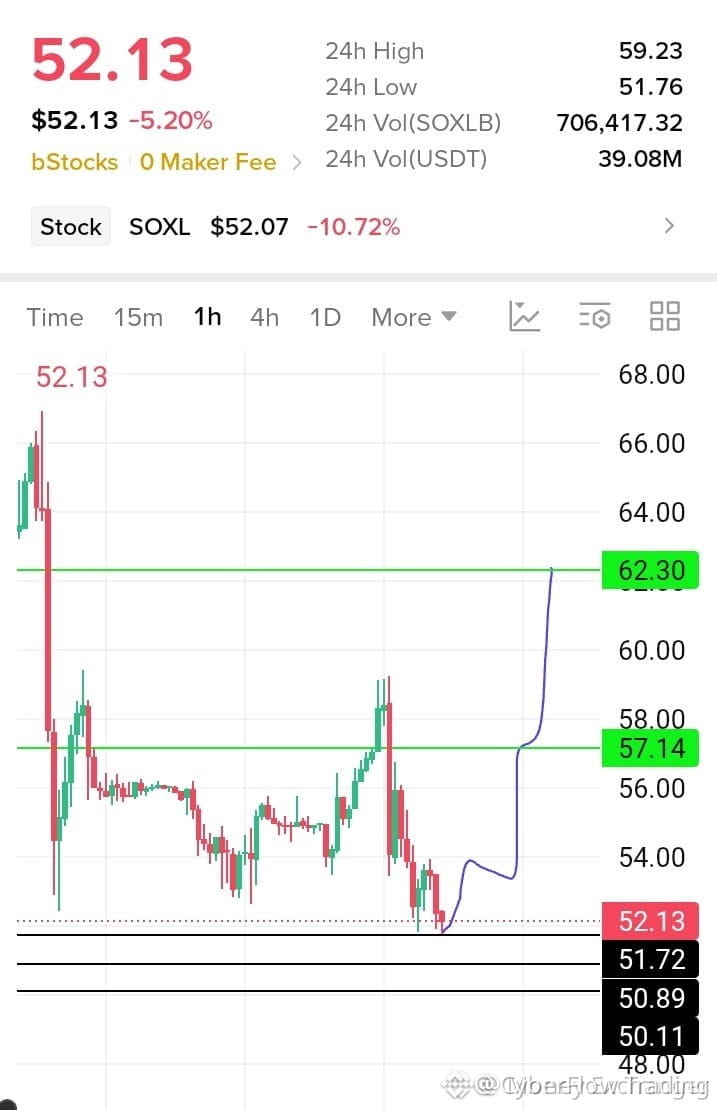
🚨 $SOXLB GEARS UP FOR THE NEW YORK OPEN WITH EYES ON THE 65 DOLLAR ZONE! ⚡
Entry: 52.20$ ⚡
Target: 61.50$ 🚀
Stop Loss: 46.00$ ⚠️
As the opening bell approaches in a few hours, momentum is quietly building inside the current consolidation base. Buyers are leaning hard against the 52.20 floor, prepping for an aggressive push back toward previous highs near that 62 to 65 resistance shelf. 📊
Volume profile hints that smart money is quietly accumulating shares ahead of the liquidity expansion window. If bulls maintain control of this structural pivot, velocity could pick up fast. 💡
💬 Are you positioning for the breakout before the bell rings or waiting for confirmation? 👇
⚠️ Not financial advice. Always manage your risk. 🛡️
🏷️ #SOXLB #Momentum #Breakout #Trading
🔥 💎
🚨 $SOXLB GEARS UP FOR THE NEW YORK OPEN WITH EYES ON THE 65 DOLLAR ZONE! ⚡
Entry: 52.20$ ⚡
Target: 61.50$ 🚀
Stop Loss: 46.00$ ⚠️
As the opening bell approaches in a few hours, momentum is quietly building inside the current consolidation base. Buyers are leaning hard against the 52.20 floor, prepping for an aggressive push back toward previous highs near that 62 to 65 resistance shelf. 📊
Volume profile hints that smart money is quietly accumulating shares ahead of the liquidity expansion window. If bulls maintain control of this structural pivot, velocity could pick up fast. 💡
💬 Are you positioning for the breakout before the bell rings or waiting for confirmation? 👇
⚠️ Not financial advice. Always manage your risk. 🛡️
🏷️ #SOXLB #Momentum #Breakout #Trading
🔥 💎
Entry: 52.20$ ⚡
Target: 61.50$ 🚀
Stop Loss: 46.00$ ⚠️
As the opening bell approaches in a few hours, momentum is quietly building inside the current consolidation base. Buyers are leaning hard against the 52.20 floor, prepping for an aggressive push back toward previous highs near that 62 to 65 resistance shelf. 📊
Volume profile hints that smart money is quietly accumulating shares ahead of the liquidity expansion window. If bulls maintain control of this structural pivot, velocity could pick up fast. 💡
💬 Are you positioning for the breakout before the bell rings or waiting for confirmation? 👇
⚠️ Not financial advice. Always manage your risk. 🛡️
🏷️ #SOXLB #Momentum #Breakout #Trading
🔥 💎
12

Paragraph 1:
$SOXLB has retreated from its resistance at $59.23, testing the demand area around $51.82. This level has previously provided support in late June and early July. Volatility is on the rise, contributing to a widening Bid-Ask Spread. The One-Hour Exponential Moving Average (EMA20) currently acts as a dynamic resistance, further capping upside potential around $54.55.
Paragraph 2:
A bearish rejection setup has formed, with the One-Hour Relative Strength Index (RSI) dropping below 40, indicating oversold conditions. The impending expiration of the current futures contract could contribute to increased volatility. Traders should watch for
$SOXLB $ETH $BNB #SOXLB #Write2Earn #BinanceSquare
Paragraph 1:
$SOXLB has retreated from its resistance at $59.23, testing the demand area around $51.82. This level has previously provided support in late June and early July. Volatility is on the rise, contributing to a widening Bid-Ask Spread. The One-Hour Exponential Moving Average (EMA20) currently acts as a dynamic resistance, further capping upside potential around $54.55.
Paragraph 2:
A bearish rejection setup has formed, with the One-Hour Relative Strength Index (RSI) dropping below 40, indicating oversold conditions. The impending expiration of the current futures contract could contribute to increased volatility. Traders should watch for
$SOXLB $ETH $BNB #SOXLB #Write2Earn #BinanceSquare
$SOXLB has retreated from its resistance at $59.23, testing the demand area around $51.82. This level has previously provided support in late June and early July. Volatility is on the rise, contributing to a widening Bid-Ask Spread. The One-Hour Exponential Moving Average (EMA20) currently acts as a dynamic resistance, further capping upside potential around $54.55.
Paragraph 2:
A bearish rejection setup has formed, with the One-Hour Relative Strength Index (RSI) dropping below 40, indicating oversold conditions. The impending expiration of the current futures contract could contribute to increased volatility. Traders should watch for
$SOXLB $ETH $BNB #SOXLB #Write2Earn #BinanceSquare
28

·
--
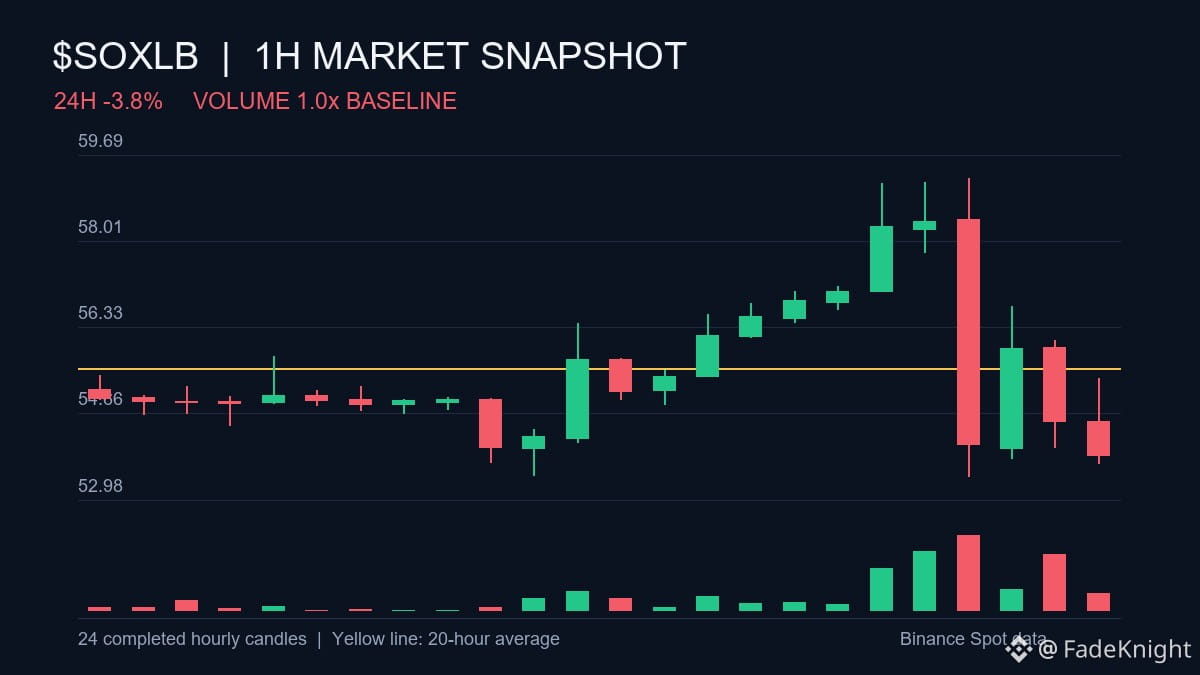
$SOXLB sits 0% of the way from its 24h low ($53.20) to its high ($59.23).
Context check: Latest price is 11.3% below the 24h high.
Is price holding the upper half of the range, or drifting back toward the middle?
#SOXLB #AltcoinFlow #RangeWatch
$SOXLB sits 0% of the way from its 24h low ($53.20) to its high ($59.23).
Context check: Latest price is 11.3% below the 24h high.
Is price holding the upper half of the range, or drifting back toward the middle?
#SOXLB #AltcoinFlow #RangeWatch
Context check: Latest price is 11.3% below the 24h high.
Is price holding the upper half of the range, or drifting back toward the middle?
#SOXLB #AltcoinFlow #RangeWatch
135

·
--
$SOXLB volume is outpacing the daily average despite recent price weakness.
The asset sits at $52.64, trailing its recent hourly close of $53.86. A bullish scenario requires reclaiming the $53.44 mark, which previously served as a floor during the last 23 hours. Conversely, failure to hold the current range signals potential further downside if the price breaks below recent lows.
Given the current volume-to-price divergence, are you waiting for a confirmed breakout above $53.44 before entering, or does the downward momentum signal a deeper correction?
Tap $SOXLB for the live chart. #SOXLB #BinanceSquare
$SOXLB volume is outpacing the daily average despite recent price weakness.
The asset sits at $52.64, trailing its recent hourly close of $53.86. A bullish scenario requires reclaiming the $53.44 mark, which previously served as a floor during the last 23 hours. Conversely, failure to hold the current range signals potential further downside if the price breaks below recent lows.
Given the current volume-to-price divergence, are you waiting for a confirmed breakout above $53.44 before entering, or does the downward momentum signal a deeper correction?
Tap $SOXLB for the live chart. #SOXLB #BinanceSquare
The asset sits at $52.64, trailing its recent hourly close of $53.86. A bullish scenario requires reclaiming the $53.44 mark, which previously served as a floor during the last 23 hours. Conversely, failure to hold the current range signals potential further downside if the price breaks below recent lows.
Given the current volume-to-price divergence, are you waiting for a confirmed breakout above $53.44 before entering, or does the downward momentum signal a deeper correction?
Tap $SOXLB for the live chart. #SOXLB #BinanceSquare
1

·
--
Your stop on $SOXLB at 58.1100 is probably in the wrong place based on noise
Most traders pick a random percentage loss like 2 percent and get chopped out before the real move starts
On $SOXLB the hourly swing is 1.6 percent which means normal market breathing room eats up tight stops instantly
The 24h swing low sits at 52.6300 down below
If you put a stop above that structural floor you are just handing money to the order book
A proper stop belongs right under the swing low that completely breaks your trade thesis
Where do you usually put your stops when the market gets choppy
#SOXLB #TradingTips
Your stop on $SOXLB at 58.1100 is probably in the wrong place based on noise
Most traders pick a random percentage loss like 2 percent and get chopped out before the real move starts
On $SOXLB the hourly swing is 1.6 percent which means normal market breathing room eats up tight stops instantly
The 24h swing low sits at 52.6300 down below
If you put a stop above that structural floor you are just handing money to the order book
A proper stop belongs right under the swing low that completely breaks your trade thesis
Where do you usually put your stops when the market gets choppy
#SOXLB #TradingTips
Most traders pick a random percentage loss like 2 percent and get chopped out before the real move starts
On $SOXLB the hourly swing is 1.6 percent which means normal market breathing room eats up tight stops instantly
The 24h swing low sits at 52.6300 down below
If you put a stop above that structural floor you are just handing money to the order book
A proper stop belongs right under the swing low that completely breaks your trade thesis
Where do you usually put your stops when the market gets choppy
#SOXLB #TradingTips
49
·
--
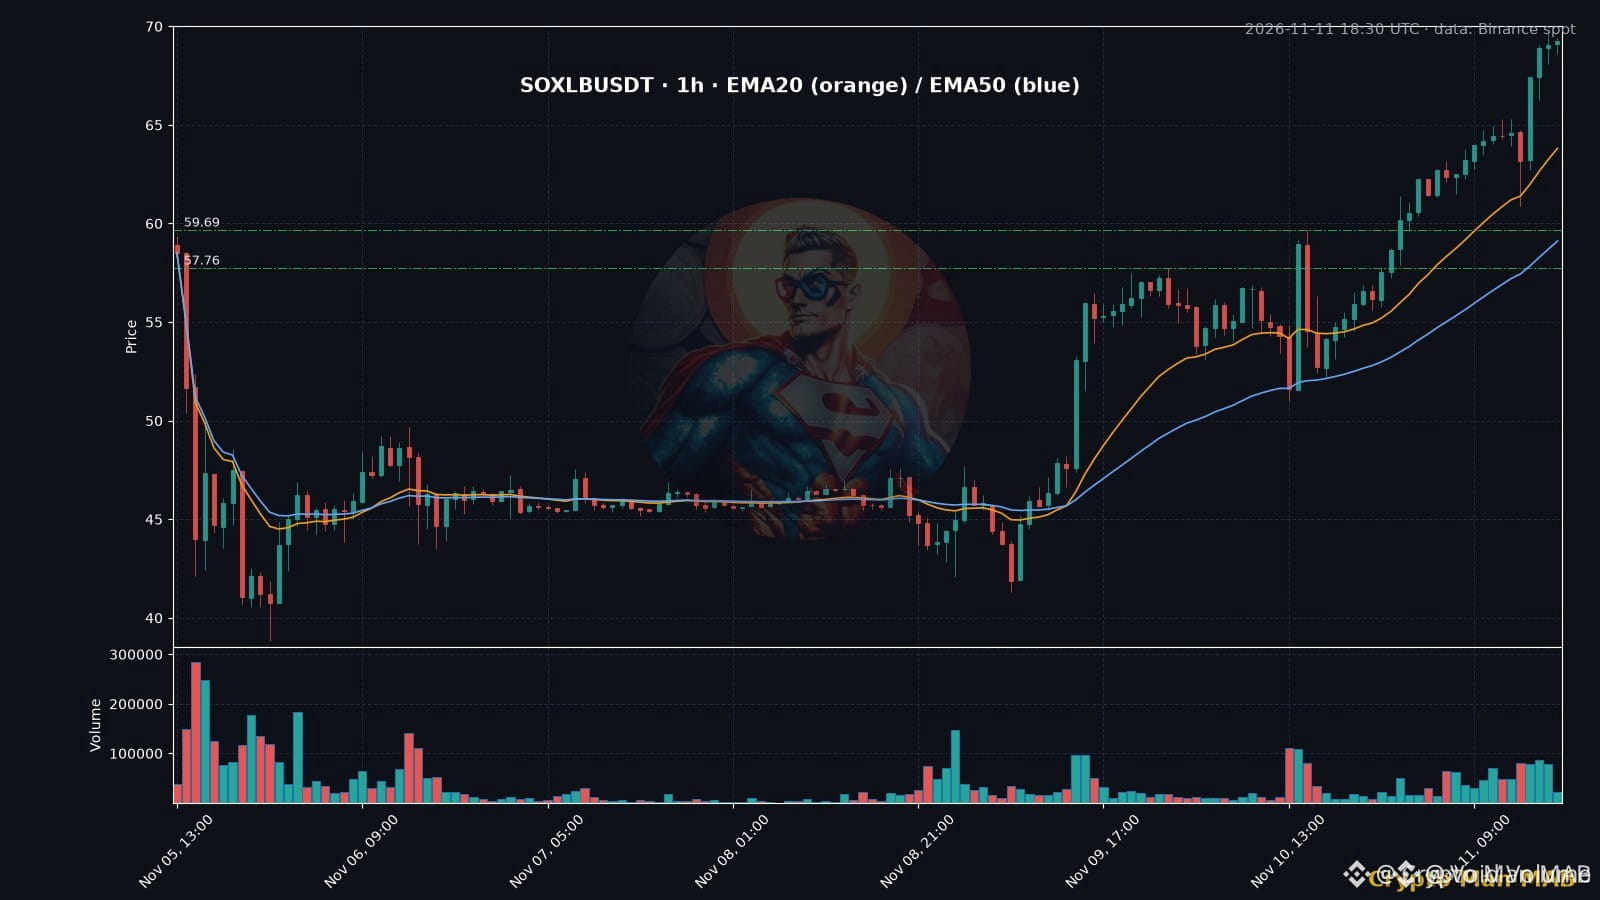
🚀 $SOXLB UNLOADS A MASSIVE EXPANSION AS INSTITUTIONAL BID ABSORBS THE US OPEN FLUSH! ⚡
Entry: 67.4 ⚡
Target: 69.7 🚀
Stop Loss: 63 ⚠️
Institutional order flow on this high-beta vehicle remains aggressively bid after a violent liquidity sweep to 60.9 at the session open was instantly defended. Price sliced through 65 with zero friction, leaving a clean structural imbalance that smart money is currently auctioning above. 📊
We are closely monitoring the 67.4 hourly close to confirm sustained buying pressure. Reclaiming this structural pivot opens the path directly toward the 69.7 high and unchartered territory into the 70s. 💡
Are you fading this momentum or positioning for continuation toward the upper handle? 👇
⚠️ Not financial advice. Always manage your risk. 🛡️
🏷️ #SOXLB #MarketStructure #OrderFlow #Breakout #Altcoins
🔥 💎
🚀 $SOXLB UNLOADS A MASSIVE EXPANSION AS INSTITUTIONAL BID ABSORBS THE US OPEN FLUSH! ⚡
Entry: 67.4 ⚡
Target: 69.7 🚀
Stop Loss: 63 ⚠️
Institutional order flow on this high-beta vehicle remains aggressively bid after a violent liquidity sweep to 60.9 at the session open was instantly defended. Price sliced through 65 with zero friction, leaving a clean structural imbalance that smart money is currently auctioning above. 📊
We are closely monitoring the 67.4 hourly close to confirm sustained buying pressure. Reclaiming this structural pivot opens the path directly toward the 69.7 high and unchartered territory into the 70s. 💡
Are you fading this momentum or positioning for continuation toward the upper handle? 👇
⚠️ Not financial advice. Always manage your risk. 🛡️
🏷️ #SOXLB #MarketStructure #OrderFlow #Breakout #Altcoins
🔥 💎
Entry: 67.4 ⚡
Target: 69.7 🚀
Stop Loss: 63 ⚠️
Institutional order flow on this high-beta vehicle remains aggressively bid after a violent liquidity sweep to 60.9 at the session open was instantly defended. Price sliced through 65 with zero friction, leaving a clean structural imbalance that smart money is currently auctioning above. 📊
We are closely monitoring the 67.4 hourly close to confirm sustained buying pressure. Reclaiming this structural pivot opens the path directly toward the 69.7 high and unchartered territory into the 70s. 💡
Are you fading this momentum or positioning for continuation toward the upper handle? 👇
⚠️ Not financial advice. Always manage your risk. 🛡️
🏷️ #SOXLB #MarketStructure #OrderFlow #Breakout #Altcoins
🔥 💎
3

·
--
Verified
$SOXLB
先把它的性质说清楚:这不是 半导体3倍做多 ETF 股票本身,是 BTech 发的代币化凭证,1:1 托管底层股票。派息扣 30% 税,盘后做市商爱撤单,滑点会吃掉利润。
走势上 在往下走,卖压还在,等止跌再说,现在 24h -5.7%。
关键位:53.44 上方压力,49.29 下方支撑,破了别硬扛。
结论:小仓博弈可以,重仓赌它不划算,赔率不站在你这边。
(个人分析,不构成投资建议)
#SOXLB
$SOXLB
先把它的性质说清楚:这不是 半导体3倍做多 ETF 股票本身,是 BTech 发的代币化凭证,1:1 托管底层股票。派息扣 30% 税,盘后做市商爱撤单,滑点会吃掉利润。
走势上 在往下走,卖压还在,等止跌再说,现在 24h -5.7%。
关键位:53.44 上方压力,49.29 下方支撑,破了别硬扛。
结论:小仓博弈可以,重仓赌它不划算,赔率不站在你这边。
(个人分析,不构成投资建议)
#SOXLB
先把它的性质说清楚:这不是 半导体3倍做多 ETF 股票本身,是 BTech 发的代币化凭证,1:1 托管底层股票。派息扣 30% 税,盘后做市商爱撤单,滑点会吃掉利润。
走势上 在往下走,卖压还在,等止跌再说,现在 24h -5.7%。
关键位:53.44 上方压力,49.29 下方支撑,破了别硬扛。
结论:小仓博弈可以,重仓赌它不划算,赔率不站在你这边。
(个人分析,不构成投资建议)
#SOXLB
Islaice:
三倍杠杆的路径损耗叠加代币流动性风险,方向看对也未必赚得到。比起盯支撑位,我更在意美股休市时盘口能不能接得住。
1
1
1.1k


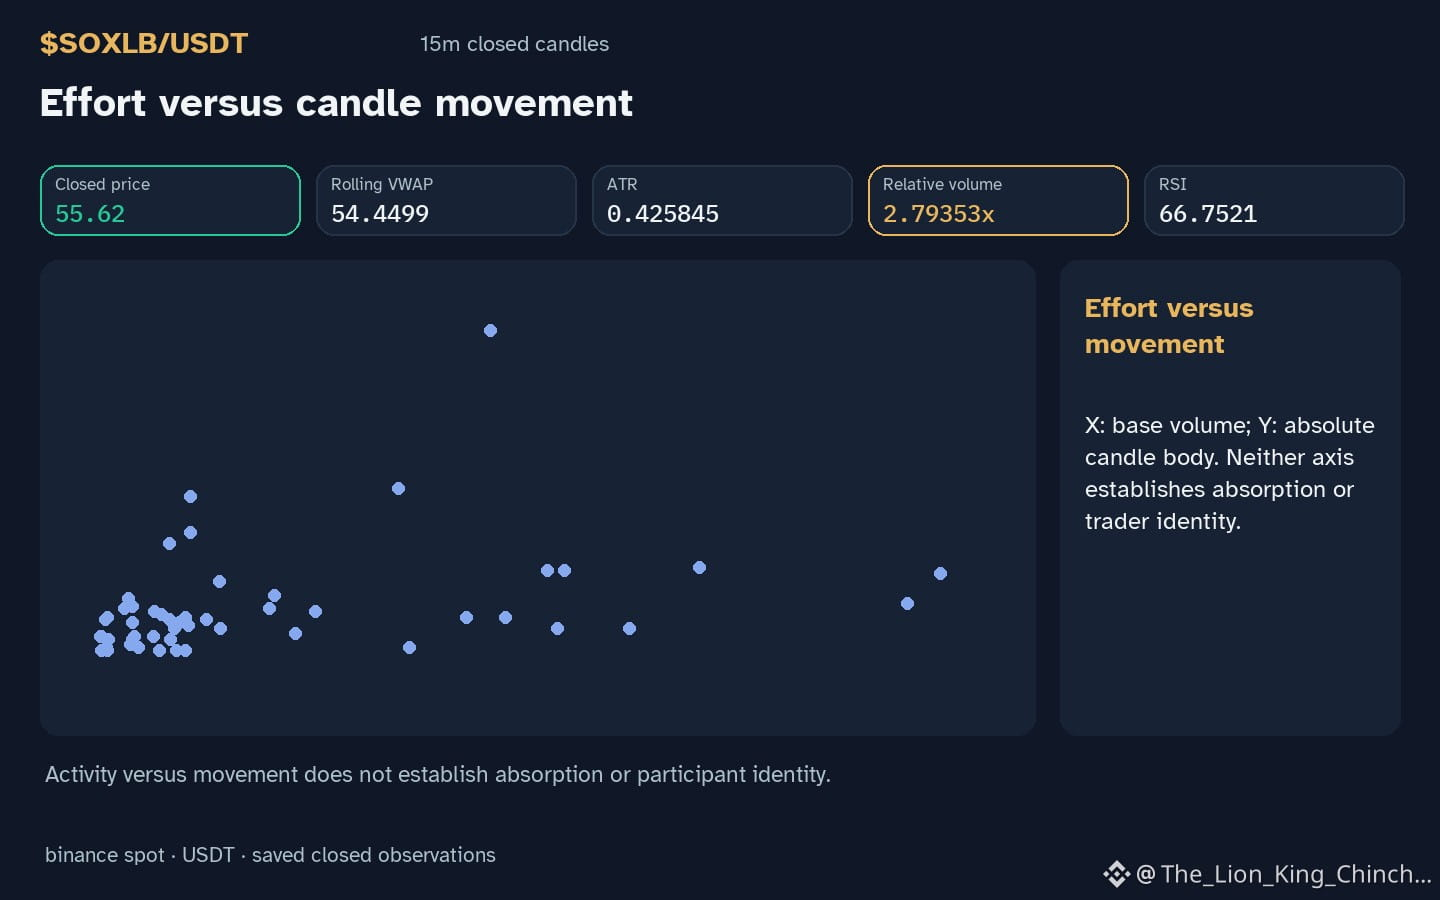
$SOXLB: Identical Moves, Different Questions
$SOXLB moves up with volume above baseline. Does this match the peers? $BTC also moves up with expanded volume. $GLMR moves up but volume stays near baseline.
A hypothetical mechanism exists. Imagine two stocks in the same sector both rising daily. One sees heavy buying; the other sees little participation. The heavy volume suggests more traders are engaged in the price change. The light volume suggests a different internal dynamic, perhaps fewer orders needed to push the price. This is participation divergence. It treats the price move as a neutral event and asks who is acting.
This analogy has limits. Shared direction is not measured correlation. It does not prove capital rotation or a common cause. Candles alone cannot confirm trader motives or order flow. We must treat this as a thought experiment, not a current fact about actual order books.
To reassess this interpretation, look for future closed-candle evidence. If $SOXLB continues rising while volume normalizes, the initial expansion may have been an isolated event rather than a sustained shift in engagement. This would weaken the idea of a distinct participation pattern. The comparison is valid only within the observed snapshot window.
Probabilistic market research, not a recommendation or guaranteed return.
The comparison to keep in mind: $BTC has hourly direction up and volume above its baseline; $GLMR has hourly direction up and volume not above its baseline. This alone does not establish correlation.
#SOXLB #BTC #GLMR #CryptoWatchlist #CryptoLearning
$SOXLB : Identical Moves, Different Questions
$SOXLB moves up with volume above baseline. Does this match the peers? $BTC also moves up with expanded volume. $GLMR moves up but volume stays near baseline.
A hypothetical mechanism exists. Imagine two stocks in the same sector both rising daily. One sees heavy buying; the other sees little participation. The heavy volume suggests more traders are engaged in the price change. The light volume suggests a different internal dynamic, perhaps fewer orders needed to push the price. This is participation divergence. It treats the price move as a neutral event and asks who is acting.
This analogy has limits. Shared direction is not measured correlation. It does not prove capital rotation or a common cause. Candles alone cannot confirm trader motives or order flow. We must treat this as a thought experiment, not a current fact about actual order books.
To reassess this interpretation, look for future closed-candle evidence. If $SOXLB continues rising while volume normalizes, the initial expansion may have been an isolated event rather than a sustained shift in engagement. This would weaken the idea of a distinct participation pattern. The comparison is valid only within the observed snapshot window.
Probabilistic market research, not a recommendation or guaranteed return.
The comparison to keep in mind: $BTC has hourly direction up and volume above its baseline; $GLMR has hourly direction up and volume not above its baseline. This alone does not establish correlation.
#SOXLB #BTC #GLMR #CryptoWatchlist #CryptoLearning
$SOXLB moves up with volume above baseline. Does this match the peers? $BTC also moves up with expanded volume. $GLMR moves up but volume stays near baseline.
A hypothetical mechanism exists. Imagine two stocks in the same sector both rising daily. One sees heavy buying; the other sees little participation. The heavy volume suggests more traders are engaged in the price change. The light volume suggests a different internal dynamic, perhaps fewer orders needed to push the price. This is participation divergence. It treats the price move as a neutral event and asks who is acting.
This analogy has limits. Shared direction is not measured correlation. It does not prove capital rotation or a common cause. Candles alone cannot confirm trader motives or order flow. We must treat this as a thought experiment, not a current fact about actual order books.
To reassess this interpretation, look for future closed-candle evidence. If $SOXLB continues rising while volume normalizes, the initial expansion may have been an isolated event rather than a sustained shift in engagement. This would weaken the idea of a distinct participation pattern. The comparison is valid only within the observed snapshot window.
Probabilistic market research, not a recommendation or guaranteed return.
The comparison to keep in mind: $BTC has hourly direction up and volume above its baseline; $GLMR has hourly direction up and volume not above its baseline. This alone does not establish correlation.
#SOXLB #BTC #GLMR #CryptoWatchlist #CryptoLearning
32

·
--
$SOXLB +2.74% | $币安人生 +2.55% | $SOLV +2.48%
#SOXLB at $56.21 rose 2.74% on $13.0M volume.
#币安人生 at $0.4713 up 2.55% with $2.4M traded.
#SOLV at $0.00437200 gained 2.48% on $2.2M volume; its Staking Abstraction Layer keeps it ahead in Bitcoin staking.
Watch the relatively low volume behind SOLV’s move – a shift could signal broader interest in staking platforms.
#Write2Earn #Binance
$SOXLB +2.74% | $币安人生 +2.55% | $SOLV +2.48%
#SOXLB at $56.21 rose 2.74% on $13.0M volume.
#币安人生 at $0.4713 up 2.55% with $2.4M traded.
#SOLV at $0.00437200 gained 2.48% on $2.2M volume; its Staking Abstraction Layer keeps it ahead in Bitcoin staking.
Watch the relatively low volume behind SOLV’s move – a shift could signal broader interest in staking platforms.
#Write2Earn #Binance
#SOXLB at $56.21 rose 2.74% on $13.0M volume.
#币安人生 at $0.4713 up 2.55% with $2.4M traded.
#SOLV at $0.00437200 gained 2.48% on $2.2M volume; its Staking Abstraction Layer keeps it ahead in Bitcoin staking.
Watch the relatively low volume behind SOLV’s move – a shift could signal broader interest in staking platforms.
#Write2Earn #Binance
6
Log in to explore more content
Join global crypto users on Binance Square
⚡️ Get latest and useful information about crypto.
💬 Trusted by the world’s largest crypto exchange.
👍 Discover real insights from verified creators.
Email / Phone number
Trending Topics
1
#A Packed Week of Earnings and Data Tests Markets
69,610 views
452 Discussing
2
#AnthropicIPOTestsInvestorAppetiteForAI
137,115 views
1,527 Discussing
3
#NvidiaBoardNotConsideringHuang’sReturnasCEO
2,869 views
100 Discussing
4
#WhatInvestmentSignalsDo13FFilingsReveal?
1,515 views
71 Discussing
5
#SevenUSBanksDisclose$29.4MInXRPETFHoldings
205 views
23 Discussing
6
#InvescoStablecoinReservesFundLaunchesOnEthereum
173 views
16 Discussing
7
#CypherpunkReports$306MQ3NetProfit
461 views
9 Discussing
8
#OPTIMJACKAttackInfectsAtLeast186Websites
1,918 views
57 Discussing
9
#StrategySells2.09MMSTRSharesFor$244.7M
1,256 views
14 Discussing
10
#StablecoinMarketShrinksAtFastestPaceSinceTerraLuna
2,958 views
42 Discussing