

#peterbrandt
peterbrandt
79,916 views
158 Discussing
Hot
Latest

·
--
Peter Brandt ve a Ethereum en 8.600 dólares si supera los 5.000
Peter Brandt cree que el precio de Ethereum alcanzaría los 8600 dólares tras un quiebre de los 5000 dólares. El Ether avanzando alrededor de 2660 dólares, este escenario sigue siendo lejano y depende de múltiples resistencias intermedias.
Peter Brandt apunta a un ether a 8600 $ tras un quiebre de los 5000 $.
El umbral de los 3000 $ sigue siendo la primera resistencia importante a superar.
Los ETF de Ethereum registran nuevas entradas de capital.
BitMine sigue acumulando y apostando una parte importante de sus ETH.
El objetivo de 8600 $ sigue siendo un escenario técnico, sin garantía ni cronograma preciso.
Los tres niveles clave de la previsión de Ethereum
Este 21 de septiembre, Peter Brandt publicó un gráfico a largo plazo que abarca los futuros del Ether del CME. En su análisis, muestra una primera resistencia mayor alrededor de 5000 dólares, luego un objetivo ubicado de forma precisa en 8674,50 dólares.
El analista redondeó este segundo nivel a 8600 dólares. Al precio actual, el Ether debería primero avanzar cerca de un 88 % para acercarse a los 5000 dólares. Un aumento hasta 8600 dólares constituiría luego una ganancia total cercana al 223 %.
Esta hipótesis se estructura gracias a tres niveles :
La zona de los 3000 dólares, primera resistencia a corto plazo ;
El umbral de los 5000 dólares, necesario para validar el escenario ;
El objetivo a largo plazo comprendido entre 8600 y 8675 dólares.
Peter Brandt declara entonces :
Mi gráfico a largo plazo sobre ETH implica un movimiento hacia 8600 dólares una vez que se crucen los 5000 dólares.
$ETH
{spot}(ETHUSDT)
$OBT
{alpha}(560xcef5b397051fc92026249670e918c0ad7b8585e4)
$PETS.US
{stock_us}(PETS.US)
#PeterBrandt
Peter Brandt ve a Ethereum en 8.600 dólares si supera los 5.000
Peter Brandt cree que el precio de Ethereum alcanzaría los 8600 dólares tras un quiebre de los 5000 dólares. El Ether avanzando alrededor de 2660 dólares, este escenario sigue siendo lejano y depende de múltiples resistencias intermedias.
Peter Brandt apunta a un ether a 8600 $ tras un quiebre de los 5000 $.
El umbral de los 3000 $ sigue siendo la primera resistencia importante a superar.
Los ETF de Ethereum registran nuevas entradas de capital.
BitMine sigue acumulando y apostando una parte importante de sus ETH.
El objetivo de 8600 $ sigue siendo un escenario técnico, sin garantía ni cronograma preciso.
Los tres niveles clave de la previsión de Ethereum
Este 21 de septiembre, Peter Brandt publicó un gráfico a largo plazo que abarca los futuros del Ether del CME. En su análisis, muestra una primera resistencia mayor alrededor de 5000 dólares, luego un objetivo ubicado de forma precisa en 8674,50 dólares.
El analista redondeó este segundo nivel a 8600 dólares. Al precio actual, el Ether debería primero avanzar cerca de un 88 % para acercarse a los 5000 dólares. Un aumento hasta 8600 dólares constituiría luego una ganancia total cercana al 223 %.
Esta hipótesis se estructura gracias a tres niveles :
La zona de los 3000 dólares, primera resistencia a corto plazo ;
El umbral de los 5000 dólares, necesario para validar el escenario ;
El objetivo a largo plazo comprendido entre 8600 y 8675 dólares.
Peter Brandt declara entonces :
Mi gráfico a largo plazo sobre ETH implica un movimiento hacia 8600 dólares una vez que se crucen los 5000 dólares.
$ETH
$OBT
$PETS.US
#PeterBrandt
Peter Brandt cree que el precio de Ethereum alcanzaría los 8600 dólares tras un quiebre de los 5000 dólares. El Ether avanzando alrededor de 2660 dólares, este escenario sigue siendo lejano y depende de múltiples resistencias intermedias.
Peter Brandt apunta a un ether a 8600 $ tras un quiebre de los 5000 $.
El umbral de los 3000 $ sigue siendo la primera resistencia importante a superar.
Los ETF de Ethereum registran nuevas entradas de capital.
BitMine sigue acumulando y apostando una parte importante de sus ETH.
El objetivo de 8600 $ sigue siendo un escenario técnico, sin garantía ni cronograma preciso.
Los tres niveles clave de la previsión de Ethereum
Este 21 de septiembre, Peter Brandt publicó un gráfico a largo plazo que abarca los futuros del Ether del CME. En su análisis, muestra una primera resistencia mayor alrededor de 5000 dólares, luego un objetivo ubicado de forma precisa en 8674,50 dólares.
El analista redondeó este segundo nivel a 8600 dólares. Al precio actual, el Ether debería primero avanzar cerca de un 88 % para acercarse a los 5000 dólares. Un aumento hasta 8600 dólares constituiría luego una ganancia total cercana al 223 %.
Esta hipótesis se estructura gracias a tres niveles :
La zona de los 3000 dólares, primera resistencia a corto plazo ;
El umbral de los 5000 dólares, necesario para validar el escenario ;
El objetivo a largo plazo comprendido entre 8600 y 8675 dólares.
Peter Brandt declara entonces :
Mi gráfico a largo plazo sobre ETH implica un movimiento hacia 8600 dólares una vez que se crucen los 5000 dólares.
$ETH
$OBT
$PETS.US
#PeterBrandt

145

·
--

Article
نشر بيتر برانت للتو مخططات XRP و ETH طويلة الأجل — اقرأ تحذيره أولاًنشر المتداول المخضرم بيتر براندت، المعروف على نطاق واسع باسم ساحر الأسواق، في يوم 21 سبتمبر رسمين بيانيين طويلّي الأمد، متوقعاً ارتفاع ريبل إلى ٥,٤٠ $ و إيثيريوم إلى ٨ ٦٠٠ $.
تعتمد كل الأهداف فقط على التحليل الفني الكلاسيكي، وليس على الأساسيات أو المقاييس على السلسلة أو المحفزات قصيرة الأجل.
ماذا تُظهر رسومات براندت البيانية فعلياً؟
كتب براندت أن الرسم البياني طويل الأمد لريبل يُشير إلى ارتفاع محتمل في المستقبل إلى ٥,٤٠ $. عند وقت النشر، تم تداول ريبل بالقرب من ١,٥٢ $، مما يعني أن هذا التوقع يُمثل زيادة تتجاوز ٢٥٠% عن المستويات الحالية.
يُبرز رسمه البياني بنية توطيد عريضة، تُظهر خط مقاومة هابط من قمم الدورات السابقة مقابل خط دعم صاعد من القيعان السابقة.
تحليل سعر ريبل.⬆️
نشر براندت قبلها بساعات رسماً بيانياً مشابهاً لإيثيريوم، وقال إن ذلك يُشير إلى أن السعر قد يصل في النهاية إلى ٨ ٦٠٠ $ بمجرد اختراق مستوى ٥ ٠٠٠ $. مع تداول eth حوالي ٢ ٧٣١ $، فإن هذا الهدف يُمثل صعوداً نظرياً كبيراً، شرط تجاوز مستوى ٥ ٠٠٠ $ كخطوة متوسطة.
أرفق براندت تحذيراً في كلا المنشورين. أكد أن مشاركة الرسم البياني ليست كتداول فعلي، وأن المتداولين الذين يتخذون مراكز فعلية يجب أن يقدموا أدلة قابلة للتحقق بدلاً من الاعتماد فقط على منشورات مواقع التواصل الاجتماعي.
تحليل سعر إيثيريوم (eth)⬆️
لماذا تجذب توقعات اكس ار بي واثيريوم كل هذا الاهتمام؟
دعم مؤسس ريل فيجن راوول بال هذا الموقف المتزن علنًا، وامتدح طريقة برانت في مشاركة الاحتمالات والملاحظات بدلًا من تقديم وعود بلا أساس.
تكسب هذه التوقعات أهميتها جزئيًا بسبب الجهة التي تصدرها. بنى برانت سمعته من خلال تطبيق أساليب الرسم البياني الكلاسيكي، وخطوط الاتجاه، والدعم والمقاومة، وأنماط تمتد لسنوات عديدة، وقبل وجود العملات الرقمية كفئة أصول من الأساس.
يعزز السياق الداعم للسوق الخلفية الصاعدة. سجلت منصة بينانس مؤخرًا تدفقات اكس ار بي الداخلة بنسبة 663% أعلى من المتوسط الفصلي، رغم أن احتياطيات البورصة ارتفعت بشكل هامشي فقط، ما يشير إلى إعادة تموضع وليس ضغط بيع كبير. في المقابل، جمعت محافظ الحيتان أكثر من 2 مليار دولار من اكس ار بي في الأيام التي سبقت هذا الصعود الأخير.
قفز اكس ار بي بنحو 5,2% في آخر 24 ساعة، وتداول فوق 1,50 دولار مع تحسن معنويات السوق بشكل عام. وصلت بيتكوين أيضًا إلى أعلى مستوى خلال ثمانية أشهر بالقرب من 87329 دولار في نفس اليوم، ما رفع معنويات العملات الرقمية الكبرى.
ردد محللون آخرون هياكل صاعدة مشابهة. أشار بعضهم إلى إغلاق اثيريوم الأسبوعي فوق 2550 دولار باعتباره يفتح الباب للوصول إلى 2900 إلى 3000 دولار، بينما سلّط آخرون الضوء على نهاية اتجاه هبوطي استمر عدة سنوات، ما يشير إلى أن أهدافًا أعلى بكثير تظل ممكنة مع الوقت.
ذكر محلل العملات رقمية مايكل فان دي بوب على منصة X أنه بصراحة، لن أُفاجأ إذا رأينا eth يرتفع إلى 15000-20000دولار في هذا السوق الصاعد. الدورة السابقة كانت ضعيفة للغاية بالنسبة للبدائل. هذه المرة، الأمر يشبه 2017 مرة أخرى، مما يعني أن الارتفاع سوف يكون أكبر بكثير من الدورات السابقة.
يبقى تحقق وصول اكس ار بي إلى 5,40 دولار أو تقدم اثيريوم إلى 8 600 دولار احتمالية فنية بعيدة المدى وليس نتيجة مضمونة. قال برانت نفسه أن الرسم البياني يمثل ملاحظة حول الاحتمال ، وليس وعدًا حول السعر.
$XRP
{spot}(XRPUSDT)
$ETH
{spot}(ETHUSDT)
نشر بيتر برانت للتو مخططات XRP و ETH طويلة الأجل — اقرأ تحذيره أولاً
نشر المتداول المخضرم بيتر براندت، المعروف على نطاق واسع باسم ساحر الأسواق، في يوم 21 سبتمبر رسمين بيانيين طويلّي الأمد، متوقعاً ارتفاع ريبل إلى ٥,٤٠ $ و إيثيريوم إلى ٨ ٦٠٠ $.
تعتمد كل الأهداف فقط على التحليل الفني الكلاسيكي، وليس على الأساسيات أو المقاييس على السلسلة أو المحفزات قصيرة الأجل.
ماذا تُظهر رسومات براندت البيانية فعلياً؟
كتب براندت أن الرسم البياني طويل الأمد لريبل يُشير إلى ارتفاع محتمل في المستقبل إلى ٥,٤٠ $. عند وقت النشر، تم تداول ريبل بالقرب من ١,٥٢ $، مما يعني أن هذا التوقع يُمثل زيادة تتجاوز ٢٥٠% عن المستويات الحالية.
يُبرز رسمه البياني بنية توطيد عريضة، تُظهر خط مقاومة هابط من قمم الدورات السابقة مقابل خط دعم صاعد من القيعان السابقة.
تحليل سعر ريبل.⬆️
نشر براندت قبلها بساعات رسماً بيانياً مشابهاً لإيثيريوم، وقال إن ذلك يُشير إلى أن السعر قد يصل في النهاية إلى ٨ ٦٠٠ $ بمجرد اختراق مستوى ٥ ٠٠٠ $. مع تداول eth حوالي ٢ ٧٣١ $، فإن هذا الهدف يُمثل صعوداً نظرياً كبيراً، شرط تجاوز مستوى ٥ ٠٠٠ $ كخطوة متوسطة.
أرفق براندت تحذيراً في كلا المنشورين. أكد أن مشاركة الرسم البياني ليست كتداول فعلي، وأن المتداولين الذين يتخذون مراكز فعلية يجب أن يقدموا أدلة قابلة للتحقق بدلاً من الاعتماد فقط على منشورات مواقع التواصل الاجتماعي.
تحليل سعر إيثيريوم (eth)⬆️
لماذا تجذب توقعات اكس ار بي واثيريوم كل هذا الاهتمام؟
دعم مؤسس ريل فيجن راوول بال هذا الموقف المتزن علنًا، وامتدح طريقة برانت في مشاركة الاحتمالات والملاحظات بدلًا من تقديم وعود بلا أساس.
تكسب هذه التوقعات أهميتها جزئيًا بسبب الجهة التي تصدرها. بنى برانت سمعته من خلال تطبيق أساليب الرسم البياني الكلاسيكي، وخطوط الاتجاه، والدعم والمقاومة، وأنماط تمتد لسنوات عديدة، وقبل وجود العملات الرقمية كفئة أصول من الأساس.
يعزز السياق الداعم للسوق الخلفية الصاعدة. سجلت منصة بينانس مؤخرًا تدفقات اكس ار بي الداخلة بنسبة 663% أعلى من المتوسط الفصلي، رغم أن احتياطيات البورصة ارتفعت بشكل هامشي فقط، ما يشير إلى إعادة تموضع وليس ضغط بيع كبير. في المقابل، جمعت محافظ الحيتان أكثر من 2 مليار دولار من اكس ار بي في الأيام التي سبقت هذا الصعود الأخير.
قفز اكس ار بي بنحو 5,2% في آخر 24 ساعة، وتداول فوق 1,50 دولار مع تحسن معنويات السوق بشكل عام. وصلت بيتكوين أيضًا إلى أعلى مستوى خلال ثمانية أشهر بالقرب من 87329 دولار في نفس اليوم، ما رفع معنويات العملات الرقمية الكبرى.
ردد محللون آخرون هياكل صاعدة مشابهة. أشار بعضهم إلى إغلاق اثيريوم الأسبوعي فوق 2550 دولار باعتباره يفتح الباب للوصول إلى 2900 إلى 3000 دولار، بينما سلّط آخرون الضوء على نهاية اتجاه هبوطي استمر عدة سنوات، ما يشير إلى أن أهدافًا أعلى بكثير تظل ممكنة مع الوقت.
ذكر محلل العملات رقمية مايكل فان دي بوب على منصة X أنه بصراحة، لن أُفاجأ إذا رأينا eth يرتفع إلى 15000-20000دولار في هذا السوق الصاعد. الدورة السابقة كانت ضعيفة للغاية بالنسبة للبدائل. هذه المرة، الأمر يشبه 2017 مرة أخرى، مما يعني أن الارتفاع سوف يكون أكبر بكثير من الدورات السابقة.
يبقى تحقق وصول اكس ار بي إلى 5,40 دولار أو تقدم اثيريوم إلى 8 600 دولار احتمالية فنية بعيدة المدى وليس نتيجة مضمونة. قال برانت نفسه أن الرسم البياني يمثل ملاحظة حول الاحتمال ، وليس وعدًا حول السعر.
$XRP
$ETH
تعتمد كل الأهداف فقط على التحليل الفني الكلاسيكي، وليس على الأساسيات أو المقاييس على السلسلة أو المحفزات قصيرة الأجل.
ماذا تُظهر رسومات براندت البيانية فعلياً؟
كتب براندت أن الرسم البياني طويل الأمد لريبل يُشير إلى ارتفاع محتمل في المستقبل إلى ٥,٤٠ $. عند وقت النشر، تم تداول ريبل بالقرب من ١,٥٢ $، مما يعني أن هذا التوقع يُمثل زيادة تتجاوز ٢٥٠% عن المستويات الحالية.
يُبرز رسمه البياني بنية توطيد عريضة، تُظهر خط مقاومة هابط من قمم الدورات السابقة مقابل خط دعم صاعد من القيعان السابقة.
تحليل سعر ريبل.⬆️
نشر براندت قبلها بساعات رسماً بيانياً مشابهاً لإيثيريوم، وقال إن ذلك يُشير إلى أن السعر قد يصل في النهاية إلى ٨ ٦٠٠ $ بمجرد اختراق مستوى ٥ ٠٠٠ $. مع تداول eth حوالي ٢ ٧٣١ $، فإن هذا الهدف يُمثل صعوداً نظرياً كبيراً، شرط تجاوز مستوى ٥ ٠٠٠ $ كخطوة متوسطة.
أرفق براندت تحذيراً في كلا المنشورين. أكد أن مشاركة الرسم البياني ليست كتداول فعلي، وأن المتداولين الذين يتخذون مراكز فعلية يجب أن يقدموا أدلة قابلة للتحقق بدلاً من الاعتماد فقط على منشورات مواقع التواصل الاجتماعي.
تحليل سعر إيثيريوم (eth)⬆️
لماذا تجذب توقعات اكس ار بي واثيريوم كل هذا الاهتمام؟
دعم مؤسس ريل فيجن راوول بال هذا الموقف المتزن علنًا، وامتدح طريقة برانت في مشاركة الاحتمالات والملاحظات بدلًا من تقديم وعود بلا أساس.
تكسب هذه التوقعات أهميتها جزئيًا بسبب الجهة التي تصدرها. بنى برانت سمعته من خلال تطبيق أساليب الرسم البياني الكلاسيكي، وخطوط الاتجاه، والدعم والمقاومة، وأنماط تمتد لسنوات عديدة، وقبل وجود العملات الرقمية كفئة أصول من الأساس.
يعزز السياق الداعم للسوق الخلفية الصاعدة. سجلت منصة بينانس مؤخرًا تدفقات اكس ار بي الداخلة بنسبة 663% أعلى من المتوسط الفصلي، رغم أن احتياطيات البورصة ارتفعت بشكل هامشي فقط، ما يشير إلى إعادة تموضع وليس ضغط بيع كبير. في المقابل، جمعت محافظ الحيتان أكثر من 2 مليار دولار من اكس ار بي في الأيام التي سبقت هذا الصعود الأخير.
قفز اكس ار بي بنحو 5,2% في آخر 24 ساعة، وتداول فوق 1,50 دولار مع تحسن معنويات السوق بشكل عام. وصلت بيتكوين أيضًا إلى أعلى مستوى خلال ثمانية أشهر بالقرب من 87329 دولار في نفس اليوم، ما رفع معنويات العملات الرقمية الكبرى.
ردد محللون آخرون هياكل صاعدة مشابهة. أشار بعضهم إلى إغلاق اثيريوم الأسبوعي فوق 2550 دولار باعتباره يفتح الباب للوصول إلى 2900 إلى 3000 دولار، بينما سلّط آخرون الضوء على نهاية اتجاه هبوطي استمر عدة سنوات، ما يشير إلى أن أهدافًا أعلى بكثير تظل ممكنة مع الوقت.
ذكر محلل العملات رقمية مايكل فان دي بوب على منصة X أنه بصراحة، لن أُفاجأ إذا رأينا eth يرتفع إلى 15000-20000دولار في هذا السوق الصاعد. الدورة السابقة كانت ضعيفة للغاية بالنسبة للبدائل. هذه المرة، الأمر يشبه 2017 مرة أخرى، مما يعني أن الارتفاع سوف يكون أكبر بكثير من الدورات السابقة.
يبقى تحقق وصول اكس ار بي إلى 5,40 دولار أو تقدم اثيريوم إلى 8 600 دولار احتمالية فنية بعيدة المدى وليس نتيجة مضمونة. قال برانت نفسه أن الرسم البياني يمثل ملاحظة حول الاحتمال ، وليس وعدًا حول السعر.
$XRP
$ETH
1
729
·
--
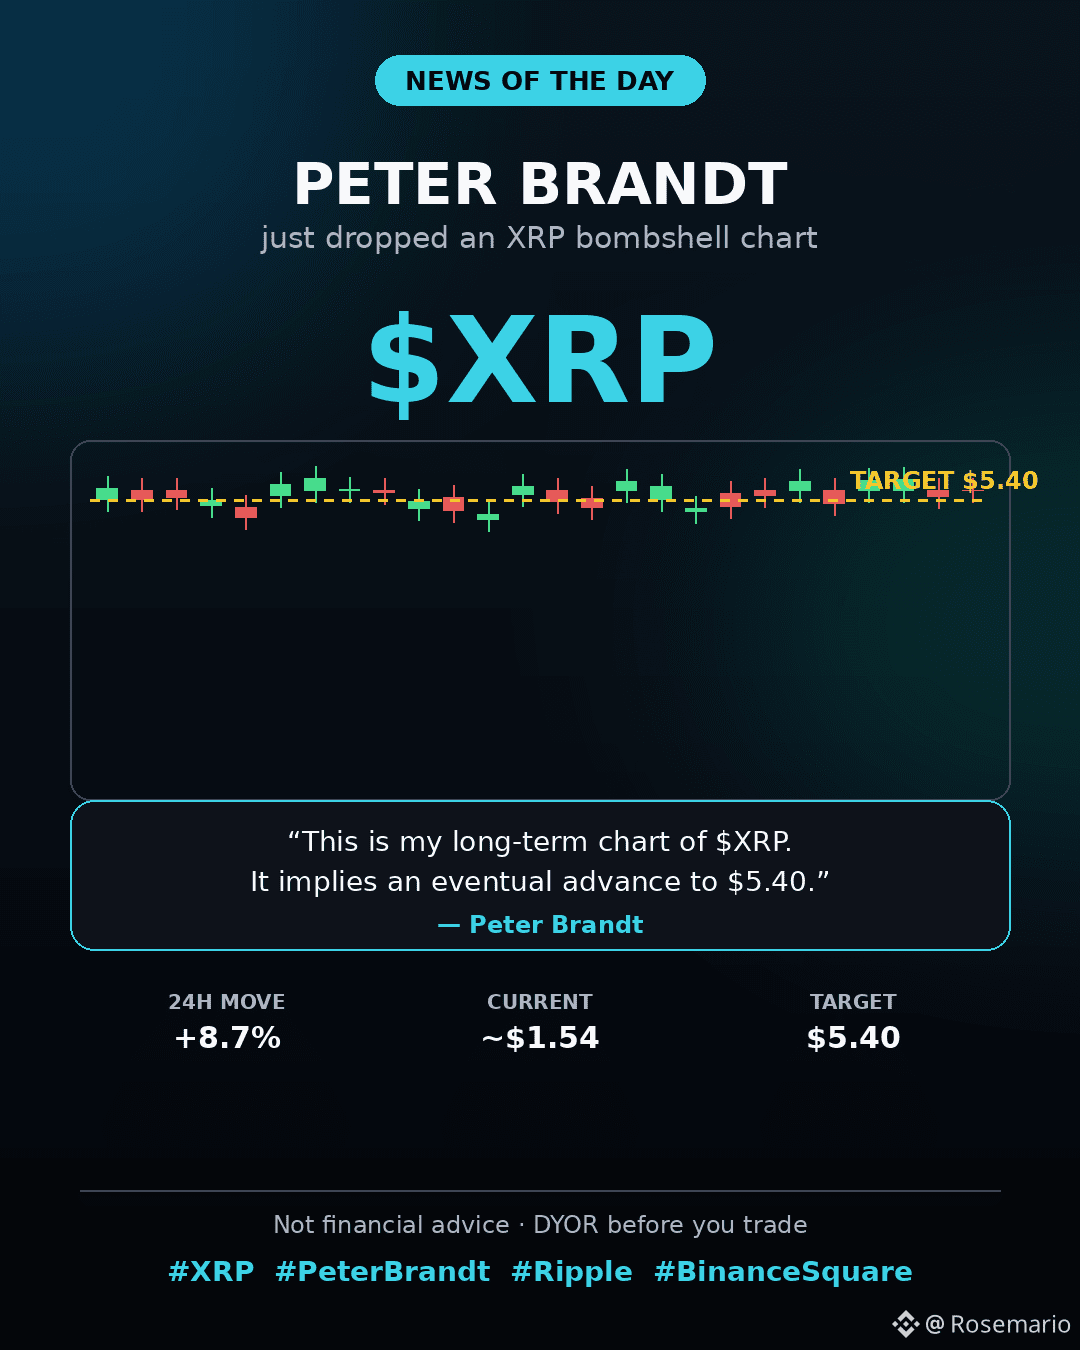
PETER BRANDT JUST DROPPED A BOMBSHELL $XRP CHART
The legendary 50-year trader posted his long-term $XRP
chart on X — and it points to $5.40 📈
XRP is already up 8.7% today, trading near $1.54
Brandt says the monthly chart "implies an eventual advance to $5.40"
That's a potential 3.5x from here
He's also clear it's not a trade call — just chart structure
$5 XRP... crazy talk or is Brandt onto something? 👇
Not financial advice. DYOR.
#XRP #PeterBrandt #Ripple💰 #BinanceSquareBTC
{future}(XRPUSDT)
PETER BRANDT JUST DROPPED A BOMBSHELL $XRP CHART
The legendary 50-year trader posted his long-term $XRP
chart on X — and it points to $5.40 📈
XRP is already up 8.7% today, trading near $1.54
Brandt says the monthly chart "implies an eventual advance to $5.40"
That's a potential 3.5x from here
He's also clear it's not a trade call — just chart structure
$5 XRP... crazy talk or is Brandt onto something? 👇
Not financial advice. DYOR.
#XRP #PeterBrandt #Ripple💰 #BinanceSquareBTC
The legendary 50-year trader posted his long-term $XRP
chart on X — and it points to $5.40 📈
XRP is already up 8.7% today, trading near $1.54
Brandt says the monthly chart "implies an eventual advance to $5.40"
That's a potential 3.5x from here
He's also clear it's not a trade call — just chart structure
$5 XRP... crazy talk or is Brandt onto something? 👇
Not financial advice. DYOR.
#XRP #PeterBrandt #Ripple💰 #BinanceSquareBTC

2
1.1k

·
--
Article
بيتر براندت يُحيي هدفه الأسطوري الصاعد لعام 2019 الخاص بالبيتكوينأعاد بيتر براندت، الرئيس التنفيذي لشركة Factor LLC، إلى الواجهة رسمه البياني اللوغاريتمي الشهير من يونيو 2019، مشيراً إلى أن بنية المرحلة الصاعدة الرابعة للبيتكوين لا تزال صالحة.
وتزامنت عودة هذا التوقع المؤرشف مع اختراق العملة الرقمية مستوى 80,000 دولار واختبارها لمقاومة قوية عند 82,000 دولار. ووفقاً للمحللين، فإن إعادة نشر هذا الخبير المخضرم في وول ستريت لتوقعه يشير مباشرة إلى أن الاتجاه الصعودي متعدد السنوات للعملة لا يزال قائماً.
### توقع 2019 الأصلي
في المنشور الأصلي الصادر في يونيو 2019، عندما كان البيتكوين يتداول عند نحو 10,000 دولار فقط، توقع براندت هدفاً بقيمة 100,000 دولار. واستناداً إلى الرسوم البيانية الخاصة بشركة Factor LLC، أظهر المحلل الذي يمتلك خبرة 45 عاماً أنه لا يوجد أصل تقليدي — بما في ذلك أسهم آبل وأمازون ونتفليكس والذهب — يمكنه محاكاة الأداء الدوري للعملة الرقمية. وسجلت البيانات التاريخية مكاسب بلغت 20 و489 و42 و93 ضعفاً في الدورات السابقة للبيتكوين على التوالي.
### مدفوع بالمؤسسات لا بالمتداولين الأفراد: لماذا لا يزال نموذج 2019 الصاعد صالحاً في 2026؟
عاد هذا الرسم البياني إلى الواجهة في سبتمبر 2026 بسبب بنية حركة سعر البيتكوين؛ إذ يُظهر الرسم البياني اللوغاريتمي الأسبوعي أن السعر الحالي منضغط بالقرب من الحد الأدنى للقناة الصاعدة التاريخية، مكرراً بذلك مرحلة تجميع واسعة.
ويكمن الفارق الأوضح بين المرحلة الحالية وظروف السوق في 2019 في الدعم المؤسسي؛ فقبل سبع سنوات، كانت الموجة الصاعدة مدفوعة بشكل خالص بالمضاربة ومعنويات المستثمرين الأفراد. أما اليوم، فإن استقرار القناة السعرية مدعوم بصناديق كبرى وتدفقات رأسمالية منهجية عبر صناديق الاستثمار المتداولة الفورية (ETF). ونظراً لضخامة القيمة السوقية للبيتكوين، سيواجه صعوبة في تحقيق عوائده السابقة التي بلغت 100 ضعف — نتيجة تأثير تناقص العوائد — لكن المسار اللوغاريتمي نفسه لا يزال دون تغيير.
يبقى نموذج براندت مرجعاً رئيسياً للسوق، مؤكداً أن السيناريو الصاعد لا يزال صالحاً طالما ظلت خطوط الدعم الحرجة صامدة. وسيكون الطريق نحو مستويات قياسية جديدة غير خطي، لكن طالما صمد الحد الأدنى لخط الاتجاه، سيواصل البيتكوين لعب دوره الخاص — وهو دور لا مثيل له في تاريخ التمويل العالمي.
@Binance_Square_Official
#PeterBrandt
بيتر براندت يُحيي هدفه الأسطوري الصاعد لعام 2019 الخاص بالبيتكوين
أعاد بيتر براندت، الرئيس التنفيذي لشركة Factor LLC، إلى الواجهة رسمه البياني اللوغاريتمي الشهير من يونيو 2019، مشيراً إلى أن بنية المرحلة الصاعدة الرابعة للبيتكوين لا تزال صالحة.
وتزامنت عودة هذا التوقع المؤرشف مع اختراق العملة الرقمية مستوى 80,000 دولار واختبارها لمقاومة قوية عند 82,000 دولار. ووفقاً للمحللين، فإن إعادة نشر هذا الخبير المخضرم في وول ستريت لتوقعه يشير مباشرة إلى أن الاتجاه الصعودي متعدد السنوات للعملة لا يزال قائماً.
### توقع 2019 الأصلي
في المنشور الأصلي الصادر في يونيو 2019، عندما كان البيتكوين يتداول عند نحو 10,000 دولار فقط، توقع براندت هدفاً بقيمة 100,000 دولار. واستناداً إلى الرسوم البيانية الخاصة بشركة Factor LLC، أظهر المحلل الذي يمتلك خبرة 45 عاماً أنه لا يوجد أصل تقليدي — بما في ذلك أسهم آبل وأمازون ونتفليكس والذهب — يمكنه محاكاة الأداء الدوري للعملة الرقمية. وسجلت البيانات التاريخية مكاسب بلغت 20 و489 و42 و93 ضعفاً في الدورات السابقة للبيتكوين على التوالي.
### مدفوع بالمؤسسات لا بالمتداولين الأفراد: لماذا لا يزال نموذج 2019 الصاعد صالحاً في 2026؟
عاد هذا الرسم البياني إلى الواجهة في سبتمبر 2026 بسبب بنية حركة سعر البيتكوين؛ إذ يُظهر الرسم البياني اللوغاريتمي الأسبوعي أن السعر الحالي منضغط بالقرب من الحد الأدنى للقناة الصاعدة التاريخية، مكرراً بذلك مرحلة تجميع واسعة.
ويكمن الفارق الأوضح بين المرحلة الحالية وظروف السوق في 2019 في الدعم المؤسسي؛ فقبل سبع سنوات، كانت الموجة الصاعدة مدفوعة بشكل خالص بالمضاربة ومعنويات المستثمرين الأفراد. أما اليوم، فإن استقرار القناة السعرية مدعوم بصناديق كبرى وتدفقات رأسمالية منهجية عبر صناديق الاستثمار المتداولة الفورية (ETF). ونظراً لضخامة القيمة السوقية للبيتكوين، سيواجه صعوبة في تحقيق عوائده السابقة التي بلغت 100 ضعف — نتيجة تأثير تناقص العوائد — لكن المسار اللوغاريتمي نفسه لا يزال دون تغيير.
يبقى نموذج براندت مرجعاً رئيسياً للسوق، مؤكداً أن السيناريو الصاعد لا يزال صالحاً طالما ظلت خطوط الدعم الحرجة صامدة. وسيكون الطريق نحو مستويات قياسية جديدة غير خطي، لكن طالما صمد الحد الأدنى لخط الاتجاه، سيواصل البيتكوين لعب دوره الخاص — وهو دور لا مثيل له في تاريخ التمويل العالمي.
@Binance Square Official
#PeterBrandt
وتزامنت عودة هذا التوقع المؤرشف مع اختراق العملة الرقمية مستوى 80,000 دولار واختبارها لمقاومة قوية عند 82,000 دولار. ووفقاً للمحللين، فإن إعادة نشر هذا الخبير المخضرم في وول ستريت لتوقعه يشير مباشرة إلى أن الاتجاه الصعودي متعدد السنوات للعملة لا يزال قائماً.
### توقع 2019 الأصلي
في المنشور الأصلي الصادر في يونيو 2019، عندما كان البيتكوين يتداول عند نحو 10,000 دولار فقط، توقع براندت هدفاً بقيمة 100,000 دولار. واستناداً إلى الرسوم البيانية الخاصة بشركة Factor LLC، أظهر المحلل الذي يمتلك خبرة 45 عاماً أنه لا يوجد أصل تقليدي — بما في ذلك أسهم آبل وأمازون ونتفليكس والذهب — يمكنه محاكاة الأداء الدوري للعملة الرقمية. وسجلت البيانات التاريخية مكاسب بلغت 20 و489 و42 و93 ضعفاً في الدورات السابقة للبيتكوين على التوالي.
### مدفوع بالمؤسسات لا بالمتداولين الأفراد: لماذا لا يزال نموذج 2019 الصاعد صالحاً في 2026؟
عاد هذا الرسم البياني إلى الواجهة في سبتمبر 2026 بسبب بنية حركة سعر البيتكوين؛ إذ يُظهر الرسم البياني اللوغاريتمي الأسبوعي أن السعر الحالي منضغط بالقرب من الحد الأدنى للقناة الصاعدة التاريخية، مكرراً بذلك مرحلة تجميع واسعة.
ويكمن الفارق الأوضح بين المرحلة الحالية وظروف السوق في 2019 في الدعم المؤسسي؛ فقبل سبع سنوات، كانت الموجة الصاعدة مدفوعة بشكل خالص بالمضاربة ومعنويات المستثمرين الأفراد. أما اليوم، فإن استقرار القناة السعرية مدعوم بصناديق كبرى وتدفقات رأسمالية منهجية عبر صناديق الاستثمار المتداولة الفورية (ETF). ونظراً لضخامة القيمة السوقية للبيتكوين، سيواجه صعوبة في تحقيق عوائده السابقة التي بلغت 100 ضعف — نتيجة تأثير تناقص العوائد — لكن المسار اللوغاريتمي نفسه لا يزال دون تغيير.
يبقى نموذج براندت مرجعاً رئيسياً للسوق، مؤكداً أن السيناريو الصاعد لا يزال صالحاً طالما ظلت خطوط الدعم الحرجة صامدة. وسيكون الطريق نحو مستويات قياسية جديدة غير خطي، لكن طالما صمد الحد الأدنى لخط الاتجاه، سيواصل البيتكوين لعب دوره الخاص — وهو دور لا مثيل له في تاريخ التمويل العالمي.
@Binance Square Official
#PeterBrandt
13

📉 بيتر براندت يتوقع نهاية السوق الهابط للبيتكوين ويشيد بفرصها المستقبلية!
يتوقع محلل التداول الشهير، بيتر براندت، أن الاستثمار في البيتكوين اليوم سيحقق عوائد أفضل بكثير خلال سنتين إلى ثلاث سنوات مقارنة بشراء أسهم الذكاء الاصطناعي بالأسعار الحالية. يشير براندت إلى أن السوق الهابط للبيتكوين لم ينتهِ بعد، متوقعًا الوصول إلى القاع الأخير في شهر أكتوبر.
━━━━━━━━━━━━━━
📊 التأثير: 📈 مرتفع
🏷️ BITCOIN
#Bitcoin #CryptoMarket #PeterBrandt #MarketPrediction #BearMarket
🔗 المصدر: https://cointelegraph.com/magazine/peter-brandt-says-bitcoins-bear-market-isnt-over-predicts-final-bottom-in-october
📉 بيتر براندت يتوقع نهاية السوق الهابط للبيتكوين ويشيد بفرصها المستقبلية!
يتوقع محلل التداول الشهير، بيتر براندت، أن الاستثمار في البيتكوين اليوم سيحقق عوائد أفضل بكثير خلال سنتين إلى ثلاث سنوات مقارنة بشراء أسهم الذكاء الاصطناعي بالأسعار الحالية. يشير براندت إلى أن السوق الهابط للبيتكوين لم ينتهِ بعد، متوقعًا الوصول إلى القاع الأخير في شهر أكتوبر.
━━━━━━━━━━━━━━
📊 التأثير: 📈 مرتفع
🏷️ BITCOIN
#Bitcoin #CryptoMarket #PeterBrandt #MarketPrediction #BearMarket
🔗 المصدر: https://cointelegraph.com/magazine/peter-brandt-says-bitcoins-bear-market-isnt-over-predicts-final-bottom-in-october
يتوقع محلل التداول الشهير، بيتر براندت، أن الاستثمار في البيتكوين اليوم سيحقق عوائد أفضل بكثير خلال سنتين إلى ثلاث سنوات مقارنة بشراء أسهم الذكاء الاصطناعي بالأسعار الحالية. يشير براندت إلى أن السوق الهابط للبيتكوين لم ينتهِ بعد، متوقعًا الوصول إلى القاع الأخير في شهر أكتوبر.
━━━━━━━━━━━━━━
📊 التأثير: 📈 مرتفع
🏷️ BITCOIN
#Bitcoin #CryptoMarket #PeterBrandt #MarketPrediction #BearMarket
🔗 المصدر: https://cointelegraph.com/magazine/peter-brandt-says-bitcoins-bear-market-isnt-over-predicts-final-bottom-in-october
10

·
--
Peter Brandt Changes His Bearish Outlook as Bitcoin Nears $80,000.Peter Brandt had previously identified the $58,000–$62,000 range as a potential pullback target for Bitcoin in January, although he also noted that this view could prove to be wrong. The latest price action, however, has significantly changed the picture.
Bitcoin surged last week following the market impact of a sharp rise in bond yields and a new initiative aimed at fiscal rebalancing. The asset approached $80,000 on Friday, gaining further momentum as short positions were forcibly closed.
Peter Brandt said he had viewed the probability of the prolonged right shoulder of an inverse head-and-shoulders pattern breaking to the downside at 60%, versus 40% for the alternative outcome. However, after the bottoming pattern was completed, he said he responded to the breakout by buying.
Bitcoin had reached $62,679 on August 17…
#PeterBrandt
$BTC
Peter Brandt Changes His Bearish Outlook as Bitcoin Nears $80,000.
Peter Brandt had previously identified the $58,000–$62,000 range as a potential pullback target for Bitcoin in January, although he also noted that this view could prove to be wrong. The latest price action, however, has significantly changed the picture.
Bitcoin surged last week following the market impact of a sharp rise in bond yields and a new initiative aimed at fiscal rebalancing. The asset approached $80,000 on Friday, gaining further momentum as short positions were forcibly closed.
Peter Brandt said he had viewed the probability of the prolonged right shoulder of an inverse head-and-shoulders pattern breaking to the downside at 60%, versus 40% for the alternative outcome. However, after the bottoming pattern was completed, he said he responded to the breakout by buying.
Bitcoin had reached $62,679 on August 17…
#PeterBrandt
$BTC
Bitcoin surged last week following the market impact of a sharp rise in bond yields and a new initiative aimed at fiscal rebalancing. The asset approached $80,000 on Friday, gaining further momentum as short positions were forcibly closed.
Peter Brandt said he had viewed the probability of the prolonged right shoulder of an inverse head-and-shoulders pattern breaking to the downside at 60%, versus 40% for the alternative outcome. However, after the bottoming pattern was completed, he said he responded to the breakout by buying.
Bitcoin had reached $62,679 on August 17…
#PeterBrandt
$BTC
83

·
--
Verified
Peter Brandt considers gold over Bitcoin
Veteran trader Peter Brandt is reconsidering his Bitcoin holdings, weighing a potential shift to gold as macro conditions evolve. The 75-year-old market veteran, known for technical analysis since the 1980s, signals a rare change of stance on the leading cryptocurrency.
Brandt's perspective reflects growing debate among crypto veterans about portfolio rebalancing amid uncertain Fed policy and persistent inflation. Gold, traditionally a safe haven, has rallied alongside Bitcoin as investors seek stores of value outside the traditional financial system. The veteran trader's potential pivot highlights the ongoing competition between digital and physical precious assets.
Institutional adoption of Bitcoin through ETFs has not diminished gold's appeal among seasoned traders who witnessed multiple market cycles. Brandt's caution comes as Bitcoin trades near $60K after failing to sustain momentum past $65K resistance. Technical indicators show mixed signals with RSI levels suggesting both overbought conditions and continued bullish structural patterns.
Will veteran traders shift back to gold as a primary hedge, or is this temporary positioning ahead of the next major move? What is your take on Brandt's commentary? 👇
#PeterBrandt #BitcoinGold #CryptoVeteran
Peter Brandt considers gold over Bitcoin
Veteran trader Peter Brandt is reconsidering his Bitcoin holdings, weighing a potential shift to gold as macro conditions evolve. The 75-year-old market veteran, known for technical analysis since the 1980s, signals a rare change of stance on the leading cryptocurrency.
Brandt's perspective reflects growing debate among crypto veterans about portfolio rebalancing amid uncertain Fed policy and persistent inflation. Gold, traditionally a safe haven, has rallied alongside Bitcoin as investors seek stores of value outside the traditional financial system. The veteran trader's potential pivot highlights the ongoing competition between digital and physical precious assets.
Institutional adoption of Bitcoin through ETFs has not diminished gold's appeal among seasoned traders who witnessed multiple market cycles. Brandt's caution comes as Bitcoin trades near $60K after failing to sustain momentum past $65K resistance. Technical indicators show mixed signals with RSI levels suggesting both overbought conditions and continued bullish structural patterns.
Will veteran traders shift back to gold as a primary hedge, or is this temporary positioning ahead of the next major move? What is your take on Brandt's commentary? 👇
#PeterBrandt #BitcoinGold #CryptoVeteran
Veteran trader Peter Brandt is reconsidering his Bitcoin holdings, weighing a potential shift to gold as macro conditions evolve. The 75-year-old market veteran, known for technical analysis since the 1980s, signals a rare change of stance on the leading cryptocurrency.
Brandt's perspective reflects growing debate among crypto veterans about portfolio rebalancing amid uncertain Fed policy and persistent inflation. Gold, traditionally a safe haven, has rallied alongside Bitcoin as investors seek stores of value outside the traditional financial system. The veteran trader's potential pivot highlights the ongoing competition between digital and physical precious assets.
Institutional adoption of Bitcoin through ETFs has not diminished gold's appeal among seasoned traders who witnessed multiple market cycles. Brandt's caution comes as Bitcoin trades near $60K after failing to sustain momentum past $65K resistance. Technical indicators show mixed signals with RSI levels suggesting both overbought conditions and continued bullish structural patterns.
Will veteran traders shift back to gold as a primary hedge, or is this temporary positioning ahead of the next major move? What is your take on Brandt's commentary? 👇
#PeterBrandt #BitcoinGold #CryptoVeteran
54

·
--
🎯 Peter Brandt说想卖BTC换金
📰 81岁传奇交易员开口:考虑出掉部分BTC换黄金。$4180金创历史新高时BTC还在$63K
💬 老炮看衰才是最值得听的信号。金新高BTC腰斩,短期叙事受挫,但长期看现在割肉换金未必对
🏷️ #PeterBrandt #BTC #黄金 #交易员 #宏观
🎯 Peter Brandt说想卖BTC换金
📰 81岁传奇交易员开口:考虑出掉部分BTC换黄金。$4180金创历史新高时BTC还在$63K
💬 老炮看衰才是最值得听的信号。金新高BTC腰斩,短期叙事受挫,但长期看现在割肉换金未必对
🏷️ #PeterBrandt #BTC #黄金 #交易员 #宏观
📰 81岁传奇交易员开口:考虑出掉部分BTC换黄金。$4180金创历史新高时BTC还在$63K
💬 老炮看衰才是最值得听的信号。金新高BTC腰斩,短期叙事受挫,但长期看现在割肉换金未必对
🏷️ #PeterBrandt #BTC #黄金 #交易员 #宏观
1
97

·
--
GM. While some are busy debating if $82K is the new $40K, Peter Brandt is just… chilling, still long Bitcoin.
The veteran trader bought the breakout and isn't flinching, even as BTC keeps bouncing off that $82,000 ceiling like a crypto-powered pogo stick. He’s basically saying "wen moon?" is less important than "wen hodl?" #Bitcoin #CryptoTrading #PeterBrandt
The real alpha here? Sometimes, the smartest move is to just stick to your conviction, even when the charts look like they're doing the macarena. Don't get rugged by resistance, my frens. #BTC #Blockchain
So, are you riding Brandt's wave, or are you out here trying to catch the next $82K retest with your moon boots on? Let me know below!
GM. While some are busy debating if $82K is the new $40K, Peter Brandt is just… chilling, still long Bitcoin.
The veteran trader bought the breakout and isn't flinching, even as BTC keeps bouncing off that $82,000 ceiling like a crypto-powered pogo stick. He’s basically saying "wen moon?" is less important than "wen hodl?" #Bitcoin #CryptoTrading #PeterBrandt
The real alpha here? Sometimes, the smartest move is to just stick to your conviction, even when the charts look like they're doing the macarena. Don't get rugged by resistance, my frens. #BTC #Blockchain
So, are you riding Brandt's wave, or are you out here trying to catch the next $82K retest with your moon boots on? Let me know below!
The veteran trader bought the breakout and isn't flinching, even as BTC keeps bouncing off that $82,000 ceiling like a crypto-powered pogo stick. He’s basically saying "wen moon?" is less important than "wen hodl?" #Bitcoin #CryptoTrading #PeterBrandt
The real alpha here? Sometimes, the smartest move is to just stick to your conviction, even when the charts look like they're doing the macarena. Don't get rugged by resistance, my frens. #BTC #Blockchain
So, are you riding Brandt's wave, or are you out here trying to catch the next $82K retest with your moon boots on? Let me know below!
19

·
--
Wow, AAVE今天封神了!一天17个点冲到173,创今年1月以来新高,全天成交5.4亿美金!
但合约端有个细节要盯住:持仓量7小时从6.2亿U干到8.38亿U,涨了17.5%,价格涨的每一分都是真金白银加出来的,不是现货空拉。20小时里42万枚加到48.3万枚。
不过大户在撤梯子:大户多空比从2.18一路滑到1.87,押多的账户从68.5%降到65%。价钱越拉,大户越减。散户在抬轿,大户在边上摆摊卖货。
费率只有0.01%,正的但不高,还没到过热。这波DeFi行情是CRV拉18%烧起来的,烧了两天烧到Aave。要是大户多空比跌破1.8还没回落,就得小心边拉边撤。
#Aave #DeFi
Wow, Brandt又喊新票了!这次是XLM,他原话说是未来几年的长线好票,看的是图表信号,不是 hype。
数据给他撑腰:XLM现在0.231,24小时涨11%,一个月涨28%。合约持仓量6小时从2.71亿枚加到2.83亿枚,价格涨持仓也涨,是真加仓。大户押多69%没松手,多空比2.25稳定。
基本面也有两单实锤:Mastercard旗下的BVNK把Stellar接进了稳定币支付平台,Spectra Finance在Stellar上发了Janus Henderson国债代币化产品。Brandt这种一辈子只看图的老猎手,喊一次不容易。
#XLM #PeterBrandt
$AAVE $CRV $XLM
{future}(XLMUSDT)
{future}(AAVEUSDT)
Wow, AAVE今天封神了!一天17个点冲到173,创今年1月以来新高,全天成交5.4亿美金!
但合约端有个细节要盯住:持仓量7小时从6.2亿U干到8.38亿U,涨了17.5%,价格涨的每一分都是真金白银加出来的,不是现货空拉。20小时里42万枚加到48.3万枚。
不过大户在撤梯子:大户多空比从2.18一路滑到1.87,押多的账户从68.5%降到65%。价钱越拉,大户越减。散户在抬轿,大户在边上摆摊卖货。
费率只有0.01%,正的但不高,还没到过热。这波DeFi行情是CRV拉18%烧起来的,烧了两天烧到Aave。要是大户多空比跌破1.8还没回落,就得小心边拉边撤。
#Aave #DeFi
Wow, Brandt又喊新票了!这次是XLM,他原话说是未来几年的长线好票,看的是图表信号,不是 hype。
数据给他撑腰:XLM现在0.231,24小时涨11%,一个月涨28%。合约持仓量6小时从2.71亿枚加到2.83亿枚,价格涨持仓也涨,是真加仓。大户押多69%没松手,多空比2.25稳定。
基本面也有两单实锤:Mastercard旗下的BVNK把Stellar接进了稳定币支付平台,Spectra Finance在Stellar上发了Janus Henderson国债代币化产品。Brandt这种一辈子只看图的老猎手,喊一次不容易。
#XLM #PeterBrandt
$AAVE $CRV $XLM
但合约端有个细节要盯住:持仓量7小时从6.2亿U干到8.38亿U,涨了17.5%,价格涨的每一分都是真金白银加出来的,不是现货空拉。20小时里42万枚加到48.3万枚。
不过大户在撤梯子:大户多空比从2.18一路滑到1.87,押多的账户从68.5%降到65%。价钱越拉,大户越减。散户在抬轿,大户在边上摆摊卖货。
费率只有0.01%,正的但不高,还没到过热。这波DeFi行情是CRV拉18%烧起来的,烧了两天烧到Aave。要是大户多空比跌破1.8还没回落,就得小心边拉边撤。
#Aave #DeFi
Wow, Brandt又喊新票了!这次是XLM,他原话说是未来几年的长线好票,看的是图表信号,不是 hype。
数据给他撑腰:XLM现在0.231,24小时涨11%,一个月涨28%。合约持仓量6小时从2.71亿枚加到2.83亿枚,价格涨持仓也涨,是真加仓。大户押多69%没松手,多空比2.25稳定。
基本面也有两单实锤:Mastercard旗下的BVNK把Stellar接进了稳定币支付平台,Spectra Finance在Stellar上发了Janus Henderson国债代币化产品。Brandt这种一辈子只看图的老猎手,喊一次不容易。
#XLM #PeterBrandt
$AAVE $CRV $XLM
1
606


Article
Peter Brandt Says XRP's Charts Justify Buying: What His Track Record Says About Trusting the CallA neckline near $1.55, a target near $5.40. Here's the pattern, and the one detail about Brandt's own XRP trading that's worth knowing first.
📐 A chartist with nearly five decades of experience just said XRP doesn't need a community, a narrative, or anyone's approval to justify buying it. The charts alone are enough, in his words.
Peter Brandt said XRP holders don't need what he called certified cult membership to justify owning the token. His point was that the technical setup itself, without any hype attached, makes a real case.
📊 Here's the pattern he's pointing to.
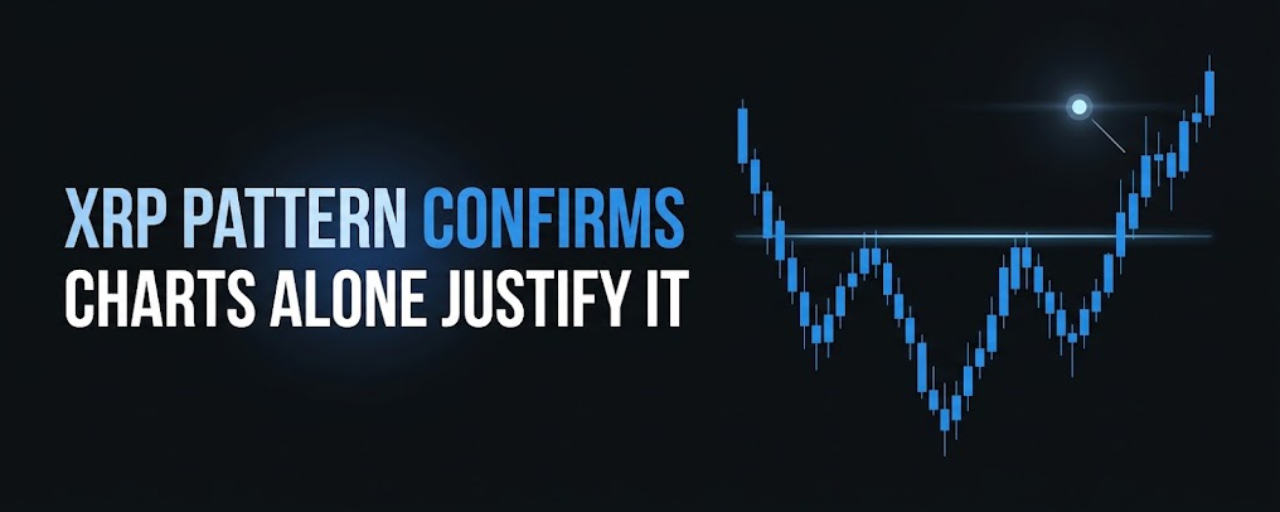
Analysts have identified an inverse head-and-shoulders formation on XRP's chart, with a neckline near 1.55. This pattern forms from three troughs, with the middle one lowest, and it's considered bullish once price breaks and holds above the neckline. Brandt's own long-term chart points toward roughly 5.40 as an eventual target, while XRP was trading around 1.52 at the time, essentially sitting right at that critical neckline.
🎯 A breakout above that level, according to the setup, could open the door toward 2 dollars as a nearer-term move.
⚖️ Here's the detail worth knowing before you weight this call too heavily.
Brandt has covered XRP's chart repeatedly over the years, sometimes bullish, sometimes flagging bearish head-and-shoulders patterns pointing sharply lower. Both calls have appeared at different points, which isn't a contradiction, it's just how technical analysis works, patterns evolve as new price data comes in.
There's a more interesting detail, though. Brandt has said in the past that he personally doesn't trade XRP, because he considers it a security issued by Ripple Labs, and he doesn't trade OTC securities as a matter of personal policy. He's commented that if he did trade such assets, XRP would genuinely interest him. That's a meaningful distinction, he's willing to analyze and discuss the chart publicly while choosing not to act on it himself.
🧠 Why does that distinction actually matter for you?
Because it separates the analysis from the endorsement. A chartist calling out a bullish pattern is offering a read on price structure, not necessarily a personal vote of confidence in the asset itself. Understanding that difference helps you weigh the call for what it actually is, technical observation, rather than treating it as a personal recommendation from someone putting their own money behind it.
✅ What this means for you
If you're holding XRP, this pattern and target are genuinely bullish technical context, alongside whale accumulation and steady ETF inflows that have been building. But remember this is one interpretation of a chart, and Brandt himself has flagged bearish patterns on the same asset before.
If you're on the sidelines, the neckline level matters more than the price target. Watching whether XRP holds and closes above roughly 1.55 on a weekly basis is the actual confirmation this pattern needs, not the eventual 5.40 figure.
If you're building real technical analysis skill, this is a good study case, inverse head-and-shoulders patterns are genuinely powerful when they complete cleanly, but they can also fail or get reinterpreted as new price action comes in. Watching how these plays out live is more useful than memorizing the target alone.
🟢 Bullish scenario
XRP holds firmly above the neckline, the pattern completes as described, and price works toward the 2-dollar level first, with 5.40 remaining the longer-term target if momentum continues.
🔴 Risk scenario
XRP fails to hold the neckline support, the pattern doesn't confirm, and price retraces, which would be consistent with some of Brandt's earlier bearish chart calls on the same asset.
👀 Three things to watch
1️⃣ Weekly close above the neckline
Does XRP confirm a clean weekly close above roughly 1.55, or does it stay below?
2️⃣ ETF and whale flow data
Do inflows and accumulation continue supporting the bullish technical setup?
3️⃣ Brandt's own follow-up
Does he continue to reference this pattern as price develops, or does he flag a shift if the setup breaks down?
💡 The key takeaway
A respected chartist is pointing at a real, textbook-style bullish pattern on XRP's weekly chart. That's worth understanding on its own terms.
But the same analyst has flagged bearish patterns on this exact asset before and notably chooses not to trade it himself. The chart is one input. What you do with it is still your call.
That is the part worth watching.
This post is for informational and educational purposes only and is not financial advice. Crypto markets are volatile. Always conduct your own research before making financial decisions.
#BinanceSquare #XRP #TechnicalAnalysis #Crypto #PeterBrandt
{spot}(XRPUSDT)
Peter Brandt Says XRP's Charts Justify Buying: What His Track Record Says About Trusting the Call
A neckline near $1.55, a target near $5.40. Here's the pattern, and the one detail about Brandt's own XRP trading that's worth knowing first.
📐 A chartist with nearly five decades of experience just said XRP doesn't need a community, a narrative, or anyone's approval to justify buying it. The charts alone are enough, in his words.
Peter Brandt said XRP holders don't need what he called certified cult membership to justify owning the token. His point was that the technical setup itself, without any hype attached, makes a real case.
📊 Here's the pattern he's pointing to.
Analysts have identified an inverse head-and-shoulders formation on XRP's chart, with a neckline near 1.55. This pattern forms from three troughs, with the middle one lowest, and it's considered bullish once price breaks and holds above the neckline. Brandt's own long-term chart points toward roughly 5.40 as an eventual target, while XRP was trading around 1.52 at the time, essentially sitting right at that critical neckline.
🎯 A breakout above that level, according to the setup, could open the door toward 2 dollars as a nearer-term move.
⚖️ Here's the detail worth knowing before you weight this call too heavily.
Brandt has covered XRP's chart repeatedly over the years, sometimes bullish, sometimes flagging bearish head-and-shoulders patterns pointing sharply lower. Both calls have appeared at different points, which isn't a contradiction, it's just how technical analysis works, patterns evolve as new price data comes in.
There's a more interesting detail, though. Brandt has said in the past that he personally doesn't trade XRP, because he considers it a security issued by Ripple Labs, and he doesn't trade OTC securities as a matter of personal policy. He's commented that if he did trade such assets, XRP would genuinely interest him. That's a meaningful distinction, he's willing to analyze and discuss the chart publicly while choosing not to act on it himself.
🧠 Why does that distinction actually matter for you?
Because it separates the analysis from the endorsement. A chartist calling out a bullish pattern is offering a read on price structure, not necessarily a personal vote of confidence in the asset itself. Understanding that difference helps you weigh the call for what it actually is, technical observation, rather than treating it as a personal recommendation from someone putting their own money behind it.
✅ What this means for you
If you're holding XRP, this pattern and target are genuinely bullish technical context, alongside whale accumulation and steady ETF inflows that have been building. But remember this is one interpretation of a chart, and Brandt himself has flagged bearish patterns on the same asset before.
If you're on the sidelines, the neckline level matters more than the price target. Watching whether XRP holds and closes above roughly 1.55 on a weekly basis is the actual confirmation this pattern needs, not the eventual 5.40 figure.
If you're building real technical analysis skill, this is a good study case, inverse head-and-shoulders patterns are genuinely powerful when they complete cleanly, but they can also fail or get reinterpreted as new price action comes in. Watching how these plays out live is more useful than memorizing the target alone.
🟢 Bullish scenario
XRP holds firmly above the neckline, the pattern completes as described, and price works toward the 2-dollar level first, with 5.40 remaining the longer-term target if momentum continues.
🔴 Risk scenario
XRP fails to hold the neckline support, the pattern doesn't confirm, and price retraces, which would be consistent with some of Brandt's earlier bearish chart calls on the same asset.
👀 Three things to watch
1️⃣ Weekly close above the neckline
Does XRP confirm a clean weekly close above roughly 1.55, or does it stay below?
2️⃣ ETF and whale flow data
Do inflows and accumulation continue supporting the bullish technical setup?
3️⃣ Brandt's own follow-up
Does he continue to reference this pattern as price develops, or does he flag a shift if the setup breaks down?
💡 The key takeaway
A respected chartist is pointing at a real, textbook-style bullish pattern on XRP's weekly chart. That's worth understanding on its own terms.
But the same analyst has flagged bearish patterns on this exact asset before and notably chooses not to trade it himself. The chart is one input. What you do with it is still your call.
That is the part worth watching.
This post is for informational and educational purposes only and is not financial advice. Crypto markets are volatile. Always conduct your own research before making financial decisions.
#BinanceSquare #XRP #TechnicalAnalysis #Crypto #PeterBrandt
📐 A chartist with nearly five decades of experience just said XRP doesn't need a community, a narrative, or anyone's approval to justify buying it. The charts alone are enough, in his words.
Peter Brandt said XRP holders don't need what he called certified cult membership to justify owning the token. His point was that the technical setup itself, without any hype attached, makes a real case.
📊 Here's the pattern he's pointing to.
Analysts have identified an inverse head-and-shoulders formation on XRP's chart, with a neckline near 1.55. This pattern forms from three troughs, with the middle one lowest, and it's considered bullish once price breaks and holds above the neckline. Brandt's own long-term chart points toward roughly 5.40 as an eventual target, while XRP was trading around 1.52 at the time, essentially sitting right at that critical neckline.
🎯 A breakout above that level, according to the setup, could open the door toward 2 dollars as a nearer-term move.
⚖️ Here's the detail worth knowing before you weight this call too heavily.
Brandt has covered XRP's chart repeatedly over the years, sometimes bullish, sometimes flagging bearish head-and-shoulders patterns pointing sharply lower. Both calls have appeared at different points, which isn't a contradiction, it's just how technical analysis works, patterns evolve as new price data comes in.
There's a more interesting detail, though. Brandt has said in the past that he personally doesn't trade XRP, because he considers it a security issued by Ripple Labs, and he doesn't trade OTC securities as a matter of personal policy. He's commented that if he did trade such assets, XRP would genuinely interest him. That's a meaningful distinction, he's willing to analyze and discuss the chart publicly while choosing not to act on it himself.
🧠 Why does that distinction actually matter for you?
Because it separates the analysis from the endorsement. A chartist calling out a bullish pattern is offering a read on price structure, not necessarily a personal vote of confidence in the asset itself. Understanding that difference helps you weigh the call for what it actually is, technical observation, rather than treating it as a personal recommendation from someone putting their own money behind it.
✅ What this means for you
If you're holding XRP, this pattern and target are genuinely bullish technical context, alongside whale accumulation and steady ETF inflows that have been building. But remember this is one interpretation of a chart, and Brandt himself has flagged bearish patterns on the same asset before.
If you're on the sidelines, the neckline level matters more than the price target. Watching whether XRP holds and closes above roughly 1.55 on a weekly basis is the actual confirmation this pattern needs, not the eventual 5.40 figure.
If you're building real technical analysis skill, this is a good study case, inverse head-and-shoulders patterns are genuinely powerful when they complete cleanly, but they can also fail or get reinterpreted as new price action comes in. Watching how these plays out live is more useful than memorizing the target alone.
🟢 Bullish scenario
XRP holds firmly above the neckline, the pattern completes as described, and price works toward the 2-dollar level first, with 5.40 remaining the longer-term target if momentum continues.
🔴 Risk scenario
XRP fails to hold the neckline support, the pattern doesn't confirm, and price retraces, which would be consistent with some of Brandt's earlier bearish chart calls on the same asset.
👀 Three things to watch
1️⃣ Weekly close above the neckline
Does XRP confirm a clean weekly close above roughly 1.55, or does it stay below?
2️⃣ ETF and whale flow data
Do inflows and accumulation continue supporting the bullish technical setup?
3️⃣ Brandt's own follow-up
Does he continue to reference this pattern as price develops, or does he flag a shift if the setup breaks down?
💡 The key takeaway
A respected chartist is pointing at a real, textbook-style bullish pattern on XRP's weekly chart. That's worth understanding on its own terms.
But the same analyst has flagged bearish patterns on this exact asset before and notably chooses not to trade it himself. The chart is one input. What you do with it is still your call.
That is the part worth watching.
This post is for informational and educational purposes only and is not financial advice. Crypto markets are volatile. Always conduct your own research before making financial decisions.
#BinanceSquare #XRP #TechnicalAnalysis #Crypto #PeterBrandt
1
1
106

🔥 PETER BRANDT JUST DROPPED A $5.40 XRP TARGET!
🔥 $5.40 = 3.5X FROM HERE? 👀
Veteran trader Peter Brandt says his long-term XRP chart points toward $5.40. 👀
From the current levels, that would be a massive move.
No timeframe. No guarantee.
Just one chart that has $XRP holders watching closely. 🚀
Could $5.40 be the next major XRP milestone?
#XRP #Ripple #Crypto #PeterBrandt #BinanceSquare
{future}(XRPUSDT)
🔥 PETER BRANDT JUST DROPPED A $5.40 XRP TARGET!
🔥 $5.40 = 3.5X FROM HERE? 👀
Veteran trader Peter Brandt says his long-term XRP chart points toward $5.40. 👀
From the current levels, that would be a massive move.
No timeframe. No guarantee.
Just one chart that has $XRP holders watching closely. 🚀
Could $5.40 be the next major XRP milestone?
#XRP #Ripple #Crypto #PeterBrandt #BinanceSquare
🔥 $5.40 = 3.5X FROM HERE? 👀
Veteran trader Peter Brandt says his long-term XRP chart points toward $5.40. 👀
From the current levels, that would be a massive move.
No timeframe. No guarantee.
Just one chart that has $XRP holders watching closely. 🚀
Could $5.40 be the next major XRP milestone?
#XRP #Ripple #Crypto #PeterBrandt #BinanceSquare

1
1.6k

El trader veterano de mil batallas, Peter Brandt, compartió recientemente un análisis técnico a largo plazo en el que proyecta que el token XRP podría alcanzar eventualmente los US$5,40. Brandt enfatizó que compartir un gráfico no equivale a una recomendación de compra ni a una orden de operación.
Señaló que se trata de una lectura de patrones de probabilidad a largo plazo basada en análisis técnico clásico, desvinculándose de especulaciones a corto plazo.
Este pronóstico coincidió con un repunte en el precio de XRP, respaldado además por datos on-chain que reflejan una alta actividad e importante acumulación por parte de grandes inversores (ballenas) en los días previos.
#xrp #trade #PeterBrandt #Ripple #Xrp🔥🔥 $XRP
El trader veterano de mil batallas, Peter Brandt, compartió recientemente un análisis técnico a largo plazo en el que proyecta que el token XRP podría alcanzar eventualmente los US$5,40. Brandt enfatizó que compartir un gráfico no equivale a una recomendación de compra ni a una orden de operación.
Señaló que se trata de una lectura de patrones de probabilidad a largo plazo basada en análisis técnico clásico, desvinculándose de especulaciones a corto plazo.
Este pronóstico coincidió con un repunte en el precio de XRP, respaldado además por datos on-chain que reflejan una alta actividad e importante acumulación por parte de grandes inversores (ballenas) en los días previos.
#xrp #trade #PeterBrandt #Ripple #Xrp🔥🔥 $XRP
Señaló que se trata de una lectura de patrones de probabilidad a largo plazo basada en análisis técnico clásico, desvinculándose de especulaciones a corto plazo.
Este pronóstico coincidió con un repunte en el precio de XRP, respaldado además por datos on-chain que reflejan una alta actividad e importante acumulación por parte de grandes inversores (ballenas) en los días previos.
#xrp #trade #PeterBrandt #Ripple #Xrp🔥🔥 $XRP

107

·
--
🟠 Veteran Trader Peter Brandt Eyes Bitcoin Exit for Gold Amid XAU/BTC Ratio Breakout
Peter Brandt, a seasoned chartist, is contemplating selling some Bitcoin to load up on gold, pointing to a bullish technical setup on the XAU/BTC ratio. His monthly chart analysis suggests gold is poised for substantial gains against Bitcoin, breaking out of a multi-year downtrend channel. This call challenges the prevailing narrative, especially as Bitcoin trades significantly below its previous highs while gold shows resilience. The debate is heating up, with some analysts pushing back hard against Brandt's thesis. They argue that Bitcoin's growth potential could easily invalidate any short-term relative weakness against gold. Others point to factors like AI-driven liquidity shifts and strong hands accumulating Bitcoin on dips as reasons to stay put. The XAU/BTC ratio's next move will be crucial in determining whether gold's shine outlasts Bitcoin's digital allure.
📊 A sustained breakout in the XAU/BTC ratio could trigger minor outflows from Bitcoin and altcoins into gold, potentially dampening crypto market sentiment in the short term. However, strong on-chain accumulation in BTC could limit downside.
Is Brandt right? Will gold outperform BTC in the coming months? 👇
#bitcoin #gold #xaubtc #peterbrandt #technicalanalysis
🟠 Veteran Trader Peter Brandt Eyes Bitcoin Exit for Gold Amid XAU/BTC Ratio Breakout
Peter Brandt, a seasoned chartist, is contemplating selling some Bitcoin to load up on gold, pointing to a bullish technical setup on the XAU/BTC ratio. His monthly chart analysis suggests gold is poised for substantial gains against Bitcoin, breaking out of a multi-year downtrend channel. This call challenges the prevailing narrative, especially as Bitcoin trades significantly below its previous highs while gold shows resilience. The debate is heating up, with some analysts pushing back hard against Brandt's thesis. They argue that Bitcoin's growth potential could easily invalidate any short-term relative weakness against gold. Others point to factors like AI-driven liquidity shifts and strong hands accumulating Bitcoin on dips as reasons to stay put. The XAU/BTC ratio's next move will be crucial in determining whether gold's shine outlasts Bitcoin's digital allure.
📊 A sustained breakout in the XAU/BTC ratio could trigger minor outflows from Bitcoin and altcoins into gold, potentially dampening crypto market sentiment in the short term. However, strong on-chain accumulation in BTC could limit downside.
Is Brandt right? Will gold outperform BTC in the coming months? 👇
#bitcoin #gold #xaubtc #peterbrandt #technicalanalysis
Peter Brandt, a seasoned chartist, is contemplating selling some Bitcoin to load up on gold, pointing to a bullish technical setup on the XAU/BTC ratio. His monthly chart analysis suggests gold is poised for substantial gains against Bitcoin, breaking out of a multi-year downtrend channel. This call challenges the prevailing narrative, especially as Bitcoin trades significantly below its previous highs while gold shows resilience. The debate is heating up, with some analysts pushing back hard against Brandt's thesis. They argue that Bitcoin's growth potential could easily invalidate any short-term relative weakness against gold. Others point to factors like AI-driven liquidity shifts and strong hands accumulating Bitcoin on dips as reasons to stay put. The XAU/BTC ratio's next move will be crucial in determining whether gold's shine outlasts Bitcoin's digital allure.
📊 A sustained breakout in the XAU/BTC ratio could trigger minor outflows from Bitcoin and altcoins into gold, potentially dampening crypto market sentiment in the short term. However, strong on-chain accumulation in BTC could limit downside.
Is Brandt right? Will gold outperform BTC in the coming months? 👇
#bitcoin #gold #xaubtc #peterbrandt #technicalanalysis
120

·
--
Peter Brandt把比特币熊市底部精确到了2026年10月4日,并提到价格在低于50,000美元时可能触底回升。
但我觉得真正值得聊的,不是这个日期本身。
把底部说到具体某一天,传播性很强,也容易给人很确定的错觉。可对交易来说,它更像一个可传播的价格锚,而不是立刻能执行的信号。
真正有用的信息,其实是他把低于50,000美元设成了潜在底部区间。这会影响一部分中长期资金的挂单心理,但不会单独改变现货供需。
没有链上资金、ETF流量或宏观触发因素配合,单个资深交易员的远期预测,更像一次舆论试探:先把市场预期往更深回撤方向压;等价格真接近那个区间时,这句话才会被重新定价。
所以别被2026年10月4日这种精确感骗了。真正该盯的,是BTC跌破关键区间时,被动抛售有没有开始耗尽。
你更信周期日历,还是更信资金流和抛压是否出清?
#BTC #PeterBrandt #熊市 #底部 #市场分析
Peter Brandt把比特币熊市底部精确到了2026年10月4日,并提到价格在低于50,000美元时可能触底回升。
但我觉得真正值得聊的,不是这个日期本身。
把底部说到具体某一天,传播性很强,也容易给人很确定的错觉。可对交易来说,它更像一个可传播的价格锚,而不是立刻能执行的信号。
真正有用的信息,其实是他把低于50,000美元设成了潜在底部区间。这会影响一部分中长期资金的挂单心理,但不会单独改变现货供需。
没有链上资金、ETF流量或宏观触发因素配合,单个资深交易员的远期预测,更像一次舆论试探:先把市场预期往更深回撤方向压;等价格真接近那个区间时,这句话才会被重新定价。
所以别被2026年10月4日这种精确感骗了。真正该盯的,是BTC跌破关键区间时,被动抛售有没有开始耗尽。
你更信周期日历,还是更信资金流和抛压是否出清?
#BTC #PeterBrandt #熊市 #底部 #市场分析
但我觉得真正值得聊的,不是这个日期本身。
把底部说到具体某一天,传播性很强,也容易给人很确定的错觉。可对交易来说,它更像一个可传播的价格锚,而不是立刻能执行的信号。
真正有用的信息,其实是他把低于50,000美元设成了潜在底部区间。这会影响一部分中长期资金的挂单心理,但不会单独改变现货供需。
没有链上资金、ETF流量或宏观触发因素配合,单个资深交易员的远期预测,更像一次舆论试探:先把市场预期往更深回撤方向压;等价格真接近那个区间时,这句话才会被重新定价。
所以别被2026年10月4日这种精确感骗了。真正该盯的,是BTC跌破关键区间时,被动抛售有没有开始耗尽。
你更信周期日历,还是更信资金流和抛压是否出清?
#BTC #PeterBrandt #熊市 #底部 #市场分析
93

·
--
🟠 Ветеран-трейдер Питер Брандт нацелился на выход из Биткоина в Золото на фоне прорыва соотношения XAU/BTC
Питер Брандт, опытный технический аналитик, рассматривает возможность продажи части Биткоина для накопления золота, указывая на бычью техническую конфигурацию в соотношении XAU/BTC. Его анализ месячного графика предполагает, что золото готово к существенному росту по отношению к Биткоину, вырвавшись из многолетнего нисходящего трендового канала. Этот призыв бросает вызов преобладающей нарративной линии, особенно учитывая, что Биткоин торгуется значительно ниже своих предыдущих максимумов, в то время как золото демонстрирует устойчивость. Дебаты накаляются, и некоторые аналитики решительно отвергают тезис Брандта. Они утверждают, что потенциал роста Биткоина может легко аннулировать любую краткосрочную относительную слабость по сравнению с золотом. Другие указывают на такие факторы, как сдвиги ликвидности, вызванные ИИ, и накопление Биткоина сильными руками на спадах как на причины оставаться на месте. Следующее движение соотношения XAU/BTC будет иметь решающее значение для определения того, перевесит ли блеск золота цифровую привлекательность Биткоина.
📊 Устойчивый прорыв соотношения XAU/BTC может спровоцировать незначительный отток средств из Биткоина и альткоинов в золото, потенциально ослабляя настроения на крипторынке в краткосрочной перспективе. Однако сильное накопление BTC на цепочке может ограничить снижение.
Прав ли Брандт? Опередит ли золото BTC в ближайшие месяцы? 👇
#bitcoin #gold #xaubtc #peterbrandt #technicalanalysis
🟠 Ветеран-трейдер Питер Брандт нацелился на выход из Биткоина в Золото на фоне прорыва соотношения XAU/BTC
Питер Брандт, опытный технический аналитик, рассматривает возможность продажи части Биткоина для накопления золота, указывая на бычью техническую конфигурацию в соотношении XAU/BTC. Его анализ месячного графика предполагает, что золото готово к существенному росту по отношению к Биткоину, вырвавшись из многолетнего нисходящего трендового канала. Этот призыв бросает вызов преобладающей нарративной линии, особенно учитывая, что Биткоин торгуется значительно ниже своих предыдущих максимумов, в то время как золото демонстрирует устойчивость. Дебаты накаляются, и некоторые аналитики решительно отвергают тезис Брандта. Они утверждают, что потенциал роста Биткоина может легко аннулировать любую краткосрочную относительную слабость по сравнению с золотом. Другие указывают на такие факторы, как сдвиги ликвидности, вызванные ИИ, и накопление Биткоина сильными руками на спадах как на причины оставаться на месте. Следующее движение соотношения XAU/BTC будет иметь решающее значение для определения того, перевесит ли блеск золота цифровую привлекательность Биткоина.
📊 Устойчивый прорыв соотношения XAU/BTC может спровоцировать незначительный отток средств из Биткоина и альткоинов в золото, потенциально ослабляя настроения на крипторынке в краткосрочной перспективе. Однако сильное накопление BTC на цепочке может ограничить снижение.
Прав ли Брандт? Опередит ли золото BTC в ближайшие месяцы? 👇
#bitcoin #gold #xaubtc #peterbrandt #technicalanalysis
Питер Брандт, опытный технический аналитик, рассматривает возможность продажи части Биткоина для накопления золота, указывая на бычью техническую конфигурацию в соотношении XAU/BTC. Его анализ месячного графика предполагает, что золото готово к существенному росту по отношению к Биткоину, вырвавшись из многолетнего нисходящего трендового канала. Этот призыв бросает вызов преобладающей нарративной линии, особенно учитывая, что Биткоин торгуется значительно ниже своих предыдущих максимумов, в то время как золото демонстрирует устойчивость. Дебаты накаляются, и некоторые аналитики решительно отвергают тезис Брандта. Они утверждают, что потенциал роста Биткоина может легко аннулировать любую краткосрочную относительную слабость по сравнению с золотом. Другие указывают на такие факторы, как сдвиги ликвидности, вызванные ИИ, и накопление Биткоина сильными руками на спадах как на причины оставаться на месте. Следующее движение соотношения XAU/BTC будет иметь решающее значение для определения того, перевесит ли блеск золота цифровую привлекательность Биткоина.
📊 Устойчивый прорыв соотношения XAU/BTC может спровоцировать незначительный отток средств из Биткоина и альткоинов в золото, потенциально ослабляя настроения на крипторынке в краткосрочной перспективе. Однако сильное накопление BTC на цепочке может ограничить снижение.
Прав ли Брандт? Опередит ли золото BTC в ближайшие месяцы? 👇
#bitcoin #gold #xaubtc #peterbrandt #technicalanalysis
147

·
--
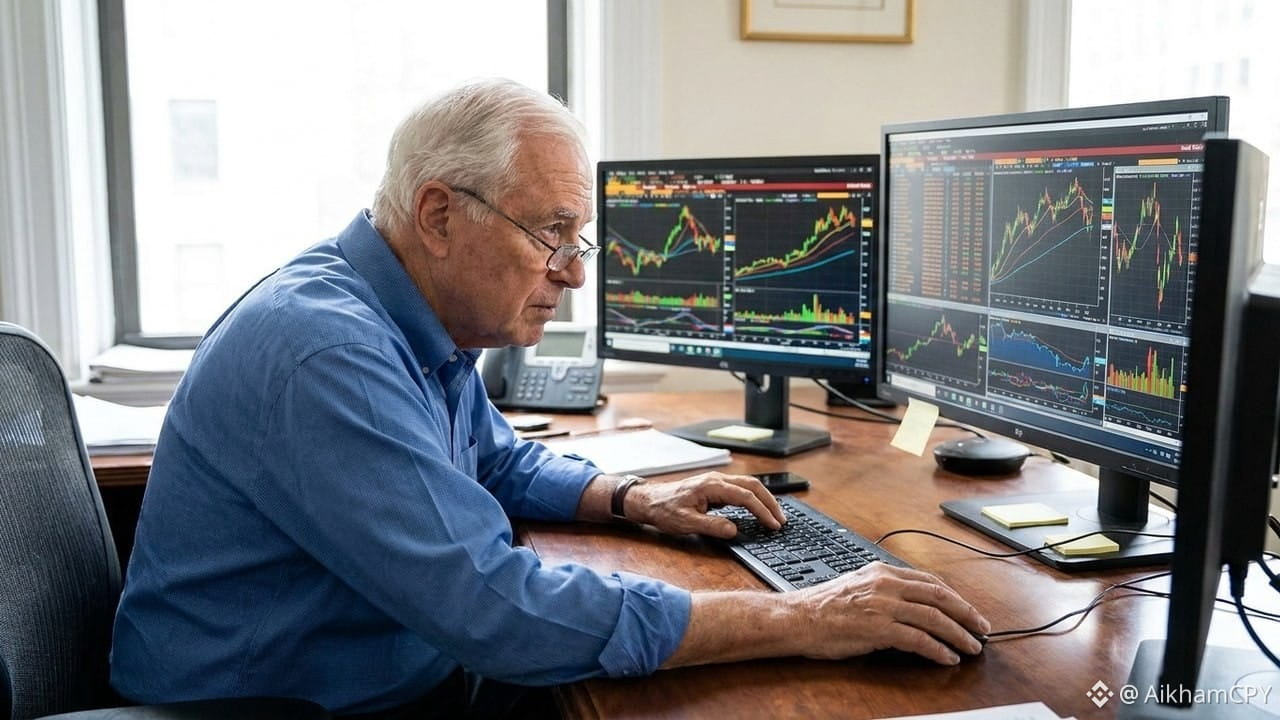
🎙️ Peter Brandt Predicts: BTC Hits $250,000 by 2029 🚀
The legendary chart analyst forecasts a massive rally, targeting $250,000 for Bitcoin by the year 2029.
⚠️ But First... A Bottom in September 2026!
He expects the market to bottom out around September 2026 before starting the strong upward trend.
Keep an eye on the timeline! Accumulation phase might be coming soon 👀💰
$BTC $BCH
#Bitcoin #PeterBrandt #Crypto
🎙️ Peter Brandt Predicts: BTC Hits $250,000 by 2029 🚀
The legendary chart analyst forecasts a massive rally, targeting $250,000 for Bitcoin by the year 2029.
⚠️ But First... A Bottom in September 2026!
He expects the market to bottom out around September 2026 before starting the strong upward trend.
Keep an eye on the timeline! Accumulation phase might be coming soon 👀💰
$BTC $BCH
#Bitcoin #PeterBrandt #Crypto
The legendary chart analyst forecasts a massive rally, targeting $250,000 for Bitcoin by the year 2029.
⚠️ But First... A Bottom in September 2026!
He expects the market to bottom out around September 2026 before starting the strong upward trend.
Keep an eye on the timeline! Accumulation phase might be coming soon 👀💰
$BTC $BCH
#Bitcoin #PeterBrandt #Crypto
1
60

·
--
$BTC FAKEOUT WARNING FROM PETER BRANDT – KEY LEVEL INSIDE ⚠️
Peter Brandt just flagged a potential diamond pattern on the Nasdaq 100 E-mini, a classic top reversal signal. He's also warned Bitcoin could see a fakeout near current levels before a deeper correction, with a bottom expected by late 2026.
The daily chart structure on NQ is tightening – same setup that preceded major reversals in the past. At $60k, BTC is sitting at a level that could either hold or break hard depending on macro sentiment.
Are you watching for the sweep or already shorting into the pattern?
Not financial advice. Always manage your risk.
#BTC #Bitcoin #Fakeout #PeterBrandt #CryptoAnalysis
⚡
$BTC FAKEOUT WARNING FROM PETER BRANDT – KEY LEVEL INSIDE ⚠️
Peter Brandt just flagged a potential diamond pattern on the Nasdaq 100 E-mini, a classic top reversal signal. He's also warned Bitcoin could see a fakeout near current levels before a deeper correction, with a bottom expected by late 2026.
The daily chart structure on NQ is tightening – same setup that preceded major reversals in the past. At $60k, BTC is sitting at a level that could either hold or break hard depending on macro sentiment.
Are you watching for the sweep or already shorting into the pattern?
Not financial advice. Always manage your risk.
#BTC #Bitcoin #Fakeout #PeterBrandt #CryptoAnalysis
⚡
Peter Brandt just flagged a potential diamond pattern on the Nasdaq 100 E-mini, a classic top reversal signal. He's also warned Bitcoin could see a fakeout near current levels before a deeper correction, with a bottom expected by late 2026.
The daily chart structure on NQ is tightening – same setup that preceded major reversals in the past. At $60k, BTC is sitting at a level that could either hold or break hard depending on macro sentiment.
Are you watching for the sweep or already shorting into the pattern?
Not financial advice. Always manage your risk.
#BTC #Bitcoin #Fakeout #PeterBrandt #CryptoAnalysis
⚡
37

Peter Brandt $250K Warning! 📊
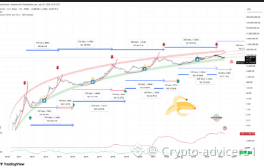
📊 PETER BRANDT: BTC $250K — LEKIN 2029 TAK WAIT KARO!
Veteran trader Peter Brandt ne predict kiya: Bitcoin $250,000 tak jaayega — lekin 2029 mein! Unka kehna hai market ka bottoming process September 2026 tak chal sakta hai! MEXC
🤯 Matlab:
2026: Consolidation / slow grind
2027-2028: Bull run build up
2029: $250,000 target!
Sabr rakho — Bitcoin ka safar marathon hai sprint nahi! 🏃
Aap kaunse year mein BTC $100K+ dekhte ho? 👇
#Bitcoin $BTC #PeterBrandt #250k #PricePrediction #BinanceSquare
Peter Brandt $250K Warning! 📊
📊 PETER BRANDT: BTC $250K — LEKIN 2029 TAK WAIT KARO!
Veteran trader Peter Brandt ne predict kiya: Bitcoin $250,000 tak jaayega — lekin 2029 mein! Unka kehna hai market ka bottoming process September 2026 tak chal sakta hai! MEXC
🤯 Matlab:
2026: Consolidation / slow grind
2027-2028: Bull run build up
2029: $250,000 target!
Sabr rakho — Bitcoin ka safar marathon hai sprint nahi! 🏃
Aap kaunse year mein BTC $100K+ dekhte ho? 👇
#Bitcoin $BTC #PeterBrandt #250k #PricePrediction #BinanceSquare
📊 PETER BRANDT: BTC $250K — LEKIN 2029 TAK WAIT KARO!
Veteran trader Peter Brandt ne predict kiya: Bitcoin $250,000 tak jaayega — lekin 2029 mein! Unka kehna hai market ka bottoming process September 2026 tak chal sakta hai! MEXC
🤯 Matlab:
2026: Consolidation / slow grind
2027-2028: Bull run build up
2029: $250,000 target!
Sabr rakho — Bitcoin ka safar marathon hai sprint nahi! 🏃
Aap kaunse year mein BTC $100K+ dekhte ho? 👇
#Bitcoin $BTC #PeterBrandt #250k #PricePrediction #BinanceSquare
32
Log in to explore more content
Join global crypto users on Binance Square
⚡️ Get latest and useful information about crypto.
💬 Trusted by the world’s largest crypto exchange.
👍 Discover real insights from verified creators.
Email / Phone number
Trending Topics
1
#BitcoinClears$85200
7,994 views
187 Discussing
2
#AltcoinSeasonIndexHoldsAbove60For5Days
42,108 views
1,016 Discussing
3
#USADPAdds90000JobsInSeptember
19,185 views
575 Discussing
4
#USCorePCEEasesTo3%InAugust
14,795 views
462 Discussing
5
#KospiPostsWorstQuarterSince2020
10,631 views
453 Discussing
6
#SECToClarifyOnChainFundraisingRules
25,562 views
622 Discussing
7
#UKFCAOpensCryptoFirmAuthorization
25,720 views
526 Discussing
8
#JapanMOFStudyGroupOnTokenizedGovtBonds
18,826 views
410 Discussing
9
#QNTRises287%
83,665 views
883 Discussing
10
#TrumpRejectsAIRulesForVoluntaryAudits
49,913 views
771 Discussing