

#marketdepth
marketdepth
19,025 views
108 Discussing
Hot
Latest

Understanding Market Depth: How Order Books Shape Crypto Liquidity and Price ActionWhen transitioning from a beginner to an intermediate crypto trader, one of the most significant mindset shifts involves moving away from basic candlestick charts and looking directly at the engine driving market movements: the order book and its corresponding market depth.
While historical price charts tell you where an asset has been, market depth offers a real-time window into where supply and demand currently sit. Understanding how market depth works, how to read order books, and how market participants interact with liquidity is essential for reducing trading costs, managing risk, and avoiding common execution traps.
---
### What Is Market Depth?
At its core, market depth refers to the market’s ability to absorb relatively large market orders without causing significant price fluctuations. It represents the total volume of open buy and sell limit orders at various price levels surrounding the current spot price.
Market depth is visualized through two primary interface elements on centralized crypto exchanges:
1. **The Order Book:** A real-time, continuously updated list of pending buy orders (bids) and sell orders (asks).
2. **The Depth Chart:** A graphical representation of cumulative bids and asks stacked on either side of the current market price.
To understand market depth, one must first understand the fundamental divide in order execution: limit orders versus market orders. Limit orders provide liquidity to the market by sitting in the order book, waiting to be filled at a specific price or better. Market orders consume liquidity by executing instantly against the best available limit orders in the order book.
---
### Deconstructing the Order Book: Bids, Asks, and the Spread
An order book is split into two main sections:
* **Bids (Buy Side):** Located below the current market price, listed in descending order. The highest bid represents the highest price anyone is currently willing to pay for the asset.
* **Asks or Offers (Sell Side):** Located above the current market price, listed in ascending order. The lowest ask represents the cheapest price at which anyone is currently willing to sell the asset.
The gap between the highest bid and the lowest ask is known as the **bid-ask spread**.
In highly liquid markets—such as major trading pairs for Bitcoin or Ethereum on high-volume exchanges—the bid-ask spread is typically negligible, often a fraction of a cent or a single basis point. In contrast, illiquid markets or low-cap altcoin markets frequently feature wide bid-ask spreads. A wide spread means immediate entry and exit carry an implicit cost, as buying at the market price and instantly selling at the market price results in an immediate loss equal to the spread distance.
---
### Reading the Depth Chart
The depth chart visualizes the order book by plotting price along the horizontal axis (X-axis) and cumulative volume along the vertical axis (Y-axis).
* **The Buy Wall (Green Side):** Represents the cumulative sum of buy limit orders from the current price downward.
* **The Sell Wall (Red Side):** Represents the cumulative sum of sell limit orders from the current price upward.
When a visual "steep wall" appears on a depth chart, it indicates that a massive concentration of limit orders exists at a specific price point. For instance, if a large participant places a limit order to buy 1,000 units of an asset at $100, a steep green wall forms at $100.
To lower the market price below $100, market sellers must first sell enough volume to completely consume that 1,000-unit buy order. Consequently, significant buy walls often act as temporary psychological or structural support levels, while large sell walls act as resistance levels.
---
### Practical Example: Slippage and Order Sweeping
Understanding market depth is practical when executing trades above standard retail sizes. Suppose an trader wishes to buy $100,000 worth of a mid-cap digital asset using a market order.
Imagine the order book currently looks like this:
* **Best Ask:** $10.00 (Available Volume: $20,000)
* **Second Ask:** $10.10 (Available Volume: $30,000)
* **Third Ask:** $10.30 (Available Volume: $50,000)
If the trader submits a market buy order for $100,000, the exchange matching engine sweeps through the order book sequentially:
1. Fills $20,000 at $10.00
2. Fills $30,000 at $10.10
3. Fills $50,000 at $10.30
The trader’s expected purchase price was $10.00, but their **average execution price** ends up being approximately $10.18. The difference between the expected price and the actual execution price is known as **slippage**.
Slippage occurs precisely because the market depth at the top of the book was insufficient to fill the entire order at a single price point. Intermediate traders analyze market depth prior to execution to decide whether to split large orders into smaller tranches, use limit orders, or utilize automated algorithms like TWAP (Time-Weighted Average Price) to minimize market impact.
---
### Hidden Realities and Market Depth Manipulations
While market depth provides valuable insight, taking the order book at face value can be dangerous. Institutional participants, quantitative funds, and market makers use sophisticated strategies that alter how true liquidity is displayed.
#### 1. Phantom Liquidity and Spoofing
Not all visible orders are intended to be executed. "Spoofing" is a deceptive practice where a market actor places large limit orders (e.g., a massive buy wall) to create the false impression of strong support, enticing retail traders to buy. Once price approaches the fake wall, the actor cancels the order in milliseconds. Because limit orders can be canceled at any time prior to execution, displayed depth is never a guaranteed contract.
#### 2. Iceberg Orders
Large traders often wish to hide their true size to avoid moving the market against themselves. They utilize "iceberg orders," which divide a large order into small displayed segments. A trader might place an order to sell 50,000 units of BNB, but set the order book to display only 500 units at a time. As soon as one 500-unit tranche is filled, the next automatically appears. As a result, the visible order book may look thin, while hidden depth remains substantial.
#### 3. Off-Book Liquidity (OTC and Dark Pools)
A significant portion of global crypto volume takes place outside public order books through Over-the-Counter (OTC) desks or off-exchange liquidity venues. Highly capitalized entities routinely execute large block trades off-book precisely to avoid disrupting visible market depth on public exchanges.
---
### Incorporating Market Depth into Your Strategy
To effectively utilize market depth without falling victim to market noise:
* **Combine Depth with Volume Delta:** Do not rely on order book walls alone. Watch trade feeds (the time and sales tape) to verify whether orders at key depth levels are actually being executed or continuously canceled.
* **Assess Liquidity Across Venues:** Market depth varies significantly between exchanges. An asset may have deep liquidity on a tier-one venue while remaining extremely thin on smaller platforms.
* **Use Limit Orders for Position Entry:** To minimize execution drag from bid-ask spreads and slippage, default to patient limit orders when fast execution is not strictly required.
* **Practice Strict Risk Management:** Market conditions shift rapidly during periods of extreme volatility. During market-wide deleveraging events, liquidity providers often pull their limit orders entirely to mitigate their own risk, causing market depth to evaporate quickly and spreads to blow out wide.
---
### Conclusion
Market depth offers a dynamic view of supply and demand that raw price charts simply cannot capture. By learning to read order books, calculate potential slippage, and recognize the limitations of static order depth, intermediate traders gain a critical advantage in trade execution and risk assessment. However, because order books are volatile and subject to rapid cancellation, market depth analysis should always be integrated with disciplined position sizing, strict stop-loss rules, and a broader understanding of market context.
#CryptoTrading #MarketDepth #OrderBook
Understanding Market Depth: How Order Books Shape Crypto Liquidity and Price Action
When transitioning from a beginner to an intermediate crypto trader, one of the most significant mindset shifts involves moving away from basic candlestick charts and looking directly at the engine driving market movements: the order book and its corresponding market depth.
While historical price charts tell you where an asset has been, market depth offers a real-time window into where supply and demand currently sit. Understanding how market depth works, how to read order books, and how market participants interact with liquidity is essential for reducing trading costs, managing risk, and avoiding common execution traps.
---
### What Is Market Depth?
At its core, market depth refers to the market’s ability to absorb relatively large market orders without causing significant price fluctuations. It represents the total volume of open buy and sell limit orders at various price levels surrounding the current spot price.
Market depth is visualized through two primary interface elements on centralized crypto exchanges:
1. **The Order Book:** A real-time, continuously updated list of pending buy orders (bids) and sell orders (asks).
2. **The Depth Chart:** A graphical representation of cumulative bids and asks stacked on either side of the current market price.
To understand market depth, one must first understand the fundamental divide in order execution: limit orders versus market orders. Limit orders provide liquidity to the market by sitting in the order book, waiting to be filled at a specific price or better. Market orders consume liquidity by executing instantly against the best available limit orders in the order book.
---
### Deconstructing the Order Book: Bids, Asks, and the Spread
An order book is split into two main sections:
* **Bids (Buy Side):** Located below the current market price, listed in descending order. The highest bid represents the highest price anyone is currently willing to pay for the asset.
* **Asks or Offers (Sell Side):** Located above the current market price, listed in ascending order. The lowest ask represents the cheapest price at which anyone is currently willing to sell the asset.
The gap between the highest bid and the lowest ask is known as the **bid-ask spread**.
In highly liquid markets—such as major trading pairs for Bitcoin or Ethereum on high-volume exchanges—the bid-ask spread is typically negligible, often a fraction of a cent or a single basis point. In contrast, illiquid markets or low-cap altcoin markets frequently feature wide bid-ask spreads. A wide spread means immediate entry and exit carry an implicit cost, as buying at the market price and instantly selling at the market price results in an immediate loss equal to the spread distance.
---
### Reading the Depth Chart
The depth chart visualizes the order book by plotting price along the horizontal axis (X-axis) and cumulative volume along the vertical axis (Y-axis).
* **The Buy Wall (Green Side):** Represents the cumulative sum of buy limit orders from the current price downward.
* **The Sell Wall (Red Side):** Represents the cumulative sum of sell limit orders from the current price upward.
When a visual "steep wall" appears on a depth chart, it indicates that a massive concentration of limit orders exists at a specific price point. For instance, if a large participant places a limit order to buy 1,000 units of an asset at $100, a steep green wall forms at $100.
To lower the market price below $100, market sellers must first sell enough volume to completely consume that 1,000-unit buy order. Consequently, significant buy walls often act as temporary psychological or structural support levels, while large sell walls act as resistance levels.
---
### Practical Example: Slippage and Order Sweeping
Understanding market depth is practical when executing trades above standard retail sizes. Suppose an trader wishes to buy $100,000 worth of a mid-cap digital asset using a market order.
Imagine the order book currently looks like this:
* **Best Ask:** $10.00 (Available Volume: $20,000)
* **Second Ask:** $10.10 (Available Volume: $30,000)
* **Third Ask:** $10.30 (Available Volume: $50,000)
If the trader submits a market buy order for $100,000, the exchange matching engine sweeps through the order book sequentially:
1. Fills $20,000 at $10.00
2. Fills $30,000 at $10.10
3. Fills $50,000 at $10.30
The trader’s expected purchase price was $10.00, but their **average execution price** ends up being approximately $10.18. The difference between the expected price and the actual execution price is known as **slippage**.
Slippage occurs precisely because the market depth at the top of the book was insufficient to fill the entire order at a single price point. Intermediate traders analyze market depth prior to execution to decide whether to split large orders into smaller tranches, use limit orders, or utilize automated algorithms like TWAP (Time-Weighted Average Price) to minimize market impact.
---
### Hidden Realities and Market Depth Manipulations
While market depth provides valuable insight, taking the order book at face value can be dangerous. Institutional participants, quantitative funds, and market makers use sophisticated strategies that alter how true liquidity is displayed.
#### 1. Phantom Liquidity and Spoofing
Not all visible orders are intended to be executed. "Spoofing" is a deceptive practice where a market actor places large limit orders (e.g., a massive buy wall) to create the false impression of strong support, enticing retail traders to buy. Once price approaches the fake wall, the actor cancels the order in milliseconds. Because limit orders can be canceled at any time prior to execution, displayed depth is never a guaranteed contract.
#### 2. Iceberg Orders
Large traders often wish to hide their true size to avoid moving the market against themselves. They utilize "iceberg orders," which divide a large order into small displayed segments. A trader might place an order to sell 50,000 units of BNB, but set the order book to display only 500 units at a time. As soon as one 500-unit tranche is filled, the next automatically appears. As a result, the visible order book may look thin, while hidden depth remains substantial.
#### 3. Off-Book Liquidity (OTC and Dark Pools)
A significant portion of global crypto volume takes place outside public order books through Over-the-Counter (OTC) desks or off-exchange liquidity venues. Highly capitalized entities routinely execute large block trades off-book precisely to avoid disrupting visible market depth on public exchanges.
---
### Incorporating Market Depth into Your Strategy
To effectively utilize market depth without falling victim to market noise:
* **Combine Depth with Volume Delta:** Do not rely on order book walls alone. Watch trade feeds (the time and sales tape) to verify whether orders at key depth levels are actually being executed or continuously canceled.
* **Assess Liquidity Across Venues:** Market depth varies significantly between exchanges. An asset may have deep liquidity on a tier-one venue while remaining extremely thin on smaller platforms.
* **Use Limit Orders for Position Entry:** To minimize execution drag from bid-ask spreads and slippage, default to patient limit orders when fast execution is not strictly required.
* **Practice Strict Risk Management:** Market conditions shift rapidly during periods of extreme volatility. During market-wide deleveraging events, liquidity providers often pull their limit orders entirely to mitigate their own risk, causing market depth to evaporate quickly and spreads to blow out wide.
---
### Conclusion
Market depth offers a dynamic view of supply and demand that raw price charts simply cannot capture. By learning to read order books, calculate potential slippage, and recognize the limitations of static order depth, intermediate traders gain a critical advantage in trade execution and risk assessment. However, because order books are volatile and subject to rapid cancellation, market depth analysis should always be integrated with disciplined position sizing, strict stop-loss rules, and a broader understanding of market context.
#CryptoTrading #MarketDepth #OrderBook
While historical price charts tell you where an asset has been, market depth offers a real-time window into where supply and demand currently sit. Understanding how market depth works, how to read order books, and how market participants interact with liquidity is essential for reducing trading costs, managing risk, and avoiding common execution traps.
---
### What Is Market Depth?
At its core, market depth refers to the market’s ability to absorb relatively large market orders without causing significant price fluctuations. It represents the total volume of open buy and sell limit orders at various price levels surrounding the current spot price.
Market depth is visualized through two primary interface elements on centralized crypto exchanges:
1. **The Order Book:** A real-time, continuously updated list of pending buy orders (bids) and sell orders (asks).
2. **The Depth Chart:** A graphical representation of cumulative bids and asks stacked on either side of the current market price.
To understand market depth, one must first understand the fundamental divide in order execution: limit orders versus market orders. Limit orders provide liquidity to the market by sitting in the order book, waiting to be filled at a specific price or better. Market orders consume liquidity by executing instantly against the best available limit orders in the order book.
---
### Deconstructing the Order Book: Bids, Asks, and the Spread
An order book is split into two main sections:
* **Bids (Buy Side):** Located below the current market price, listed in descending order. The highest bid represents the highest price anyone is currently willing to pay for the asset.
* **Asks or Offers (Sell Side):** Located above the current market price, listed in ascending order. The lowest ask represents the cheapest price at which anyone is currently willing to sell the asset.
The gap between the highest bid and the lowest ask is known as the **bid-ask spread**.
In highly liquid markets—such as major trading pairs for Bitcoin or Ethereum on high-volume exchanges—the bid-ask spread is typically negligible, often a fraction of a cent or a single basis point. In contrast, illiquid markets or low-cap altcoin markets frequently feature wide bid-ask spreads. A wide spread means immediate entry and exit carry an implicit cost, as buying at the market price and instantly selling at the market price results in an immediate loss equal to the spread distance.
---
### Reading the Depth Chart
The depth chart visualizes the order book by plotting price along the horizontal axis (X-axis) and cumulative volume along the vertical axis (Y-axis).
* **The Buy Wall (Green Side):** Represents the cumulative sum of buy limit orders from the current price downward.
* **The Sell Wall (Red Side):** Represents the cumulative sum of sell limit orders from the current price upward.
When a visual "steep wall" appears on a depth chart, it indicates that a massive concentration of limit orders exists at a specific price point. For instance, if a large participant places a limit order to buy 1,000 units of an asset at $100, a steep green wall forms at $100.
To lower the market price below $100, market sellers must first sell enough volume to completely consume that 1,000-unit buy order. Consequently, significant buy walls often act as temporary psychological or structural support levels, while large sell walls act as resistance levels.
---
### Practical Example: Slippage and Order Sweeping
Understanding market depth is practical when executing trades above standard retail sizes. Suppose an trader wishes to buy $100,000 worth of a mid-cap digital asset using a market order.
Imagine the order book currently looks like this:
* **Best Ask:** $10.00 (Available Volume: $20,000)
* **Second Ask:** $10.10 (Available Volume: $30,000)
* **Third Ask:** $10.30 (Available Volume: $50,000)
If the trader submits a market buy order for $100,000, the exchange matching engine sweeps through the order book sequentially:
1. Fills $20,000 at $10.00
2. Fills $30,000 at $10.10
3. Fills $50,000 at $10.30
The trader’s expected purchase price was $10.00, but their **average execution price** ends up being approximately $10.18. The difference between the expected price and the actual execution price is known as **slippage**.
Slippage occurs precisely because the market depth at the top of the book was insufficient to fill the entire order at a single price point. Intermediate traders analyze market depth prior to execution to decide whether to split large orders into smaller tranches, use limit orders, or utilize automated algorithms like TWAP (Time-Weighted Average Price) to minimize market impact.
---
### Hidden Realities and Market Depth Manipulations
While market depth provides valuable insight, taking the order book at face value can be dangerous. Institutional participants, quantitative funds, and market makers use sophisticated strategies that alter how true liquidity is displayed.
#### 1. Phantom Liquidity and Spoofing
Not all visible orders are intended to be executed. "Spoofing" is a deceptive practice where a market actor places large limit orders (e.g., a massive buy wall) to create the false impression of strong support, enticing retail traders to buy. Once price approaches the fake wall, the actor cancels the order in milliseconds. Because limit orders can be canceled at any time prior to execution, displayed depth is never a guaranteed contract.
#### 2. Iceberg Orders
Large traders often wish to hide their true size to avoid moving the market against themselves. They utilize "iceberg orders," which divide a large order into small displayed segments. A trader might place an order to sell 50,000 units of BNB, but set the order book to display only 500 units at a time. As soon as one 500-unit tranche is filled, the next automatically appears. As a result, the visible order book may look thin, while hidden depth remains substantial.
#### 3. Off-Book Liquidity (OTC and Dark Pools)
A significant portion of global crypto volume takes place outside public order books through Over-the-Counter (OTC) desks or off-exchange liquidity venues. Highly capitalized entities routinely execute large block trades off-book precisely to avoid disrupting visible market depth on public exchanges.
---
### Incorporating Market Depth into Your Strategy
To effectively utilize market depth without falling victim to market noise:
* **Combine Depth with Volume Delta:** Do not rely on order book walls alone. Watch trade feeds (the time and sales tape) to verify whether orders at key depth levels are actually being executed or continuously canceled.
* **Assess Liquidity Across Venues:** Market depth varies significantly between exchanges. An asset may have deep liquidity on a tier-one venue while remaining extremely thin on smaller platforms.
* **Use Limit Orders for Position Entry:** To minimize execution drag from bid-ask spreads and slippage, default to patient limit orders when fast execution is not strictly required.
* **Practice Strict Risk Management:** Market conditions shift rapidly during periods of extreme volatility. During market-wide deleveraging events, liquidity providers often pull their limit orders entirely to mitigate their own risk, causing market depth to evaporate quickly and spreads to blow out wide.
---
### Conclusion
Market depth offers a dynamic view of supply and demand that raw price charts simply cannot capture. By learning to read order books, calculate potential slippage, and recognize the limitations of static order depth, intermediate traders gain a critical advantage in trade execution and risk assessment. However, because order books are volatile and subject to rapid cancellation, market depth analysis should always be integrated with disciplined position sizing, strict stop-loss rules, and a broader understanding of market context.
#CryptoTrading #MarketDepth #OrderBook
1
72

A deep order book can be useful, but it isn’t a promise.
An order book displays resting limit orders: bids below the current price and asks above it. Market depth summarizes the displayed quantity available across price levels.
For intermediate traders, a few distinctions matter:
• Displayed depth is a snapshot. Orders can be added, changed, or canceled; a visible “wall” alone doesn’t prove anyone’s intent or that a level will hold.
• Depth is venue-specific. One exchange’s book doesn’t show all liquidity across the market.
• Liquidity has a price. A large order interacting with limited available quantity can move through several levels, causing market impact and slippage.
• A depth chart aggregates orders. It can make liquidity look substantial while hiding how unevenly it is distributed across price levels.
• The book isn’t the whole market. It shows displayed orders, not every possible source of liquidity or what will actually execute.
So, an order book is a view of currently displayed liquidity, not a forecast. Context, venue, and timing matter, and a single screenshot can’t establish what happens next.
This is general educational information, not a trade signal or instruction to buy or sell. Digital assets are volatile, and losses are possible.
What would you like covered next: spread, order-book imbalance, or slippage?
#OrderBook #MarketDepth #MarketMicrostructure #CryptoEducation
A deep order book can be useful, but it isn’t a promise.
An order book displays resting limit orders: bids below the current price and asks above it. Market depth summarizes the displayed quantity available across price levels.
For intermediate traders, a few distinctions matter:
• Displayed depth is a snapshot. Orders can be added, changed, or canceled; a visible “wall” alone doesn’t prove anyone’s intent or that a level will hold.
• Depth is venue-specific. One exchange’s book doesn’t show all liquidity across the market.
• Liquidity has a price. A large order interacting with limited available quantity can move through several levels, causing market impact and slippage.
• A depth chart aggregates orders. It can make liquidity look substantial while hiding how unevenly it is distributed across price levels.
• The book isn’t the whole market. It shows displayed orders, not every possible source of liquidity or what will actually execute.
So, an order book is a view of currently displayed liquidity, not a forecast. Context, venue, and timing matter, and a single screenshot can’t establish what happens next.
This is general educational information, not a trade signal or instruction to buy or sell. Digital assets are volatile, and losses are possible.
What would you like covered next: spread, order-book imbalance, or slippage?
#OrderBook #MarketDepth #MarketMicrostructure #CryptoEducation
An order book displays resting limit orders: bids below the current price and asks above it. Market depth summarizes the displayed quantity available across price levels.
For intermediate traders, a few distinctions matter:
• Displayed depth is a snapshot. Orders can be added, changed, or canceled; a visible “wall” alone doesn’t prove anyone’s intent or that a level will hold.
• Depth is venue-specific. One exchange’s book doesn’t show all liquidity across the market.
• Liquidity has a price. A large order interacting with limited available quantity can move through several levels, causing market impact and slippage.
• A depth chart aggregates orders. It can make liquidity look substantial while hiding how unevenly it is distributed across price levels.
• The book isn’t the whole market. It shows displayed orders, not every possible source of liquidity or what will actually execute.
So, an order book is a view of currently displayed liquidity, not a forecast. Context, venue, and timing matter, and a single screenshot can’t establish what happens next.
This is general educational information, not a trade signal or instruction to buy or sell. Digital assets are volatile, and losses are possible.
What would you like covered next: spread, order-book imbalance, or slippage?
#OrderBook #MarketDepth #MarketMicrostructure #CryptoEducation
77
Understanding Market Depth: The Hidden Mechanics Behind Crypto Price ActionWhen observing cryptocurrency markets, most market participants focus almost exclusively on price charts. They watch candlestick patterns, plot trendlines, and analyze technical indicators derived from historical price movements. However, price alone is a trailing metric. The last traded price of a digital asset simply represents the outcome of the most recent agreement between a buyer and a seller. It does not show the underlying structure supporting that price or the potential friction an asset will face if aggressive buying or selling occurs.
To understand why prices move abruptly, stagnate, or experience sudden liquidations, traders must look beyond candlestick charts and examine market depth. Market depth offers a real-time view of supply and demand sitting on exchange order books. For intermediate traders, mastering market depth provides a clearer understanding of market liquidity, order execution mechanics, and potential structural risks.
---
### What Is Market Depth?
Market depth refers to an exchange’s ability to sustain large market orders without causing significant price movements. It measures the total volume of open, unfilled buy orders (bids) and sell orders (asks) at various price levels surrounding the current market price.
An exchange’s order book is divided into two primary sides:
1. **The Bid Side (Buyers):** A list of limit orders placed by participants who wish to buy an asset at a specific price below the current market price. Bids are ranked from the highest price to the lowest.
2. **The Ask/Offer Side (Sellers):** A list of limit orders placed by participants who wish to sell an asset at a specific price above the current market price. Asks are ranked from the lowest price to the highest.
The difference between the highest bid price and the lowest ask price is known as the **bid-ask spread**. In highly liquid markets, this spread is extremely narrow—often fraction of a percent. In illiquid markets, the spread can widen significantly, increasing execution costs for traders.
---
### Key Concepts: Slippage and Order Types
To appreciate market depth, one must first understand how different order types interact with the order book.
#### Market Orders vs. Limit Orders
- **Limit Orders:** These add liquidity to the order book. When you place a limit buy order below the market price, your order sits in the order book until a seller accepts your price. Limit order submitters are called **liquidity providers** (or makers).
- **Market Orders:** These remove liquidity from the order book. When you execute a market buy order, the exchange immediately fills your request against the lowest available limit sell orders on the ask side. Market order submitters are called **liquidity takers**.
#### The Mechanics of Slippage
If a trader executes a market order larger than the total volume available at the best bid or ask price, the exchange fills the order by sweeping through subsequent price levels in the order book until the full position size is satisfied.
This phenomenon is known as **slippage**.
**Practical Example:**
Imagine the current best ask price for Ethereum is $3,000, with 5 Ethereum available at that price level. The next price level is $3,005 with 10 Ethereum available, and the level above that is $3,010 with 20 Ethereum available.
If a trader submits a market buy order for 12 Ethereum:
- The first 5 Ethereum are bought at $3,000.
- The remaining 7 Ethereum are bought at $3,005.
The average fill price for this trade is roughly $3,002.91, rather than the initial quoted price of $3,000. The $2.91 difference per coin represents slippage caused by absorbing available market depth.
---
### Analyzing Depth Metrics: 1% and 2% Order Book Depth
Exchanges and data providers often quantify market depth using standard metrics known as **1% depth** or **2% depth**.
- **1% Bid Depth:** The cumulative fiat value of all buy limit orders located within 1% below the current mid-price.
- **2% Ask Depth:** The cumulative fiat value of all sell limit orders located within 2% above the current mid-price.
These metrics offer a standardized way to compare liquidity across different digital assets and exchanges. An asset with $50 million in 2% depth can handle far larger trades with minimal price impact compared to an asset with only $100,000 in 2% depth.
#### Order Book Imbalance
By comparing total bid depth against total ask depth, traders can assess short-term order book imbalance:
- **Heavy Bid Depth:** Indicates significant buying interest below current prices, which may act as structural support.
- **Heavy Ask Depth:** Indicates a wall of selling interest above current prices, which may act as structural overhead resistance.
However, interpreting these imbalances requires caution due to order book dynamics discussed below.
---
### Practical Market Scenarios Driven by Market Depth
#### Scenario 1: The Cascading Flash Crash
A flash crash occurs when an aggressive wave of market sell orders rapidly depletes available bid depth. If the lower price levels in the order book are thin—meaning there are few limit buy orders—the price drops rapidly across multiple levels in seconds.
This drop often triggers automated stop-loss market orders and derivative liquidation orders, which act as additional market sell orders. In a thin market depth environment, this feedback loop leads to severe price wicks before opportunistic limit buyers step in to re-establish market stability.
#### Scenario 2: High Volatility During Macro Events
Prior to major economic announcements or high-impact news, institutional liquidity providers often remove their limit orders from order books to reduce exposure to sharp price swings.
As limit orders are withdrawn, market depth dries up. Consequently, even modest market orders can cause elevated price swings during these periods. Recognizing reduced market depth helps traders understand why markets become unusually volatile around scheduled events.
---
### Risks, Limitations, and Spoofing in Market Depth Analysis
While analyzing order books is valuable, relying strictly on visual depth charts carries distinct risks and limitations.
#### 1. Phantom Liquidity and Order Cancellation
Limit orders are non-binding. A participant can place a massive limit order to buy or sell and cancel it a fraction of a second before it gets filled. Depth that appears robust can disappear instantly when price approaches.
#### 2. Spoofing
Spoofing is a manipulative tactic where large traders place non-bona fide limit orders (large buy or sell "walls") with the intent to cancel them before execution. The objective is to create a false impression of heavy supply or demand, tricking other traders into buying or selling ahead of the wall.
#### 3. Iceberg Orders
Institutional participants rarely submit massive limit orders in full view of the public order book, as doing so alerts the market to their intentions. Instead, they use **iceberg orders**—automated algorithms that break large orders into tiny, sequential limit orders. A price level may appear to have only 1 unit of liquidity visible, but as soon as that unit is filled, another appears automatically until the full hidden order is satisfied.
#### 4. Off-Book Liquidity (OTC Trading)
A substantial portion of high-volume digital asset trading occurs off-exchange via Over-The-Counter (OTC) desks or through decentralized liquidity pools. Therefore, exchange order book depth represents only a fraction of total global market liquidity.
---
### Integrating Market Depth into Risk Management
For intermediate market participants, applying order book insights involves refining execution strategies rather than trying to predict exact price directions.
- **Size Positions Relative to Liquidity:** Avoid using position sizes that exceed the available depth within a reasonable percentage of current price. Ensure market capacity can handle your entry and exit without excessive execution penalty.
- **Utilize Limit Orders to Prevent Slippage:** Using limit orders allows you to control execution price, protecting you from unexpected market sweeps during lower depth periods.
- **Monitor Depth Variations Across Sessions:** Market depth fluctuates throughout the day based on global trading hours. Liquidity is typically higher when major international financial hubs overlap and lower during regional holidays or weekends.
- **Combine Depth with Volume Metrics:** Cross-reference order book depth with executed volume (time-and-sales data) to verify whether orders at key depth levels are actually being executed or simply canceled when tested.
---
### Final Thoughts
Market depth is the core infrastructure underlying price movement in digital asset markets. While candlestick patterns reflect historical transactions, order books reflect live liquidity conditions and potential trade friction.
By understanding how market orders interact with bid-ask queues, recognizing the risks of phantom liquidity, and evaluating order book depth before executing trades, intermediate participants can improve execution quality and better manage structural market risks.
#CryptoEducation #MarketDepth #TradingTips
Understanding Market Depth: The Hidden Mechanics Behind Crypto Price Action
When observing cryptocurrency markets, most market participants focus almost exclusively on price charts. They watch candlestick patterns, plot trendlines, and analyze technical indicators derived from historical price movements. However, price alone is a trailing metric. The last traded price of a digital asset simply represents the outcome of the most recent agreement between a buyer and a seller. It does not show the underlying structure supporting that price or the potential friction an asset will face if aggressive buying or selling occurs.
To understand why prices move abruptly, stagnate, or experience sudden liquidations, traders must look beyond candlestick charts and examine market depth. Market depth offers a real-time view of supply and demand sitting on exchange order books. For intermediate traders, mastering market depth provides a clearer understanding of market liquidity, order execution mechanics, and potential structural risks.
---
### What Is Market Depth?
Market depth refers to an exchange’s ability to sustain large market orders without causing significant price movements. It measures the total volume of open, unfilled buy orders (bids) and sell orders (asks) at various price levels surrounding the current market price.
An exchange’s order book is divided into two primary sides:
1. **The Bid Side (Buyers):** A list of limit orders placed by participants who wish to buy an asset at a specific price below the current market price. Bids are ranked from the highest price to the lowest.
2. **The Ask/Offer Side (Sellers):** A list of limit orders placed by participants who wish to sell an asset at a specific price above the current market price. Asks are ranked from the lowest price to the highest.
The difference between the highest bid price and the lowest ask price is known as the **bid-ask spread**. In highly liquid markets, this spread is extremely narrow—often fraction of a percent. In illiquid markets, the spread can widen significantly, increasing execution costs for traders.
---
### Key Concepts: Slippage and Order Types
To appreciate market depth, one must first understand how different order types interact with the order book.
#### Market Orders vs. Limit Orders
- **Limit Orders:** These add liquidity to the order book. When you place a limit buy order below the market price, your order sits in the order book until a seller accepts your price. Limit order submitters are called **liquidity providers** (or makers).
- **Market Orders:** These remove liquidity from the order book. When you execute a market buy order, the exchange immediately fills your request against the lowest available limit sell orders on the ask side. Market order submitters are called **liquidity takers**.
#### The Mechanics of Slippage
If a trader executes a market order larger than the total volume available at the best bid or ask price, the exchange fills the order by sweeping through subsequent price levels in the order book until the full position size is satisfied.
This phenomenon is known as **slippage**.
**Practical Example:**
Imagine the current best ask price for Ethereum is $3,000, with 5 Ethereum available at that price level. The next price level is $3,005 with 10 Ethereum available, and the level above that is $3,010 with 20 Ethereum available.
If a trader submits a market buy order for 12 Ethereum:
- The first 5 Ethereum are bought at $3,000.
- The remaining 7 Ethereum are bought at $3,005.
The average fill price for this trade is roughly $3,002.91, rather than the initial quoted price of $3,000. The $2.91 difference per coin represents slippage caused by absorbing available market depth.
---
### Analyzing Depth Metrics: 1% and 2% Order Book Depth
Exchanges and data providers often quantify market depth using standard metrics known as **1% depth** or **2% depth**.
- **1% Bid Depth:** The cumulative fiat value of all buy limit orders located within 1% below the current mid-price.
- **2% Ask Depth:** The cumulative fiat value of all sell limit orders located within 2% above the current mid-price.
These metrics offer a standardized way to compare liquidity across different digital assets and exchanges. An asset with $50 million in 2% depth can handle far larger trades with minimal price impact compared to an asset with only $100,000 in 2% depth.
#### Order Book Imbalance
By comparing total bid depth against total ask depth, traders can assess short-term order book imbalance:
- **Heavy Bid Depth:** Indicates significant buying interest below current prices, which may act as structural support.
- **Heavy Ask Depth:** Indicates a wall of selling interest above current prices, which may act as structural overhead resistance.
However, interpreting these imbalances requires caution due to order book dynamics discussed below.
---
### Practical Market Scenarios Driven by Market Depth
#### Scenario 1: The Cascading Flash Crash
A flash crash occurs when an aggressive wave of market sell orders rapidly depletes available bid depth. If the lower price levels in the order book are thin—meaning there are few limit buy orders—the price drops rapidly across multiple levels in seconds.
This drop often triggers automated stop-loss market orders and derivative liquidation orders, which act as additional market sell orders. In a thin market depth environment, this feedback loop leads to severe price wicks before opportunistic limit buyers step in to re-establish market stability.
#### Scenario 2: High Volatility During Macro Events
Prior to major economic announcements or high-impact news, institutional liquidity providers often remove their limit orders from order books to reduce exposure to sharp price swings.
As limit orders are withdrawn, market depth dries up. Consequently, even modest market orders can cause elevated price swings during these periods. Recognizing reduced market depth helps traders understand why markets become unusually volatile around scheduled events.
---
### Risks, Limitations, and Spoofing in Market Depth Analysis
While analyzing order books is valuable, relying strictly on visual depth charts carries distinct risks and limitations.
#### 1. Phantom Liquidity and Order Cancellation
Limit orders are non-binding. A participant can place a massive limit order to buy or sell and cancel it a fraction of a second before it gets filled. Depth that appears robust can disappear instantly when price approaches.
#### 2. Spoofing
Spoofing is a manipulative tactic where large traders place non-bona fide limit orders (large buy or sell "walls") with the intent to cancel them before execution. The objective is to create a false impression of heavy supply or demand, tricking other traders into buying or selling ahead of the wall.
#### 3. Iceberg Orders
Institutional participants rarely submit massive limit orders in full view of the public order book, as doing so alerts the market to their intentions. Instead, they use **iceberg orders**—automated algorithms that break large orders into tiny, sequential limit orders. A price level may appear to have only 1 unit of liquidity visible, but as soon as that unit is filled, another appears automatically until the full hidden order is satisfied.
#### 4. Off-Book Liquidity (OTC Trading)
A substantial portion of high-volume digital asset trading occurs off-exchange via Over-The-Counter (OTC) desks or through decentralized liquidity pools. Therefore, exchange order book depth represents only a fraction of total global market liquidity.
---
### Integrating Market Depth into Risk Management
For intermediate market participants, applying order book insights involves refining execution strategies rather than trying to predict exact price directions.
- **Size Positions Relative to Liquidity:** Avoid using position sizes that exceed the available depth within a reasonable percentage of current price. Ensure market capacity can handle your entry and exit without excessive execution penalty.
- **Utilize Limit Orders to Prevent Slippage:** Using limit orders allows you to control execution price, protecting you from unexpected market sweeps during lower depth periods.
- **Monitor Depth Variations Across Sessions:** Market depth fluctuates throughout the day based on global trading hours. Liquidity is typically higher when major international financial hubs overlap and lower during regional holidays or weekends.
- **Combine Depth with Volume Metrics:** Cross-reference order book depth with executed volume (time-and-sales data) to verify whether orders at key depth levels are actually being executed or simply canceled when tested.
---
### Final Thoughts
Market depth is the core infrastructure underlying price movement in digital asset markets. While candlestick patterns reflect historical transactions, order books reflect live liquidity conditions and potential trade friction.
By understanding how market orders interact with bid-ask queues, recognizing the risks of phantom liquidity, and evaluating order book depth before executing trades, intermediate participants can improve execution quality and better manage structural market risks.
#CryptoEducation #MarketDepth #TradingTips
To understand why prices move abruptly, stagnate, or experience sudden liquidations, traders must look beyond candlestick charts and examine market depth. Market depth offers a real-time view of supply and demand sitting on exchange order books. For intermediate traders, mastering market depth provides a clearer understanding of market liquidity, order execution mechanics, and potential structural risks.
---
### What Is Market Depth?
Market depth refers to an exchange’s ability to sustain large market orders without causing significant price movements. It measures the total volume of open, unfilled buy orders (bids) and sell orders (asks) at various price levels surrounding the current market price.
An exchange’s order book is divided into two primary sides:
1. **The Bid Side (Buyers):** A list of limit orders placed by participants who wish to buy an asset at a specific price below the current market price. Bids are ranked from the highest price to the lowest.
2. **The Ask/Offer Side (Sellers):** A list of limit orders placed by participants who wish to sell an asset at a specific price above the current market price. Asks are ranked from the lowest price to the highest.
The difference between the highest bid price and the lowest ask price is known as the **bid-ask spread**. In highly liquid markets, this spread is extremely narrow—often fraction of a percent. In illiquid markets, the spread can widen significantly, increasing execution costs for traders.
---
### Key Concepts: Slippage and Order Types
To appreciate market depth, one must first understand how different order types interact with the order book.
#### Market Orders vs. Limit Orders
- **Limit Orders:** These add liquidity to the order book. When you place a limit buy order below the market price, your order sits in the order book until a seller accepts your price. Limit order submitters are called **liquidity providers** (or makers).
- **Market Orders:** These remove liquidity from the order book. When you execute a market buy order, the exchange immediately fills your request against the lowest available limit sell orders on the ask side. Market order submitters are called **liquidity takers**.
#### The Mechanics of Slippage
If a trader executes a market order larger than the total volume available at the best bid or ask price, the exchange fills the order by sweeping through subsequent price levels in the order book until the full position size is satisfied.
This phenomenon is known as **slippage**.
**Practical Example:**
Imagine the current best ask price for Ethereum is $3,000, with 5 Ethereum available at that price level. The next price level is $3,005 with 10 Ethereum available, and the level above that is $3,010 with 20 Ethereum available.
If a trader submits a market buy order for 12 Ethereum:
- The first 5 Ethereum are bought at $3,000.
- The remaining 7 Ethereum are bought at $3,005.
The average fill price for this trade is roughly $3,002.91, rather than the initial quoted price of $3,000. The $2.91 difference per coin represents slippage caused by absorbing available market depth.
---
### Analyzing Depth Metrics: 1% and 2% Order Book Depth
Exchanges and data providers often quantify market depth using standard metrics known as **1% depth** or **2% depth**.
- **1% Bid Depth:** The cumulative fiat value of all buy limit orders located within 1% below the current mid-price.
- **2% Ask Depth:** The cumulative fiat value of all sell limit orders located within 2% above the current mid-price.
These metrics offer a standardized way to compare liquidity across different digital assets and exchanges. An asset with $50 million in 2% depth can handle far larger trades with minimal price impact compared to an asset with only $100,000 in 2% depth.
#### Order Book Imbalance
By comparing total bid depth against total ask depth, traders can assess short-term order book imbalance:
- **Heavy Bid Depth:** Indicates significant buying interest below current prices, which may act as structural support.
- **Heavy Ask Depth:** Indicates a wall of selling interest above current prices, which may act as structural overhead resistance.
However, interpreting these imbalances requires caution due to order book dynamics discussed below.
---
### Practical Market Scenarios Driven by Market Depth
#### Scenario 1: The Cascading Flash Crash
A flash crash occurs when an aggressive wave of market sell orders rapidly depletes available bid depth. If the lower price levels in the order book are thin—meaning there are few limit buy orders—the price drops rapidly across multiple levels in seconds.
This drop often triggers automated stop-loss market orders and derivative liquidation orders, which act as additional market sell orders. In a thin market depth environment, this feedback loop leads to severe price wicks before opportunistic limit buyers step in to re-establish market stability.
#### Scenario 2: High Volatility During Macro Events
Prior to major economic announcements or high-impact news, institutional liquidity providers often remove their limit orders from order books to reduce exposure to sharp price swings.
As limit orders are withdrawn, market depth dries up. Consequently, even modest market orders can cause elevated price swings during these periods. Recognizing reduced market depth helps traders understand why markets become unusually volatile around scheduled events.
---
### Risks, Limitations, and Spoofing in Market Depth Analysis
While analyzing order books is valuable, relying strictly on visual depth charts carries distinct risks and limitations.
#### 1. Phantom Liquidity and Order Cancellation
Limit orders are non-binding. A participant can place a massive limit order to buy or sell and cancel it a fraction of a second before it gets filled. Depth that appears robust can disappear instantly when price approaches.
#### 2. Spoofing
Spoofing is a manipulative tactic where large traders place non-bona fide limit orders (large buy or sell "walls") with the intent to cancel them before execution. The objective is to create a false impression of heavy supply or demand, tricking other traders into buying or selling ahead of the wall.
#### 3. Iceberg Orders
Institutional participants rarely submit massive limit orders in full view of the public order book, as doing so alerts the market to their intentions. Instead, they use **iceberg orders**—automated algorithms that break large orders into tiny, sequential limit orders. A price level may appear to have only 1 unit of liquidity visible, but as soon as that unit is filled, another appears automatically until the full hidden order is satisfied.
#### 4. Off-Book Liquidity (OTC Trading)
A substantial portion of high-volume digital asset trading occurs off-exchange via Over-The-Counter (OTC) desks or through decentralized liquidity pools. Therefore, exchange order book depth represents only a fraction of total global market liquidity.
---
### Integrating Market Depth into Risk Management
For intermediate market participants, applying order book insights involves refining execution strategies rather than trying to predict exact price directions.
- **Size Positions Relative to Liquidity:** Avoid using position sizes that exceed the available depth within a reasonable percentage of current price. Ensure market capacity can handle your entry and exit without excessive execution penalty.
- **Utilize Limit Orders to Prevent Slippage:** Using limit orders allows you to control execution price, protecting you from unexpected market sweeps during lower depth periods.
- **Monitor Depth Variations Across Sessions:** Market depth fluctuates throughout the day based on global trading hours. Liquidity is typically higher when major international financial hubs overlap and lower during regional holidays or weekends.
- **Combine Depth with Volume Metrics:** Cross-reference order book depth with executed volume (time-and-sales data) to verify whether orders at key depth levels are actually being executed or simply canceled when tested.
---
### Final Thoughts
Market depth is the core infrastructure underlying price movement in digital asset markets. While candlestick patterns reflect historical transactions, order books reflect live liquidity conditions and potential trade friction.
By understanding how market orders interact with bid-ask queues, recognizing the risks of phantom liquidity, and evaluating order book depth before executing trades, intermediate participants can improve execution quality and better manage structural market risks.
#CryptoEducation #MarketDepth #TradingTips
106

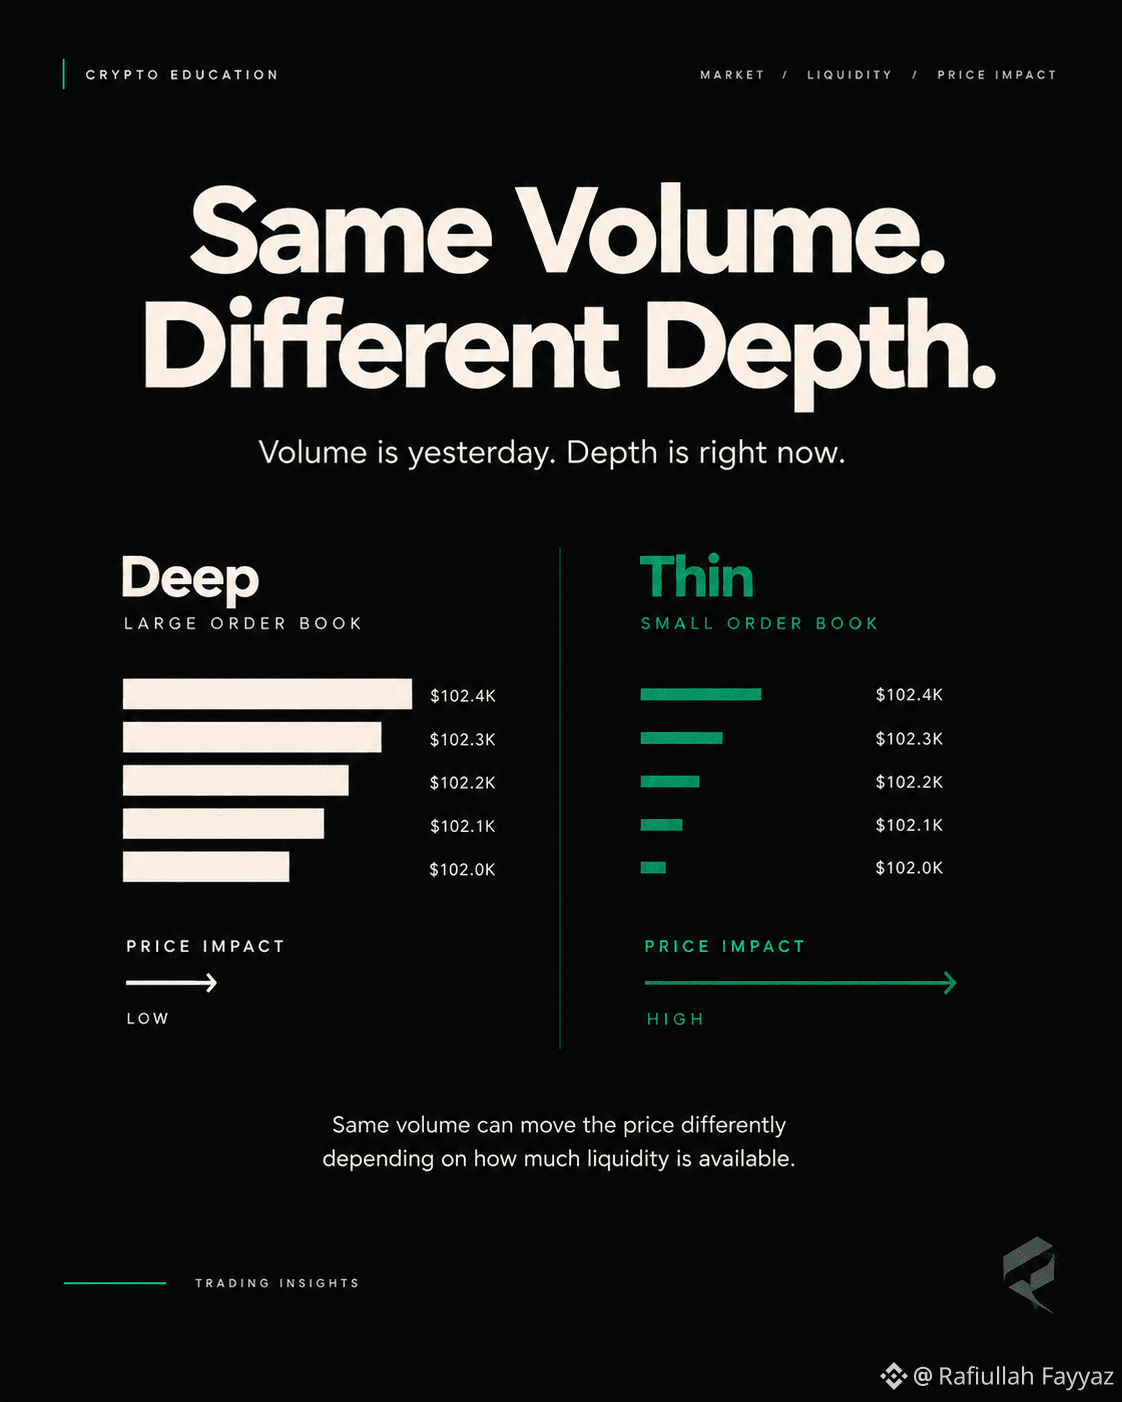
Yesterday I wrote about slippage. Today I want to talk about something related: why two tokens with the same volume can have completely different slippage.
The answer is market depth.
Market depth is the total size of buy and sell orders sitting in the order book at each price level. It's the liquidity underneath the price.
Here's a simple way to think about it:
Token A has $10 million in daily volume and $2 million in order book depth. Token B has $10 million in daily volume and $200,000 in order book depth.
Same volume. Very different depth.
If you place a $50,000 market buy on Token A, you eat through a few price levels. Slippage might be 0.2%. On Token B, the same order eats through most of the book. Slippage might be 3%.
Volume tells you how much traded yesterday. Depth tells you how much can trade right now without moving price.
This is why small caps move so violently. Their depth is thin. A relatively small order can push price 5% or 10%. And when price moves, it attracts attention, which brings more orders, which moves price further.
The lesson: before you trade, check depth. If you're moving size, depth matters more than volume.
#CryptoEducation #MarketDepth #Liquidity
Yesterday I wrote about slippage. Today I want to talk about something related: why two tokens with the same volume can have completely different slippage.
The answer is market depth.
Market depth is the total size of buy and sell orders sitting in the order book at each price level. It's the liquidity underneath the price.
Here's a simple way to think about it:
Token A has $10 million in daily volume and $2 million in order book depth. Token B has $10 million in daily volume and $200,000 in order book depth.
Same volume. Very different depth.
If you place a $50,000 market buy on Token A, you eat through a few price levels. Slippage might be 0.2%. On Token B, the same order eats through most of the book. Slippage might be 3%.
Volume tells you how much traded yesterday. Depth tells you how much can trade right now without moving price.
This is why small caps move so violently. Their depth is thin. A relatively small order can push price 5% or 10%. And when price moves, it attracts attention, which brings more orders, which moves price further.
The lesson: before you trade, check depth. If you're moving size, depth matters more than volume.
#CryptoEducation #MarketDepth #Liquidity
The answer is market depth.
Market depth is the total size of buy and sell orders sitting in the order book at each price level. It's the liquidity underneath the price.
Here's a simple way to think about it:
Token A has $10 million in daily volume and $2 million in order book depth. Token B has $10 million in daily volume and $200,000 in order book depth.
Same volume. Very different depth.
If you place a $50,000 market buy on Token A, you eat through a few price levels. Slippage might be 0.2%. On Token B, the same order eats through most of the book. Slippage might be 3%.
Volume tells you how much traded yesterday. Depth tells you how much can trade right now without moving price.
This is why small caps move so violently. Their depth is thin. A relatively small order can push price 5% or 10%. And when price moves, it attracts attention, which brings more orders, which moves price further.
The lesson: before you trade, check depth. If you're moving size, depth matters more than volume.
#CryptoEducation #MarketDepth #Liquidity
56
Demystifying Market Depth: How Order Books Shape Crypto Price MovementEvery trader has experienced the sudden frustration of placing a market order and seeing it execute at a price significantly different from what was displayed on the screen. Or perhaps you have watched a cryptocurrency’s price hit an invisible ceiling and violently bounce back down. Behind these everyday market occurrences lies a fundamental structure that governs every centralized trading venue: market depth.
Market depth refers to a market’s ability to absorb relatively large order sizes without causing significant price fluctuations. It is the real-time visual representation of open buy and sell orders at various price levels. For intermediate crypto traders moving beyond basic technical indicators like moving averages or relative strength index (RSI), understanding market depth is a critical step toward evaluating true market liquidity, anticipating price friction, and executing trades efficiently.
### The Anatomy of the Order Book
To understand market depth, one must first understand the central limit order book (CLOB). The order book is a live, continuously updated ledger of buy and sell limit orders for a specific trading pair on an exchange. It is divided into two primary sides:
1. The Bid Side (Buyers): This represents traders looking to buy the asset. Bids are ranked from the highest price to the lowest price. The highest bid is referred to as the "best bid"—the top price anyone is currently willing to pay.
2. The Ask Side (Sellers): This represents traders looking to sell the asset. Asks (also called offers) are ranked from the lowest price to the highest price. The lowest ask is referred to as the "best ask"—the cheapest price at which anyone is currently willing to sell.
The difference between the highest bid and the lowest ask is known as the bid-ask spread. In highly liquid, high-volume assets, this spread is extremely narrow—often a fraction of a cent. In illiquid or low-volume assets, the spread can widen dramatically, increasing the implicit cost of trading.
### Visualizing Market Depth Charts
Trading platforms typically offer a visual representation of the order book called a depth chart. A depth chart plots price along the horizontal (X) axis and cumulative volume along the vertical (Y) axis.
- The Green Slope (Bids): Located on the left side, this represents the cumulative sum of all buy orders from the current market price downward.
- The Red Slope (Asks): Located on the right side, this represents the cumulative sum of all sell orders from the current market price upward.
When you look at a depth chart, steep vertical sections—often called "liquidity walls"—indicate large concentrations of orders at a specific price level. A gradual, shallow slope indicates thin liquidity spread out across multiple price tiers.
### How Market Depth Drives Slippage
The interaction between market orders and limit orders determines how price moves through the order book. While limit orders add liquidity to the book (making them liquidity "makers"), market orders consume liquidity from the book (making them liquidity "takers").
When a trader submits a market order, the exchange automatically matches it against the best available limit orders on the opposite side of the book until the order is completely filled.
Consider a practical example involving an intermediate trader who wants to execute a market buy order for 50 units of a hypothetical token currently quoted at $10.00.
Suppose the order book looks like this:
- Tier 1 (Best Ask): 10 units available at $10.00
- Tier 2: 15 units available at $10.10
- Tier 3: 25 units available at $10.30
If the trader submits a market buy order for 50 units, the matching engine fills the order sequentially:
- First, 10 units are bought at $10.00 ($100 total)
- Next, 15 units are bought at $10.10 ($151.50 total)
- Finally, the remaining 25 units are bought at $10.30 ($257.50 total)
The total capital spent is $509.00, resulting in an average execution price of $10.18 per token. Even though the visible ticker price was $10.00 when the trader pressed "buy," the true execution price was 1.8% higher due to market depth limits. This discrepancy is known as slippage.
In markets with deep order books, thousands of units sit at every fraction of a cent, meaning large orders cause minimal slippage. In thin markets, even modest orders can sweep through multiple price tiers, triggering sharp upward or downward price spikes.
### Identifying Liquidity Walls: Real Support and Resistance
Technical analysis frequently relies on historical price charts to draw support and resistance lines. Market depth, however, shows real-time forward-looking supply and demand structural walls.
- Buy Walls: A buy wall occurs when a massive cumulative volume of limit buy orders is placed at a specific price point (for instance, a cumulative bid of 500 Bitcoin at $60,000). For the market price to fall below $60,000, short-term market sellers must generate enough market sell volume to completely fill that 500 Bitcoin buy wall. Thus, buy walls function as active, order-driven support.
- Sell Walls: A sell wall occurs when a massive volume of limit sell orders rests at a specific price point. To push the price higher, market buyers must consume all available sell liquidity at that level. Sell walls function as dynamic resistance zones.
Traders track these walls to gauge short-term market sentiment. If price approaches a major sell wall and buying volume begins to taper off, the price is likely to bounce lower. Conversely, if persistent aggressive buying completely absorbs a sell wall, it can ignite a rapid momentum breakout as short sellers rush to cover.
### Critical Limitations and Market Manipulations
While market depth provides valuable real-time structural insight, relying solely on order book visuals presents significant risks due to sophisticated trading tactics.
1. Spoofing: Spoofing is a form of market manipulation where large traders or automated bots place massive limit orders (fake buy or sell walls) with no actual intention of executing them. The goal is to manipulate crowd psychology—tricking retail traders into buying or selling out of fear or FOMO. Once the price moves in the manipulator's favor, the fake wall is canceled seconds before market orders can hit it.
2. Iceberg Orders: Institutional traders rarely display their full position size on a public order book, as doing so would cause the market to move against them prematurely. Instead, they use "iceberg orders"—algorithmic execution tools that divide a huge order into small, automated tranches. Only a tiny fraction (the tip of the iceberg) is visible on the order book at any given time. As soon as one visible tranche is filled, the algorithm instantly inserts the next.
3. Liquidity Fragmentation: Cryptocurrency markets operate across numerous independent global exchanges. An order book on one platform reflects only the liquidity native to that specific exchange. A token may appear deeply liquid on a major global platform while remaining dangerously thin on smaller venues.
### Practical Risk Management Techniques
To effectively integrate market depth analysis into a trading discipline, consider the following practical safeguards:
- Avoid Over-Reliance on Single Tiers: Always inspect total aggregated depth across multiple percentage bands (e.g., +/- 1% and +/- 2% depth from mid-price) rather than relying on top-of-book quotes.
- Use Algorithmic Execution for Large Orders: If executing a size larger than the immediate top-of-book depth can handle, use limit orders or time-weighted average price (TWAP) tools to break up execution and minimize self-inflicted slippage.
- Do Not Hide Stops Directly Behind Visible Walls: Because market manipulators often target obvious liquidity clusters, placing stop-loss orders immediately behind heavily public buy or sell walls can lead to engineered liquidity sweeps (stop runs) before the price recovers.
### Final Thoughts
Market depth offers a transparent window into the mechanics of supply, demand, and execution price. By learning to read order books correctly, calculate potential slippage, and guard against manipulation techniques like spoofing and iceberg orders, intermediate traders can move beyond static chart patterns and execute strategies with greater precision.
#CryptoEducation #MarketDepth #TradingStrategy
Demystifying Market Depth: How Order Books Shape Crypto Price Movement
Every trader has experienced the sudden frustration of placing a market order and seeing it execute at a price significantly different from what was displayed on the screen. Or perhaps you have watched a cryptocurrency’s price hit an invisible ceiling and violently bounce back down. Behind these everyday market occurrences lies a fundamental structure that governs every centralized trading venue: market depth.
Market depth refers to a market’s ability to absorb relatively large order sizes without causing significant price fluctuations. It is the real-time visual representation of open buy and sell orders at various price levels. For intermediate crypto traders moving beyond basic technical indicators like moving averages or relative strength index (RSI), understanding market depth is a critical step toward evaluating true market liquidity, anticipating price friction, and executing trades efficiently.
### The Anatomy of the Order Book
To understand market depth, one must first understand the central limit order book (CLOB). The order book is a live, continuously updated ledger of buy and sell limit orders for a specific trading pair on an exchange. It is divided into two primary sides:
1. The Bid Side (Buyers): This represents traders looking to buy the asset. Bids are ranked from the highest price to the lowest price. The highest bid is referred to as the "best bid"—the top price anyone is currently willing to pay.
2. The Ask Side (Sellers): This represents traders looking to sell the asset. Asks (also called offers) are ranked from the lowest price to the highest price. The lowest ask is referred to as the "best ask"—the cheapest price at which anyone is currently willing to sell.
The difference between the highest bid and the lowest ask is known as the bid-ask spread. In highly liquid, high-volume assets, this spread is extremely narrow—often a fraction of a cent. In illiquid or low-volume assets, the spread can widen dramatically, increasing the implicit cost of trading.
### Visualizing Market Depth Charts
Trading platforms typically offer a visual representation of the order book called a depth chart. A depth chart plots price along the horizontal (X) axis and cumulative volume along the vertical (Y) axis.
- The Green Slope (Bids): Located on the left side, this represents the cumulative sum of all buy orders from the current market price downward.
- The Red Slope (Asks): Located on the right side, this represents the cumulative sum of all sell orders from the current market price upward.
When you look at a depth chart, steep vertical sections—often called "liquidity walls"—indicate large concentrations of orders at a specific price level. A gradual, shallow slope indicates thin liquidity spread out across multiple price tiers.
### How Market Depth Drives Slippage
The interaction between market orders and limit orders determines how price moves through the order book. While limit orders add liquidity to the book (making them liquidity "makers"), market orders consume liquidity from the book (making them liquidity "takers").
When a trader submits a market order, the exchange automatically matches it against the best available limit orders on the opposite side of the book until the order is completely filled.
Consider a practical example involving an intermediate trader who wants to execute a market buy order for 50 units of a hypothetical token currently quoted at $10.00.
Suppose the order book looks like this:
- Tier 1 (Best Ask): 10 units available at $10.00
- Tier 2: 15 units available at $10.10
- Tier 3: 25 units available at $10.30
If the trader submits a market buy order for 50 units, the matching engine fills the order sequentially:
- First, 10 units are bought at $10.00 ($100 total)
- Next, 15 units are bought at $10.10 ($151.50 total)
- Finally, the remaining 25 units are bought at $10.30 ($257.50 total)
The total capital spent is $509.00, resulting in an average execution price of $10.18 per token. Even though the visible ticker price was $10.00 when the trader pressed "buy," the true execution price was 1.8% higher due to market depth limits. This discrepancy is known as slippage.
In markets with deep order books, thousands of units sit at every fraction of a cent, meaning large orders cause minimal slippage. In thin markets, even modest orders can sweep through multiple price tiers, triggering sharp upward or downward price spikes.
### Identifying Liquidity Walls: Real Support and Resistance
Technical analysis frequently relies on historical price charts to draw support and resistance lines. Market depth, however, shows real-time forward-looking supply and demand structural walls.
- Buy Walls: A buy wall occurs when a massive cumulative volume of limit buy orders is placed at a specific price point (for instance, a cumulative bid of 500 Bitcoin at $60,000). For the market price to fall below $60,000, short-term market sellers must generate enough market sell volume to completely fill that 500 Bitcoin buy wall. Thus, buy walls function as active, order-driven support.
- Sell Walls: A sell wall occurs when a massive volume of limit sell orders rests at a specific price point. To push the price higher, market buyers must consume all available sell liquidity at that level. Sell walls function as dynamic resistance zones.
Traders track these walls to gauge short-term market sentiment. If price approaches a major sell wall and buying volume begins to taper off, the price is likely to bounce lower. Conversely, if persistent aggressive buying completely absorbs a sell wall, it can ignite a rapid momentum breakout as short sellers rush to cover.
### Critical Limitations and Market Manipulations
While market depth provides valuable real-time structural insight, relying solely on order book visuals presents significant risks due to sophisticated trading tactics.
1. Spoofing: Spoofing is a form of market manipulation where large traders or automated bots place massive limit orders (fake buy or sell walls) with no actual intention of executing them. The goal is to manipulate crowd psychology—tricking retail traders into buying or selling out of fear or FOMO. Once the price moves in the manipulator's favor, the fake wall is canceled seconds before market orders can hit it.
2. Iceberg Orders: Institutional traders rarely display their full position size on a public order book, as doing so would cause the market to move against them prematurely. Instead, they use "iceberg orders"—algorithmic execution tools that divide a huge order into small, automated tranches. Only a tiny fraction (the tip of the iceberg) is visible on the order book at any given time. As soon as one visible tranche is filled, the algorithm instantly inserts the next.
3. Liquidity Fragmentation: Cryptocurrency markets operate across numerous independent global exchanges. An order book on one platform reflects only the liquidity native to that specific exchange. A token may appear deeply liquid on a major global platform while remaining dangerously thin on smaller venues.
### Practical Risk Management Techniques
To effectively integrate market depth analysis into a trading discipline, consider the following practical safeguards:
- Avoid Over-Reliance on Single Tiers: Always inspect total aggregated depth across multiple percentage bands (e.g., +/- 1% and +/- 2% depth from mid-price) rather than relying on top-of-book quotes.
- Use Algorithmic Execution for Large Orders: If executing a size larger than the immediate top-of-book depth can handle, use limit orders or time-weighted average price (TWAP) tools to break up execution and minimize self-inflicted slippage.
- Do Not Hide Stops Directly Behind Visible Walls: Because market manipulators often target obvious liquidity clusters, placing stop-loss orders immediately behind heavily public buy or sell walls can lead to engineered liquidity sweeps (stop runs) before the price recovers.
### Final Thoughts
Market depth offers a transparent window into the mechanics of supply, demand, and execution price. By learning to read order books correctly, calculate potential slippage, and guard against manipulation techniques like spoofing and iceberg orders, intermediate traders can move beyond static chart patterns and execute strategies with greater precision.
#CryptoEducation #MarketDepth #TradingStrategy
Market depth refers to a market’s ability to absorb relatively large order sizes without causing significant price fluctuations. It is the real-time visual representation of open buy and sell orders at various price levels. For intermediate crypto traders moving beyond basic technical indicators like moving averages or relative strength index (RSI), understanding market depth is a critical step toward evaluating true market liquidity, anticipating price friction, and executing trades efficiently.
### The Anatomy of the Order Book
To understand market depth, one must first understand the central limit order book (CLOB). The order book is a live, continuously updated ledger of buy and sell limit orders for a specific trading pair on an exchange. It is divided into two primary sides:
1. The Bid Side (Buyers): This represents traders looking to buy the asset. Bids are ranked from the highest price to the lowest price. The highest bid is referred to as the "best bid"—the top price anyone is currently willing to pay.
2. The Ask Side (Sellers): This represents traders looking to sell the asset. Asks (also called offers) are ranked from the lowest price to the highest price. The lowest ask is referred to as the "best ask"—the cheapest price at which anyone is currently willing to sell.
The difference between the highest bid and the lowest ask is known as the bid-ask spread. In highly liquid, high-volume assets, this spread is extremely narrow—often a fraction of a cent. In illiquid or low-volume assets, the spread can widen dramatically, increasing the implicit cost of trading.
### Visualizing Market Depth Charts
Trading platforms typically offer a visual representation of the order book called a depth chart. A depth chart plots price along the horizontal (X) axis and cumulative volume along the vertical (Y) axis.
- The Green Slope (Bids): Located on the left side, this represents the cumulative sum of all buy orders from the current market price downward.
- The Red Slope (Asks): Located on the right side, this represents the cumulative sum of all sell orders from the current market price upward.
When you look at a depth chart, steep vertical sections—often called "liquidity walls"—indicate large concentrations of orders at a specific price level. A gradual, shallow slope indicates thin liquidity spread out across multiple price tiers.
### How Market Depth Drives Slippage
The interaction between market orders and limit orders determines how price moves through the order book. While limit orders add liquidity to the book (making them liquidity "makers"), market orders consume liquidity from the book (making them liquidity "takers").
When a trader submits a market order, the exchange automatically matches it against the best available limit orders on the opposite side of the book until the order is completely filled.
Consider a practical example involving an intermediate trader who wants to execute a market buy order for 50 units of a hypothetical token currently quoted at $10.00.
Suppose the order book looks like this:
- Tier 1 (Best Ask): 10 units available at $10.00
- Tier 2: 15 units available at $10.10
- Tier 3: 25 units available at $10.30
If the trader submits a market buy order for 50 units, the matching engine fills the order sequentially:
- First, 10 units are bought at $10.00 ($100 total)
- Next, 15 units are bought at $10.10 ($151.50 total)
- Finally, the remaining 25 units are bought at $10.30 ($257.50 total)
The total capital spent is $509.00, resulting in an average execution price of $10.18 per token. Even though the visible ticker price was $10.00 when the trader pressed "buy," the true execution price was 1.8% higher due to market depth limits. This discrepancy is known as slippage.
In markets with deep order books, thousands of units sit at every fraction of a cent, meaning large orders cause minimal slippage. In thin markets, even modest orders can sweep through multiple price tiers, triggering sharp upward or downward price spikes.
### Identifying Liquidity Walls: Real Support and Resistance
Technical analysis frequently relies on historical price charts to draw support and resistance lines. Market depth, however, shows real-time forward-looking supply and demand structural walls.
- Buy Walls: A buy wall occurs when a massive cumulative volume of limit buy orders is placed at a specific price point (for instance, a cumulative bid of 500 Bitcoin at $60,000). For the market price to fall below $60,000, short-term market sellers must generate enough market sell volume to completely fill that 500 Bitcoin buy wall. Thus, buy walls function as active, order-driven support.
- Sell Walls: A sell wall occurs when a massive volume of limit sell orders rests at a specific price point. To push the price higher, market buyers must consume all available sell liquidity at that level. Sell walls function as dynamic resistance zones.
Traders track these walls to gauge short-term market sentiment. If price approaches a major sell wall and buying volume begins to taper off, the price is likely to bounce lower. Conversely, if persistent aggressive buying completely absorbs a sell wall, it can ignite a rapid momentum breakout as short sellers rush to cover.
### Critical Limitations and Market Manipulations
While market depth provides valuable real-time structural insight, relying solely on order book visuals presents significant risks due to sophisticated trading tactics.
1. Spoofing: Spoofing is a form of market manipulation where large traders or automated bots place massive limit orders (fake buy or sell walls) with no actual intention of executing them. The goal is to manipulate crowd psychology—tricking retail traders into buying or selling out of fear or FOMO. Once the price moves in the manipulator's favor, the fake wall is canceled seconds before market orders can hit it.
2. Iceberg Orders: Institutional traders rarely display their full position size on a public order book, as doing so would cause the market to move against them prematurely. Instead, they use "iceberg orders"—algorithmic execution tools that divide a huge order into small, automated tranches. Only a tiny fraction (the tip of the iceberg) is visible on the order book at any given time. As soon as one visible tranche is filled, the algorithm instantly inserts the next.
3. Liquidity Fragmentation: Cryptocurrency markets operate across numerous independent global exchanges. An order book on one platform reflects only the liquidity native to that specific exchange. A token may appear deeply liquid on a major global platform while remaining dangerously thin on smaller venues.
### Practical Risk Management Techniques
To effectively integrate market depth analysis into a trading discipline, consider the following practical safeguards:
- Avoid Over-Reliance on Single Tiers: Always inspect total aggregated depth across multiple percentage bands (e.g., +/- 1% and +/- 2% depth from mid-price) rather than relying on top-of-book quotes.
- Use Algorithmic Execution for Large Orders: If executing a size larger than the immediate top-of-book depth can handle, use limit orders or time-weighted average price (TWAP) tools to break up execution and minimize self-inflicted slippage.
- Do Not Hide Stops Directly Behind Visible Walls: Because market manipulators often target obvious liquidity clusters, placing stop-loss orders immediately behind heavily public buy or sell walls can lead to engineered liquidity sweeps (stop runs) before the price recovers.
### Final Thoughts
Market depth offers a transparent window into the mechanics of supply, demand, and execution price. By learning to read order books correctly, calculate potential slippage, and guard against manipulation techniques like spoofing and iceberg orders, intermediate traders can move beyond static chart patterns and execute strategies with greater precision.
#CryptoEducation #MarketDepth #TradingStrategy
98
Yesterday I wrote about order flow — the study of who's aggressive and who's passive in the market.
Today I want to connect that to something simpler: market depth.
Market depth is the total size of buy and sell orders sitting in the order book at any given price level. It's the "liquidity" you hear people talk about.
When depth is thin, small orders move price a lot. When depth is thick, even large orders barely move it.
This is why two coins can have the same 24-hour volume but very different price behavior.
ZEC traded $1.85 billion today. But ZEC's order book depth isn't the same as BTC's. If you tried to buy $10 million of ZEC in a single market order, you'd move the price more than buying $10 million of BTC.
The lesson: volume tells you how much traded. Depth tells you how much can trade without moving price.
High volume + thin depth = volatile. High volume + thick depth = stable.
If you're trying to understand why a coin moves violently on relatively small volume, check its depth. Often, it's not the volume that's surprising. It's the lack of liquidity underneath it.
#CryptoEducation #MarketDepth #Liquidity
Yesterday I wrote about order flow — the study of who's aggressive and who's passive in the market.
Today I want to connect that to something simpler: market depth.
Market depth is the total size of buy and sell orders sitting in the order book at any given price level. It's the "liquidity" you hear people talk about.
When depth is thin, small orders move price a lot. When depth is thick, even large orders barely move it.
This is why two coins can have the same 24-hour volume but very different price behavior.
ZEC traded $1.85 billion today. But ZEC's order book depth isn't the same as BTC's. If you tried to buy $10 million of ZEC in a single market order, you'd move the price more than buying $10 million of BTC.
The lesson: volume tells you how much traded. Depth tells you how much can trade without moving price.
High volume + thin depth = volatile. High volume + thick depth = stable.
If you're trying to understand why a coin moves violently on relatively small volume, check its depth. Often, it's not the volume that's surprising. It's the lack of liquidity underneath it.
#CryptoEducation #MarketDepth #Liquidity
Today I want to connect that to something simpler: market depth.
Market depth is the total size of buy and sell orders sitting in the order book at any given price level. It's the "liquidity" you hear people talk about.
When depth is thin, small orders move price a lot. When depth is thick, even large orders barely move it.
This is why two coins can have the same 24-hour volume but very different price behavior.
ZEC traded $1.85 billion today. But ZEC's order book depth isn't the same as BTC's. If you tried to buy $10 million of ZEC in a single market order, you'd move the price more than buying $10 million of BTC.
The lesson: volume tells you how much traded. Depth tells you how much can trade without moving price.
High volume + thin depth = volatile. High volume + thick depth = stable.
If you're trying to understand why a coin moves violently on relatively small volume, check its depth. Often, it's not the volume that's surprising. It's the lack of liquidity underneath it.
#CryptoEducation #MarketDepth #Liquidity
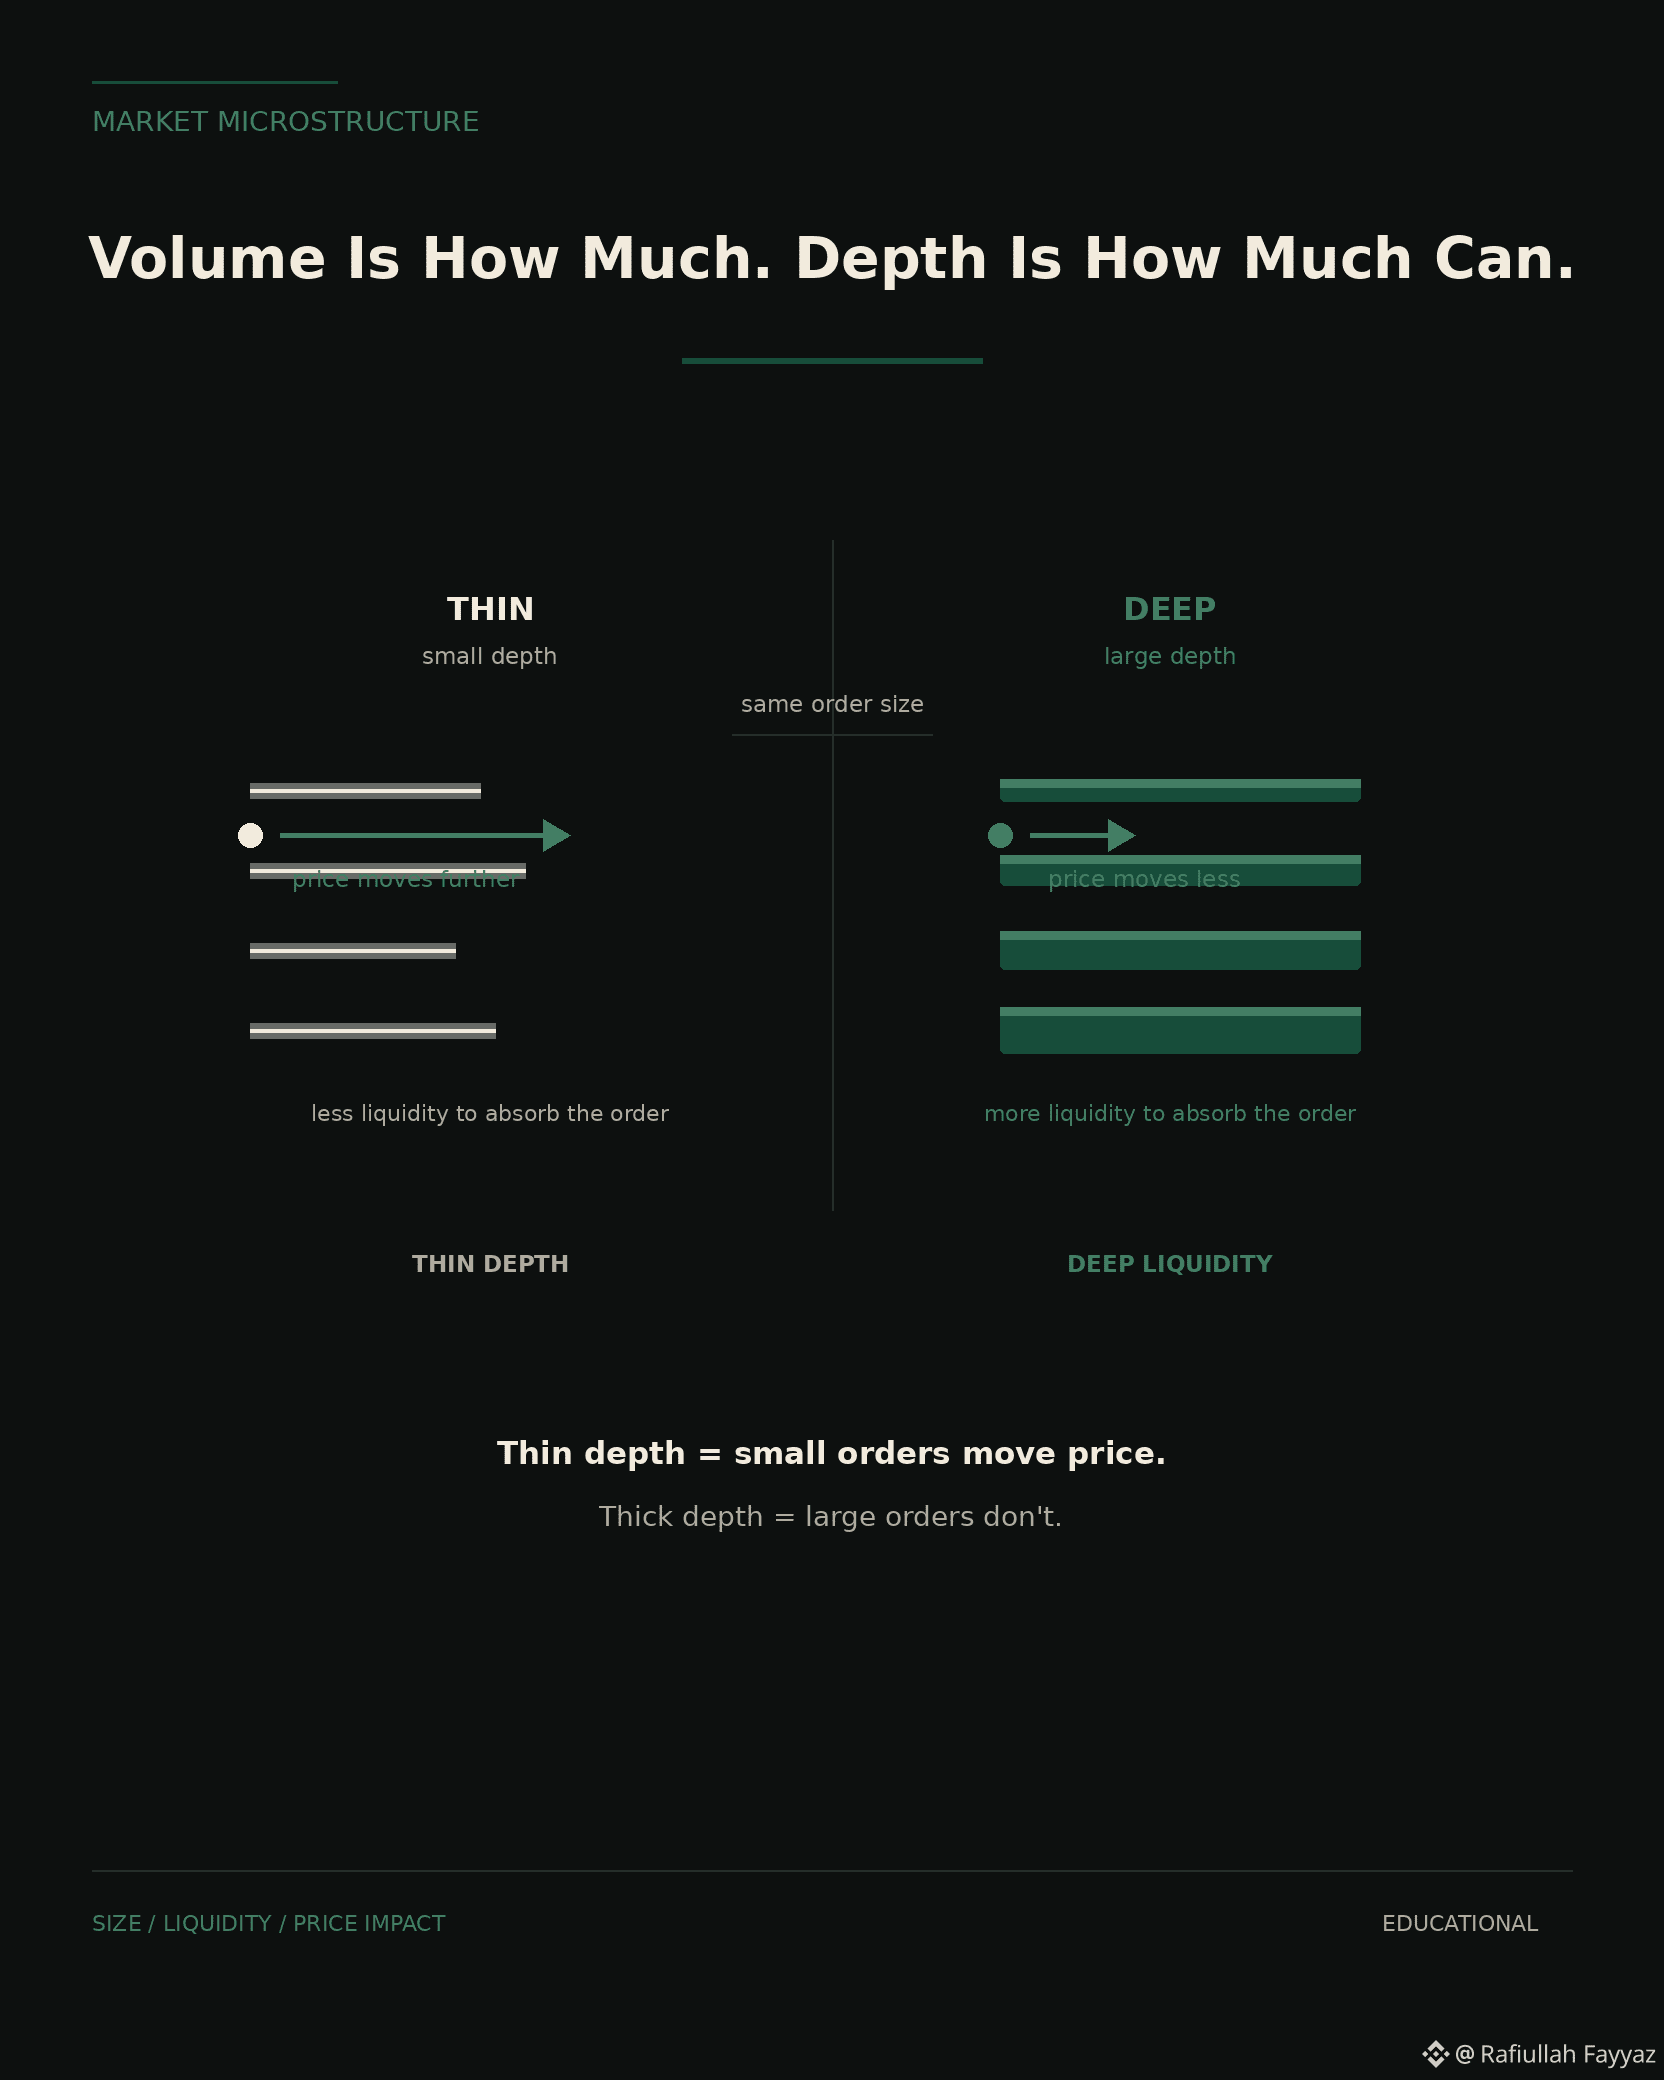
39
Understanding Market Depth: How Order Books Reveal the Real Mechanics Behind Crypto PricesWhen beginner crypto traders look at an exchange interface, their focus almost exclusively lands on a single headline figure: the current market price. If Bitcoin is displayed at $65,000, the general assumption is that anyone can buy or sell at precisely $65,000. However, seasoned market participants know that the headline price is merely a historic artifact—it represents the last price at which a buyer and a seller agreed to execute a trade. It does not tell you what will happen when the next order hits the market.
To understand how prices actually move and how efficiently your trades will execute, you must look beneath the headline figure into market depth. Market depth measures an exchange’s capacity to absorb relatively large market orders without causing significant price fluctuations. It offers a transparent window into the supply and demand dynamics of an asset across various price levels.
For intermediate traders transitioning from basic spot purchases to strategic trading, mastering market depth is an essential skill. This guide explores the core components of order books, how to read depth charts, practical trade execution scenarios, and the critical limitations every trader must consider.
---
### The Anatomy of the Order Book
At the heart of market depth lies the order book, an electronic ledger listing all active, unfilled limit orders for a specific trading asset. The order book is divided into two fundamental sides:
1. **Bids (Buy Orders):** Located on the lower side of the order book (typically color-coded green), bids represent orders from buyers specifying the maximum price they are willing to pay for a asset. Bids are ranked from highest price to lowest price.
2. **Asks (Sell Orders or Offers):** Located on the upper side (typically color-coded red), asks represent orders from sellers specifying the minimum price they are willing to accept. Asks are ranked from lowest price to highest price.
The difference between the highest available bid price and the lowest available ask price is known as the **bid-ask spread**. In highly liquid assets like Bitcoin or Ethereum on major exchanges, this spread can be fractions of a cent. In low-volume altcoins, the spread can be significantly wider, instantly imposing a hidden cost on traders who execute market orders.
When you submit a **limit order**, your order enters the order book, adding liquidity to the market. You become a market *maker*. When you submit a **market order**, your order matches immediately against existing limit orders in the book, consuming liquidity. You act as a market *taker*.
---
### Visualizing Market Depth: The Depth Chart and Cumulative Volume
To synthesize thousands of individual limit orders into an intuitive format, crypto exchanges offer visual market depth charts. A depth chart plots price on the horizontal axis (X-axis) and cumulative volume on the vertical axis (Y-axis).
- **The Bid Wall (Green Curve):** Accumulates buy orders as the price moves downward from the current market price.
- **The Ask Wall (Red Curve):** Accumulates sell orders as the price moves upward from the current market price.
The slope of these curves visually communicates market resilience. A steep curve indicates a concentration of heavy orders within a narrow price range—meaning a large volume must be traded to move the price beyond that level. A gentle, flat slope indicates thin liquidity, where even small buy or sell orders can push the price significantly higher or lower.
#### Practical Example: Order Book Slippage
To understand why market depth matters, consider a hypothetical order book for Ethereum:
- Current Best Ask: $3,500 (Available quantity: 2 Ethereum)
- Next Ask Level: $3,505 (Available quantity: 3 Ethereum)
- Next Ask Level: $3,510 (Available quantity: 5 Ethereum)
- Next Ask Level: $3,520 (Available quantity: 10 Ethereum)
Now, imagine a trader places a **market buy order** for 8 Ethereum.
Because a market order demands immediate execution at the best available prices, it sweeps through the order book sequentially:
- The first 2 Ethereum are purchased at $3,500.
- The next 3 Ethereum are purchased at $3,505.
- The remaining 3 Ethereum are purchased at $3,510.
The average purchase price for this trader is approximately $3,505.62 per Ethereum, rather than the initial $3,500 ticker price. The difference between expected execution price and actual execution price is called **slippage**. Without analyzing market depth before submitting the order, the trader would suffer unexpected execution drag.
---
### Order Book Dynamics: Spotting Manipulation and Order Book Illusions
While market depth provides valuable visibility, order books are dynamic, fast-changing, and occasionally deceptive. Advanced traders use various strategies to manage their footprints or manipulate retail perception.
#### 1. "Buy Walls" and "Sell Walls"
A sudden, massive block of buy orders placed at a specific price level creates a visual "buy wall." Retail traders often interpret a large buy wall as strong support, assuming an institutional buyer is floor-pricing the asset. Conversely, a large "sell wall" can intimidate buyers into selling early.
However, order book entries are non-binding until filled. Traders can cancel limit orders instantly before the price reaches them.
#### 2. Spoofing
Spoofing occurs when a malicious trader places large fake limit orders with no intention of letting them execute. The goal is to artificially create the illusion of heavy demand or supply, prompting other traders to buy or sell. Once market participants push the price in the desired direction, the spoofer cancels their large order and profits from a smaller position placed on the opposite side.
#### 3. Iceberg Orders
Institutional participants trading large volumes rarely place their full order on the public book at once, as doing so would drastically move the market against them. Instead, they use "iceberg orders." An iceberg order divides a massive trade into smaller limit orders, exposing only a tiny fraction (the tip of the iceberg) to the public order book at any given time. As soon as one visible piece fills, another automatically replenishes.
---
### Risks and Limitations of Relying Solely on Market Depth
While analyzing market depth is superior to trading blindly based on single price points, it is far from infallible. Traders must account for several structural limitations:
- **High-Frequency Trading (HFT) and Algorithmic Speed:** Algorithmic trading software can modify or cancel hundreds of order book entries within milliseconds. The depth you see on your screen may vanish the instant a real market order arrives.
- **Over-the-Counter (OTC) Trading:** Massive institutional trades are rarely conducted directly on public order books. They frequently occur off-exchange via OTC desks to avoid market impact. Consequently, order book depth does not reflect total institutional inventory or interest.
- **Venue Fragmentation:** Crypto markets operate across dozens of major global exchanges simultaneously. Deep liquidity on one exchange does not guarantee liquidity on another. Price imbalances can lead to cross-venue arbitrage, changing depth rapidly across multiple platforms.
- **Sudden Illiquidity During Crises:** In periods of extreme macroeconomic stress or market panic, liquidity providers often withdraw their limit orders altogether to avoid toxic flow. This can cause order books to empty in seconds, resulting in severe price gap-downs or flash crashes.
---
### Key Takeaways for Traders
Analyzing market depth equips intermediate crypto traders with a more grounded, realistic perspective on price movement and execution cost.
1. **Calculate Price Impact Before Order Submission:** For significant position sizes, always review the available depth to estimate slippage before choosing a market order over a limit order.
2. **Treat Order Book Walls with Skepticism:** Do not assume large bid or ask walls represent firm, guaranteed support or resistance. Verify whether orders hold firm as price approaches them.
3. **Combine Depth Analysis with Other Indicators:** Market depth shows short-term order placement, but it should be cross-referenced with volume profile analysis, macro trends, and overall market structure for sound risk management.
Market depth analysis is not a shortcut to predicting exact price targets, nor does it guarantee profitable outcomes. Crypto trading inherently involves high risk and price volatility. However, understanding order book mechanics helps you execute trades more efficiently, protect your capital against hidden execution costs, and navigate complex market environments with clarity.
#CryptoTrading #MarketDepth #OrderBook
Understanding Market Depth: How Order Books Reveal the Real Mechanics Behind Crypto Prices
When beginner crypto traders look at an exchange interface, their focus almost exclusively lands on a single headline figure: the current market price. If Bitcoin is displayed at $65,000, the general assumption is that anyone can buy or sell at precisely $65,000. However, seasoned market participants know that the headline price is merely a historic artifact—it represents the last price at which a buyer and a seller agreed to execute a trade. It does not tell you what will happen when the next order hits the market.
To understand how prices actually move and how efficiently your trades will execute, you must look beneath the headline figure into market depth. Market depth measures an exchange’s capacity to absorb relatively large market orders without causing significant price fluctuations. It offers a transparent window into the supply and demand dynamics of an asset across various price levels.
For intermediate traders transitioning from basic spot purchases to strategic trading, mastering market depth is an essential skill. This guide explores the core components of order books, how to read depth charts, practical trade execution scenarios, and the critical limitations every trader must consider.
---
### The Anatomy of the Order Book
At the heart of market depth lies the order book, an electronic ledger listing all active, unfilled limit orders for a specific trading asset. The order book is divided into two fundamental sides:
1. **Bids (Buy Orders):** Located on the lower side of the order book (typically color-coded green), bids represent orders from buyers specifying the maximum price they are willing to pay for a asset. Bids are ranked from highest price to lowest price.
2. **Asks (Sell Orders or Offers):** Located on the upper side (typically color-coded red), asks represent orders from sellers specifying the minimum price they are willing to accept. Asks are ranked from lowest price to highest price.
The difference between the highest available bid price and the lowest available ask price is known as the **bid-ask spread**. In highly liquid assets like Bitcoin or Ethereum on major exchanges, this spread can be fractions of a cent. In low-volume altcoins, the spread can be significantly wider, instantly imposing a hidden cost on traders who execute market orders.
When you submit a **limit order**, your order enters the order book, adding liquidity to the market. You become a market *maker*. When you submit a **market order**, your order matches immediately against existing limit orders in the book, consuming liquidity. You act as a market *taker*.
---
### Visualizing Market Depth: The Depth Chart and Cumulative Volume
To synthesize thousands of individual limit orders into an intuitive format, crypto exchanges offer visual market depth charts. A depth chart plots price on the horizontal axis (X-axis) and cumulative volume on the vertical axis (Y-axis).
- **The Bid Wall (Green Curve):** Accumulates buy orders as the price moves downward from the current market price.
- **The Ask Wall (Red Curve):** Accumulates sell orders as the price moves upward from the current market price.
The slope of these curves visually communicates market resilience. A steep curve indicates a concentration of heavy orders within a narrow price range—meaning a large volume must be traded to move the price beyond that level. A gentle, flat slope indicates thin liquidity, where even small buy or sell orders can push the price significantly higher or lower.
#### Practical Example: Order Book Slippage
To understand why market depth matters, consider a hypothetical order book for Ethereum:
- Current Best Ask: $3,500 (Available quantity: 2 Ethereum)
- Next Ask Level: $3,505 (Available quantity: 3 Ethereum)
- Next Ask Level: $3,510 (Available quantity: 5 Ethereum)
- Next Ask Level: $3,520 (Available quantity: 10 Ethereum)
Now, imagine a trader places a **market buy order** for 8 Ethereum.
Because a market order demands immediate execution at the best available prices, it sweeps through the order book sequentially:
- The first 2 Ethereum are purchased at $3,500.
- The next 3 Ethereum are purchased at $3,505.
- The remaining 3 Ethereum are purchased at $3,510.
The average purchase price for this trader is approximately $3,505.62 per Ethereum, rather than the initial $3,500 ticker price. The difference between expected execution price and actual execution price is called **slippage**. Without analyzing market depth before submitting the order, the trader would suffer unexpected execution drag.
---
### Order Book Dynamics: Spotting Manipulation and Order Book Illusions
While market depth provides valuable visibility, order books are dynamic, fast-changing, and occasionally deceptive. Advanced traders use various strategies to manage their footprints or manipulate retail perception.
#### 1. "Buy Walls" and "Sell Walls"
A sudden, massive block of buy orders placed at a specific price level creates a visual "buy wall." Retail traders often interpret a large buy wall as strong support, assuming an institutional buyer is floor-pricing the asset. Conversely, a large "sell wall" can intimidate buyers into selling early.
However, order book entries are non-binding until filled. Traders can cancel limit orders instantly before the price reaches them.
#### 2. Spoofing
Spoofing occurs when a malicious trader places large fake limit orders with no intention of letting them execute. The goal is to artificially create the illusion of heavy demand or supply, prompting other traders to buy or sell. Once market participants push the price in the desired direction, the spoofer cancels their large order and profits from a smaller position placed on the opposite side.
#### 3. Iceberg Orders
Institutional participants trading large volumes rarely place their full order on the public book at once, as doing so would drastically move the market against them. Instead, they use "iceberg orders." An iceberg order divides a massive trade into smaller limit orders, exposing only a tiny fraction (the tip of the iceberg) to the public order book at any given time. As soon as one visible piece fills, another automatically replenishes.
---
### Risks and Limitations of Relying Solely on Market Depth
While analyzing market depth is superior to trading blindly based on single price points, it is far from infallible. Traders must account for several structural limitations:
- **High-Frequency Trading (HFT) and Algorithmic Speed:** Algorithmic trading software can modify or cancel hundreds of order book entries within milliseconds. The depth you see on your screen may vanish the instant a real market order arrives.
- **Over-the-Counter (OTC) Trading:** Massive institutional trades are rarely conducted directly on public order books. They frequently occur off-exchange via OTC desks to avoid market impact. Consequently, order book depth does not reflect total institutional inventory or interest.
- **Venue Fragmentation:** Crypto markets operate across dozens of major global exchanges simultaneously. Deep liquidity on one exchange does not guarantee liquidity on another. Price imbalances can lead to cross-venue arbitrage, changing depth rapidly across multiple platforms.
- **Sudden Illiquidity During Crises:** In periods of extreme macroeconomic stress or market panic, liquidity providers often withdraw their limit orders altogether to avoid toxic flow. This can cause order books to empty in seconds, resulting in severe price gap-downs or flash crashes.
---
### Key Takeaways for Traders
Analyzing market depth equips intermediate crypto traders with a more grounded, realistic perspective on price movement and execution cost.
1. **Calculate Price Impact Before Order Submission:** For significant position sizes, always review the available depth to estimate slippage before choosing a market order over a limit order.
2. **Treat Order Book Walls with Skepticism:** Do not assume large bid or ask walls represent firm, guaranteed support or resistance. Verify whether orders hold firm as price approaches them.
3. **Combine Depth Analysis with Other Indicators:** Market depth shows short-term order placement, but it should be cross-referenced with volume profile analysis, macro trends, and overall market structure for sound risk management.
Market depth analysis is not a shortcut to predicting exact price targets, nor does it guarantee profitable outcomes. Crypto trading inherently involves high risk and price volatility. However, understanding order book mechanics helps you execute trades more efficiently, protect your capital against hidden execution costs, and navigate complex market environments with clarity.
#CryptoTrading #MarketDepth #OrderBook
To understand how prices actually move and how efficiently your trades will execute, you must look beneath the headline figure into market depth. Market depth measures an exchange’s capacity to absorb relatively large market orders without causing significant price fluctuations. It offers a transparent window into the supply and demand dynamics of an asset across various price levels.
For intermediate traders transitioning from basic spot purchases to strategic trading, mastering market depth is an essential skill. This guide explores the core components of order books, how to read depth charts, practical trade execution scenarios, and the critical limitations every trader must consider.
---
### The Anatomy of the Order Book
At the heart of market depth lies the order book, an electronic ledger listing all active, unfilled limit orders for a specific trading asset. The order book is divided into two fundamental sides:
1. **Bids (Buy Orders):** Located on the lower side of the order book (typically color-coded green), bids represent orders from buyers specifying the maximum price they are willing to pay for a asset. Bids are ranked from highest price to lowest price.
2. **Asks (Sell Orders or Offers):** Located on the upper side (typically color-coded red), asks represent orders from sellers specifying the minimum price they are willing to accept. Asks are ranked from lowest price to highest price.
The difference between the highest available bid price and the lowest available ask price is known as the **bid-ask spread**. In highly liquid assets like Bitcoin or Ethereum on major exchanges, this spread can be fractions of a cent. In low-volume altcoins, the spread can be significantly wider, instantly imposing a hidden cost on traders who execute market orders.
When you submit a **limit order**, your order enters the order book, adding liquidity to the market. You become a market *maker*. When you submit a **market order**, your order matches immediately against existing limit orders in the book, consuming liquidity. You act as a market *taker*.
---
### Visualizing Market Depth: The Depth Chart and Cumulative Volume
To synthesize thousands of individual limit orders into an intuitive format, crypto exchanges offer visual market depth charts. A depth chart plots price on the horizontal axis (X-axis) and cumulative volume on the vertical axis (Y-axis).
- **The Bid Wall (Green Curve):** Accumulates buy orders as the price moves downward from the current market price.
- **The Ask Wall (Red Curve):** Accumulates sell orders as the price moves upward from the current market price.
The slope of these curves visually communicates market resilience. A steep curve indicates a concentration of heavy orders within a narrow price range—meaning a large volume must be traded to move the price beyond that level. A gentle, flat slope indicates thin liquidity, where even small buy or sell orders can push the price significantly higher or lower.
#### Practical Example: Order Book Slippage
To understand why market depth matters, consider a hypothetical order book for Ethereum:
- Current Best Ask: $3,500 (Available quantity: 2 Ethereum)
- Next Ask Level: $3,505 (Available quantity: 3 Ethereum)
- Next Ask Level: $3,510 (Available quantity: 5 Ethereum)
- Next Ask Level: $3,520 (Available quantity: 10 Ethereum)
Now, imagine a trader places a **market buy order** for 8 Ethereum.
Because a market order demands immediate execution at the best available prices, it sweeps through the order book sequentially:
- The first 2 Ethereum are purchased at $3,500.
- The next 3 Ethereum are purchased at $3,505.
- The remaining 3 Ethereum are purchased at $3,510.
The average purchase price for this trader is approximately $3,505.62 per Ethereum, rather than the initial $3,500 ticker price. The difference between expected execution price and actual execution price is called **slippage**. Without analyzing market depth before submitting the order, the trader would suffer unexpected execution drag.
---
### Order Book Dynamics: Spotting Manipulation and Order Book Illusions
While market depth provides valuable visibility, order books are dynamic, fast-changing, and occasionally deceptive. Advanced traders use various strategies to manage their footprints or manipulate retail perception.
#### 1. "Buy Walls" and "Sell Walls"
A sudden, massive block of buy orders placed at a specific price level creates a visual "buy wall." Retail traders often interpret a large buy wall as strong support, assuming an institutional buyer is floor-pricing the asset. Conversely, a large "sell wall" can intimidate buyers into selling early.
However, order book entries are non-binding until filled. Traders can cancel limit orders instantly before the price reaches them.
#### 2. Spoofing
Spoofing occurs when a malicious trader places large fake limit orders with no intention of letting them execute. The goal is to artificially create the illusion of heavy demand or supply, prompting other traders to buy or sell. Once market participants push the price in the desired direction, the spoofer cancels their large order and profits from a smaller position placed on the opposite side.
#### 3. Iceberg Orders
Institutional participants trading large volumes rarely place their full order on the public book at once, as doing so would drastically move the market against them. Instead, they use "iceberg orders." An iceberg order divides a massive trade into smaller limit orders, exposing only a tiny fraction (the tip of the iceberg) to the public order book at any given time. As soon as one visible piece fills, another automatically replenishes.
---
### Risks and Limitations of Relying Solely on Market Depth
While analyzing market depth is superior to trading blindly based on single price points, it is far from infallible. Traders must account for several structural limitations:
- **High-Frequency Trading (HFT) and Algorithmic Speed:** Algorithmic trading software can modify or cancel hundreds of order book entries within milliseconds. The depth you see on your screen may vanish the instant a real market order arrives.
- **Over-the-Counter (OTC) Trading:** Massive institutional trades are rarely conducted directly on public order books. They frequently occur off-exchange via OTC desks to avoid market impact. Consequently, order book depth does not reflect total institutional inventory or interest.
- **Venue Fragmentation:** Crypto markets operate across dozens of major global exchanges simultaneously. Deep liquidity on one exchange does not guarantee liquidity on another. Price imbalances can lead to cross-venue arbitrage, changing depth rapidly across multiple platforms.
- **Sudden Illiquidity During Crises:** In periods of extreme macroeconomic stress or market panic, liquidity providers often withdraw their limit orders altogether to avoid toxic flow. This can cause order books to empty in seconds, resulting in severe price gap-downs or flash crashes.
---
### Key Takeaways for Traders
Analyzing market depth equips intermediate crypto traders with a more grounded, realistic perspective on price movement and execution cost.
1. **Calculate Price Impact Before Order Submission:** For significant position sizes, always review the available depth to estimate slippage before choosing a market order over a limit order.
2. **Treat Order Book Walls with Skepticism:** Do not assume large bid or ask walls represent firm, guaranteed support or resistance. Verify whether orders hold firm as price approaches them.
3. **Combine Depth Analysis with Other Indicators:** Market depth shows short-term order placement, but it should be cross-referenced with volume profile analysis, macro trends, and overall market structure for sound risk management.
Market depth analysis is not a shortcut to predicting exact price targets, nor does it guarantee profitable outcomes. Crypto trading inherently involves high risk and price volatility. However, understanding order book mechanics helps you execute trades more efficiently, protect your capital against hidden execution costs, and navigate complex market environments with clarity.
#CryptoTrading #MarketDepth #OrderBook
102
Understanding Market Depth: How to Read Order Books and Avoid Hidden SlippageWhen analyzing cryptocurrency markets, most traders focus almost exclusively on price charts. Candlestick patterns, moving averages, and technical indicators dominate trading screens across the crypto ecosystem. However, a traditional price chart only displays historical execution data—it shows where the market price has been, not necessarily how easily that price can move in the future.
To understand the structural environment surrounding an asset's price, traders must look beyond past chart history and examine market depth. Market depth provides a real-time view of the order book, revealing the underlying supply and demand waiting to be filled at various price levels. By understanding market depth, intermediate traders can better evaluate price stability, minimize slippage during execution, and avoid common order book traps across volatile crypto markets.
---
### 1. The Core Components: Order Books and Spreads
Market depth is derived directly from an exchange’s Central Limit Order Book (CLOB). The order book aggregates all active, unexecuted limit orders submitted by market participants. To read market depth effectively, one must first understand its fundamental building blocks:
- **Bids (Buy Orders):** Bids represent buyers who have placed limit orders specifying the maximum price they are willing to pay for an asset. Bids sit below the current prevailing price and are ranked from highest price to lowest price.
- **Asks / Offers (Sell Orders):** Asks represent sellers who have placed limit orders specifying the minimum price they are willing to accept. Asks sit above the current prevailing price and are ranked from lowest price to highest price.
- **The Bid-Ask Spread:** This is the gap between the highest bid price and the lowest ask price. In highly liquid crypto assets like Bitcoin or Ethereum, this spread is typically micro-thin. In low-liquidity altcoins or during periods of extreme volatility, the bid-ask spread can widen significantly.
Market participants interact with this system in two ways. **Market makers** provide liquidity by placing limit orders on both sides of the book, deepening market depth and earning the spread. **Market takers** consume liquidity by placing market orders that execute instantly against those existing limit orders.
---
### 2. Reading the Depth Chart
Most exchange platforms offer a visual representation of market depth alongside the order book. This display, known as a depth chart, plots cumulative buy and sell volume against price.
A typical depth chart consists of two opposing slopes:
- **The Green Line/Slope (Bid Side):** Visualizes cumulative buy volume extending downward from the best bid price.
- **The Red Line/Slope (Ask Side):** Visualizes cumulative sell volume extending upward from the best ask price.
The vertical axis (Y-axis) represents cumulative order volume, while the horizontal axis (X-axis) represents asset price.
#### Identifying Support and Resistance "Walls"
When viewing a depth chart, you may notice abrupt, steep vertical jumps in either slope. These visual barriers are known as **buy walls** or **sell walls**.
- **Buy Wall:** A steep vertical rise on the green side indicates a heavy concentration of purchase orders at a specific price level. This concentration suggests strong potential buying support, as the market price cannot drop past that point until every order in the wall is fully filled.
- **Sell Wall:** A steep vertical rise on the red side indicates a massive aggregation of sell limit orders at a specific price level. This creates potential overhead resistance, as price cannot advance further until buyers consume all available volume at that target price.
---
### 3. Slippage and Execution Quality: A Practical Example
Market depth directly determines the amount of **slippage** a trader experiences when entering or exiting a position. Slippage occurs when a market order is larger than the volume available at the top bid or ask price, forcing the remaining order to fill at progressively worse prices deeper in the order book.
Consider a practical example with a hypothetical mid-cap cryptocurrency trading at a quoted market price of $10.00.
Suppose the sell (ask) side of the order book is structured as follows:
- **Tier 1:** 1,000 units available at $10.00
- **Tier 2:** 2,000 units available at $10.20
- **Tier 3:** 5,000 units available at $10.50
If an intermediate trader submits a market buy order for $50,000 worth of this asset, expecting an entry price of exactly $10.00, the trade will sweep through multiple price tiers due to insufficient depth at the top ask:
1. The first $10,000 executes against Tier 1, buying **1,000 units at $10.00**.
2. The next $20,400 executes against Tier 2, buying **2,000 units at $10.20**.
3. The remaining $19,600 executes against Tier 3, buying **1,866.6 units at $10.50**.
**Outcome:**
- **Total units acquired:** ~4,866.6 units
- **Total capital spent:** $50,000
- **Average execution price:** ~$10.27 per unit
Despite the initial quoted market price being $10.00, thin market depth resulted in an average execution price of $10.27—a **2.7% negative slippage**. For larger trade sizes, failing to evaluate market depth prior to order placement can severely erode profit margins.
---
### 4. Evaluating Depth: The +/- 2% Depth Metric
To standardise how depth is measured across different platforms and assets, market analytics platforms frequently track **+2% Depth** and **-2% Depth**.
- **+2% Depth:** Measures the total value of sell limit orders resting within 2% above the current mid-price.
- **-2% Depth:** Measures the total value of buy limit orders resting within 2% below the current mid-price.
An asset displaying $10 million in 2% depth can absorb significant market orders with minimal price impact. Conversely, an asset with only $50,000 in 2% depth will experience drastic price swings when even modest market orders hit the order book.
---
### 5. Risks, Limitations, and Spoofing
While market depth provides invaluable real-time data, relying solely on static order book visualizations presents distinct risks. Experienced traders must account for several structural limitations:
#### Order Book Spoofing
Spoofing is a form of deceptive order manipulation. Large traders or automated bots may place massive limit orders (creating false buy or sell walls) without any intention of letting them execute. These artificial walls trick retail participants into believing strong support or resistance exists. Once the price approaches the wall, the manipulator cancels the order, leaving unsuspecting traders exposed.
#### Iceberg Orders
Institutional traders frequently use **iceberg orders** to hide their true size. An iceberg order breaks a massive trade into smaller visible chunks. An order book may show a visible sell limit of only 5 units, but as soon as those 5 units are bought, another 5 units automatically replenish at the same price until a hidden order of 500 units is completed.
#### Phantom Liquidity in Panic Events
During periods of sharp macro news or rapid market liquidation, market makers often automatically pause their algorithms and cancel limit orders to mitigate inventory risk. As a result, market depth can instantly vanish, leading to rapid price cascades or flash crashes.
---
### 6. Best Practices for Crypto Traders
To incorporate market depth into a balanced execution framework:
1. **Use Limit Orders in Low-Depth Markets:** When trading assets with thin order books, prioritize limit orders over market orders to retain full control over execution price.
2. **Break Up Large Orders:** If executing a sizable position, utilize algorithmic tools like TWAP (Time-Weighted Average Price) or spread executions into smaller tranches over time to prevent moving the order book against yourself.
3. **Cross-Reference Volume Profile:** Compare visible limit order walls against historical Volume Profile (VPVR) levels to confirm whether support or resistance levels reflect real historical trading activity rather than transient order book placement.
---
### Summary
Market depth serves as a fundamental metric for evaluating asset liquidity and market resilience. By reading order books critically, accounting for slippage, and recognizing order book manipulation like spoofing, intermediate traders can significantly improve execution efficiency and navigate volatile crypto market structure with greater precision.
#CryptoEducation #MarketDepth #TradingStrategy
Understanding Market Depth: How to Read Order Books and Avoid Hidden Slippage
When analyzing cryptocurrency markets, most traders focus almost exclusively on price charts. Candlestick patterns, moving averages, and technical indicators dominate trading screens across the crypto ecosystem. However, a traditional price chart only displays historical execution data—it shows where the market price has been, not necessarily how easily that price can move in the future.
To understand the structural environment surrounding an asset's price, traders must look beyond past chart history and examine market depth. Market depth provides a real-time view of the order book, revealing the underlying supply and demand waiting to be filled at various price levels. By understanding market depth, intermediate traders can better evaluate price stability, minimize slippage during execution, and avoid common order book traps across volatile crypto markets.
---
### 1. The Core Components: Order Books and Spreads
Market depth is derived directly from an exchange’s Central Limit Order Book (CLOB). The order book aggregates all active, unexecuted limit orders submitted by market participants. To read market depth effectively, one must first understand its fundamental building blocks:
- **Bids (Buy Orders):** Bids represent buyers who have placed limit orders specifying the maximum price they are willing to pay for an asset. Bids sit below the current prevailing price and are ranked from highest price to lowest price.
- **Asks / Offers (Sell Orders):** Asks represent sellers who have placed limit orders specifying the minimum price they are willing to accept. Asks sit above the current prevailing price and are ranked from lowest price to highest price.
- **The Bid-Ask Spread:** This is the gap between the highest bid price and the lowest ask price. In highly liquid crypto assets like Bitcoin or Ethereum, this spread is typically micro-thin. In low-liquidity altcoins or during periods of extreme volatility, the bid-ask spread can widen significantly.
Market participants interact with this system in two ways. **Market makers** provide liquidity by placing limit orders on both sides of the book, deepening market depth and earning the spread. **Market takers** consume liquidity by placing market orders that execute instantly against those existing limit orders.
---
### 2. Reading the Depth Chart
Most exchange platforms offer a visual representation of market depth alongside the order book. This display, known as a depth chart, plots cumulative buy and sell volume against price.
A typical depth chart consists of two opposing slopes:
- **The Green Line/Slope (Bid Side):** Visualizes cumulative buy volume extending downward from the best bid price.
- **The Red Line/Slope (Ask Side):** Visualizes cumulative sell volume extending upward from the best ask price.
The vertical axis (Y-axis) represents cumulative order volume, while the horizontal axis (X-axis) represents asset price.
#### Identifying Support and Resistance "Walls"
When viewing a depth chart, you may notice abrupt, steep vertical jumps in either slope. These visual barriers are known as **buy walls** or **sell walls**.
- **Buy Wall:** A steep vertical rise on the green side indicates a heavy concentration of purchase orders at a specific price level. This concentration suggests strong potential buying support, as the market price cannot drop past that point until every order in the wall is fully filled.
- **Sell Wall:** A steep vertical rise on the red side indicates a massive aggregation of sell limit orders at a specific price level. This creates potential overhead resistance, as price cannot advance further until buyers consume all available volume at that target price.
---
### 3. Slippage and Execution Quality: A Practical Example
Market depth directly determines the amount of **slippage** a trader experiences when entering or exiting a position. Slippage occurs when a market order is larger than the volume available at the top bid or ask price, forcing the remaining order to fill at progressively worse prices deeper in the order book.
Consider a practical example with a hypothetical mid-cap cryptocurrency trading at a quoted market price of $10.00.
Suppose the sell (ask) side of the order book is structured as follows:
- **Tier 1:** 1,000 units available at $10.00
- **Tier 2:** 2,000 units available at $10.20
- **Tier 3:** 5,000 units available at $10.50
If an intermediate trader submits a market buy order for $50,000 worth of this asset, expecting an entry price of exactly $10.00, the trade will sweep through multiple price tiers due to insufficient depth at the top ask:
1. The first $10,000 executes against Tier 1, buying **1,000 units at $10.00**.
2. The next $20,400 executes against Tier 2, buying **2,000 units at $10.20**.
3. The remaining $19,600 executes against Tier 3, buying **1,866.6 units at $10.50**.
**Outcome:**
- **Total units acquired:** ~4,866.6 units
- **Total capital spent:** $50,000
- **Average execution price:** ~$10.27 per unit
Despite the initial quoted market price being $10.00, thin market depth resulted in an average execution price of $10.27—a **2.7% negative slippage**. For larger trade sizes, failing to evaluate market depth prior to order placement can severely erode profit margins.
---
### 4. Evaluating Depth: The +/- 2% Depth Metric
To standardise how depth is measured across different platforms and assets, market analytics platforms frequently track **+2% Depth** and **-2% Depth**.
- **+2% Depth:** Measures the total value of sell limit orders resting within 2% above the current mid-price.
- **-2% Depth:** Measures the total value of buy limit orders resting within 2% below the current mid-price.
An asset displaying $10 million in 2% depth can absorb significant market orders with minimal price impact. Conversely, an asset with only $50,000 in 2% depth will experience drastic price swings when even modest market orders hit the order book.
---
### 5. Risks, Limitations, and Spoofing
While market depth provides invaluable real-time data, relying solely on static order book visualizations presents distinct risks. Experienced traders must account for several structural limitations:
#### Order Book Spoofing
Spoofing is a form of deceptive order manipulation. Large traders or automated bots may place massive limit orders (creating false buy or sell walls) without any intention of letting them execute. These artificial walls trick retail participants into believing strong support or resistance exists. Once the price approaches the wall, the manipulator cancels the order, leaving unsuspecting traders exposed.
#### Iceberg Orders
Institutional traders frequently use **iceberg orders** to hide their true size. An iceberg order breaks a massive trade into smaller visible chunks. An order book may show a visible sell limit of only 5 units, but as soon as those 5 units are bought, another 5 units automatically replenish at the same price until a hidden order of 500 units is completed.
#### Phantom Liquidity in Panic Events
During periods of sharp macro news or rapid market liquidation, market makers often automatically pause their algorithms and cancel limit orders to mitigate inventory risk. As a result, market depth can instantly vanish, leading to rapid price cascades or flash crashes.
---
### 6. Best Practices for Crypto Traders
To incorporate market depth into a balanced execution framework:
1. **Use Limit Orders in Low-Depth Markets:** When trading assets with thin order books, prioritize limit orders over market orders to retain full control over execution price.
2. **Break Up Large Orders:** If executing a sizable position, utilize algorithmic tools like TWAP (Time-Weighted Average Price) or spread executions into smaller tranches over time to prevent moving the order book against yourself.
3. **Cross-Reference Volume Profile:** Compare visible limit order walls against historical Volume Profile (VPVR) levels to confirm whether support or resistance levels reflect real historical trading activity rather than transient order book placement.
---
### Summary
Market depth serves as a fundamental metric for evaluating asset liquidity and market resilience. By reading order books critically, accounting for slippage, and recognizing order book manipulation like spoofing, intermediate traders can significantly improve execution efficiency and navigate volatile crypto market structure with greater precision.
#CryptoEducation #MarketDepth #TradingStrategy
To understand the structural environment surrounding an asset's price, traders must look beyond past chart history and examine market depth. Market depth provides a real-time view of the order book, revealing the underlying supply and demand waiting to be filled at various price levels. By understanding market depth, intermediate traders can better evaluate price stability, minimize slippage during execution, and avoid common order book traps across volatile crypto markets.
---
### 1. The Core Components: Order Books and Spreads
Market depth is derived directly from an exchange’s Central Limit Order Book (CLOB). The order book aggregates all active, unexecuted limit orders submitted by market participants. To read market depth effectively, one must first understand its fundamental building blocks:
- **Bids (Buy Orders):** Bids represent buyers who have placed limit orders specifying the maximum price they are willing to pay for an asset. Bids sit below the current prevailing price and are ranked from highest price to lowest price.
- **Asks / Offers (Sell Orders):** Asks represent sellers who have placed limit orders specifying the minimum price they are willing to accept. Asks sit above the current prevailing price and are ranked from lowest price to highest price.
- **The Bid-Ask Spread:** This is the gap between the highest bid price and the lowest ask price. In highly liquid crypto assets like Bitcoin or Ethereum, this spread is typically micro-thin. In low-liquidity altcoins or during periods of extreme volatility, the bid-ask spread can widen significantly.
Market participants interact with this system in two ways. **Market makers** provide liquidity by placing limit orders on both sides of the book, deepening market depth and earning the spread. **Market takers** consume liquidity by placing market orders that execute instantly against those existing limit orders.
---
### 2. Reading the Depth Chart
Most exchange platforms offer a visual representation of market depth alongside the order book. This display, known as a depth chart, plots cumulative buy and sell volume against price.
A typical depth chart consists of two opposing slopes:
- **The Green Line/Slope (Bid Side):** Visualizes cumulative buy volume extending downward from the best bid price.
- **The Red Line/Slope (Ask Side):** Visualizes cumulative sell volume extending upward from the best ask price.
The vertical axis (Y-axis) represents cumulative order volume, while the horizontal axis (X-axis) represents asset price.
#### Identifying Support and Resistance "Walls"
When viewing a depth chart, you may notice abrupt, steep vertical jumps in either slope. These visual barriers are known as **buy walls** or **sell walls**.
- **Buy Wall:** A steep vertical rise on the green side indicates a heavy concentration of purchase orders at a specific price level. This concentration suggests strong potential buying support, as the market price cannot drop past that point until every order in the wall is fully filled.
- **Sell Wall:** A steep vertical rise on the red side indicates a massive aggregation of sell limit orders at a specific price level. This creates potential overhead resistance, as price cannot advance further until buyers consume all available volume at that target price.
---
### 3. Slippage and Execution Quality: A Practical Example
Market depth directly determines the amount of **slippage** a trader experiences when entering or exiting a position. Slippage occurs when a market order is larger than the volume available at the top bid or ask price, forcing the remaining order to fill at progressively worse prices deeper in the order book.
Consider a practical example with a hypothetical mid-cap cryptocurrency trading at a quoted market price of $10.00.
Suppose the sell (ask) side of the order book is structured as follows:
- **Tier 1:** 1,000 units available at $10.00
- **Tier 2:** 2,000 units available at $10.20
- **Tier 3:** 5,000 units available at $10.50
If an intermediate trader submits a market buy order for $50,000 worth of this asset, expecting an entry price of exactly $10.00, the trade will sweep through multiple price tiers due to insufficient depth at the top ask:
1. The first $10,000 executes against Tier 1, buying **1,000 units at $10.00**.
2. The next $20,400 executes against Tier 2, buying **2,000 units at $10.20**.
3. The remaining $19,600 executes against Tier 3, buying **1,866.6 units at $10.50**.
**Outcome:**
- **Total units acquired:** ~4,866.6 units
- **Total capital spent:** $50,000
- **Average execution price:** ~$10.27 per unit
Despite the initial quoted market price being $10.00, thin market depth resulted in an average execution price of $10.27—a **2.7% negative slippage**. For larger trade sizes, failing to evaluate market depth prior to order placement can severely erode profit margins.
---
### 4. Evaluating Depth: The +/- 2% Depth Metric
To standardise how depth is measured across different platforms and assets, market analytics platforms frequently track **+2% Depth** and **-2% Depth**.
- **+2% Depth:** Measures the total value of sell limit orders resting within 2% above the current mid-price.
- **-2% Depth:** Measures the total value of buy limit orders resting within 2% below the current mid-price.
An asset displaying $10 million in 2% depth can absorb significant market orders with minimal price impact. Conversely, an asset with only $50,000 in 2% depth will experience drastic price swings when even modest market orders hit the order book.
---
### 5. Risks, Limitations, and Spoofing
While market depth provides invaluable real-time data, relying solely on static order book visualizations presents distinct risks. Experienced traders must account for several structural limitations:
#### Order Book Spoofing
Spoofing is a form of deceptive order manipulation. Large traders or automated bots may place massive limit orders (creating false buy or sell walls) without any intention of letting them execute. These artificial walls trick retail participants into believing strong support or resistance exists. Once the price approaches the wall, the manipulator cancels the order, leaving unsuspecting traders exposed.
#### Iceberg Orders
Institutional traders frequently use **iceberg orders** to hide their true size. An iceberg order breaks a massive trade into smaller visible chunks. An order book may show a visible sell limit of only 5 units, but as soon as those 5 units are bought, another 5 units automatically replenish at the same price until a hidden order of 500 units is completed.
#### Phantom Liquidity in Panic Events
During periods of sharp macro news or rapid market liquidation, market makers often automatically pause their algorithms and cancel limit orders to mitigate inventory risk. As a result, market depth can instantly vanish, leading to rapid price cascades or flash crashes.
---
### 6. Best Practices for Crypto Traders
To incorporate market depth into a balanced execution framework:
1. **Use Limit Orders in Low-Depth Markets:** When trading assets with thin order books, prioritize limit orders over market orders to retain full control over execution price.
2. **Break Up Large Orders:** If executing a sizable position, utilize algorithmic tools like TWAP (Time-Weighted Average Price) or spread executions into smaller tranches over time to prevent moving the order book against yourself.
3. **Cross-Reference Volume Profile:** Compare visible limit order walls against historical Volume Profile (VPVR) levels to confirm whether support or resistance levels reflect real historical trading activity rather than transient order book placement.
---
### Summary
Market depth serves as a fundamental metric for evaluating asset liquidity and market resilience. By reading order books critically, accounting for slippage, and recognizing order book manipulation like spoofing, intermediate traders can significantly improve execution efficiency and navigate volatile crypto market structure with greater precision.
#CryptoEducation #MarketDepth #TradingStrategy
85
Demystifying Market Depth: How to Read Crypto Order Books for Better ExecutionWhen most market participants begin their cryptocurrency journey, their attention is usually captivated by line and candlestick price charts. While price charts provide an excellent historical context of where an asset has been, they reveal very little about the immediate mechanical environment in which trades are executed. To understand why prices move the way they do in real time, intermediate traders must look beneath the surface and examine market depth.
Market depth represents an exchange’s ability to sustain large market orders without causing significant price fluctuations. It is a real-time visualization of open limit orders placed by buyers and sellers across a range of price levels. Understanding market depth allows traders to gauge immediate supply and demand, evaluate execution risks, and avoid costly trading mistakes like excessive slippage.
---
### The Architecture of the Order Book
At the core of market depth lies the continuous double auction system, commonly known as the order book. An order book is organized into two primary sides:
1. **Bids (Buy Side):** A collection of limit buy orders placed by market participants wishing to purchase an asset. Bids are ranked from the highest price a buyer is willing to pay down to progressively lower prices.
2. **Asks or Offers (Sell Side):** A collection of limit sell orders placed by participants seeking to sell an asset. Asks are ranked from the lowest price a seller is willing to accept up to progressively higher prices.
The highest bid price and the lowest ask price represent the best available execution points on the market. The difference between these two values is called the **bid-ask spread**.
In highly liquid markets with deep order books—such as major trading pairs for Bitcoin or Ethereum—the bid-ask spread is typically extremely tight, often representing fractions of a cent or a fraction of a percentage point. Conversely, in low-liquidity assets or during periods of extreme volatility, the spread widens significantly. A wide spread is an immediate red flag for traders, indicating that acquiring or exiting a position will come with higher immediate costs.
---
### Reading the Market Depth Chart
Most major exchanges provide a visual representation of order book data known as the **Market Depth Chart**. This chart plots cumulative order volume on the vertical axis against price levels on the horizontal axis.
- **The Green Slope (Bid Side):** Located on the left side of the chart, this curve illustrates the cumulative quantity of buy orders down to lower price levels.
- **The Red Slope (Ask Side):** Located on the right side of the chart, this curve shows the cumulative quantity of sell orders up to higher price levels.
#### Identifying Order Walls
When looking at a depth chart, you will frequently notice sharp, vertical jumps in the slopes, commonly referred to as "buy walls" or "sell walls."
- A **buy wall** occurs when an exceptionally large quantity of buy limit orders is concentrated at a specific price level (e.g., a round psychological level like $50,000 for Bitcoin or $3,000 for Ethereum). A massive buy wall can act as temporary structural support because incoming market sell orders must completely fill that entire volume before the price can drop to lower levels.
- A **sell wall** represents a large concentration of limit sell orders at a given price level. This acts as temporary resistance, as incoming market buy orders must consume all the volume resting at that price before the market can trend higher.
---
### Practical Example: The Mechanics of Slippage
To understand why market depth matters, let us analyze a practical trading scenario involving a hypothetical asset named Asset X.
Suppose Asset X is currently trading with a top bid of $100.00 and a top ask of $100.10. An inexperienced trader decides to execute a market buy order for 1,000 units of Asset X, assuming the entire purchase will execute near the market price of $100.10.
However, the order book depth reveals the following resting ask orders:
- **Level 1:** 200 units available at $100.10
- **Level 2:** 300 units available at $100.50
- **Level 3:** 500 units available at $101.50
Because a market order demands immediate execution regardless of price, the engine sweeps through the ask levels:
1. Fills 200 units at $100.10 (Cost: $20,020)
2. Fills 300 units at $100.50 (Cost: $30,150)
3. Fills 500 units at $101.50 (Cost: $50,750)
The total cost for 1,000 units is $100,920, making the **average execution price $100.92 per unit**.
The trader experienced 0.82% of **slippage**—the difference between the expected price ($100.10) and the actual average execution price ($100.92). In markets with shallow depth, execution slippage can easily reach several percentage points, turning an otherwise sound trade setup into an unprofitable endeavor.
---
### Order Book Dynamics: Illusions and Manipulation
While market depth provides valuable real-time data, intermediate traders must remain aware that order books are dynamic and subject to strategic maneuvers by high-frequency traders, market makers, and institutional players.
#### 1. Spoofing and Phantom Liquidity
Not all visible orders are intended to be executed. **Spoofing** is a manipulative tactic where large traders place non-bona fide limit orders (e.g., massive buy walls) to create a false impression of market demand or support. The goal is to induce retail traders into buying. Just as the price approaches the wall, the spoofer cancels the order, leaving smaller traders holding assets without real underlying support.
#### 2. Iceberg Orders
To minimize market impact, institutional traders rarely place massive orders all at once. Instead, they utilize **iceberg orders**—algorithmic orders that split a massive total size into smaller visible limit orders. Once a visible tranche is filled, the algorithm automatically places the next chunk. Consequently, a level that appears to have low volume on the order book may actually conceal substantial underlying supply or demand.
#### 3. Automated Liquidity Withdrawal
In times of macro economic news releases or extreme market shocks, automated market-making bots frequently withdraw their limit orders instantly to manage risk. This causes market depth to vaporize in milliseconds, leading to severe price gaps and extreme volatility.
---
### Tactical Applications for Intermediate Traders
Understanding order book depth can materially improve your operational trading discipline:
- **Optimize Order Execution Types:** If you notice that an asset's market depth is thin relative to your planned position size, avoid using raw market orders. Instead, utilize limit orders, post-only orders, or TWAP (Time-Weighted Average Price) algorithms to scale into positions over time.
- **Identify Logical Stop-Loss Placement:** Placing stop-loss orders directly above or below high-density order book clusters can lead to predictable liquidity hunts. Setting stops slightly beyond major liquidity zones—where true invalidation occurs—helps avoid premature stop-outs.
- **Cross-Exchange Awareness:** Liquidity in crypto is fragmented across centralized exchanges and decentralized automated market makers (AMMs). Checking order book depth across multiple venues can help high-volume traders route orders to the platform offering the lowest price impact.
---
### Limitations and Risk Warnings
While evaluating market depth provides a clear edge in execution quality, it is not a standalone system for predicting long-term price movement. Order book depth is inherently volatile and changes constantly as orders are added, modified, and canceled every millisecond.
Relying solely on visual walls without considering broader technical analysis, fundamental developments, and macro market conditions can lead to misinterpreting temporary market positioning as strong trend confirmation. Always incorporate strict risk management, appropriate position sizing, and proper stop-loss parameters into every trade. No trading methodology guarantees profitability, and market participants must always account for execution hazards, platform latency, and systemic volatility.
#CryptoEducation #MarketDepth #TradingStrategy
Demystifying Market Depth: How to Read Crypto Order Books for Better Execution
When most market participants begin their cryptocurrency journey, their attention is usually captivated by line and candlestick price charts. While price charts provide an excellent historical context of where an asset has been, they reveal very little about the immediate mechanical environment in which trades are executed. To understand why prices move the way they do in real time, intermediate traders must look beneath the surface and examine market depth.
Market depth represents an exchange’s ability to sustain large market orders without causing significant price fluctuations. It is a real-time visualization of open limit orders placed by buyers and sellers across a range of price levels. Understanding market depth allows traders to gauge immediate supply and demand, evaluate execution risks, and avoid costly trading mistakes like excessive slippage.
---
### The Architecture of the Order Book
At the core of market depth lies the continuous double auction system, commonly known as the order book. An order book is organized into two primary sides:
1. **Bids (Buy Side):** A collection of limit buy orders placed by market participants wishing to purchase an asset. Bids are ranked from the highest price a buyer is willing to pay down to progressively lower prices.
2. **Asks or Offers (Sell Side):** A collection of limit sell orders placed by participants seeking to sell an asset. Asks are ranked from the lowest price a seller is willing to accept up to progressively higher prices.
The highest bid price and the lowest ask price represent the best available execution points on the market. The difference between these two values is called the **bid-ask spread**.
In highly liquid markets with deep order books—such as major trading pairs for Bitcoin or Ethereum—the bid-ask spread is typically extremely tight, often representing fractions of a cent or a fraction of a percentage point. Conversely, in low-liquidity assets or during periods of extreme volatility, the spread widens significantly. A wide spread is an immediate red flag for traders, indicating that acquiring or exiting a position will come with higher immediate costs.
---
### Reading the Market Depth Chart
Most major exchanges provide a visual representation of order book data known as the **Market Depth Chart**. This chart plots cumulative order volume on the vertical axis against price levels on the horizontal axis.
- **The Green Slope (Bid Side):** Located on the left side of the chart, this curve illustrates the cumulative quantity of buy orders down to lower price levels.
- **The Red Slope (Ask Side):** Located on the right side of the chart, this curve shows the cumulative quantity of sell orders up to higher price levels.
#### Identifying Order Walls
When looking at a depth chart, you will frequently notice sharp, vertical jumps in the slopes, commonly referred to as "buy walls" or "sell walls."
- A **buy wall** occurs when an exceptionally large quantity of buy limit orders is concentrated at a specific price level (e.g., a round psychological level like $50,000 for Bitcoin or $3,000 for Ethereum). A massive buy wall can act as temporary structural support because incoming market sell orders must completely fill that entire volume before the price can drop to lower levels.
- A **sell wall** represents a large concentration of limit sell orders at a given price level. This acts as temporary resistance, as incoming market buy orders must consume all the volume resting at that price before the market can trend higher.
---
### Practical Example: The Mechanics of Slippage
To understand why market depth matters, let us analyze a practical trading scenario involving a hypothetical asset named Asset X.
Suppose Asset X is currently trading with a top bid of $100.00 and a top ask of $100.10. An inexperienced trader decides to execute a market buy order for 1,000 units of Asset X, assuming the entire purchase will execute near the market price of $100.10.
However, the order book depth reveals the following resting ask orders:
- **Level 1:** 200 units available at $100.10
- **Level 2:** 300 units available at $100.50
- **Level 3:** 500 units available at $101.50
Because a market order demands immediate execution regardless of price, the engine sweeps through the ask levels:
1. Fills 200 units at $100.10 (Cost: $20,020)
2. Fills 300 units at $100.50 (Cost: $30,150)
3. Fills 500 units at $101.50 (Cost: $50,750)
The total cost for 1,000 units is $100,920, making the **average execution price $100.92 per unit**.
The trader experienced 0.82% of **slippage**—the difference between the expected price ($100.10) and the actual average execution price ($100.92). In markets with shallow depth, execution slippage can easily reach several percentage points, turning an otherwise sound trade setup into an unprofitable endeavor.
---
### Order Book Dynamics: Illusions and Manipulation
While market depth provides valuable real-time data, intermediate traders must remain aware that order books are dynamic and subject to strategic maneuvers by high-frequency traders, market makers, and institutional players.
#### 1. Spoofing and Phantom Liquidity
Not all visible orders are intended to be executed. **Spoofing** is a manipulative tactic where large traders place non-bona fide limit orders (e.g., massive buy walls) to create a false impression of market demand or support. The goal is to induce retail traders into buying. Just as the price approaches the wall, the spoofer cancels the order, leaving smaller traders holding assets without real underlying support.
#### 2. Iceberg Orders
To minimize market impact, institutional traders rarely place massive orders all at once. Instead, they utilize **iceberg orders**—algorithmic orders that split a massive total size into smaller visible limit orders. Once a visible tranche is filled, the algorithm automatically places the next chunk. Consequently, a level that appears to have low volume on the order book may actually conceal substantial underlying supply or demand.
#### 3. Automated Liquidity Withdrawal
In times of macro economic news releases or extreme market shocks, automated market-making bots frequently withdraw their limit orders instantly to manage risk. This causes market depth to vaporize in milliseconds, leading to severe price gaps and extreme volatility.
---
### Tactical Applications for Intermediate Traders
Understanding order book depth can materially improve your operational trading discipline:
- **Optimize Order Execution Types:** If you notice that an asset's market depth is thin relative to your planned position size, avoid using raw market orders. Instead, utilize limit orders, post-only orders, or TWAP (Time-Weighted Average Price) algorithms to scale into positions over time.
- **Identify Logical Stop-Loss Placement:** Placing stop-loss orders directly above or below high-density order book clusters can lead to predictable liquidity hunts. Setting stops slightly beyond major liquidity zones—where true invalidation occurs—helps avoid premature stop-outs.
- **Cross-Exchange Awareness:** Liquidity in crypto is fragmented across centralized exchanges and decentralized automated market makers (AMMs). Checking order book depth across multiple venues can help high-volume traders route orders to the platform offering the lowest price impact.
---
### Limitations and Risk Warnings
While evaluating market depth provides a clear edge in execution quality, it is not a standalone system for predicting long-term price movement. Order book depth is inherently volatile and changes constantly as orders are added, modified, and canceled every millisecond.
Relying solely on visual walls without considering broader technical analysis, fundamental developments, and macro market conditions can lead to misinterpreting temporary market positioning as strong trend confirmation. Always incorporate strict risk management, appropriate position sizing, and proper stop-loss parameters into every trade. No trading methodology guarantees profitability, and market participants must always account for execution hazards, platform latency, and systemic volatility.
#CryptoEducation #MarketDepth #TradingStrategy
Market depth represents an exchange’s ability to sustain large market orders without causing significant price fluctuations. It is a real-time visualization of open limit orders placed by buyers and sellers across a range of price levels. Understanding market depth allows traders to gauge immediate supply and demand, evaluate execution risks, and avoid costly trading mistakes like excessive slippage.
---
### The Architecture of the Order Book
At the core of market depth lies the continuous double auction system, commonly known as the order book. An order book is organized into two primary sides:
1. **Bids (Buy Side):** A collection of limit buy orders placed by market participants wishing to purchase an asset. Bids are ranked from the highest price a buyer is willing to pay down to progressively lower prices.
2. **Asks or Offers (Sell Side):** A collection of limit sell orders placed by participants seeking to sell an asset. Asks are ranked from the lowest price a seller is willing to accept up to progressively higher prices.
The highest bid price and the lowest ask price represent the best available execution points on the market. The difference between these two values is called the **bid-ask spread**.
In highly liquid markets with deep order books—such as major trading pairs for Bitcoin or Ethereum—the bid-ask spread is typically extremely tight, often representing fractions of a cent or a fraction of a percentage point. Conversely, in low-liquidity assets or during periods of extreme volatility, the spread widens significantly. A wide spread is an immediate red flag for traders, indicating that acquiring or exiting a position will come with higher immediate costs.
---
### Reading the Market Depth Chart
Most major exchanges provide a visual representation of order book data known as the **Market Depth Chart**. This chart plots cumulative order volume on the vertical axis against price levels on the horizontal axis.
- **The Green Slope (Bid Side):** Located on the left side of the chart, this curve illustrates the cumulative quantity of buy orders down to lower price levels.
- **The Red Slope (Ask Side):** Located on the right side of the chart, this curve shows the cumulative quantity of sell orders up to higher price levels.
#### Identifying Order Walls
When looking at a depth chart, you will frequently notice sharp, vertical jumps in the slopes, commonly referred to as "buy walls" or "sell walls."
- A **buy wall** occurs when an exceptionally large quantity of buy limit orders is concentrated at a specific price level (e.g., a round psychological level like $50,000 for Bitcoin or $3,000 for Ethereum). A massive buy wall can act as temporary structural support because incoming market sell orders must completely fill that entire volume before the price can drop to lower levels.
- A **sell wall** represents a large concentration of limit sell orders at a given price level. This acts as temporary resistance, as incoming market buy orders must consume all the volume resting at that price before the market can trend higher.
---
### Practical Example: The Mechanics of Slippage
To understand why market depth matters, let us analyze a practical trading scenario involving a hypothetical asset named Asset X.
Suppose Asset X is currently trading with a top bid of $100.00 and a top ask of $100.10. An inexperienced trader decides to execute a market buy order for 1,000 units of Asset X, assuming the entire purchase will execute near the market price of $100.10.
However, the order book depth reveals the following resting ask orders:
- **Level 1:** 200 units available at $100.10
- **Level 2:** 300 units available at $100.50
- **Level 3:** 500 units available at $101.50
Because a market order demands immediate execution regardless of price, the engine sweeps through the ask levels:
1. Fills 200 units at $100.10 (Cost: $20,020)
2. Fills 300 units at $100.50 (Cost: $30,150)
3. Fills 500 units at $101.50 (Cost: $50,750)
The total cost for 1,000 units is $100,920, making the **average execution price $100.92 per unit**.
The trader experienced 0.82% of **slippage**—the difference between the expected price ($100.10) and the actual average execution price ($100.92). In markets with shallow depth, execution slippage can easily reach several percentage points, turning an otherwise sound trade setup into an unprofitable endeavor.
---
### Order Book Dynamics: Illusions and Manipulation
While market depth provides valuable real-time data, intermediate traders must remain aware that order books are dynamic and subject to strategic maneuvers by high-frequency traders, market makers, and institutional players.
#### 1. Spoofing and Phantom Liquidity
Not all visible orders are intended to be executed. **Spoofing** is a manipulative tactic where large traders place non-bona fide limit orders (e.g., massive buy walls) to create a false impression of market demand or support. The goal is to induce retail traders into buying. Just as the price approaches the wall, the spoofer cancels the order, leaving smaller traders holding assets without real underlying support.
#### 2. Iceberg Orders
To minimize market impact, institutional traders rarely place massive orders all at once. Instead, they utilize **iceberg orders**—algorithmic orders that split a massive total size into smaller visible limit orders. Once a visible tranche is filled, the algorithm automatically places the next chunk. Consequently, a level that appears to have low volume on the order book may actually conceal substantial underlying supply or demand.
#### 3. Automated Liquidity Withdrawal
In times of macro economic news releases or extreme market shocks, automated market-making bots frequently withdraw their limit orders instantly to manage risk. This causes market depth to vaporize in milliseconds, leading to severe price gaps and extreme volatility.
---
### Tactical Applications for Intermediate Traders
Understanding order book depth can materially improve your operational trading discipline:
- **Optimize Order Execution Types:** If you notice that an asset's market depth is thin relative to your planned position size, avoid using raw market orders. Instead, utilize limit orders, post-only orders, or TWAP (Time-Weighted Average Price) algorithms to scale into positions over time.
- **Identify Logical Stop-Loss Placement:** Placing stop-loss orders directly above or below high-density order book clusters can lead to predictable liquidity hunts. Setting stops slightly beyond major liquidity zones—where true invalidation occurs—helps avoid premature stop-outs.
- **Cross-Exchange Awareness:** Liquidity in crypto is fragmented across centralized exchanges and decentralized automated market makers (AMMs). Checking order book depth across multiple venues can help high-volume traders route orders to the platform offering the lowest price impact.
---
### Limitations and Risk Warnings
While evaluating market depth provides a clear edge in execution quality, it is not a standalone system for predicting long-term price movement. Order book depth is inherently volatile and changes constantly as orders are added, modified, and canceled every millisecond.
Relying solely on visual walls without considering broader technical analysis, fundamental developments, and macro market conditions can lead to misinterpreting temporary market positioning as strong trend confirmation. Always incorporate strict risk management, appropriate position sizing, and proper stop-loss parameters into every trade. No trading methodology guarantees profitability, and market participants must always account for execution hazards, platform latency, and systemic volatility.
#CryptoEducation #MarketDepth #TradingStrategy
103
Demystifying Market Depth: How to Read Liquidity Beyond Simple Trading VolumeWhen evaluating cryptocurrency markets, many intermediate traders rely heavily on two primary metrics: price action and 24-hour trading volume. While these indicators provide valuable insights into historical price trends and broad activity levels, they fail to reveal a critical component of market mechanics: present liquidity.
To understand how easily an asset can be bought or sold without triggering dramatic price shifts, traders must look beyond volume and analyze market depth.
Market depth represents a real-time visualization of open buy and sell orders at various price levels. Understanding market depth allows traders to gauge potential slippage, identify institutional order clusters, evaluate true support and resistance levels, and execute trades more efficiently.
---
### Understanding the Anatomy of Market Depth
At the core of market depth is the order book. An order book is a continuously updated ledger containing two main sides:
1. **Bids (Buy Orders):** Represent buyers offering to purchase an asset at specific prices below the current market price.
2. **Asks or Offers (Sell Orders):** Represent sellers offering to dispose of an asset at specific prices above the current market price.
Market depth aggregates these open limit orders to show the cumulative volume available at each incremental price point away from the midpoint (the average between the highest bid and lowest ask).
On most trading platforms, market depth is displayed either as a tabular order book or as a visual depth chart. A depth chart places price along the horizontal axis and cumulative volume along the vertical axis.
* The **green line/area** (bids) slopes upward toward the center, representing buy demand.
* The **red line/area** (asks) slopes upward away from the center, representing sell supply.
Where the bid and ask sides meet in the middle is the prevailing market price. The gap between the highest price a buyer is willing to pay and the lowest price a seller is willing to accept is known as the **bid-ask spread**.
---
### Market Depth vs. Trading Volume: A Crucial Distinction
It is common for developing traders to confuse trading volume with market depth, yet they measure fundamentally different aspects of the market:
* **Trading Volume** is a *retrospective* metric. It measures the total amount of an asset traded over a defined period (e.g., 24 hours). High volume indicates significant past activity, but it does not guarantee that liquidity remains in the order book right now.
* **Market Depth** is a *prospective* metric. It reflects the live, pending order environment. It tells you what will happen if a large order is placed immediately.
Consider a practical example: An illiquid altcoin might record $10 million in 24-hour volume due to a sudden localized trading frenzy. However, if the live order book only contains $5,000 worth of bid orders within 1% of the current market price, a market sell order of $20,000 will exhaust those bids and push the price down significantly. Despite the high historical volume, the market depth was shallow.
---
### How Market Depth Drives Order Execution and Slippage
Market depth directly determines the execution price of **market orders**. Unlike limit orders, which sit in the order book waiting to be filled at a specified price or better, market orders execute immediately against the best available orders in the book.
When a trader submits a market order that exceeds the volume available at the top bid or ask, the order "walks the book." This means it consumes liquidity at the best price tier, then fills the remaining portion at progressively worse price tiers until the entire order amount is filled.
#### Practical Example: Calculating Execution Slippage
Suppose Ethereum is trading at a mid-market price of $3,000. An institutional trader wants to execute a market buy order for 50 Ethereum.
The ask side of the order book looks like this:
* **Tier 1:** 10 Ethereum available at $3,000
* **Tier 2:** 15 Ethereum available at $3,005
* **Tier 3:** 25 Ethereum available at $3,015
If the trader submits a market buy order for 50 Ethereum:
1. The first 10 Ethereum fill at $3,000 ($30,000).
2. The next 15 Ethereum fill at $3,005 ($45,075).
3. The remaining 25 Ethereum fill at $3,015 ($75,375).
The total cost is $150,450, resulting in an average fill price of $3,009 per Ethereum. The average price paid was $9 higher per unit than the initial quoted market price of $3,000. This disparity is known as **slippage**.
In deep markets, like those typically found in high-market-cap assets such as Bitcoin, thick order books minimize slippage even for larger orders. In shallow markets, even modest orders can suffer substantial execution slippage.
---
### Advanced Order Book Dynamics: Illusions and Manipulation
While market depth provides vital structural transparency, intermediate traders must recognize that order books are dynamic and can sometimes be misleading. Relying solely on visible orders without context carries several risks.
#### 1. "Walls" and Order Book Spoofing
Large clusters of limit orders at a specific price level create visual "walls" on a depth chart. A massive buy wall often appears as strong support, while a large sell wall appears as heavy overhead resistance.
However, limit orders can be canceled at any millisecond before execution. Malicious market actors sometimes employ **spoofing**—placing massive limit orders with no intention of executing them. The goal is to create a false impression of deep liquidity or strong support/resistance, tricking retail traders into entering positions before the spoofed orders are canceled.
#### 2. Iceberg Orders
Institutional participants rarely place massive orders as single visible limit orders, as doing so alerts the market and moves the price against them. Instead, they use **iceberg orders**.
An iceberg order splits a large order into small, visible slices. As soon as one visible slice is filled, the algorithm automatically places the next slice at the same or a nearby price. As a result, the visible market depth may appear thin, yet hidden liquidity continually absorbs incoming orders at that level.
#### 3. Off-Book Liquidity (OTC Trading)
Extremely large institutional trades often occur entirely off exchange order books through Over-The-Counter (OTC) desks. Therefore, market depth on public exchanges does not represent total market liquidity, but rather exchange-specific retail and algorithmic liquidity.
---
### Practical Risk Management Applications
Understanding market depth translates directly into better risk management and trade planning:
1. **Order Type Selection:** In markets with thin depth, prefer **limit orders** or **limit-if-touched orders** over market orders to retain control over execution prices and prevent unexpected slippage.
2. **Sizing Positions Appropriately:** Before entering a trade in a low- or mid-cap asset, inspect the order book depth within 1% to 2% of the market price. Ensure your position size can be closed within that depth without triggering self-induced slippage.
3. **Evaluating True Support and Resistance:** Traditional chart analysis identifies horizontal lines based on past price bounces. Cross-referencing these technical zones with market depth allows you to verify whether genuine capital is parked at those levels to defend them.
4. **Setting Stop-Losses:** Placing a stop-loss order directly behind a thin depth zone can lead to sharp executions during sudden market movements. Positioning stops behind thicker clusters of resting liquidity can offer better protection against brief price spikes.
---
### Summary and Key Takeaways
Market depth is an essential analytical framework for traders moving beyond basic technical analysis. While trading volume shows where liquidity *was*, market depth shows where liquidity *is*.
By learning to read order books, calculate potential slippage, and remain aware of order book illusions like spoofing and hidden iceberg orders, intermediate traders can optimize execution quality, protect capital, and navigate complex crypto market structure with greater precision.
#CryptoEducation #MarketDepth #TradingStrategy
Demystifying Market Depth: How to Read Liquidity Beyond Simple Trading Volume
When evaluating cryptocurrency markets, many intermediate traders rely heavily on two primary metrics: price action and 24-hour trading volume. While these indicators provide valuable insights into historical price trends and broad activity levels, they fail to reveal a critical component of market mechanics: present liquidity.
To understand how easily an asset can be bought or sold without triggering dramatic price shifts, traders must look beyond volume and analyze market depth.
Market depth represents a real-time visualization of open buy and sell orders at various price levels. Understanding market depth allows traders to gauge potential slippage, identify institutional order clusters, evaluate true support and resistance levels, and execute trades more efficiently.
---
### Understanding the Anatomy of Market Depth
At the core of market depth is the order book. An order book is a continuously updated ledger containing two main sides:
1. **Bids (Buy Orders):** Represent buyers offering to purchase an asset at specific prices below the current market price.
2. **Asks or Offers (Sell Orders):** Represent sellers offering to dispose of an asset at specific prices above the current market price.
Market depth aggregates these open limit orders to show the cumulative volume available at each incremental price point away from the midpoint (the average between the highest bid and lowest ask).
On most trading platforms, market depth is displayed either as a tabular order book or as a visual depth chart. A depth chart places price along the horizontal axis and cumulative volume along the vertical axis.
* The **green line/area** (bids) slopes upward toward the center, representing buy demand.
* The **red line/area** (asks) slopes upward away from the center, representing sell supply.
Where the bid and ask sides meet in the middle is the prevailing market price. The gap between the highest price a buyer is willing to pay and the lowest price a seller is willing to accept is known as the **bid-ask spread**.
---
### Market Depth vs. Trading Volume: A Crucial Distinction
It is common for developing traders to confuse trading volume with market depth, yet they measure fundamentally different aspects of the market:
* **Trading Volume** is a *retrospective* metric. It measures the total amount of an asset traded over a defined period (e.g., 24 hours). High volume indicates significant past activity, but it does not guarantee that liquidity remains in the order book right now.
* **Market Depth** is a *prospective* metric. It reflects the live, pending order environment. It tells you what will happen if a large order is placed immediately.
Consider a practical example: An illiquid altcoin might record $10 million in 24-hour volume due to a sudden localized trading frenzy. However, if the live order book only contains $5,000 worth of bid orders within 1% of the current market price, a market sell order of $20,000 will exhaust those bids and push the price down significantly. Despite the high historical volume, the market depth was shallow.
---
### How Market Depth Drives Order Execution and Slippage
Market depth directly determines the execution price of **market orders**. Unlike limit orders, which sit in the order book waiting to be filled at a specified price or better, market orders execute immediately against the best available orders in the book.
When a trader submits a market order that exceeds the volume available at the top bid or ask, the order "walks the book." This means it consumes liquidity at the best price tier, then fills the remaining portion at progressively worse price tiers until the entire order amount is filled.
#### Practical Example: Calculating Execution Slippage
Suppose Ethereum is trading at a mid-market price of $3,000. An institutional trader wants to execute a market buy order for 50 Ethereum.
The ask side of the order book looks like this:
* **Tier 1:** 10 Ethereum available at $3,000
* **Tier 2:** 15 Ethereum available at $3,005
* **Tier 3:** 25 Ethereum available at $3,015
If the trader submits a market buy order for 50 Ethereum:
1. The first 10 Ethereum fill at $3,000 ($30,000).
2. The next 15 Ethereum fill at $3,005 ($45,075).
3. The remaining 25 Ethereum fill at $3,015 ($75,375).
The total cost is $150,450, resulting in an average fill price of $3,009 per Ethereum. The average price paid was $9 higher per unit than the initial quoted market price of $3,000. This disparity is known as **slippage**.
In deep markets, like those typically found in high-market-cap assets such as Bitcoin, thick order books minimize slippage even for larger orders. In shallow markets, even modest orders can suffer substantial execution slippage.
---
### Advanced Order Book Dynamics: Illusions and Manipulation
While market depth provides vital structural transparency, intermediate traders must recognize that order books are dynamic and can sometimes be misleading. Relying solely on visible orders without context carries several risks.
#### 1. "Walls" and Order Book Spoofing
Large clusters of limit orders at a specific price level create visual "walls" on a depth chart. A massive buy wall often appears as strong support, while a large sell wall appears as heavy overhead resistance.
However, limit orders can be canceled at any millisecond before execution. Malicious market actors sometimes employ **spoofing**—placing massive limit orders with no intention of executing them. The goal is to create a false impression of deep liquidity or strong support/resistance, tricking retail traders into entering positions before the spoofed orders are canceled.
#### 2. Iceberg Orders
Institutional participants rarely place massive orders as single visible limit orders, as doing so alerts the market and moves the price against them. Instead, they use **iceberg orders**.
An iceberg order splits a large order into small, visible slices. As soon as one visible slice is filled, the algorithm automatically places the next slice at the same or a nearby price. As a result, the visible market depth may appear thin, yet hidden liquidity continually absorbs incoming orders at that level.
#### 3. Off-Book Liquidity (OTC Trading)
Extremely large institutional trades often occur entirely off exchange order books through Over-The-Counter (OTC) desks. Therefore, market depth on public exchanges does not represent total market liquidity, but rather exchange-specific retail and algorithmic liquidity.
---
### Practical Risk Management Applications
Understanding market depth translates directly into better risk management and trade planning:
1. **Order Type Selection:** In markets with thin depth, prefer **limit orders** or **limit-if-touched orders** over market orders to retain control over execution prices and prevent unexpected slippage.
2. **Sizing Positions Appropriately:** Before entering a trade in a low- or mid-cap asset, inspect the order book depth within 1% to 2% of the market price. Ensure your position size can be closed within that depth without triggering self-induced slippage.
3. **Evaluating True Support and Resistance:** Traditional chart analysis identifies horizontal lines based on past price bounces. Cross-referencing these technical zones with market depth allows you to verify whether genuine capital is parked at those levels to defend them.
4. **Setting Stop-Losses:** Placing a stop-loss order directly behind a thin depth zone can lead to sharp executions during sudden market movements. Positioning stops behind thicker clusters of resting liquidity can offer better protection against brief price spikes.
---
### Summary and Key Takeaways
Market depth is an essential analytical framework for traders moving beyond basic technical analysis. While trading volume shows where liquidity *was*, market depth shows where liquidity *is*.
By learning to read order books, calculate potential slippage, and remain aware of order book illusions like spoofing and hidden iceberg orders, intermediate traders can optimize execution quality, protect capital, and navigate complex crypto market structure with greater precision.
#CryptoEducation #MarketDepth #TradingStrategy
To understand how easily an asset can be bought or sold without triggering dramatic price shifts, traders must look beyond volume and analyze market depth.
Market depth represents a real-time visualization of open buy and sell orders at various price levels. Understanding market depth allows traders to gauge potential slippage, identify institutional order clusters, evaluate true support and resistance levels, and execute trades more efficiently.
---
### Understanding the Anatomy of Market Depth
At the core of market depth is the order book. An order book is a continuously updated ledger containing two main sides:
1. **Bids (Buy Orders):** Represent buyers offering to purchase an asset at specific prices below the current market price.
2. **Asks or Offers (Sell Orders):** Represent sellers offering to dispose of an asset at specific prices above the current market price.
Market depth aggregates these open limit orders to show the cumulative volume available at each incremental price point away from the midpoint (the average between the highest bid and lowest ask).
On most trading platforms, market depth is displayed either as a tabular order book or as a visual depth chart. A depth chart places price along the horizontal axis and cumulative volume along the vertical axis.
* The **green line/area** (bids) slopes upward toward the center, representing buy demand.
* The **red line/area** (asks) slopes upward away from the center, representing sell supply.
Where the bid and ask sides meet in the middle is the prevailing market price. The gap between the highest price a buyer is willing to pay and the lowest price a seller is willing to accept is known as the **bid-ask spread**.
---
### Market Depth vs. Trading Volume: A Crucial Distinction
It is common for developing traders to confuse trading volume with market depth, yet they measure fundamentally different aspects of the market:
* **Trading Volume** is a *retrospective* metric. It measures the total amount of an asset traded over a defined period (e.g., 24 hours). High volume indicates significant past activity, but it does not guarantee that liquidity remains in the order book right now.
* **Market Depth** is a *prospective* metric. It reflects the live, pending order environment. It tells you what will happen if a large order is placed immediately.
Consider a practical example: An illiquid altcoin might record $10 million in 24-hour volume due to a sudden localized trading frenzy. However, if the live order book only contains $5,000 worth of bid orders within 1% of the current market price, a market sell order of $20,000 will exhaust those bids and push the price down significantly. Despite the high historical volume, the market depth was shallow.
---
### How Market Depth Drives Order Execution and Slippage
Market depth directly determines the execution price of **market orders**. Unlike limit orders, which sit in the order book waiting to be filled at a specified price or better, market orders execute immediately against the best available orders in the book.
When a trader submits a market order that exceeds the volume available at the top bid or ask, the order "walks the book." This means it consumes liquidity at the best price tier, then fills the remaining portion at progressively worse price tiers until the entire order amount is filled.
#### Practical Example: Calculating Execution Slippage
Suppose Ethereum is trading at a mid-market price of $3,000. An institutional trader wants to execute a market buy order for 50 Ethereum.
The ask side of the order book looks like this:
* **Tier 1:** 10 Ethereum available at $3,000
* **Tier 2:** 15 Ethereum available at $3,005
* **Tier 3:** 25 Ethereum available at $3,015
If the trader submits a market buy order for 50 Ethereum:
1. The first 10 Ethereum fill at $3,000 ($30,000).
2. The next 15 Ethereum fill at $3,005 ($45,075).
3. The remaining 25 Ethereum fill at $3,015 ($75,375).
The total cost is $150,450, resulting in an average fill price of $3,009 per Ethereum. The average price paid was $9 higher per unit than the initial quoted market price of $3,000. This disparity is known as **slippage**.
In deep markets, like those typically found in high-market-cap assets such as Bitcoin, thick order books minimize slippage even for larger orders. In shallow markets, even modest orders can suffer substantial execution slippage.
---
### Advanced Order Book Dynamics: Illusions and Manipulation
While market depth provides vital structural transparency, intermediate traders must recognize that order books are dynamic and can sometimes be misleading. Relying solely on visible orders without context carries several risks.
#### 1. "Walls" and Order Book Spoofing
Large clusters of limit orders at a specific price level create visual "walls" on a depth chart. A massive buy wall often appears as strong support, while a large sell wall appears as heavy overhead resistance.
However, limit orders can be canceled at any millisecond before execution. Malicious market actors sometimes employ **spoofing**—placing massive limit orders with no intention of executing them. The goal is to create a false impression of deep liquidity or strong support/resistance, tricking retail traders into entering positions before the spoofed orders are canceled.
#### 2. Iceberg Orders
Institutional participants rarely place massive orders as single visible limit orders, as doing so alerts the market and moves the price against them. Instead, they use **iceberg orders**.
An iceberg order splits a large order into small, visible slices. As soon as one visible slice is filled, the algorithm automatically places the next slice at the same or a nearby price. As a result, the visible market depth may appear thin, yet hidden liquidity continually absorbs incoming orders at that level.
#### 3. Off-Book Liquidity (OTC Trading)
Extremely large institutional trades often occur entirely off exchange order books through Over-The-Counter (OTC) desks. Therefore, market depth on public exchanges does not represent total market liquidity, but rather exchange-specific retail and algorithmic liquidity.
---
### Practical Risk Management Applications
Understanding market depth translates directly into better risk management and trade planning:
1. **Order Type Selection:** In markets with thin depth, prefer **limit orders** or **limit-if-touched orders** over market orders to retain control over execution prices and prevent unexpected slippage.
2. **Sizing Positions Appropriately:** Before entering a trade in a low- or mid-cap asset, inspect the order book depth within 1% to 2% of the market price. Ensure your position size can be closed within that depth without triggering self-induced slippage.
3. **Evaluating True Support and Resistance:** Traditional chart analysis identifies horizontal lines based on past price bounces. Cross-referencing these technical zones with market depth allows you to verify whether genuine capital is parked at those levels to defend them.
4. **Setting Stop-Losses:** Placing a stop-loss order directly behind a thin depth zone can lead to sharp executions during sudden market movements. Positioning stops behind thicker clusters of resting liquidity can offer better protection against brief price spikes.
---
### Summary and Key Takeaways
Market depth is an essential analytical framework for traders moving beyond basic technical analysis. While trading volume shows where liquidity *was*, market depth shows where liquidity *is*.
By learning to read order books, calculate potential slippage, and remain aware of order book illusions like spoofing and hidden iceberg orders, intermediate traders can optimize execution quality, protect capital, and navigate complex crypto market structure with greater precision.
#CryptoEducation #MarketDepth #TradingStrategy
113
Demystifying Market Depth: How Order Books, Slippage, and Liquidity Shape Crypto MarketsWhen observing cryptocurrency markets, most traders spend the majority of their time looking at price charts. Candlestick patterns, moving averages, and momentum indicators offer a historical view of price action. However, a price chart only tells you where an asset has been; it does not explicitly show you how easy or difficult it will be for the market to move to the next price level.
To understand the structural foundation of real-time price movement, traders must look behind the candlestick chart and evaluate market depth. Market depth provides a direct window into supply and demand, illuminating the underlying mechanics that cause prices to remain stable, move gradually, or experience sudden volatile swings.
---
### 1. The Core Mechanics of the Order Book
To understand market depth, one must first understand the order book. An order book is an electronic ledger of all open, unexecuted buy and sell limit orders for a specific trading asset on an exchange.
The order book is divided into two primary sides:
* **Bids (Buy Orders):** Located on the buy side, bids represent buyers who have placed limit orders to purchase an asset at a specified price or lower. Bids are ranked from highest price to lowest price. The highest bid is referred to as the "best bid."
* **Asks or Offers (Sell Orders):** Located on the sell side, asks represent sellers who have placed limit orders to sell an asset at a specified price or higher. Asks are ranked from lowest price to highest price. The lowest ask is referred to as the "best ask."
The difference between the best bid and the best ask is known as the **bid-ask spread**. In highly liquid markets, such as major pairs involving Bitcoin or Ethereum, this spread is often just a fraction of a cent. In lower-volume altcoins, the spread can be significantly wider.
Orders in the book are considered **passive liquidity**. They sit in the book waiting to be filled. Conversely, traders using **market orders** consume this liquidity immediately by agreeing to trade at whatever the best available price is in the order book.
---
### 2. What Is Market Depth?
Market depth refers to the market’s capacity to sustain relatively large market orders without causing significant price movements. It is measured by the volume of open limit orders available at various price levels above and below the current market price.
A market is considered **deep** if there are substantial buy and sell limit orders placed close to the current market price. In a deep market:
* Large orders can be executed with minimal impact on the market price.
* Price volatility tends to be lower during standard trading conditions.
* Spreads between bids and asks remain narrow.
A market is considered **shallow** or **thin** if there are few limit orders near the current price. In a shallow market:
* Even moderate market orders can sweep through multiple price levels, causing sharp price moves.
* Execution prices can deviate significantly from expected prices.
* Spreads are typically wider, increasing trading costs.
---
### 3. Visualizing Market Depth: The Depth Chart
Most major crypto exchanges present market depth visually through a depth chart. This chart plots cumulative order volumes on a horizontal price axis.
The depth chart is split into two halves:
* **Green Slope (Bids):** Accumulates buy orders from the best bid downward.
* **Red Slope (Asks):** Accumulates sell orders from the best ask upward.
The steepness of the slopes provides immediate information about liquidity distribution. A flat slope indicates a dense concentration of orders at those price levels (deep liquidity), meaning it will take a high volume of market orders to push the price past that zone. A steep slope indicates a lack of limit orders (shallow liquidity), suggesting that price can move quickly through those levels if aggressive buying or selling occurs.
---
### 4. Practical Scenario: Understanding Slippage and Price Impact
To illustrate how market depth affects execution, consider a practical example.
Suppose an asset is currently trading around 100 USD. You decide to place a market buy order for 500 units of the asset.
In a **deep market**, the order book might look like this:
* 200 units available at 100.01 USD
* 200 units available at 100.02 USD
* 200 units available at 100.03 USD
Your market buy order fills across these levels:
* 200 units executed at 100.01 USD
* 200 units executed at 100.02 USD
* 100 units executed at 100.03 USD
Your average execution price is approximately 100.018 USD. The price moved only slightly to accommodate your trade.
Now consider the same trade in a **shallow market**:
* 50 units available at 100.10 USD
* 100 units available at 101.00 USD
* 150 units available at 102.50 USD
* 200 units available at 105.00 USD
Your market buy order fills as follows:
* 50 units at 100.10 USD
* 100 units at 101.00 USD
* 150 units at 102.50 USD
* 200 units at 105.00 USD
Your average execution price jumps to 102.96 USD.
This difference between your expected execution price (100 USD) and your actual execution price (102.96 USD) is known as **slippage**. In shallow depth environments, slippage can quickly consume profit margins, making market order execution risky for large position sizes.
---
### 5. Order Book Illusions: Walls, Spoofing, and Icebergs
While market depth offers valuable data, interpreting order books requires caution. Order books are dynamic and can be manipulated or masked by sophisticated market participants.
#### Buy and Sell Walls
A "wall" occurs when a massive limit order is placed at a specific price level, appearing as a vertical step on the visual depth chart.
* A large **buy wall** can suggest strong price support, leading retail traders to assume the price will not fall below that point.
* A large **sell wall** suggests heavy resistance, leading traders to anticipate a price ceiling.
However, order walls are not guaranteed commitments. Because limit orders can be canceled at any time without execution, large walls may disappear a split second before price reaches them.
#### Spoofing
Spoofing is an illegal or manipulative trading practice where a participant places large, non-bona fide limit orders with no intention of letting them fill. The goal is to create a false impression of heavy supply or demand, manipulating other traders into buying or selling. Once the market moves in the desired direction, the spoofed orders are canceled, and the manipulator exits their position at a favorable price.
#### Iceberg Orders
Institutional participants trading large volumes often avoid displaying their full order size in the order book, as doing so would alert the market and push prices against them. Instead, they use **iceberg orders**. An iceberg order splits a large order into small public tranches. As soon as one small tranche is filled, the algorithm automatically places the next chunk. Consequently, actual market depth may be significantly higher than visible depth.
---
### 6. Order Books vs. Automated Market Makers (AMMs)
Market depth concepts extend to decentralized finance (DeFi), though the mechanics differ.
Centralized exchanges predominantly use central limit order books (CLOBs), where market depth is determined by discrete limit orders placed by individual market participants and market makers.
Decentralized exchanges (DEXs) often rely on Automated Market Makers (AMMs) utilizing liquidity pools. In an AMM, market depth is determined by the total liquidity locked in a pool and the mathematical bonding curve (such as constant product formulas). While there are no order book bids and asks, the principle remains identical: pools with high liquidity exhibit low price impact and low slippage, while low-liquidity pools experience high price impact when trades are executed.
---
### 7. Risk Management and Strategic Applications
For intermediate traders, analyzing market depth provides several practical benefits:
1. **Selecting Order Types:** If market depth is thin relative to your trade size, avoid market orders. Using limit orders ensures price control, preventing unintended slippage.
2. **Timing Execution:** Observing order book imbalances—where bid volume significantly outweighs ask volume or vice versa—can provide short-term context regarding market pressure, helping refine entry and exit timing.
3. **Evaluating Asset Risk:** Assets with shallow market depth across exchanges carry higher liquidity risk. During market distress, thin order books can suffer liquidity cascades, leading to rapid price crashes.
---
### 8. Limitations of Market Depth Analysis
Market depth is a useful analytic tool, but it should not be relied upon in isolation:
* **High-Frequency Changes:** High-frequency trading (HFT) algorithms add and cancel thousands of orders per second, making real-time depth highly volatile.
* **Off-Exchange Liquidity:** Over-the-counter (OTC) desks handle massive trades outside public order books, meaning visible depth does not reflect total market liquidity.
* **Context Matters:** Market depth provides immediate structural context, but macro news, fundamental changes, or sudden broader market liquidation events can clear through deep order books rapidly.
Market depth analysis is best used as a practical risk management tool alongside broader technical and fundamental research, rather than a standalone predictive system.
#CryptoEducation #MarketDepth #TradingStrategy
Demystifying Market Depth: How Order Books, Slippage, and Liquidity Shape Crypto Markets
When observing cryptocurrency markets, most traders spend the majority of their time looking at price charts. Candlestick patterns, moving averages, and momentum indicators offer a historical view of price action. However, a price chart only tells you where an asset has been; it does not explicitly show you how easy or difficult it will be for the market to move to the next price level.
To understand the structural foundation of real-time price movement, traders must look behind the candlestick chart and evaluate market depth. Market depth provides a direct window into supply and demand, illuminating the underlying mechanics that cause prices to remain stable, move gradually, or experience sudden volatile swings.
---
### 1. The Core Mechanics of the Order Book
To understand market depth, one must first understand the order book. An order book is an electronic ledger of all open, unexecuted buy and sell limit orders for a specific trading asset on an exchange.
The order book is divided into two primary sides:
* **Bids (Buy Orders):** Located on the buy side, bids represent buyers who have placed limit orders to purchase an asset at a specified price or lower. Bids are ranked from highest price to lowest price. The highest bid is referred to as the "best bid."
* **Asks or Offers (Sell Orders):** Located on the sell side, asks represent sellers who have placed limit orders to sell an asset at a specified price or higher. Asks are ranked from lowest price to highest price. The lowest ask is referred to as the "best ask."
The difference between the best bid and the best ask is known as the **bid-ask spread**. In highly liquid markets, such as major pairs involving Bitcoin or Ethereum, this spread is often just a fraction of a cent. In lower-volume altcoins, the spread can be significantly wider.
Orders in the book are considered **passive liquidity**. They sit in the book waiting to be filled. Conversely, traders using **market orders** consume this liquidity immediately by agreeing to trade at whatever the best available price is in the order book.
---
### 2. What Is Market Depth?
Market depth refers to the market’s capacity to sustain relatively large market orders without causing significant price movements. It is measured by the volume of open limit orders available at various price levels above and below the current market price.
A market is considered **deep** if there are substantial buy and sell limit orders placed close to the current market price. In a deep market:
* Large orders can be executed with minimal impact on the market price.
* Price volatility tends to be lower during standard trading conditions.
* Spreads between bids and asks remain narrow.
A market is considered **shallow** or **thin** if there are few limit orders near the current price. In a shallow market:
* Even moderate market orders can sweep through multiple price levels, causing sharp price moves.
* Execution prices can deviate significantly from expected prices.
* Spreads are typically wider, increasing trading costs.
---
### 3. Visualizing Market Depth: The Depth Chart
Most major crypto exchanges present market depth visually through a depth chart. This chart plots cumulative order volumes on a horizontal price axis.
The depth chart is split into two halves:
* **Green Slope (Bids):** Accumulates buy orders from the best bid downward.
* **Red Slope (Asks):** Accumulates sell orders from the best ask upward.
The steepness of the slopes provides immediate information about liquidity distribution. A flat slope indicates a dense concentration of orders at those price levels (deep liquidity), meaning it will take a high volume of market orders to push the price past that zone. A steep slope indicates a lack of limit orders (shallow liquidity), suggesting that price can move quickly through those levels if aggressive buying or selling occurs.
---
### 4. Practical Scenario: Understanding Slippage and Price Impact
To illustrate how market depth affects execution, consider a practical example.
Suppose an asset is currently trading around 100 USD. You decide to place a market buy order for 500 units of the asset.
In a **deep market**, the order book might look like this:
* 200 units available at 100.01 USD
* 200 units available at 100.02 USD
* 200 units available at 100.03 USD
Your market buy order fills across these levels:
* 200 units executed at 100.01 USD
* 200 units executed at 100.02 USD
* 100 units executed at 100.03 USD
Your average execution price is approximately 100.018 USD. The price moved only slightly to accommodate your trade.
Now consider the same trade in a **shallow market**:
* 50 units available at 100.10 USD
* 100 units available at 101.00 USD
* 150 units available at 102.50 USD
* 200 units available at 105.00 USD
Your market buy order fills as follows:
* 50 units at 100.10 USD
* 100 units at 101.00 USD
* 150 units at 102.50 USD
* 200 units at 105.00 USD
Your average execution price jumps to 102.96 USD.
This difference between your expected execution price (100 USD) and your actual execution price (102.96 USD) is known as **slippage**. In shallow depth environments, slippage can quickly consume profit margins, making market order execution risky for large position sizes.
---
### 5. Order Book Illusions: Walls, Spoofing, and Icebergs
While market depth offers valuable data, interpreting order books requires caution. Order books are dynamic and can be manipulated or masked by sophisticated market participants.
#### Buy and Sell Walls
A "wall" occurs when a massive limit order is placed at a specific price level, appearing as a vertical step on the visual depth chart.
* A large **buy wall** can suggest strong price support, leading retail traders to assume the price will not fall below that point.
* A large **sell wall** suggests heavy resistance, leading traders to anticipate a price ceiling.
However, order walls are not guaranteed commitments. Because limit orders can be canceled at any time without execution, large walls may disappear a split second before price reaches them.
#### Spoofing
Spoofing is an illegal or manipulative trading practice where a participant places large, non-bona fide limit orders with no intention of letting them fill. The goal is to create a false impression of heavy supply or demand, manipulating other traders into buying or selling. Once the market moves in the desired direction, the spoofed orders are canceled, and the manipulator exits their position at a favorable price.
#### Iceberg Orders
Institutional participants trading large volumes often avoid displaying their full order size in the order book, as doing so would alert the market and push prices against them. Instead, they use **iceberg orders**. An iceberg order splits a large order into small public tranches. As soon as one small tranche is filled, the algorithm automatically places the next chunk. Consequently, actual market depth may be significantly higher than visible depth.
---
### 6. Order Books vs. Automated Market Makers (AMMs)
Market depth concepts extend to decentralized finance (DeFi), though the mechanics differ.
Centralized exchanges predominantly use central limit order books (CLOBs), where market depth is determined by discrete limit orders placed by individual market participants and market makers.
Decentralized exchanges (DEXs) often rely on Automated Market Makers (AMMs) utilizing liquidity pools. In an AMM, market depth is determined by the total liquidity locked in a pool and the mathematical bonding curve (such as constant product formulas). While there are no order book bids and asks, the principle remains identical: pools with high liquidity exhibit low price impact and low slippage, while low-liquidity pools experience high price impact when trades are executed.
---
### 7. Risk Management and Strategic Applications
For intermediate traders, analyzing market depth provides several practical benefits:
1. **Selecting Order Types:** If market depth is thin relative to your trade size, avoid market orders. Using limit orders ensures price control, preventing unintended slippage.
2. **Timing Execution:** Observing order book imbalances—where bid volume significantly outweighs ask volume or vice versa—can provide short-term context regarding market pressure, helping refine entry and exit timing.
3. **Evaluating Asset Risk:** Assets with shallow market depth across exchanges carry higher liquidity risk. During market distress, thin order books can suffer liquidity cascades, leading to rapid price crashes.
---
### 8. Limitations of Market Depth Analysis
Market depth is a useful analytic tool, but it should not be relied upon in isolation:
* **High-Frequency Changes:** High-frequency trading (HFT) algorithms add and cancel thousands of orders per second, making real-time depth highly volatile.
* **Off-Exchange Liquidity:** Over-the-counter (OTC) desks handle massive trades outside public order books, meaning visible depth does not reflect total market liquidity.
* **Context Matters:** Market depth provides immediate structural context, but macro news, fundamental changes, or sudden broader market liquidation events can clear through deep order books rapidly.
Market depth analysis is best used as a practical risk management tool alongside broader technical and fundamental research, rather than a standalone predictive system.
#CryptoEducation #MarketDepth #TradingStrategy
To understand the structural foundation of real-time price movement, traders must look behind the candlestick chart and evaluate market depth. Market depth provides a direct window into supply and demand, illuminating the underlying mechanics that cause prices to remain stable, move gradually, or experience sudden volatile swings.
---
### 1. The Core Mechanics of the Order Book
To understand market depth, one must first understand the order book. An order book is an electronic ledger of all open, unexecuted buy and sell limit orders for a specific trading asset on an exchange.
The order book is divided into two primary sides:
* **Bids (Buy Orders):** Located on the buy side, bids represent buyers who have placed limit orders to purchase an asset at a specified price or lower. Bids are ranked from highest price to lowest price. The highest bid is referred to as the "best bid."
* **Asks or Offers (Sell Orders):** Located on the sell side, asks represent sellers who have placed limit orders to sell an asset at a specified price or higher. Asks are ranked from lowest price to highest price. The lowest ask is referred to as the "best ask."
The difference between the best bid and the best ask is known as the **bid-ask spread**. In highly liquid markets, such as major pairs involving Bitcoin or Ethereum, this spread is often just a fraction of a cent. In lower-volume altcoins, the spread can be significantly wider.
Orders in the book are considered **passive liquidity**. They sit in the book waiting to be filled. Conversely, traders using **market orders** consume this liquidity immediately by agreeing to trade at whatever the best available price is in the order book.
---
### 2. What Is Market Depth?
Market depth refers to the market’s capacity to sustain relatively large market orders without causing significant price movements. It is measured by the volume of open limit orders available at various price levels above and below the current market price.
A market is considered **deep** if there are substantial buy and sell limit orders placed close to the current market price. In a deep market:
* Large orders can be executed with minimal impact on the market price.
* Price volatility tends to be lower during standard trading conditions.
* Spreads between bids and asks remain narrow.
A market is considered **shallow** or **thin** if there are few limit orders near the current price. In a shallow market:
* Even moderate market orders can sweep through multiple price levels, causing sharp price moves.
* Execution prices can deviate significantly from expected prices.
* Spreads are typically wider, increasing trading costs.
---
### 3. Visualizing Market Depth: The Depth Chart
Most major crypto exchanges present market depth visually through a depth chart. This chart plots cumulative order volumes on a horizontal price axis.
The depth chart is split into two halves:
* **Green Slope (Bids):** Accumulates buy orders from the best bid downward.
* **Red Slope (Asks):** Accumulates sell orders from the best ask upward.
The steepness of the slopes provides immediate information about liquidity distribution. A flat slope indicates a dense concentration of orders at those price levels (deep liquidity), meaning it will take a high volume of market orders to push the price past that zone. A steep slope indicates a lack of limit orders (shallow liquidity), suggesting that price can move quickly through those levels if aggressive buying or selling occurs.
---
### 4. Practical Scenario: Understanding Slippage and Price Impact
To illustrate how market depth affects execution, consider a practical example.
Suppose an asset is currently trading around 100 USD. You decide to place a market buy order for 500 units of the asset.
In a **deep market**, the order book might look like this:
* 200 units available at 100.01 USD
* 200 units available at 100.02 USD
* 200 units available at 100.03 USD
Your market buy order fills across these levels:
* 200 units executed at 100.01 USD
* 200 units executed at 100.02 USD
* 100 units executed at 100.03 USD
Your average execution price is approximately 100.018 USD. The price moved only slightly to accommodate your trade.
Now consider the same trade in a **shallow market**:
* 50 units available at 100.10 USD
* 100 units available at 101.00 USD
* 150 units available at 102.50 USD
* 200 units available at 105.00 USD
Your market buy order fills as follows:
* 50 units at 100.10 USD
* 100 units at 101.00 USD
* 150 units at 102.50 USD
* 200 units at 105.00 USD
Your average execution price jumps to 102.96 USD.
This difference between your expected execution price (100 USD) and your actual execution price (102.96 USD) is known as **slippage**. In shallow depth environments, slippage can quickly consume profit margins, making market order execution risky for large position sizes.
---
### 5. Order Book Illusions: Walls, Spoofing, and Icebergs
While market depth offers valuable data, interpreting order books requires caution. Order books are dynamic and can be manipulated or masked by sophisticated market participants.
#### Buy and Sell Walls
A "wall" occurs when a massive limit order is placed at a specific price level, appearing as a vertical step on the visual depth chart.
* A large **buy wall** can suggest strong price support, leading retail traders to assume the price will not fall below that point.
* A large **sell wall** suggests heavy resistance, leading traders to anticipate a price ceiling.
However, order walls are not guaranteed commitments. Because limit orders can be canceled at any time without execution, large walls may disappear a split second before price reaches them.
#### Spoofing
Spoofing is an illegal or manipulative trading practice where a participant places large, non-bona fide limit orders with no intention of letting them fill. The goal is to create a false impression of heavy supply or demand, manipulating other traders into buying or selling. Once the market moves in the desired direction, the spoofed orders are canceled, and the manipulator exits their position at a favorable price.
#### Iceberg Orders
Institutional participants trading large volumes often avoid displaying their full order size in the order book, as doing so would alert the market and push prices against them. Instead, they use **iceberg orders**. An iceberg order splits a large order into small public tranches. As soon as one small tranche is filled, the algorithm automatically places the next chunk. Consequently, actual market depth may be significantly higher than visible depth.
---
### 6. Order Books vs. Automated Market Makers (AMMs)
Market depth concepts extend to decentralized finance (DeFi), though the mechanics differ.
Centralized exchanges predominantly use central limit order books (CLOBs), where market depth is determined by discrete limit orders placed by individual market participants and market makers.
Decentralized exchanges (DEXs) often rely on Automated Market Makers (AMMs) utilizing liquidity pools. In an AMM, market depth is determined by the total liquidity locked in a pool and the mathematical bonding curve (such as constant product formulas). While there are no order book bids and asks, the principle remains identical: pools with high liquidity exhibit low price impact and low slippage, while low-liquidity pools experience high price impact when trades are executed.
---
### 7. Risk Management and Strategic Applications
For intermediate traders, analyzing market depth provides several practical benefits:
1. **Selecting Order Types:** If market depth is thin relative to your trade size, avoid market orders. Using limit orders ensures price control, preventing unintended slippage.
2. **Timing Execution:** Observing order book imbalances—where bid volume significantly outweighs ask volume or vice versa—can provide short-term context regarding market pressure, helping refine entry and exit timing.
3. **Evaluating Asset Risk:** Assets with shallow market depth across exchanges carry higher liquidity risk. During market distress, thin order books can suffer liquidity cascades, leading to rapid price crashes.
---
### 8. Limitations of Market Depth Analysis
Market depth is a useful analytic tool, but it should not be relied upon in isolation:
* **High-Frequency Changes:** High-frequency trading (HFT) algorithms add and cancel thousands of orders per second, making real-time depth highly volatile.
* **Off-Exchange Liquidity:** Over-the-counter (OTC) desks handle massive trades outside public order books, meaning visible depth does not reflect total market liquidity.
* **Context Matters:** Market depth provides immediate structural context, but macro news, fundamental changes, or sudden broader market liquidation events can clear through deep order books rapidly.
Market depth analysis is best used as a practical risk management tool alongside broader technical and fundamental research, rather than a standalone predictive system.
#CryptoEducation #MarketDepth #TradingStrategy
64
Demystifying Market Depth: How Order Books Shape Crypto Price MovementWhen observing financial markets, most traders rely heavily on standard candlestick charts. These charts showcase historical price actions—where the price opened, closed, peaked, and bottomed over specific timeframes. While historical price action is essential, it only tells half the story. It tells you where the market has been, but it provides little structural insight into how easily the market can move right now.
To understand how price movements actually occur under the hood, traders must look beyond price candles and evaluate market depth. Market depth offers a real-time window into pending buy and sell interest across different price levels. Understanding this visual and mathematical landscape is a crucial step for intermediate traders looking to refine their execution, manage trading costs, and avoid common market execution traps.
### What is Market Depth?
At its core, market depth refers to the market's ability to absorb relatively large market orders without causing significant price fluctuations. It represents the aggregate volume of outstanding limit orders positioned on both sides of an asset’s current market price.
Every centralized exchange operates an electronic matching engine powered by an order book. This order book contains two main sides:
1. **The Bid Side (Buyers):** A list of traders offering to purchase the asset at specific prices below the current market price.
2. **The Ask or Offer Side (Sellers):** A list of traders offering to sell the asset at specific prices above the current market price.
Market depth visualizes these limit orders, typically through a depth chart or an aggregated order book ladder. The horizontal axis represents price levels, while the vertical axis (or cumulative volume total) shows the quantity of the asset available at those price points.
### Market Volume vs. Market Depth: A Key Distinction
It is easy to confuse trading volume with market depth, yet they measure fundamentally different mechanics:
* **Trading Volume** is a backward-looking metric. It measures the total amount of an asset that has successfully changed hands over a given period (such as 24 hours). High historical volume indicates robust past activity, but it does not guarantee immediate liquidity.
* **Market Depth** is a present-moment metric. It measures the volume of orders currently sitting in the order book, waiting to be matched.
An asset might boast millions of dollars in 24-hour volume due to rapid back-and-forth trading, but if its active order book contains very few resting orders near the spot price, a single large order can easily push the price up or down significantly.
### Core Components of Order Book Depth
To read market depth effectively, traders must understand three essential elements:
#### 1. The Bid-Ask Spread
The distance between the highest price a buyer is willing to pay (best bid) and the lowest price a seller is willing to accept (best ask) is called the spread. Tight spreads generally signal high market depth and liquid conditions, while wide spreads suggest lower liquidity and higher trading friction.
#### 2. Market Slippage
When you execute a market order, the exchange matches your order against existing limit orders in the book. If your order size exceeds the volume available at the best bid or ask, the matching engine continues filling the remainder of your order at progressively worse prices deeper into the book. This difference between your expected fill price and your actual average execution price is known as slippage.
#### 3. Depth Walls (Buy and Sell Walls)
When viewing a visual market depth chart, you will frequently notice steep vertical steps on either side of the price curve. These are known as order walls.
* **Buy Wall:** Occurs when a massive concentration of buy limit orders exists at a specific price level. This creates a psychological and financial barrier, as sellers must exhaust all that buy liquidity before the price can push lower.
* **Sell Wall:** Occurs when a massive concentration of sell limit orders sits at a specific price. Buyers must purchase all available inventory at that level before the price can climb higher.
### Practical Example: The Mechanics of Execution
To understand how depth affects your trade, consider a practical scenario involving an asset traded on an exchange.
Imagine Asset X is currently trading at $100.00. You decide to place a market buy order for 1,000 units of Asset X.
Let's examine two different market depth scenarios:
**Scenario A: Deep Market Depth**
* Best Ask: $100.05 (500 units available)
* Second Ask: $100.10 (500 units available)
* **Result:** Your order is filled in two parts—500 units at $100.05 and 500 units at $100.10. Your average execution price is $100.075. Slippage is negligible (less than 0.08%).
**Scenario B: Thin Market Depth**
* Best Ask: $100.05 (100 units available)
* Second Ask: $101.00 (200 units available)
* Third Ask: $103.00 (700 units available)
* **Result:** Your order matches 100 units at $100.05, 200 units at $101.00, and 700 units at $103.00. Your average execution price jumps to approximately $102.30. You suffered over 2.3% in slippage simply due to poor market depth.
This example highlights why market order execution on low-depth assets can severely impair overall trading performance, even if your directional bias was correct.
### Advanced Order Book Dynamics
Market depth is not static; it is a dynamic environment driven by automated market makers, institutional algorithmic execution engines, and retail participants.
* **Algorithmic Market Making:** Automated programs continuously quote buy and sell prices, capturing the bid-ask spread while providing liquidity to the order book. When market volatility spikes, these algorithms often retreat or widen their spreads to mitigate risk, causing market depth to evaporate rapidly.
* **Iceberg Orders:** Large traders often wish to hide their true execution intentions to prevent the market from moving against them. They use iceberg orders, which divide a massive order into small visible portions. As soon as one visible chunk is filled, the system automatically posts the next chunk. Therefore, the visible order book depth may not always represent the full extent of true market liquidity.
### Risks, Limitations, and Misconceptions
While evaluating order book depth provides valuable insights, relying on static depth snapshots carries inherent risks:
#### 1. Phantom Liquidity and Spoofing
Not every order in the book is intended to be executed. Spoofing is an illegal or manipulative tactic where market actors place massive fake orders (buy or sell walls) to create a false impression of support or resistance. As soon as the market price approaches these orders, the manipulator cancels them. Expecting a buy wall to act as a guaranteed price floor can lead to costly mistakes.
#### 2. Fragmented Liquidity
Unlike traditional financial markets that rely on centralized clearinghouses, the cryptocurrency landscape is highly fragmented. Liquidity is split across dozens of centralized exchanges, decentralized exchanges, and over-the-counter desks. A token might exhibit deep order book liquidity on one exchange venue while remaining virtually illiquid on another. Looking at depth on a single platform provides only a partial view of global liquidity.
#### 3. Rapid Order Cancellation During Volatility
During sharp macro announcements or sudden price breakouts, limit order books can empty within milliseconds. Limit orders placed by liquidity providers represent commitment; when extreme volatility hits, market makers quickly cancel their orders to avoid being caught on the wrong side of a major trend. Consequently, depth that exists during quiet market conditions often disappears when you need it most.
### Practical Checklist for Intermediate Traders
1. **Match Order Type to Liquidity:** For large trade sizes relative to the asset’s order book depth, utilize limit orders, Time-Weighted Average Price (TWAP) algorithms, or scale into positions gradually rather than relying on standard market orders.
2. **Monitor 1% and 2% Depth Metrics:** Instead of focusing only on the spot price, monitor how much capital is required to move the price by 1% or 2% in either direction. This metric provides a far clearer picture of true market resilience.
3. **Beware of Single Wall Signals:** Avoid using large order book walls as isolated entry or exit triggers. Treat them as dynamic indicators that require confirmation from volume and price action tools.
4. **Verify Venue-Specific Depth:** Always verify execution depth specifically on the exchange venue where you intend to place your order.
### Conclusion
Market depth is the foundational structural layer that governs price formation and trade execution across crypto markets. By moving beyond historic price action and mastering the mechanics of order books, bid-ask spreads, and liquidity distribution, traders can protect themselves from unnecessary slippage, avoid market manipulation traps, and execute orders with far greater precision.
#CryptoEducation #TradingTips #MarketDepth
Demystifying Market Depth: How Order Books Shape Crypto Price Movement
When observing financial markets, most traders rely heavily on standard candlestick charts. These charts showcase historical price actions—where the price opened, closed, peaked, and bottomed over specific timeframes. While historical price action is essential, it only tells half the story. It tells you where the market has been, but it provides little structural insight into how easily the market can move right now.
To understand how price movements actually occur under the hood, traders must look beyond price candles and evaluate market depth. Market depth offers a real-time window into pending buy and sell interest across different price levels. Understanding this visual and mathematical landscape is a crucial step for intermediate traders looking to refine their execution, manage trading costs, and avoid common market execution traps.
### What is Market Depth?
At its core, market depth refers to the market's ability to absorb relatively large market orders without causing significant price fluctuations. It represents the aggregate volume of outstanding limit orders positioned on both sides of an asset’s current market price.
Every centralized exchange operates an electronic matching engine powered by an order book. This order book contains two main sides:
1. **The Bid Side (Buyers):** A list of traders offering to purchase the asset at specific prices below the current market price.
2. **The Ask or Offer Side (Sellers):** A list of traders offering to sell the asset at specific prices above the current market price.
Market depth visualizes these limit orders, typically through a depth chart or an aggregated order book ladder. The horizontal axis represents price levels, while the vertical axis (or cumulative volume total) shows the quantity of the asset available at those price points.
### Market Volume vs. Market Depth: A Key Distinction
It is easy to confuse trading volume with market depth, yet they measure fundamentally different mechanics:
* **Trading Volume** is a backward-looking metric. It measures the total amount of an asset that has successfully changed hands over a given period (such as 24 hours). High historical volume indicates robust past activity, but it does not guarantee immediate liquidity.
* **Market Depth** is a present-moment metric. It measures the volume of orders currently sitting in the order book, waiting to be matched.
An asset might boast millions of dollars in 24-hour volume due to rapid back-and-forth trading, but if its active order book contains very few resting orders near the spot price, a single large order can easily push the price up or down significantly.
### Core Components of Order Book Depth
To read market depth effectively, traders must understand three essential elements:
#### 1. The Bid-Ask Spread
The distance between the highest price a buyer is willing to pay (best bid) and the lowest price a seller is willing to accept (best ask) is called the spread. Tight spreads generally signal high market depth and liquid conditions, while wide spreads suggest lower liquidity and higher trading friction.
#### 2. Market Slippage
When you execute a market order, the exchange matches your order against existing limit orders in the book. If your order size exceeds the volume available at the best bid or ask, the matching engine continues filling the remainder of your order at progressively worse prices deeper into the book. This difference between your expected fill price and your actual average execution price is known as slippage.
#### 3. Depth Walls (Buy and Sell Walls)
When viewing a visual market depth chart, you will frequently notice steep vertical steps on either side of the price curve. These are known as order walls.
* **Buy Wall:** Occurs when a massive concentration of buy limit orders exists at a specific price level. This creates a psychological and financial barrier, as sellers must exhaust all that buy liquidity before the price can push lower.
* **Sell Wall:** Occurs when a massive concentration of sell limit orders sits at a specific price. Buyers must purchase all available inventory at that level before the price can climb higher.
### Practical Example: The Mechanics of Execution
To understand how depth affects your trade, consider a practical scenario involving an asset traded on an exchange.
Imagine Asset X is currently trading at $100.00. You decide to place a market buy order for 1,000 units of Asset X.
Let's examine two different market depth scenarios:
**Scenario A: Deep Market Depth**
* Best Ask: $100.05 (500 units available)
* Second Ask: $100.10 (500 units available)
* **Result:** Your order is filled in two parts—500 units at $100.05 and 500 units at $100.10. Your average execution price is $100.075. Slippage is negligible (less than 0.08%).
**Scenario B: Thin Market Depth**
* Best Ask: $100.05 (100 units available)
* Second Ask: $101.00 (200 units available)
* Third Ask: $103.00 (700 units available)
* **Result:** Your order matches 100 units at $100.05, 200 units at $101.00, and 700 units at $103.00. Your average execution price jumps to approximately $102.30. You suffered over 2.3% in slippage simply due to poor market depth.
This example highlights why market order execution on low-depth assets can severely impair overall trading performance, even if your directional bias was correct.
### Advanced Order Book Dynamics
Market depth is not static; it is a dynamic environment driven by automated market makers, institutional algorithmic execution engines, and retail participants.
* **Algorithmic Market Making:** Automated programs continuously quote buy and sell prices, capturing the bid-ask spread while providing liquidity to the order book. When market volatility spikes, these algorithms often retreat or widen their spreads to mitigate risk, causing market depth to evaporate rapidly.
* **Iceberg Orders:** Large traders often wish to hide their true execution intentions to prevent the market from moving against them. They use iceberg orders, which divide a massive order into small visible portions. As soon as one visible chunk is filled, the system automatically posts the next chunk. Therefore, the visible order book depth may not always represent the full extent of true market liquidity.
### Risks, Limitations, and Misconceptions
While evaluating order book depth provides valuable insights, relying on static depth snapshots carries inherent risks:
#### 1. Phantom Liquidity and Spoofing
Not every order in the book is intended to be executed. Spoofing is an illegal or manipulative tactic where market actors place massive fake orders (buy or sell walls) to create a false impression of support or resistance. As soon as the market price approaches these orders, the manipulator cancels them. Expecting a buy wall to act as a guaranteed price floor can lead to costly mistakes.
#### 2. Fragmented Liquidity
Unlike traditional financial markets that rely on centralized clearinghouses, the cryptocurrency landscape is highly fragmented. Liquidity is split across dozens of centralized exchanges, decentralized exchanges, and over-the-counter desks. A token might exhibit deep order book liquidity on one exchange venue while remaining virtually illiquid on another. Looking at depth on a single platform provides only a partial view of global liquidity.
#### 3. Rapid Order Cancellation During Volatility
During sharp macro announcements or sudden price breakouts, limit order books can empty within milliseconds. Limit orders placed by liquidity providers represent commitment; when extreme volatility hits, market makers quickly cancel their orders to avoid being caught on the wrong side of a major trend. Consequently, depth that exists during quiet market conditions often disappears when you need it most.
### Practical Checklist for Intermediate Traders
1. **Match Order Type to Liquidity:** For large trade sizes relative to the asset’s order book depth, utilize limit orders, Time-Weighted Average Price (TWAP) algorithms, or scale into positions gradually rather than relying on standard market orders.
2. **Monitor 1% and 2% Depth Metrics:** Instead of focusing only on the spot price, monitor how much capital is required to move the price by 1% or 2% in either direction. This metric provides a far clearer picture of true market resilience.
3. **Beware of Single Wall Signals:** Avoid using large order book walls as isolated entry or exit triggers. Treat them as dynamic indicators that require confirmation from volume and price action tools.
4. **Verify Venue-Specific Depth:** Always verify execution depth specifically on the exchange venue where you intend to place your order.
### Conclusion
Market depth is the foundational structural layer that governs price formation and trade execution across crypto markets. By moving beyond historic price action and mastering the mechanics of order books, bid-ask spreads, and liquidity distribution, traders can protect themselves from unnecessary slippage, avoid market manipulation traps, and execute orders with far greater precision.
#CryptoEducation #TradingTips #MarketDepth
To understand how price movements actually occur under the hood, traders must look beyond price candles and evaluate market depth. Market depth offers a real-time window into pending buy and sell interest across different price levels. Understanding this visual and mathematical landscape is a crucial step for intermediate traders looking to refine their execution, manage trading costs, and avoid common market execution traps.
### What is Market Depth?
At its core, market depth refers to the market's ability to absorb relatively large market orders without causing significant price fluctuations. It represents the aggregate volume of outstanding limit orders positioned on both sides of an asset’s current market price.
Every centralized exchange operates an electronic matching engine powered by an order book. This order book contains two main sides:
1. **The Bid Side (Buyers):** A list of traders offering to purchase the asset at specific prices below the current market price.
2. **The Ask or Offer Side (Sellers):** A list of traders offering to sell the asset at specific prices above the current market price.
Market depth visualizes these limit orders, typically through a depth chart or an aggregated order book ladder. The horizontal axis represents price levels, while the vertical axis (or cumulative volume total) shows the quantity of the asset available at those price points.
### Market Volume vs. Market Depth: A Key Distinction
It is easy to confuse trading volume with market depth, yet they measure fundamentally different mechanics:
* **Trading Volume** is a backward-looking metric. It measures the total amount of an asset that has successfully changed hands over a given period (such as 24 hours). High historical volume indicates robust past activity, but it does not guarantee immediate liquidity.
* **Market Depth** is a present-moment metric. It measures the volume of orders currently sitting in the order book, waiting to be matched.
An asset might boast millions of dollars in 24-hour volume due to rapid back-and-forth trading, but if its active order book contains very few resting orders near the spot price, a single large order can easily push the price up or down significantly.
### Core Components of Order Book Depth
To read market depth effectively, traders must understand three essential elements:
#### 1. The Bid-Ask Spread
The distance between the highest price a buyer is willing to pay (best bid) and the lowest price a seller is willing to accept (best ask) is called the spread. Tight spreads generally signal high market depth and liquid conditions, while wide spreads suggest lower liquidity and higher trading friction.
#### 2. Market Slippage
When you execute a market order, the exchange matches your order against existing limit orders in the book. If your order size exceeds the volume available at the best bid or ask, the matching engine continues filling the remainder of your order at progressively worse prices deeper into the book. This difference between your expected fill price and your actual average execution price is known as slippage.
#### 3. Depth Walls (Buy and Sell Walls)
When viewing a visual market depth chart, you will frequently notice steep vertical steps on either side of the price curve. These are known as order walls.
* **Buy Wall:** Occurs when a massive concentration of buy limit orders exists at a specific price level. This creates a psychological and financial barrier, as sellers must exhaust all that buy liquidity before the price can push lower.
* **Sell Wall:** Occurs when a massive concentration of sell limit orders sits at a specific price. Buyers must purchase all available inventory at that level before the price can climb higher.
### Practical Example: The Mechanics of Execution
To understand how depth affects your trade, consider a practical scenario involving an asset traded on an exchange.
Imagine Asset X is currently trading at $100.00. You decide to place a market buy order for 1,000 units of Asset X.
Let's examine two different market depth scenarios:
**Scenario A: Deep Market Depth**
* Best Ask: $100.05 (500 units available)
* Second Ask: $100.10 (500 units available)
* **Result:** Your order is filled in two parts—500 units at $100.05 and 500 units at $100.10. Your average execution price is $100.075. Slippage is negligible (less than 0.08%).
**Scenario B: Thin Market Depth**
* Best Ask: $100.05 (100 units available)
* Second Ask: $101.00 (200 units available)
* Third Ask: $103.00 (700 units available)
* **Result:** Your order matches 100 units at $100.05, 200 units at $101.00, and 700 units at $103.00. Your average execution price jumps to approximately $102.30. You suffered over 2.3% in slippage simply due to poor market depth.
This example highlights why market order execution on low-depth assets can severely impair overall trading performance, even if your directional bias was correct.
### Advanced Order Book Dynamics
Market depth is not static; it is a dynamic environment driven by automated market makers, institutional algorithmic execution engines, and retail participants.
* **Algorithmic Market Making:** Automated programs continuously quote buy and sell prices, capturing the bid-ask spread while providing liquidity to the order book. When market volatility spikes, these algorithms often retreat or widen their spreads to mitigate risk, causing market depth to evaporate rapidly.
* **Iceberg Orders:** Large traders often wish to hide their true execution intentions to prevent the market from moving against them. They use iceberg orders, which divide a massive order into small visible portions. As soon as one visible chunk is filled, the system automatically posts the next chunk. Therefore, the visible order book depth may not always represent the full extent of true market liquidity.
### Risks, Limitations, and Misconceptions
While evaluating order book depth provides valuable insights, relying on static depth snapshots carries inherent risks:
#### 1. Phantom Liquidity and Spoofing
Not every order in the book is intended to be executed. Spoofing is an illegal or manipulative tactic where market actors place massive fake orders (buy or sell walls) to create a false impression of support or resistance. As soon as the market price approaches these orders, the manipulator cancels them. Expecting a buy wall to act as a guaranteed price floor can lead to costly mistakes.
#### 2. Fragmented Liquidity
Unlike traditional financial markets that rely on centralized clearinghouses, the cryptocurrency landscape is highly fragmented. Liquidity is split across dozens of centralized exchanges, decentralized exchanges, and over-the-counter desks. A token might exhibit deep order book liquidity on one exchange venue while remaining virtually illiquid on another. Looking at depth on a single platform provides only a partial view of global liquidity.
#### 3. Rapid Order Cancellation During Volatility
During sharp macro announcements or sudden price breakouts, limit order books can empty within milliseconds. Limit orders placed by liquidity providers represent commitment; when extreme volatility hits, market makers quickly cancel their orders to avoid being caught on the wrong side of a major trend. Consequently, depth that exists during quiet market conditions often disappears when you need it most.
### Practical Checklist for Intermediate Traders
1. **Match Order Type to Liquidity:** For large trade sizes relative to the asset’s order book depth, utilize limit orders, Time-Weighted Average Price (TWAP) algorithms, or scale into positions gradually rather than relying on standard market orders.
2. **Monitor 1% and 2% Depth Metrics:** Instead of focusing only on the spot price, monitor how much capital is required to move the price by 1% or 2% in either direction. This metric provides a far clearer picture of true market resilience.
3. **Beware of Single Wall Signals:** Avoid using large order book walls as isolated entry or exit triggers. Treat them as dynamic indicators that require confirmation from volume and price action tools.
4. **Verify Venue-Specific Depth:** Always verify execution depth specifically on the exchange venue where you intend to place your order.
### Conclusion
Market depth is the foundational structural layer that governs price formation and trade execution across crypto markets. By moving beyond historic price action and mastering the mechanics of order books, bid-ask spreads, and liquidity distribution, traders can protect themselves from unnecessary slippage, avoid market manipulation traps, and execute orders with far greater precision.
#CryptoEducation #TradingTips #MarketDepth
63
Beyond the Candlestick: Mastering Market Depth and Order Book DynamicsWhen most market participants evaluate a cryptocurrency, their analysis begins and ends with a standard price chart. They look at candlestick patterns, moving averages, and technical indicators like the Relative Strength Index. While price charts tell a clear story about historical settlements—where buyers and sellers met in the past—they offer very little visibility into what is happening under the surface right now.
To understand where price might head next, or to execute trades efficiently without incurring unnecessary costs, traders must look at market depth. Market depth reveals the raw supply and demand structure of an asset across various price levels before transactions take place.
Understanding market depth allows intermediate traders to move beyond simple technical analysis, giving them direct insight into market liquidity, order book imbalances, and execution dynamics.
---
### The Anatomy of an Order Book
At the heart of every centralized exchange is the central limit order book (CLOB). The order book is a real-time, constantly updating ledger of open, unexecuted orders placed by market participants. It is divided into two primary sides:
1. **Bids (Buy Side):** Represents all resting limit orders from buyers who wish to purchase the asset at prices below the current trading price. Bids are ranked from highest price to lowest price.
2. **Asks or Offers (Sell Side):** Represents all resting limit orders from sellers who wish to sell the asset at prices above the current trading price. Asks are ranked from lowest price to highest price.
The point where the highest bid meets the lowest ask is known as the **mid-price**, and the difference between these two points is called the **bid-ask spread**.
In highly liquid markets like major pairs for Bitcoin or Ethereum, the bid-ask spread is typically very narrow—often just a fraction of a cent or a fraction of a percentage point. In illiquid markets or low-cap altcoins, the spread can be significantly wider, meaning traders immediately face a higher implicit cost just to enter or exit a position.
Order types directly dictate how depth is formed and consumed:
* **Limit Orders:** Add liquidity to the order book. They sit on the book waiting to be matched, forming market depth.
* **Market Orders:** Remove liquidity from the order book. They execute instantly against the best available resting limit orders.
---
### Visualizing Market Depth
Market depth is often visualized through a **Depth Chart**, which plots cumulative order volume against price levels.
The horizontal axis (X-axis) displays price levels, while the vertical axis (Y-axis) displays the total aggregate volume of resting orders up to that price point.
* **The Bid Side (Green):** Slopes downward to the left as prices decrease. A steep vertical rise on the bid side represents a "buy wall"—a concentration of buy orders at a specific price point.
* **The Ask Side (Red):** Slopes upward to the right as prices increase. A steep vertical rise on the ask side represents a "sell wall"—a concentration of sell orders at a given price level.
While buy and sell walls are often viewed by beginners as solid support and resistance levels, experienced traders view them with nuance. Large orders can act as psychological barriers, but they can also be canceled instantly by automated trading algorithms before price ever hits them.
---
### Execution Dynamics: Slippage and Market Impact
One of the most practical applications of market depth analysis is calculating potential execution costs before placing a trade. When a trader submits a large market order, the order book match engine fills it sequentially through the available limit orders until the requested quantity is complete.
If the volume requested exceeds the available volume at the best bid or ask, the order sweeps through multiple price levels. This phenomenon is known as **slippage**.
#### A Practical Example of Slippage
Imagine a scenario where a trader wants to execute an immediate market buy for **100 Bitcoin**. The current order book ask side looks as follows:
* **Level 1:** 10 Bitcoin available at $65,000
* **Level 2:** 20 Bitcoin available at $65,100
* **Level 3:** 30 Bitcoin available at $65,200
* **Level 4:** 40 Bitcoin available at $65,500
If the trader submits a market buy order for 100 Bitcoin, execution occurs across all four levels:
1. Fills 10 Bitcoin at $65,000 = $650,000
2. Fills 20 Bitcoin at $65,100 = $1,302,000
3. Fills 30 Bitcoin at $65,200 = $1,956,000
4. Fills 40 Bitcoin at $65,500 = $2,620,000
* **Total Cost:** $6,528,000
* **Average Fill Price:** $65,280 per Bitcoin
Although the initial visible ask price was $65,000, the effective average price paid was $65,280. The trader experienced $280 per coin (roughly 0.43%) in negative slippage due to insufficient market depth at the top of the order book.
Understanding market depth helps traders choose the correct execution strategy—such as breaking large orders into smaller chunks over time or using algorithmic limit orders—to minimize market impact.
---
### Order Book Imbalance (OBI)
Another key metric derived from market depth is **Order Book Imbalance (OBI)**. OBI measures the relative weight of buying pressure versus selling pressure within a specific distance (e.g., 1% or 2%) from the mid-price.
The formula can be expressed conceptually as:
$$\text{OBI} = \frac{\text{Total Bid Volume} - \text{Total Ask Volume}}{\text{Total Bid Volume} + \text{Total Ask Volume}}$$
* A positive value approaching +1 indicates significant heavy bid depth relative to ask depth, suggesting upward pressure.
* A negative value approaching -1 indicates heavy ask depth relative to bid depth, suggesting downward pressure.
Quantitative traders frequently track OBI across short timeframes to gauge institutional sentiment and predict near-term order flow direction.
---
### Illusions in the Book: Manipulations and Hidden Orders
While market depth provides valuable insights, relying on raw order book data without context can be dangerous. Order books are dynamic, public, and open to manipulation.
1. **Spoofing:** This occurs when a large player places massive limit orders far enough from the current price to avoid immediate execution, purely to create the visual illusion of strong support or resistance. Once smaller market participants react to this artificial "wall," the spoofer cancels the order before it gets filled.
2. **Iceberg Orders:** Institutional traders looking to accumulate or distribute large positions without altering market sentiment often use iceberg orders. An iceberg order splits a massive position into tiny visible limit orders. Once one small piece is executed, the system automatically posts the next piece. Consequently, a price level that appears to have low depth may actually contain thousands of coins waiting to be absorbed.
3. **Fragmented Depth:** A single exchange only displays its own order book. True global depth is fragmented across multiple centralized and decentralized trading venues. A wall on one platform might easily be arbitrage-traded away if another platform experiences opposite pressure.
---
### Practical Guidelines for Intermediate Traders
To effectively integrate market depth into your operational framework, consider these best practices:
* **Evaluate Depth Relative to Position Size:** Before taking a trade on an altcoin, check the total aggregate depth within 1% to 2% of the mid-price. Ensure your intended order size does not exceed a small fraction of that available depth to prevent self-inflicted slippage.
* **Look for Depth Clusters for Limit Placements:** If you are placing limit orders, aim to place them slightly ahead of major depth clusters (buy/sell walls) rather than behind them. This increases the likelihood that your order fills before the depth is exhausted or pulled.
* **Combine Depth with Volume Delta:** Never use market depth in isolation. Pair depth readings with cumulative volume delta (CVD) to confirm whether large resting orders are actually being filled or simply being canceled when price approaches.
---
### Risks and Limitations
Analyzing market depth carries distinct limitations that every trader must respect:
* **Rapid Cancellations:** Limit orders are non-binding. Algorithms can insert or pull thousands of orders in milliseconds during high-volatility events.
* **Off-Book Liquidity:** Over-the-counter (OTC) desks and dark pools host substantial liquidity that never hits public order books, meaning the visible book does not represent total market capability.
* **Execution Risk:** Relying strictly on limit orders to avoid slippage creates execution risk—the market may move rapidly away from your entry level without filling your order, leaving you out of the trade entirely.
---
### Final Thoughts
Market depth offers a real-time window into the structural mechanics of price discovery. By learning how to interpret order books, bid-ask spreads, and depth imbalances, traders transition from purely reactive visual charting to a deeper understanding of market liquidity and execution logic. While depth data is constantly evolving and subject to tactical manipulation, incorporating order book context into your broader risk management framework is an essential step toward professional market participation.
#MarketDepth #OrderBook #CryptoTrading
Beyond the Candlestick: Mastering Market Depth and Order Book Dynamics
When most market participants evaluate a cryptocurrency, their analysis begins and ends with a standard price chart. They look at candlestick patterns, moving averages, and technical indicators like the Relative Strength Index. While price charts tell a clear story about historical settlements—where buyers and sellers met in the past—they offer very little visibility into what is happening under the surface right now.
To understand where price might head next, or to execute trades efficiently without incurring unnecessary costs, traders must look at market depth. Market depth reveals the raw supply and demand structure of an asset across various price levels before transactions take place.
Understanding market depth allows intermediate traders to move beyond simple technical analysis, giving them direct insight into market liquidity, order book imbalances, and execution dynamics.
---
### The Anatomy of an Order Book
At the heart of every centralized exchange is the central limit order book (CLOB). The order book is a real-time, constantly updating ledger of open, unexecuted orders placed by market participants. It is divided into two primary sides:
1. **Bids (Buy Side):** Represents all resting limit orders from buyers who wish to purchase the asset at prices below the current trading price. Bids are ranked from highest price to lowest price.
2. **Asks or Offers (Sell Side):** Represents all resting limit orders from sellers who wish to sell the asset at prices above the current trading price. Asks are ranked from lowest price to highest price.
The point where the highest bid meets the lowest ask is known as the **mid-price**, and the difference between these two points is called the **bid-ask spread**.
In highly liquid markets like major pairs for Bitcoin or Ethereum, the bid-ask spread is typically very narrow—often just a fraction of a cent or a fraction of a percentage point. In illiquid markets or low-cap altcoins, the spread can be significantly wider, meaning traders immediately face a higher implicit cost just to enter or exit a position.
Order types directly dictate how depth is formed and consumed:
* **Limit Orders:** Add liquidity to the order book. They sit on the book waiting to be matched, forming market depth.
* **Market Orders:** Remove liquidity from the order book. They execute instantly against the best available resting limit orders.
---
### Visualizing Market Depth
Market depth is often visualized through a **Depth Chart**, which plots cumulative order volume against price levels.
The horizontal axis (X-axis) displays price levels, while the vertical axis (Y-axis) displays the total aggregate volume of resting orders up to that price point.
* **The Bid Side (Green):** Slopes downward to the left as prices decrease. A steep vertical rise on the bid side represents a "buy wall"—a concentration of buy orders at a specific price point.
* **The Ask Side (Red):** Slopes upward to the right as prices increase. A steep vertical rise on the ask side represents a "sell wall"—a concentration of sell orders at a given price level.
While buy and sell walls are often viewed by beginners as solid support and resistance levels, experienced traders view them with nuance. Large orders can act as psychological barriers, but they can also be canceled instantly by automated trading algorithms before price ever hits them.
---
### Execution Dynamics: Slippage and Market Impact
One of the most practical applications of market depth analysis is calculating potential execution costs before placing a trade. When a trader submits a large market order, the order book match engine fills it sequentially through the available limit orders until the requested quantity is complete.
If the volume requested exceeds the available volume at the best bid or ask, the order sweeps through multiple price levels. This phenomenon is known as **slippage**.
#### A Practical Example of Slippage
Imagine a scenario where a trader wants to execute an immediate market buy for **100 Bitcoin**. The current order book ask side looks as follows:
* **Level 1:** 10 Bitcoin available at $65,000
* **Level 2:** 20 Bitcoin available at $65,100
* **Level 3:** 30 Bitcoin available at $65,200
* **Level 4:** 40 Bitcoin available at $65,500
If the trader submits a market buy order for 100 Bitcoin, execution occurs across all four levels:
1. Fills 10 Bitcoin at $65,000 = $650,000
2. Fills 20 Bitcoin at $65,100 = $1,302,000
3. Fills 30 Bitcoin at $65,200 = $1,956,000
4. Fills 40 Bitcoin at $65,500 = $2,620,000
* **Total Cost:** $6,528,000
* **Average Fill Price:** $65,280 per Bitcoin
Although the initial visible ask price was $65,000, the effective average price paid was $65,280. The trader experienced $280 per coin (roughly 0.43%) in negative slippage due to insufficient market depth at the top of the order book.
Understanding market depth helps traders choose the correct execution strategy—such as breaking large orders into smaller chunks over time or using algorithmic limit orders—to minimize market impact.
---
### Order Book Imbalance (OBI)
Another key metric derived from market depth is **Order Book Imbalance (OBI)**. OBI measures the relative weight of buying pressure versus selling pressure within a specific distance (e.g., 1% or 2%) from the mid-price.
The formula can be expressed conceptually as:
$$\text{OBI} = \frac{\text{Total Bid Volume} - \text{Total Ask Volume}}{\text{Total Bid Volume} + \text{Total Ask Volume}}$$
* A positive value approaching +1 indicates significant heavy bid depth relative to ask depth, suggesting upward pressure.
* A negative value approaching -1 indicates heavy ask depth relative to bid depth, suggesting downward pressure.
Quantitative traders frequently track OBI across short timeframes to gauge institutional sentiment and predict near-term order flow direction.
---
### Illusions in the Book: Manipulations and Hidden Orders
While market depth provides valuable insights, relying on raw order book data without context can be dangerous. Order books are dynamic, public, and open to manipulation.
1. **Spoofing:** This occurs when a large player places massive limit orders far enough from the current price to avoid immediate execution, purely to create the visual illusion of strong support or resistance. Once smaller market participants react to this artificial "wall," the spoofer cancels the order before it gets filled.
2. **Iceberg Orders:** Institutional traders looking to accumulate or distribute large positions without altering market sentiment often use iceberg orders. An iceberg order splits a massive position into tiny visible limit orders. Once one small piece is executed, the system automatically posts the next piece. Consequently, a price level that appears to have low depth may actually contain thousands of coins waiting to be absorbed.
3. **Fragmented Depth:** A single exchange only displays its own order book. True global depth is fragmented across multiple centralized and decentralized trading venues. A wall on one platform might easily be arbitrage-traded away if another platform experiences opposite pressure.
---
### Practical Guidelines for Intermediate Traders
To effectively integrate market depth into your operational framework, consider these best practices:
* **Evaluate Depth Relative to Position Size:** Before taking a trade on an altcoin, check the total aggregate depth within 1% to 2% of the mid-price. Ensure your intended order size does not exceed a small fraction of that available depth to prevent self-inflicted slippage.
* **Look for Depth Clusters for Limit Placements:** If you are placing limit orders, aim to place them slightly ahead of major depth clusters (buy/sell walls) rather than behind them. This increases the likelihood that your order fills before the depth is exhausted or pulled.
* **Combine Depth with Volume Delta:** Never use market depth in isolation. Pair depth readings with cumulative volume delta (CVD) to confirm whether large resting orders are actually being filled or simply being canceled when price approaches.
---
### Risks and Limitations
Analyzing market depth carries distinct limitations that every trader must respect:
* **Rapid Cancellations:** Limit orders are non-binding. Algorithms can insert or pull thousands of orders in milliseconds during high-volatility events.
* **Off-Book Liquidity:** Over-the-counter (OTC) desks and dark pools host substantial liquidity that never hits public order books, meaning the visible book does not represent total market capability.
* **Execution Risk:** Relying strictly on limit orders to avoid slippage creates execution risk—the market may move rapidly away from your entry level without filling your order, leaving you out of the trade entirely.
---
### Final Thoughts
Market depth offers a real-time window into the structural mechanics of price discovery. By learning how to interpret order books, bid-ask spreads, and depth imbalances, traders transition from purely reactive visual charting to a deeper understanding of market liquidity and execution logic. While depth data is constantly evolving and subject to tactical manipulation, incorporating order book context into your broader risk management framework is an essential step toward professional market participation.
#MarketDepth #OrderBook #CryptoTrading
To understand where price might head next, or to execute trades efficiently without incurring unnecessary costs, traders must look at market depth. Market depth reveals the raw supply and demand structure of an asset across various price levels before transactions take place.
Understanding market depth allows intermediate traders to move beyond simple technical analysis, giving them direct insight into market liquidity, order book imbalances, and execution dynamics.
---
### The Anatomy of an Order Book
At the heart of every centralized exchange is the central limit order book (CLOB). The order book is a real-time, constantly updating ledger of open, unexecuted orders placed by market participants. It is divided into two primary sides:
1. **Bids (Buy Side):** Represents all resting limit orders from buyers who wish to purchase the asset at prices below the current trading price. Bids are ranked from highest price to lowest price.
2. **Asks or Offers (Sell Side):** Represents all resting limit orders from sellers who wish to sell the asset at prices above the current trading price. Asks are ranked from lowest price to highest price.
The point where the highest bid meets the lowest ask is known as the **mid-price**, and the difference between these two points is called the **bid-ask spread**.
In highly liquid markets like major pairs for Bitcoin or Ethereum, the bid-ask spread is typically very narrow—often just a fraction of a cent or a fraction of a percentage point. In illiquid markets or low-cap altcoins, the spread can be significantly wider, meaning traders immediately face a higher implicit cost just to enter or exit a position.
Order types directly dictate how depth is formed and consumed:
* **Limit Orders:** Add liquidity to the order book. They sit on the book waiting to be matched, forming market depth.
* **Market Orders:** Remove liquidity from the order book. They execute instantly against the best available resting limit orders.
---
### Visualizing Market Depth
Market depth is often visualized through a **Depth Chart**, which plots cumulative order volume against price levels.
The horizontal axis (X-axis) displays price levels, while the vertical axis (Y-axis) displays the total aggregate volume of resting orders up to that price point.
* **The Bid Side (Green):** Slopes downward to the left as prices decrease. A steep vertical rise on the bid side represents a "buy wall"—a concentration of buy orders at a specific price point.
* **The Ask Side (Red):** Slopes upward to the right as prices increase. A steep vertical rise on the ask side represents a "sell wall"—a concentration of sell orders at a given price level.
While buy and sell walls are often viewed by beginners as solid support and resistance levels, experienced traders view them with nuance. Large orders can act as psychological barriers, but they can also be canceled instantly by automated trading algorithms before price ever hits them.
---
### Execution Dynamics: Slippage and Market Impact
One of the most practical applications of market depth analysis is calculating potential execution costs before placing a trade. When a trader submits a large market order, the order book match engine fills it sequentially through the available limit orders until the requested quantity is complete.
If the volume requested exceeds the available volume at the best bid or ask, the order sweeps through multiple price levels. This phenomenon is known as **slippage**.
#### A Practical Example of Slippage
Imagine a scenario where a trader wants to execute an immediate market buy for **100 Bitcoin**. The current order book ask side looks as follows:
* **Level 1:** 10 Bitcoin available at $65,000
* **Level 2:** 20 Bitcoin available at $65,100
* **Level 3:** 30 Bitcoin available at $65,200
* **Level 4:** 40 Bitcoin available at $65,500
If the trader submits a market buy order for 100 Bitcoin, execution occurs across all four levels:
1. Fills 10 Bitcoin at $65,000 = $650,000
2. Fills 20 Bitcoin at $65,100 = $1,302,000
3. Fills 30 Bitcoin at $65,200 = $1,956,000
4. Fills 40 Bitcoin at $65,500 = $2,620,000
* **Total Cost:** $6,528,000
* **Average Fill Price:** $65,280 per Bitcoin
Although the initial visible ask price was $65,000, the effective average price paid was $65,280. The trader experienced $280 per coin (roughly 0.43%) in negative slippage due to insufficient market depth at the top of the order book.
Understanding market depth helps traders choose the correct execution strategy—such as breaking large orders into smaller chunks over time or using algorithmic limit orders—to minimize market impact.
---
### Order Book Imbalance (OBI)
Another key metric derived from market depth is **Order Book Imbalance (OBI)**. OBI measures the relative weight of buying pressure versus selling pressure within a specific distance (e.g., 1% or 2%) from the mid-price.
The formula can be expressed conceptually as:
$$\text{OBI} = \frac{\text{Total Bid Volume} - \text{Total Ask Volume}}{\text{Total Bid Volume} + \text{Total Ask Volume}}$$
* A positive value approaching +1 indicates significant heavy bid depth relative to ask depth, suggesting upward pressure.
* A negative value approaching -1 indicates heavy ask depth relative to bid depth, suggesting downward pressure.
Quantitative traders frequently track OBI across short timeframes to gauge institutional sentiment and predict near-term order flow direction.
---
### Illusions in the Book: Manipulations and Hidden Orders
While market depth provides valuable insights, relying on raw order book data without context can be dangerous. Order books are dynamic, public, and open to manipulation.
1. **Spoofing:** This occurs when a large player places massive limit orders far enough from the current price to avoid immediate execution, purely to create the visual illusion of strong support or resistance. Once smaller market participants react to this artificial "wall," the spoofer cancels the order before it gets filled.
2. **Iceberg Orders:** Institutional traders looking to accumulate or distribute large positions without altering market sentiment often use iceberg orders. An iceberg order splits a massive position into tiny visible limit orders. Once one small piece is executed, the system automatically posts the next piece. Consequently, a price level that appears to have low depth may actually contain thousands of coins waiting to be absorbed.
3. **Fragmented Depth:** A single exchange only displays its own order book. True global depth is fragmented across multiple centralized and decentralized trading venues. A wall on one platform might easily be arbitrage-traded away if another platform experiences opposite pressure.
---
### Practical Guidelines for Intermediate Traders
To effectively integrate market depth into your operational framework, consider these best practices:
* **Evaluate Depth Relative to Position Size:** Before taking a trade on an altcoin, check the total aggregate depth within 1% to 2% of the mid-price. Ensure your intended order size does not exceed a small fraction of that available depth to prevent self-inflicted slippage.
* **Look for Depth Clusters for Limit Placements:** If you are placing limit orders, aim to place them slightly ahead of major depth clusters (buy/sell walls) rather than behind them. This increases the likelihood that your order fills before the depth is exhausted or pulled.
* **Combine Depth with Volume Delta:** Never use market depth in isolation. Pair depth readings with cumulative volume delta (CVD) to confirm whether large resting orders are actually being filled or simply being canceled when price approaches.
---
### Risks and Limitations
Analyzing market depth carries distinct limitations that every trader must respect:
* **Rapid Cancellations:** Limit orders are non-binding. Algorithms can insert or pull thousands of orders in milliseconds during high-volatility events.
* **Off-Book Liquidity:** Over-the-counter (OTC) desks and dark pools host substantial liquidity that never hits public order books, meaning the visible book does not represent total market capability.
* **Execution Risk:** Relying strictly on limit orders to avoid slippage creates execution risk—the market may move rapidly away from your entry level without filling your order, leaving you out of the trade entirely.
---
### Final Thoughts
Market depth offers a real-time window into the structural mechanics of price discovery. By learning how to interpret order books, bid-ask spreads, and depth imbalances, traders transition from purely reactive visual charting to a deeper understanding of market liquidity and execution logic. While depth data is constantly evolving and subject to tactical manipulation, incorporating order book context into your broader risk management framework is an essential step toward professional market participation.
#MarketDepth #OrderBook #CryptoTrading
115
Demystifying Market Depth: How to Read Order Books and Avoid Costly SlippageWhen entering the world of cryptocurrency trading, most beginners start by looking at price charts. Line charts and candlestick patterns provide a visual history of where an asset’s price has been, but they offer little insight into where the market is going or what is happening behind the scenes. To understand how prices actually move in real time, intermediate traders must look beyond past candles and study the underlying engine of the market: market depth.
Market depth represents the market's ability to sustain large market orders without significantly affecting the asset's price. It is a real-time reflection of supply and demand, displayed through the order book. By understanding market depth, traders can better evaluate liquidity, anticipate short-term price movements, calculate execution costs, and protect themselves against execution traps like severe slippage.
---
### 1. What Is Market Depth and How Does the Order Book Work?
At any given moment, a centralized crypto exchange matches buyers and sellers using an automated system called a matching engine. Traders who want to transact at a specific price place **limit orders**, which sit on the exchange’s **order book** until another participant accepts them.
The order book is split into two primary sides:
* **Bids (Buy Orders):** Located on the left or bottom of the order book, bids represent buyers willing to purchase the asset at a specified price or lower. Bids are listed in descending order, with the highest bid sitting at the very top.
* **Asks / Offers (Sell Orders):** Located on the right or top of the order book, asks represent sellers willing to part with their assets at a specified price or higher. Asks are listed in ascending order, with the lowest ask price at the bottom.
The gap between the highest bid price and the lowest ask price is known as the **bid-ask spread**.
A tight spread (e.g., a few cents on major assets like Bitcoin or Ethereum) generally indicates high liquidity and a competitive market. A wide spread indicates low liquidity, where executing trades can become significantly more expensive.
**Market depth** measures the cumulative volume of limit orders standing at various price levels away from the current spread. A "deep" market contains a high volume of buy and sell orders across many price levels, whereas a "shallow" market has very few orders waiting in the book.
---
### 2. Practical Scenario: Understanding Slippage and Price Impact
To appreciate why market depth matters, consider what happens when a trader executes a **market order**. Unlike a limit order, a market order instructs the exchange to execute the trade immediately at the best available current price.
If you place a large market buy order, the exchange fills your order by consuming the available ask orders in sequence, starting from the lowest ask price and moving upward until the entire order amount is satisfied.
#### A Walkthrough Example:
Imagine you want to buy **10 Bitcoin** immediately using a market order.
The exchange’s order book shows the following available asks:
* **Level 1:** 2 Bitcoin available at $65,000
* **Level 2:** 3 Bitcoin available at $65,100
* **Level 3:** 5 Bitcoin available at $65,300
When your order hits the matching engine, the execution occurs as follows:
1. 2 Bitcoin are bought at $65,000 (Total: $130,000)
2. 3 Bitcoin are bought at $65,100 (Total: $195,300)
3. 5 Bitcoin are bought at $65,300 (Total: $326,500)
**Results:**
* **Total cost:** $651,800
* **Average fill price:** $65,180 per Bitcoin
* **Slippage:** You expected to buy at the top ask price of $65,000, but because the market lacked enough depth at that single level, your order pushed the market price up, causing $180 per coin in price impact (slippage).
In a deep market, Level 1 might have contained 100 Bitcoin at $65,000, allowing your entire trade to execute instantly at a single price without any slippage. In a shallow market, a single large order can easily wipe out multiple order levels, pushing the price far beyond expectations.
---
### 3. Visualizing Depth: Reading the Depth Chart
Most major exchanges provide a graphical representation of the order book known as the **Depth Chart**.
The depth chart displays price on the horizontal axis (X-axis) and cumulative order volume on the vertical axis (Y-axis). It features two opposing slopes:
* **Green Side (Bids):** Represents total cumulative buy demand below the market price.
* **Red Side (Asks):** Represents total cumulative sell supply above the market price.
#### Order Book Walls
When looking at a depth chart, you may occasionally see steep vertical "cliffs" or "walls" on either side.
* **Buy Wall:** A massive concentration of buy orders at a specific price level. This signals strong interest from buyers to prevent the price from falling below that level in the short term.
* **Sell Wall:** A massive concentration of sell orders at a specific price level. This indicates a supply bottleneck that may block the price from moving higher until that entire wall is consumed.
While order walls look like clear support or resistance levels, intermediate traders must treat them with caution.
---
### 4. Advanced Order Book Mechanics: Illusion vs. Reality
Relying purely on visible market depth carries risks because the order book is dynamic and subject to strategic manipulation. What appears on the screen is not always a guarantee of execution.
#### A. Spoofing
Spoofing occurs when a trader or automated bot places large limit orders (buy or sell walls) with no intention of letting them get filled. The goal is to create a false impression of market demand or heavy resistance, tricking other traders into buying or selling ahead of the wall. Once the market price approaches the fake wall, the spoofer quickly cancels the order before execution.
#### B. Iceberg Orders
Institutional participants trading large volumes often avoid putting their full size into the public order book, as doing so would alert the market and push prices against them. Instead, they use **iceberg orders**. An iceberg order splits a massive order into smaller visible pieces. As soon as one piece gets filled, another piece automatically populates at the same price level. Consequently, an order book that appears shallow might actually contain hidden, deep liquidity at specific levels.
#### C. Algorithmic Market Makers
High-frequency trading algorithms continuously adjust their bids and asks based on order flow, volatility, and external market signals. During periods of extreme market stress, market-making algorithms may pull their orders entirely to mitigate risk, causing market depth to evaporate instantly right when liquidity is needed most.
---
### 5. Risks, Limitations, and Best Practices
While analyzing market depth provides a distinct advantage, traders should keep several limitations in mind:
1. **Liquidity Fragmentation:** Crypto trading takes place across dozens of distinct centralized exchanges and decentralized platforms. Checking depth on a single exchange only gives you a partial picture of total global market liquidity.
2. **Order Book Latency:** High-volatility events cause order books to change in milliseconds. Manual traders looking at visual depth charts often see outdated information compared to API-connected algorithmic traders.
3. **Flash Crashes in Low-Depth Assets:** Small-cap altcoins frequently suffer from paper-thin depth. Executing market orders or trigger-based stop-loss orders in low-depth markets can trigger severe liquidation cascades and catastrophic slippage.
#### Actionable Risk Management Strategies:
* **Use Limit and Post-Only Orders:** To eliminate slippage, default to limit orders. Using a "Post-Only" feature ensures your order acts strictly as a maker order, placing liquidity into the book rather than taking it out.
* **Check Market Depth Before Trade Sizing:** Before executing a substantial position, check the order book's depth up to 1% or 2% away from the spot price to calculate potential price impact.
* **Break Up Large Orders:** If trading a large amount relative to the available liquidity, split your transaction into smaller algorithmic limit trades spaced out over time (e.g., using Time-Weighted Average Price or TWAP execution strategies).
---
### Final Thoughts
Market depth is a foundational concept that bridges simple price charting and advanced market microstructure. Understanding how order books function allows you to assess the real-time liquidity of an asset, avoid unnecessary trade execution fees caused by slippage, and recognize when order book walls may be deceiving.
By incorporating order book analysis into your standard trading routine alongside strict risk controls, you gain a clearer view of true market conditions and can make significantly more disciplined trading decisions.
#CryptoEducation #MarketDepth #TradingMechanics
Demystifying Market Depth: How to Read Order Books and Avoid Costly Slippage
When entering the world of cryptocurrency trading, most beginners start by looking at price charts. Line charts and candlestick patterns provide a visual history of where an asset’s price has been, but they offer little insight into where the market is going or what is happening behind the scenes. To understand how prices actually move in real time, intermediate traders must look beyond past candles and study the underlying engine of the market: market depth.
Market depth represents the market's ability to sustain large market orders without significantly affecting the asset's price. It is a real-time reflection of supply and demand, displayed through the order book. By understanding market depth, traders can better evaluate liquidity, anticipate short-term price movements, calculate execution costs, and protect themselves against execution traps like severe slippage.
---
### 1. What Is Market Depth and How Does the Order Book Work?
At any given moment, a centralized crypto exchange matches buyers and sellers using an automated system called a matching engine. Traders who want to transact at a specific price place **limit orders**, which sit on the exchange’s **order book** until another participant accepts them.
The order book is split into two primary sides:
* **Bids (Buy Orders):** Located on the left or bottom of the order book, bids represent buyers willing to purchase the asset at a specified price or lower. Bids are listed in descending order, with the highest bid sitting at the very top.
* **Asks / Offers (Sell Orders):** Located on the right or top of the order book, asks represent sellers willing to part with their assets at a specified price or higher. Asks are listed in ascending order, with the lowest ask price at the bottom.
The gap between the highest bid price and the lowest ask price is known as the **bid-ask spread**.
A tight spread (e.g., a few cents on major assets like Bitcoin or Ethereum) generally indicates high liquidity and a competitive market. A wide spread indicates low liquidity, where executing trades can become significantly more expensive.
**Market depth** measures the cumulative volume of limit orders standing at various price levels away from the current spread. A "deep" market contains a high volume of buy and sell orders across many price levels, whereas a "shallow" market has very few orders waiting in the book.
---
### 2. Practical Scenario: Understanding Slippage and Price Impact
To appreciate why market depth matters, consider what happens when a trader executes a **market order**. Unlike a limit order, a market order instructs the exchange to execute the trade immediately at the best available current price.
If you place a large market buy order, the exchange fills your order by consuming the available ask orders in sequence, starting from the lowest ask price and moving upward until the entire order amount is satisfied.
#### A Walkthrough Example:
Imagine you want to buy **10 Bitcoin** immediately using a market order.
The exchange’s order book shows the following available asks:
* **Level 1:** 2 Bitcoin available at $65,000
* **Level 2:** 3 Bitcoin available at $65,100
* **Level 3:** 5 Bitcoin available at $65,300
When your order hits the matching engine, the execution occurs as follows:
1. 2 Bitcoin are bought at $65,000 (Total: $130,000)
2. 3 Bitcoin are bought at $65,100 (Total: $195,300)
3. 5 Bitcoin are bought at $65,300 (Total: $326,500)
**Results:**
* **Total cost:** $651,800
* **Average fill price:** $65,180 per Bitcoin
* **Slippage:** You expected to buy at the top ask price of $65,000, but because the market lacked enough depth at that single level, your order pushed the market price up, causing $180 per coin in price impact (slippage).
In a deep market, Level 1 might have contained 100 Bitcoin at $65,000, allowing your entire trade to execute instantly at a single price without any slippage. In a shallow market, a single large order can easily wipe out multiple order levels, pushing the price far beyond expectations.
---
### 3. Visualizing Depth: Reading the Depth Chart
Most major exchanges provide a graphical representation of the order book known as the **Depth Chart**.
The depth chart displays price on the horizontal axis (X-axis) and cumulative order volume on the vertical axis (Y-axis). It features two opposing slopes:
* **Green Side (Bids):** Represents total cumulative buy demand below the market price.
* **Red Side (Asks):** Represents total cumulative sell supply above the market price.
#### Order Book Walls
When looking at a depth chart, you may occasionally see steep vertical "cliffs" or "walls" on either side.
* **Buy Wall:** A massive concentration of buy orders at a specific price level. This signals strong interest from buyers to prevent the price from falling below that level in the short term.
* **Sell Wall:** A massive concentration of sell orders at a specific price level. This indicates a supply bottleneck that may block the price from moving higher until that entire wall is consumed.
While order walls look like clear support or resistance levels, intermediate traders must treat them with caution.
---
### 4. Advanced Order Book Mechanics: Illusion vs. Reality
Relying purely on visible market depth carries risks because the order book is dynamic and subject to strategic manipulation. What appears on the screen is not always a guarantee of execution.
#### A. Spoofing
Spoofing occurs when a trader or automated bot places large limit orders (buy or sell walls) with no intention of letting them get filled. The goal is to create a false impression of market demand or heavy resistance, tricking other traders into buying or selling ahead of the wall. Once the market price approaches the fake wall, the spoofer quickly cancels the order before execution.
#### B. Iceberg Orders
Institutional participants trading large volumes often avoid putting their full size into the public order book, as doing so would alert the market and push prices against them. Instead, they use **iceberg orders**. An iceberg order splits a massive order into smaller visible pieces. As soon as one piece gets filled, another piece automatically populates at the same price level. Consequently, an order book that appears shallow might actually contain hidden, deep liquidity at specific levels.
#### C. Algorithmic Market Makers
High-frequency trading algorithms continuously adjust their bids and asks based on order flow, volatility, and external market signals. During periods of extreme market stress, market-making algorithms may pull their orders entirely to mitigate risk, causing market depth to evaporate instantly right when liquidity is needed most.
---
### 5. Risks, Limitations, and Best Practices
While analyzing market depth provides a distinct advantage, traders should keep several limitations in mind:
1. **Liquidity Fragmentation:** Crypto trading takes place across dozens of distinct centralized exchanges and decentralized platforms. Checking depth on a single exchange only gives you a partial picture of total global market liquidity.
2. **Order Book Latency:** High-volatility events cause order books to change in milliseconds. Manual traders looking at visual depth charts often see outdated information compared to API-connected algorithmic traders.
3. **Flash Crashes in Low-Depth Assets:** Small-cap altcoins frequently suffer from paper-thin depth. Executing market orders or trigger-based stop-loss orders in low-depth markets can trigger severe liquidation cascades and catastrophic slippage.
#### Actionable Risk Management Strategies:
* **Use Limit and Post-Only Orders:** To eliminate slippage, default to limit orders. Using a "Post-Only" feature ensures your order acts strictly as a maker order, placing liquidity into the book rather than taking it out.
* **Check Market Depth Before Trade Sizing:** Before executing a substantial position, check the order book's depth up to 1% or 2% away from the spot price to calculate potential price impact.
* **Break Up Large Orders:** If trading a large amount relative to the available liquidity, split your transaction into smaller algorithmic limit trades spaced out over time (e.g., using Time-Weighted Average Price or TWAP execution strategies).
---
### Final Thoughts
Market depth is a foundational concept that bridges simple price charting and advanced market microstructure. Understanding how order books function allows you to assess the real-time liquidity of an asset, avoid unnecessary trade execution fees caused by slippage, and recognize when order book walls may be deceiving.
By incorporating order book analysis into your standard trading routine alongside strict risk controls, you gain a clearer view of true market conditions and can make significantly more disciplined trading decisions.
#CryptoEducation #MarketDepth #TradingMechanics
Market depth represents the market's ability to sustain large market orders without significantly affecting the asset's price. It is a real-time reflection of supply and demand, displayed through the order book. By understanding market depth, traders can better evaluate liquidity, anticipate short-term price movements, calculate execution costs, and protect themselves against execution traps like severe slippage.
---
### 1. What Is Market Depth and How Does the Order Book Work?
At any given moment, a centralized crypto exchange matches buyers and sellers using an automated system called a matching engine. Traders who want to transact at a specific price place **limit orders**, which sit on the exchange’s **order book** until another participant accepts them.
The order book is split into two primary sides:
* **Bids (Buy Orders):** Located on the left or bottom of the order book, bids represent buyers willing to purchase the asset at a specified price or lower. Bids are listed in descending order, with the highest bid sitting at the very top.
* **Asks / Offers (Sell Orders):** Located on the right or top of the order book, asks represent sellers willing to part with their assets at a specified price or higher. Asks are listed in ascending order, with the lowest ask price at the bottom.
The gap between the highest bid price and the lowest ask price is known as the **bid-ask spread**.
A tight spread (e.g., a few cents on major assets like Bitcoin or Ethereum) generally indicates high liquidity and a competitive market. A wide spread indicates low liquidity, where executing trades can become significantly more expensive.
**Market depth** measures the cumulative volume of limit orders standing at various price levels away from the current spread. A "deep" market contains a high volume of buy and sell orders across many price levels, whereas a "shallow" market has very few orders waiting in the book.
---
### 2. Practical Scenario: Understanding Slippage and Price Impact
To appreciate why market depth matters, consider what happens when a trader executes a **market order**. Unlike a limit order, a market order instructs the exchange to execute the trade immediately at the best available current price.
If you place a large market buy order, the exchange fills your order by consuming the available ask orders in sequence, starting from the lowest ask price and moving upward until the entire order amount is satisfied.
#### A Walkthrough Example:
Imagine you want to buy **10 Bitcoin** immediately using a market order.
The exchange’s order book shows the following available asks:
* **Level 1:** 2 Bitcoin available at $65,000
* **Level 2:** 3 Bitcoin available at $65,100
* **Level 3:** 5 Bitcoin available at $65,300
When your order hits the matching engine, the execution occurs as follows:
1. 2 Bitcoin are bought at $65,000 (Total: $130,000)
2. 3 Bitcoin are bought at $65,100 (Total: $195,300)
3. 5 Bitcoin are bought at $65,300 (Total: $326,500)
**Results:**
* **Total cost:** $651,800
* **Average fill price:** $65,180 per Bitcoin
* **Slippage:** You expected to buy at the top ask price of $65,000, but because the market lacked enough depth at that single level, your order pushed the market price up, causing $180 per coin in price impact (slippage).
In a deep market, Level 1 might have contained 100 Bitcoin at $65,000, allowing your entire trade to execute instantly at a single price without any slippage. In a shallow market, a single large order can easily wipe out multiple order levels, pushing the price far beyond expectations.
---
### 3. Visualizing Depth: Reading the Depth Chart
Most major exchanges provide a graphical representation of the order book known as the **Depth Chart**.
The depth chart displays price on the horizontal axis (X-axis) and cumulative order volume on the vertical axis (Y-axis). It features two opposing slopes:
* **Green Side (Bids):** Represents total cumulative buy demand below the market price.
* **Red Side (Asks):** Represents total cumulative sell supply above the market price.
#### Order Book Walls
When looking at a depth chart, you may occasionally see steep vertical "cliffs" or "walls" on either side.
* **Buy Wall:** A massive concentration of buy orders at a specific price level. This signals strong interest from buyers to prevent the price from falling below that level in the short term.
* **Sell Wall:** A massive concentration of sell orders at a specific price level. This indicates a supply bottleneck that may block the price from moving higher until that entire wall is consumed.
While order walls look like clear support or resistance levels, intermediate traders must treat them with caution.
---
### 4. Advanced Order Book Mechanics: Illusion vs. Reality
Relying purely on visible market depth carries risks because the order book is dynamic and subject to strategic manipulation. What appears on the screen is not always a guarantee of execution.
#### A. Spoofing
Spoofing occurs when a trader or automated bot places large limit orders (buy or sell walls) with no intention of letting them get filled. The goal is to create a false impression of market demand or heavy resistance, tricking other traders into buying or selling ahead of the wall. Once the market price approaches the fake wall, the spoofer quickly cancels the order before execution.
#### B. Iceberg Orders
Institutional participants trading large volumes often avoid putting their full size into the public order book, as doing so would alert the market and push prices against them. Instead, they use **iceberg orders**. An iceberg order splits a massive order into smaller visible pieces. As soon as one piece gets filled, another piece automatically populates at the same price level. Consequently, an order book that appears shallow might actually contain hidden, deep liquidity at specific levels.
#### C. Algorithmic Market Makers
High-frequency trading algorithms continuously adjust their bids and asks based on order flow, volatility, and external market signals. During periods of extreme market stress, market-making algorithms may pull their orders entirely to mitigate risk, causing market depth to evaporate instantly right when liquidity is needed most.
---
### 5. Risks, Limitations, and Best Practices
While analyzing market depth provides a distinct advantage, traders should keep several limitations in mind:
1. **Liquidity Fragmentation:** Crypto trading takes place across dozens of distinct centralized exchanges and decentralized platforms. Checking depth on a single exchange only gives you a partial picture of total global market liquidity.
2. **Order Book Latency:** High-volatility events cause order books to change in milliseconds. Manual traders looking at visual depth charts often see outdated information compared to API-connected algorithmic traders.
3. **Flash Crashes in Low-Depth Assets:** Small-cap altcoins frequently suffer from paper-thin depth. Executing market orders or trigger-based stop-loss orders in low-depth markets can trigger severe liquidation cascades and catastrophic slippage.
#### Actionable Risk Management Strategies:
* **Use Limit and Post-Only Orders:** To eliminate slippage, default to limit orders. Using a "Post-Only" feature ensures your order acts strictly as a maker order, placing liquidity into the book rather than taking it out.
* **Check Market Depth Before Trade Sizing:** Before executing a substantial position, check the order book's depth up to 1% or 2% away from the spot price to calculate potential price impact.
* **Break Up Large Orders:** If trading a large amount relative to the available liquidity, split your transaction into smaller algorithmic limit trades spaced out over time (e.g., using Time-Weighted Average Price or TWAP execution strategies).
---
### Final Thoughts
Market depth is a foundational concept that bridges simple price charting and advanced market microstructure. Understanding how order books function allows you to assess the real-time liquidity of an asset, avoid unnecessary trade execution fees caused by slippage, and recognize when order book walls may be deceiving.
By incorporating order book analysis into your standard trading routine alongside strict risk controls, you gain a clearer view of true market conditions and can make significantly more disciplined trading decisions.
#CryptoEducation #MarketDepth #TradingMechanics
1
152
Unlocking Market Depth: A Complete Guide to Order Books, Slippage, and Liquidity VisualsWhen observing digital asset markets, most market participants focus primarily on the spot ticker price—the glowing number indicating the last trade executed on an exchange. While the ticker price reflects historical transactions, it tells you very little about where the market might head next or how easily you can enter and exit a position.
To gain a clearer understanding of market structure, intermediate traders look beneath the headline price into market depth. Market depth reveals the real-time supply and demand dynamics waiting to be filled across various price levels. By learning to analyze market depth, order books, and depth charts, market participants can better anticipate price volatility, measure execution risk, and make more informed trading decisions.
---
### 1. Understanding the Mechanics of an Order Book
At the core of every centralized digital asset exchange lies an automated order-matching engine powered by an order book. An order book is a real-time, continuously updated list of open buy and sell limit orders submitted by market participants.
The order book is structured into two main sides:
* **The Bid Side (Buyers):** Located on the left or bottom (typically highlighted in green), bids represent orders from market participants willing to buy an asset at a specified maximum price. Bids are sorted in descending order, with the highest buy offer placed at the very top.
* **The Ask Side (Sellers):** Located on the right or top (typically highlighted in red), asks (or offers) represent orders from market participants willing to sell an asset at a specified minimum price. Asks are sorted in ascending order, with the lowest sell offer placed at the top.
The gap between the highest bid price and the lowest ask price is known as the **bid-ask spread**.
In highly liquid markets featuring high trading volumes, the spread is extremely narrow—often fractions of a cent. In illiquid markets, the spread can be significantly wider. The middle point between the highest bid and lowest ask is defined as the mid-market price, though actual market orders are always executed against the prevailing bid or ask.
---
### 2. Market Orders vs. Limit Orders: The Engine of Liquidity
To understand market depth, one must distinguish between liquidity providers (makers) and liquidity takers (buyers/sellers using market orders).
* **Limit Orders (Liquidity Makers):** When a trader submits a limit order—for example, placing an order to buy 5 Bitcoin at $60,000 when the market price is $60,500—that order does not execute immediately. Instead, it sits in the order book, adding to the market’s total depth.
* **Market Orders (Liquidity Takers):** When a trader submits a market order—for example, placing an instant order to buy 5 Bitcoin at current market prices—the engine matches that order immediately against the best available limit asks residing in the order book.
Market depth is essentially the sum of all resting limit orders available to absorb incoming market orders. If the volume of resting limit orders is substantial across tightly clustered price levels, the market is considered "deep." If resting orders are sparse and spread far apart, the market is considered "thin."
---
### 3. Deconstructing the Visual Depth Chart
Most exchange trading interfaces offer a graphical representation of the order book known as the **Depth Chart**.
The depth chart plots price along the horizontal axis (X-axis) and cumulative order quantity along the vertical axis (Y-axis).
* **The Green Slope (Cumulative Bids):** Visualizes the total aggregate demand available at or below the current market price. As price moves lower along the X-axis, the line rises because it accumulates all buy orders from the market price down to lower support levels.
* **The Red Slope (Cumulative Asks):** Visualizes the total aggregate supply available at or above the current market price. As price moves higher along the X-axis, the line rises as it accumulates all sell orders from the market price up to higher resistance levels.
#### Interpreting "Order Book Walls"
A steep, near-vertical section on a depth chart indicates a massive concentration of limit orders at a specific price point, commonly referred to as a **buy wall** or a **sell wall**.
* **A Buy Wall:** A massive quantity of buy limit orders clustered at a specific support price. To push the market price below this level, sellers must dump enough market supply to consume the entire wall.
* **A Sell Wall:** A massive quantity of sell limit orders clustered at a specific overhead price. To push the price above this level, buyers must purchase enough volume to swallow all the supply waiting at that level.
---
### 4. Practical Implications: Slippage and Order Execution
Understanding market depth is essential for executing trades efficiently and avoiding unexpected costs, particularly **slippage**.
Slippage occurs when a market order is executed at a price different from the price expected when the order was placed. Slippage happens because the top of the order book does not contain enough liquidity to fill the total requested order size.
#### Example Scenario: "Walking the Order Book"
Imagine an illiquid market for an altcoin where the current best ask price is $10.00, and the order book displays the following sell limit orders:
* **Level 1:** 100 units available at $10.00
* **Level 2:** 200 units available at $10.50
* **Level 3:** 500 units available at $11.00
If a trader submits a market buy order for **400 units**, the matching engine will fill the order dynamically across multiple levels:
1. Fills 100 units at $10.00 (Cost: $1,000)
2. Fills remaining 300 units at $10.50 (Cost: $3,150)
The total purchase cost becomes $4,150, resulting in an average execution price of **$10.375 per unit**. The trader experienced **3.75% slippage** above the initial expected price of $10.00 because the market depth was insufficient to absorb a 400-unit market order at a single level.
By analyzing market depth beforehand, the trader could have opted to split the order into smaller increments over time or used limit orders to avoid paying premium slippage rates.
---
### 5. Advanced Nuances, Risks, and Order Book Manipulations
While market depth provides invaluable real-time information, relying solely on static order book visuals carries distinct risks. Order books are dynamic, rapidly changing environments subject to strategic maneuvers by high-frequency trading algorithms and institutional actors.
#### A. Spoofing and Phantom Liquidity
Spoofing occurs when entities place large buy or sell limit orders with no intention of executing them. A trader might place a massive buy wall to create a false narrative of strong demand, encouraging retail buyers to jump in. Once the price ticks higher, the trader cancels the buy wall before it can be executed and sells their actual inventory into the retail momentum.
#### B. Iceberg Orders
Institutional participants trading large volumes rarely display their full order size openly in the depth chart. Instead, they utilize **iceberg orders**—automated execution algorithms that split a large order into small, visible slices. As soon as one visible slice is consumed, the system automatically posts the next segment. Therefore, a price level that appears to have low depth may actually hide significant underlying liquidity.
#### C. Cross-Exchange Liquidity Fragmentation
In modern crypto markets, trading volume is fragmented across dozens of centralized venues, decentralized exchanges (DEXs), and over-the-counter (OTC) desks. An order book on a single exchange only captures a fraction of global liquidity. A deep book on Exchange A does not guarantee that market makers won't instantly pull liquidity if external prices move on Exchange B.
---
### 6. Integrating Market Depth into a Risk Management Strategy
Market depth analysis should serve as one component of a broader risk management methodology rather than a standalone directional indicator.
* **Pre-Trade Size Assessment:** Before submitting large trades, check the depth chart to calculate maximum allowable trade sizes without incurring structural slippage.
* **Volatility Anticipation:** When market depth thins out drastically on both sides of the book (often occurring prior to major macroeconomic announcements), market volatility tends to spike dramatically, as even small trades can trigger sizable price swings.
* **Combining with On-Chain and Technical Analysis:** Use market depth to validate technical chart patterns. If a chart indicates a major technical resistance line, cross-reference it with the order book to confirm whether a real sell wall exists at that level.
---
### Final Thoughts
Market depth offers a clear window into market structure, revealing the true supply and demand mechanics behind digital asset prices. By reading order books effectively, assessing cumulative depth charts, and factoring in execution slippage, intermediate traders can navigate volatile environments with greater precision. However, always remain aware of dynamic order cancellations, hidden liquidity, and market manipulation techniques that can alter market depth in milliseconds.
#CryptoEducation #MarketDepth #TradingStrategy
Unlocking Market Depth: A Complete Guide to Order Books, Slippage, and Liquidity Visuals
When observing digital asset markets, most market participants focus primarily on the spot ticker price—the glowing number indicating the last trade executed on an exchange. While the ticker price reflects historical transactions, it tells you very little about where the market might head next or how easily you can enter and exit a position.
To gain a clearer understanding of market structure, intermediate traders look beneath the headline price into market depth. Market depth reveals the real-time supply and demand dynamics waiting to be filled across various price levels. By learning to analyze market depth, order books, and depth charts, market participants can better anticipate price volatility, measure execution risk, and make more informed trading decisions.
---
### 1. Understanding the Mechanics of an Order Book
At the core of every centralized digital asset exchange lies an automated order-matching engine powered by an order book. An order book is a real-time, continuously updated list of open buy and sell limit orders submitted by market participants.
The order book is structured into two main sides:
* **The Bid Side (Buyers):** Located on the left or bottom (typically highlighted in green), bids represent orders from market participants willing to buy an asset at a specified maximum price. Bids are sorted in descending order, with the highest buy offer placed at the very top.
* **The Ask Side (Sellers):** Located on the right or top (typically highlighted in red), asks (or offers) represent orders from market participants willing to sell an asset at a specified minimum price. Asks are sorted in ascending order, with the lowest sell offer placed at the top.
The gap between the highest bid price and the lowest ask price is known as the **bid-ask spread**.
In highly liquid markets featuring high trading volumes, the spread is extremely narrow—often fractions of a cent. In illiquid markets, the spread can be significantly wider. The middle point between the highest bid and lowest ask is defined as the mid-market price, though actual market orders are always executed against the prevailing bid or ask.
---
### 2. Market Orders vs. Limit Orders: The Engine of Liquidity
To understand market depth, one must distinguish between liquidity providers (makers) and liquidity takers (buyers/sellers using market orders).
* **Limit Orders (Liquidity Makers):** When a trader submits a limit order—for example, placing an order to buy 5 Bitcoin at $60,000 when the market price is $60,500—that order does not execute immediately. Instead, it sits in the order book, adding to the market’s total depth.
* **Market Orders (Liquidity Takers):** When a trader submits a market order—for example, placing an instant order to buy 5 Bitcoin at current market prices—the engine matches that order immediately against the best available limit asks residing in the order book.
Market depth is essentially the sum of all resting limit orders available to absorb incoming market orders. If the volume of resting limit orders is substantial across tightly clustered price levels, the market is considered "deep." If resting orders are sparse and spread far apart, the market is considered "thin."
---
### 3. Deconstructing the Visual Depth Chart
Most exchange trading interfaces offer a graphical representation of the order book known as the **Depth Chart**.
The depth chart plots price along the horizontal axis (X-axis) and cumulative order quantity along the vertical axis (Y-axis).
* **The Green Slope (Cumulative Bids):** Visualizes the total aggregate demand available at or below the current market price. As price moves lower along the X-axis, the line rises because it accumulates all buy orders from the market price down to lower support levels.
* **The Red Slope (Cumulative Asks):** Visualizes the total aggregate supply available at or above the current market price. As price moves higher along the X-axis, the line rises as it accumulates all sell orders from the market price up to higher resistance levels.
#### Interpreting "Order Book Walls"
A steep, near-vertical section on a depth chart indicates a massive concentration of limit orders at a specific price point, commonly referred to as a **buy wall** or a **sell wall**.
* **A Buy Wall:** A massive quantity of buy limit orders clustered at a specific support price. To push the market price below this level, sellers must dump enough market supply to consume the entire wall.
* **A Sell Wall:** A massive quantity of sell limit orders clustered at a specific overhead price. To push the price above this level, buyers must purchase enough volume to swallow all the supply waiting at that level.
---
### 4. Practical Implications: Slippage and Order Execution
Understanding market depth is essential for executing trades efficiently and avoiding unexpected costs, particularly **slippage**.
Slippage occurs when a market order is executed at a price different from the price expected when the order was placed. Slippage happens because the top of the order book does not contain enough liquidity to fill the total requested order size.
#### Example Scenario: "Walking the Order Book"
Imagine an illiquid market for an altcoin where the current best ask price is $10.00, and the order book displays the following sell limit orders:
* **Level 1:** 100 units available at $10.00
* **Level 2:** 200 units available at $10.50
* **Level 3:** 500 units available at $11.00
If a trader submits a market buy order for **400 units**, the matching engine will fill the order dynamically across multiple levels:
1. Fills 100 units at $10.00 (Cost: $1,000)
2. Fills remaining 300 units at $10.50 (Cost: $3,150)
The total purchase cost becomes $4,150, resulting in an average execution price of **$10.375 per unit**. The trader experienced **3.75% slippage** above the initial expected price of $10.00 because the market depth was insufficient to absorb a 400-unit market order at a single level.
By analyzing market depth beforehand, the trader could have opted to split the order into smaller increments over time or used limit orders to avoid paying premium slippage rates.
---
### 5. Advanced Nuances, Risks, and Order Book Manipulations
While market depth provides invaluable real-time information, relying solely on static order book visuals carries distinct risks. Order books are dynamic, rapidly changing environments subject to strategic maneuvers by high-frequency trading algorithms and institutional actors.
#### A. Spoofing and Phantom Liquidity
Spoofing occurs when entities place large buy or sell limit orders with no intention of executing them. A trader might place a massive buy wall to create a false narrative of strong demand, encouraging retail buyers to jump in. Once the price ticks higher, the trader cancels the buy wall before it can be executed and sells their actual inventory into the retail momentum.
#### B. Iceberg Orders
Institutional participants trading large volumes rarely display their full order size openly in the depth chart. Instead, they utilize **iceberg orders**—automated execution algorithms that split a large order into small, visible slices. As soon as one visible slice is consumed, the system automatically posts the next segment. Therefore, a price level that appears to have low depth may actually hide significant underlying liquidity.
#### C. Cross-Exchange Liquidity Fragmentation
In modern crypto markets, trading volume is fragmented across dozens of centralized venues, decentralized exchanges (DEXs), and over-the-counter (OTC) desks. An order book on a single exchange only captures a fraction of global liquidity. A deep book on Exchange A does not guarantee that market makers won't instantly pull liquidity if external prices move on Exchange B.
---
### 6. Integrating Market Depth into a Risk Management Strategy
Market depth analysis should serve as one component of a broader risk management methodology rather than a standalone directional indicator.
* **Pre-Trade Size Assessment:** Before submitting large trades, check the depth chart to calculate maximum allowable trade sizes without incurring structural slippage.
* **Volatility Anticipation:** When market depth thins out drastically on both sides of the book (often occurring prior to major macroeconomic announcements), market volatility tends to spike dramatically, as even small trades can trigger sizable price swings.
* **Combining with On-Chain and Technical Analysis:** Use market depth to validate technical chart patterns. If a chart indicates a major technical resistance line, cross-reference it with the order book to confirm whether a real sell wall exists at that level.
---
### Final Thoughts
Market depth offers a clear window into market structure, revealing the true supply and demand mechanics behind digital asset prices. By reading order books effectively, assessing cumulative depth charts, and factoring in execution slippage, intermediate traders can navigate volatile environments with greater precision. However, always remain aware of dynamic order cancellations, hidden liquidity, and market manipulation techniques that can alter market depth in milliseconds.
#CryptoEducation #MarketDepth #TradingStrategy
To gain a clearer understanding of market structure, intermediate traders look beneath the headline price into market depth. Market depth reveals the real-time supply and demand dynamics waiting to be filled across various price levels. By learning to analyze market depth, order books, and depth charts, market participants can better anticipate price volatility, measure execution risk, and make more informed trading decisions.
---
### 1. Understanding the Mechanics of an Order Book
At the core of every centralized digital asset exchange lies an automated order-matching engine powered by an order book. An order book is a real-time, continuously updated list of open buy and sell limit orders submitted by market participants.
The order book is structured into two main sides:
* **The Bid Side (Buyers):** Located on the left or bottom (typically highlighted in green), bids represent orders from market participants willing to buy an asset at a specified maximum price. Bids are sorted in descending order, with the highest buy offer placed at the very top.
* **The Ask Side (Sellers):** Located on the right or top (typically highlighted in red), asks (or offers) represent orders from market participants willing to sell an asset at a specified minimum price. Asks are sorted in ascending order, with the lowest sell offer placed at the top.
The gap between the highest bid price and the lowest ask price is known as the **bid-ask spread**.
In highly liquid markets featuring high trading volumes, the spread is extremely narrow—often fractions of a cent. In illiquid markets, the spread can be significantly wider. The middle point between the highest bid and lowest ask is defined as the mid-market price, though actual market orders are always executed against the prevailing bid or ask.
---
### 2. Market Orders vs. Limit Orders: The Engine of Liquidity
To understand market depth, one must distinguish between liquidity providers (makers) and liquidity takers (buyers/sellers using market orders).
* **Limit Orders (Liquidity Makers):** When a trader submits a limit order—for example, placing an order to buy 5 Bitcoin at $60,000 when the market price is $60,500—that order does not execute immediately. Instead, it sits in the order book, adding to the market’s total depth.
* **Market Orders (Liquidity Takers):** When a trader submits a market order—for example, placing an instant order to buy 5 Bitcoin at current market prices—the engine matches that order immediately against the best available limit asks residing in the order book.
Market depth is essentially the sum of all resting limit orders available to absorb incoming market orders. If the volume of resting limit orders is substantial across tightly clustered price levels, the market is considered "deep." If resting orders are sparse and spread far apart, the market is considered "thin."
---
### 3. Deconstructing the Visual Depth Chart
Most exchange trading interfaces offer a graphical representation of the order book known as the **Depth Chart**.
The depth chart plots price along the horizontal axis (X-axis) and cumulative order quantity along the vertical axis (Y-axis).
* **The Green Slope (Cumulative Bids):** Visualizes the total aggregate demand available at or below the current market price. As price moves lower along the X-axis, the line rises because it accumulates all buy orders from the market price down to lower support levels.
* **The Red Slope (Cumulative Asks):** Visualizes the total aggregate supply available at or above the current market price. As price moves higher along the X-axis, the line rises as it accumulates all sell orders from the market price up to higher resistance levels.
#### Interpreting "Order Book Walls"
A steep, near-vertical section on a depth chart indicates a massive concentration of limit orders at a specific price point, commonly referred to as a **buy wall** or a **sell wall**.
* **A Buy Wall:** A massive quantity of buy limit orders clustered at a specific support price. To push the market price below this level, sellers must dump enough market supply to consume the entire wall.
* **A Sell Wall:** A massive quantity of sell limit orders clustered at a specific overhead price. To push the price above this level, buyers must purchase enough volume to swallow all the supply waiting at that level.
---
### 4. Practical Implications: Slippage and Order Execution
Understanding market depth is essential for executing trades efficiently and avoiding unexpected costs, particularly **slippage**.
Slippage occurs when a market order is executed at a price different from the price expected when the order was placed. Slippage happens because the top of the order book does not contain enough liquidity to fill the total requested order size.
#### Example Scenario: "Walking the Order Book"
Imagine an illiquid market for an altcoin where the current best ask price is $10.00, and the order book displays the following sell limit orders:
* **Level 1:** 100 units available at $10.00
* **Level 2:** 200 units available at $10.50
* **Level 3:** 500 units available at $11.00
If a trader submits a market buy order for **400 units**, the matching engine will fill the order dynamically across multiple levels:
1. Fills 100 units at $10.00 (Cost: $1,000)
2. Fills remaining 300 units at $10.50 (Cost: $3,150)
The total purchase cost becomes $4,150, resulting in an average execution price of **$10.375 per unit**. The trader experienced **3.75% slippage** above the initial expected price of $10.00 because the market depth was insufficient to absorb a 400-unit market order at a single level.
By analyzing market depth beforehand, the trader could have opted to split the order into smaller increments over time or used limit orders to avoid paying premium slippage rates.
---
### 5. Advanced Nuances, Risks, and Order Book Manipulations
While market depth provides invaluable real-time information, relying solely on static order book visuals carries distinct risks. Order books are dynamic, rapidly changing environments subject to strategic maneuvers by high-frequency trading algorithms and institutional actors.
#### A. Spoofing and Phantom Liquidity
Spoofing occurs when entities place large buy or sell limit orders with no intention of executing them. A trader might place a massive buy wall to create a false narrative of strong demand, encouraging retail buyers to jump in. Once the price ticks higher, the trader cancels the buy wall before it can be executed and sells their actual inventory into the retail momentum.
#### B. Iceberg Orders
Institutional participants trading large volumes rarely display their full order size openly in the depth chart. Instead, they utilize **iceberg orders**—automated execution algorithms that split a large order into small, visible slices. As soon as one visible slice is consumed, the system automatically posts the next segment. Therefore, a price level that appears to have low depth may actually hide significant underlying liquidity.
#### C. Cross-Exchange Liquidity Fragmentation
In modern crypto markets, trading volume is fragmented across dozens of centralized venues, decentralized exchanges (DEXs), and over-the-counter (OTC) desks. An order book on a single exchange only captures a fraction of global liquidity. A deep book on Exchange A does not guarantee that market makers won't instantly pull liquidity if external prices move on Exchange B.
---
### 6. Integrating Market Depth into a Risk Management Strategy
Market depth analysis should serve as one component of a broader risk management methodology rather than a standalone directional indicator.
* **Pre-Trade Size Assessment:** Before submitting large trades, check the depth chart to calculate maximum allowable trade sizes without incurring structural slippage.
* **Volatility Anticipation:** When market depth thins out drastically on both sides of the book (often occurring prior to major macroeconomic announcements), market volatility tends to spike dramatically, as even small trades can trigger sizable price swings.
* **Combining with On-Chain and Technical Analysis:** Use market depth to validate technical chart patterns. If a chart indicates a major technical resistance line, cross-reference it with the order book to confirm whether a real sell wall exists at that level.
---
### Final Thoughts
Market depth offers a clear window into market structure, revealing the true supply and demand mechanics behind digital asset prices. By reading order books effectively, assessing cumulative depth charts, and factoring in execution slippage, intermediate traders can navigate volatile environments with greater precision. However, always remain aware of dynamic order cancellations, hidden liquidity, and market manipulation techniques that can alter market depth in milliseconds.
#CryptoEducation #MarketDepth #TradingStrategy
129
Demystifying Market Depth: How to Read Order Books and Execute Smarter TradesWhen most participants enter the cryptocurrency market, their primary focus centers on line or candlestick charts. These visual tools show historical price movements, highlighting where an asset traded minutes, hours, or days ago. However, a price chart only reflects trades that have already occurred. To understand where an asset’s price might move next and how efficiently a trade can be executed, traders must look at real-time supply and demand. This is where market depth and the order book become essential tools.
Understanding market depth allows intermediate market participants to look beneath the surface of price action. It reveals the volume of buy and sell orders resting at different price levels, offering vital clues about market liquidity, potential support and resistance zones, and the risk of execution slippage.
---
### What Is Market Depth?
Market depth refers to a market's ability to absorb large trade orders without causing significant fluctuations in price. It measures the total volume of open, unfilled buy and sell orders at varying price points surrounding the current market price.
A market is considered "deep" when there is a high concentration of pending buy and sell orders on both sides of the ledger. In a deep market, executing a large market order will have a minimal impact on the prevailing price because plenty of liquidity is available to absorb the order. Conversely, a "shallow" or "thin" market lacks sufficient order density. In thin markets, even modest buy or sell orders can cause dramatic price shifts, leading to extreme volatility and unexpected trade costs.
---
### The Anatomy of an Order Book
To comprehend market depth, one must first master the structure of an order book. An order book is an electronic, real-time list of outstanding limit orders placed by buyers and sellers on a central limit order book exchange.
The order book is divided into two primary sections:
1. **Bids (Buy Orders):** Listed on one side (typically green), bids represent buyers who specify the maximum price they are willing to pay for a asset, along with the quantity they wish to purchase. Bids are arranged in descending order, with the highest bid price at the top.
2. **Asks or Offers (Sell Orders):** Listed on the opposing side (typically red), asks represent sellers who specify the minimum price they are willing to accept, along with the quantity they wish to sell. Asks are arranged in ascending order, with the lowest ask price at the top.
The gap between the highest bid price and the lowest ask price is known as the **Bid-Ask Spread**.
#### The Depth Chart
Exchanges often visually represent order book data through a graphic known as a depth chart. This chart plots cumulative order volume on the vertical axis against price on the horizontal axis.
* The **green side** shows the total cumulative buying power moving downward from the current price.
* The **red side** shows the total cumulative selling volume moving upward from the current price.
When you observe a steep, wall-like structure on a depth chart—often referred to as a "buy wall" or "sell wall"—it signifies a large concentration of limit orders at a specific price point. These walls can act as psychological barriers or temporarily absorb incoming orders.
---
### Practical Example: Slippage and Order Execution
Understanding market depth is practical, not just theoretical. It directly impacts execution quality, particularly through a phenomenon known as **slippage**. Slippage occurs when a market order executes at a price different from the expected price at the time the order was submitted.
Consider a hypothetical scenario using a mid-cap digital asset, Token X, trading at $10.00.
Suppose the sell side (asks) of the order book looks like this:
* **Ask Level 1:** 100 units at $10.00
* **Ask Level 2:** 200 units at $10.10
* **Ask Level 3:** 500 units at $10.25
* **Ask Level 4:** 1,000 units at $10.50
Imagine Trader A wants to buy 50 units of Token X using a **Market Order**. Because Level 1 offers 100 units at $10.00, Trader A's order is filled immediately and completely at $10.00. The average execution price is $10.00.
Now, imagine Trader B wants to buy 500 units of Token X using a **Market Order** in the same market state:
1. The first 100 units fill at **$10.00** (cost: $1,000).
2. The next 200 units fill at **$10.10** (cost: $2,020).
3. The remaining 200 units fill at **$10.25** (cost: $2,050).
Trader B spent a total of $5,070 for 500 units, resulting in an average purchase price of **$10.14 per unit**.
Although the asset was quoted at $10.00 on the main ticker, Trader B experienced 1.4% slippage due to insufficient depth at the top of the order book. This example illustrates why checking market depth is critical before executing large market orders, particularly in assets like Ethereum, BNB, or smaller altcoins during periods of low volume.
---
### Advanced Concepts: Spoofing, Icebergs, and Phantom Liquidity
While order books offer valuable transparency, relying on visible market depth comes with caveats. Intermediate traders must recognize that the order book is a dynamic environment where visible data can sometimes be misleading.
#### 1. Iceberg Orders
Institutional participants trading large volumes of assets like Bitcoin often seek to minimize market impact. To do this, they use "iceberg orders." An iceberg order is an automated order split into smaller visible limit orders. Only a tiny fraction (the tip of the iceberg) appears in the public order book. As soon as that fraction is filled, another portion automatically populates. As a result, true market depth may be significantly larger than what is visibly displayed.
#### 2. Order Spoofing
Spoofing is a manipulative practice where a trader places large limit orders (e.g., a massive buy wall) with no intention of letting them fill. The goal is to create a false perception of strong demand, encouraging other market participants to buy. Once price rises slightly, the spoofer cancels the large buy order and sells their inventory into the inflated market. Although prohibited on regulated exchanges, fake liquidity can still occur in fast-moving crypto environments.
#### 3. Algorithmic Cancellation
In modern markets, automated High-Frequency Trading (HFT) bots manage a substantial portion of resting liquidity. These bots can place and cancel thousands of orders per second based on cross-exchange price movements. Liquidity that appears present one second can vanish instantly if market sentiment shifts rapidly, leaving market orders exposed to deeper execution levels than expected.
---
### Risks and Limitations of Order Book Analysis
While order book reading provides valuable operational insights, it is important to recognize its inherent limitations:
* **Incompleteness Across Venues:** Crypto trading is fragmented across dozens of centralized and decentralized exchanges. Examining the order book on a single exchange provides only a partial view of global supply and demand.
* **Over-the-Counter (OTC) Trading:** Massive institutional trades frequently settle off the exchange order books via OTC desks. These transactions do not show up in market depth charts until after execution, if at all.
* **Deceptive Walls:** Large buy or sell walls can be canceled at a millisecond's notice. Assuming a price wall will act as guaranteed support or resistance is a high-risk assumption.
* **Rapid Shifts During Volatility:** During major macroeconomic announcements or sharp market moves, traders frequently pull their limit orders to avoid being caught on the wrong side of a trend. This causes order book depth to evaporate precisely when traders need liquidity the most.
---
### Practical Execution Strategies for Traders
To navigate these challenges, intermediate traders can implement structured operational habits:
1. **Match Order Type to Liquidity:** When trading illiquid assets or placing larger position sizes, default to **Limit Orders** or **Post-Only Orders**. Limit orders guarantee execution price (though not fill probability), eliminating slippage risk.
2. **Utilize Algorithmic Execution Tools:** For substantial positions, consider utilizing execution algorithms such as Time-Weighted Average Price (TWAP) or Volume-Weighted Average Price (VWAP). These tools slice large orders into smaller trades over time, reducing price impact.
3. **Assess Cumulative Depth Before Market Orders:** Always verify the cumulative depth within a reasonable percentage spread (e.g., 1% or 2% depth) rather than looking solely at the top bid and ask prices.
4. **Combine Depth with Volume Indicators:** Pair order book observation with real-time volume indicators and trade flow logs (Time & Sales data) to confirm whether large resting orders are actually being matched and filled.
---
### Final Thoughts
Market depth offers a clear view into the mechanics of price formation. By learning to interpret order books correctly, recognizing the risks of hidden liquidity, and selecting appropriate order types, traders can dramatically reduce execution costs and better assess market conditions. Market depth analysis is not a standalone crystal ball for predicting price movements, but when integrated into a comprehensive trading methodology, it serves as a critical bridge between theoretical analysis and practical execution.
#CryptoEducation #MarketDepth #TradingStrategy
Demystifying Market Depth: How to Read Order Books and Execute Smarter Trades
When most participants enter the cryptocurrency market, their primary focus centers on line or candlestick charts. These visual tools show historical price movements, highlighting where an asset traded minutes, hours, or days ago. However, a price chart only reflects trades that have already occurred. To understand where an asset’s price might move next and how efficiently a trade can be executed, traders must look at real-time supply and demand. This is where market depth and the order book become essential tools.
Understanding market depth allows intermediate market participants to look beneath the surface of price action. It reveals the volume of buy and sell orders resting at different price levels, offering vital clues about market liquidity, potential support and resistance zones, and the risk of execution slippage.
---
### What Is Market Depth?
Market depth refers to a market's ability to absorb large trade orders without causing significant fluctuations in price. It measures the total volume of open, unfilled buy and sell orders at varying price points surrounding the current market price.
A market is considered "deep" when there is a high concentration of pending buy and sell orders on both sides of the ledger. In a deep market, executing a large market order will have a minimal impact on the prevailing price because plenty of liquidity is available to absorb the order. Conversely, a "shallow" or "thin" market lacks sufficient order density. In thin markets, even modest buy or sell orders can cause dramatic price shifts, leading to extreme volatility and unexpected trade costs.
---
### The Anatomy of an Order Book
To comprehend market depth, one must first master the structure of an order book. An order book is an electronic, real-time list of outstanding limit orders placed by buyers and sellers on a central limit order book exchange.
The order book is divided into two primary sections:
1. **Bids (Buy Orders):** Listed on one side (typically green), bids represent buyers who specify the maximum price they are willing to pay for a asset, along with the quantity they wish to purchase. Bids are arranged in descending order, with the highest bid price at the top.
2. **Asks or Offers (Sell Orders):** Listed on the opposing side (typically red), asks represent sellers who specify the minimum price they are willing to accept, along with the quantity they wish to sell. Asks are arranged in ascending order, with the lowest ask price at the top.
The gap between the highest bid price and the lowest ask price is known as the **Bid-Ask Spread**.
#### The Depth Chart
Exchanges often visually represent order book data through a graphic known as a depth chart. This chart plots cumulative order volume on the vertical axis against price on the horizontal axis.
* The **green side** shows the total cumulative buying power moving downward from the current price.
* The **red side** shows the total cumulative selling volume moving upward from the current price.
When you observe a steep, wall-like structure on a depth chart—often referred to as a "buy wall" or "sell wall"—it signifies a large concentration of limit orders at a specific price point. These walls can act as psychological barriers or temporarily absorb incoming orders.
---
### Practical Example: Slippage and Order Execution
Understanding market depth is practical, not just theoretical. It directly impacts execution quality, particularly through a phenomenon known as **slippage**. Slippage occurs when a market order executes at a price different from the expected price at the time the order was submitted.
Consider a hypothetical scenario using a mid-cap digital asset, Token X, trading at $10.00.
Suppose the sell side (asks) of the order book looks like this:
* **Ask Level 1:** 100 units at $10.00
* **Ask Level 2:** 200 units at $10.10
* **Ask Level 3:** 500 units at $10.25
* **Ask Level 4:** 1,000 units at $10.50
Imagine Trader A wants to buy 50 units of Token X using a **Market Order**. Because Level 1 offers 100 units at $10.00, Trader A's order is filled immediately and completely at $10.00. The average execution price is $10.00.
Now, imagine Trader B wants to buy 500 units of Token X using a **Market Order** in the same market state:
1. The first 100 units fill at **$10.00** (cost: $1,000).
2. The next 200 units fill at **$10.10** (cost: $2,020).
3. The remaining 200 units fill at **$10.25** (cost: $2,050).
Trader B spent a total of $5,070 for 500 units, resulting in an average purchase price of **$10.14 per unit**.
Although the asset was quoted at $10.00 on the main ticker, Trader B experienced 1.4% slippage due to insufficient depth at the top of the order book. This example illustrates why checking market depth is critical before executing large market orders, particularly in assets like Ethereum, BNB, or smaller altcoins during periods of low volume.
---
### Advanced Concepts: Spoofing, Icebergs, and Phantom Liquidity
While order books offer valuable transparency, relying on visible market depth comes with caveats. Intermediate traders must recognize that the order book is a dynamic environment where visible data can sometimes be misleading.
#### 1. Iceberg Orders
Institutional participants trading large volumes of assets like Bitcoin often seek to minimize market impact. To do this, they use "iceberg orders." An iceberg order is an automated order split into smaller visible limit orders. Only a tiny fraction (the tip of the iceberg) appears in the public order book. As soon as that fraction is filled, another portion automatically populates. As a result, true market depth may be significantly larger than what is visibly displayed.
#### 2. Order Spoofing
Spoofing is a manipulative practice where a trader places large limit orders (e.g., a massive buy wall) with no intention of letting them fill. The goal is to create a false perception of strong demand, encouraging other market participants to buy. Once price rises slightly, the spoofer cancels the large buy order and sells their inventory into the inflated market. Although prohibited on regulated exchanges, fake liquidity can still occur in fast-moving crypto environments.
#### 3. Algorithmic Cancellation
In modern markets, automated High-Frequency Trading (HFT) bots manage a substantial portion of resting liquidity. These bots can place and cancel thousands of orders per second based on cross-exchange price movements. Liquidity that appears present one second can vanish instantly if market sentiment shifts rapidly, leaving market orders exposed to deeper execution levels than expected.
---
### Risks and Limitations of Order Book Analysis
While order book reading provides valuable operational insights, it is important to recognize its inherent limitations:
* **Incompleteness Across Venues:** Crypto trading is fragmented across dozens of centralized and decentralized exchanges. Examining the order book on a single exchange provides only a partial view of global supply and demand.
* **Over-the-Counter (OTC) Trading:** Massive institutional trades frequently settle off the exchange order books via OTC desks. These transactions do not show up in market depth charts until after execution, if at all.
* **Deceptive Walls:** Large buy or sell walls can be canceled at a millisecond's notice. Assuming a price wall will act as guaranteed support or resistance is a high-risk assumption.
* **Rapid Shifts During Volatility:** During major macroeconomic announcements or sharp market moves, traders frequently pull their limit orders to avoid being caught on the wrong side of a trend. This causes order book depth to evaporate precisely when traders need liquidity the most.
---
### Practical Execution Strategies for Traders
To navigate these challenges, intermediate traders can implement structured operational habits:
1. **Match Order Type to Liquidity:** When trading illiquid assets or placing larger position sizes, default to **Limit Orders** or **Post-Only Orders**. Limit orders guarantee execution price (though not fill probability), eliminating slippage risk.
2. **Utilize Algorithmic Execution Tools:** For substantial positions, consider utilizing execution algorithms such as Time-Weighted Average Price (TWAP) or Volume-Weighted Average Price (VWAP). These tools slice large orders into smaller trades over time, reducing price impact.
3. **Assess Cumulative Depth Before Market Orders:** Always verify the cumulative depth within a reasonable percentage spread (e.g., 1% or 2% depth) rather than looking solely at the top bid and ask prices.
4. **Combine Depth with Volume Indicators:** Pair order book observation with real-time volume indicators and trade flow logs (Time & Sales data) to confirm whether large resting orders are actually being matched and filled.
---
### Final Thoughts
Market depth offers a clear view into the mechanics of price formation. By learning to interpret order books correctly, recognizing the risks of hidden liquidity, and selecting appropriate order types, traders can dramatically reduce execution costs and better assess market conditions. Market depth analysis is not a standalone crystal ball for predicting price movements, but when integrated into a comprehensive trading methodology, it serves as a critical bridge between theoretical analysis and practical execution.
#CryptoEducation #MarketDepth #TradingStrategy
Understanding market depth allows intermediate market participants to look beneath the surface of price action. It reveals the volume of buy and sell orders resting at different price levels, offering vital clues about market liquidity, potential support and resistance zones, and the risk of execution slippage.
---
### What Is Market Depth?
Market depth refers to a market's ability to absorb large trade orders without causing significant fluctuations in price. It measures the total volume of open, unfilled buy and sell orders at varying price points surrounding the current market price.
A market is considered "deep" when there is a high concentration of pending buy and sell orders on both sides of the ledger. In a deep market, executing a large market order will have a minimal impact on the prevailing price because plenty of liquidity is available to absorb the order. Conversely, a "shallow" or "thin" market lacks sufficient order density. In thin markets, even modest buy or sell orders can cause dramatic price shifts, leading to extreme volatility and unexpected trade costs.
---
### The Anatomy of an Order Book
To comprehend market depth, one must first master the structure of an order book. An order book is an electronic, real-time list of outstanding limit orders placed by buyers and sellers on a central limit order book exchange.
The order book is divided into two primary sections:
1. **Bids (Buy Orders):** Listed on one side (typically green), bids represent buyers who specify the maximum price they are willing to pay for a asset, along with the quantity they wish to purchase. Bids are arranged in descending order, with the highest bid price at the top.
2. **Asks or Offers (Sell Orders):** Listed on the opposing side (typically red), asks represent sellers who specify the minimum price they are willing to accept, along with the quantity they wish to sell. Asks are arranged in ascending order, with the lowest ask price at the top.
The gap between the highest bid price and the lowest ask price is known as the **Bid-Ask Spread**.
#### The Depth Chart
Exchanges often visually represent order book data through a graphic known as a depth chart. This chart plots cumulative order volume on the vertical axis against price on the horizontal axis.
* The **green side** shows the total cumulative buying power moving downward from the current price.
* The **red side** shows the total cumulative selling volume moving upward from the current price.
When you observe a steep, wall-like structure on a depth chart—often referred to as a "buy wall" or "sell wall"—it signifies a large concentration of limit orders at a specific price point. These walls can act as psychological barriers or temporarily absorb incoming orders.
---
### Practical Example: Slippage and Order Execution
Understanding market depth is practical, not just theoretical. It directly impacts execution quality, particularly through a phenomenon known as **slippage**. Slippage occurs when a market order executes at a price different from the expected price at the time the order was submitted.
Consider a hypothetical scenario using a mid-cap digital asset, Token X, trading at $10.00.
Suppose the sell side (asks) of the order book looks like this:
* **Ask Level 1:** 100 units at $10.00
* **Ask Level 2:** 200 units at $10.10
* **Ask Level 3:** 500 units at $10.25
* **Ask Level 4:** 1,000 units at $10.50
Imagine Trader A wants to buy 50 units of Token X using a **Market Order**. Because Level 1 offers 100 units at $10.00, Trader A's order is filled immediately and completely at $10.00. The average execution price is $10.00.
Now, imagine Trader B wants to buy 500 units of Token X using a **Market Order** in the same market state:
1. The first 100 units fill at **$10.00** (cost: $1,000).
2. The next 200 units fill at **$10.10** (cost: $2,020).
3. The remaining 200 units fill at **$10.25** (cost: $2,050).
Trader B spent a total of $5,070 for 500 units, resulting in an average purchase price of **$10.14 per unit**.
Although the asset was quoted at $10.00 on the main ticker, Trader B experienced 1.4% slippage due to insufficient depth at the top of the order book. This example illustrates why checking market depth is critical before executing large market orders, particularly in assets like Ethereum, BNB, or smaller altcoins during periods of low volume.
---
### Advanced Concepts: Spoofing, Icebergs, and Phantom Liquidity
While order books offer valuable transparency, relying on visible market depth comes with caveats. Intermediate traders must recognize that the order book is a dynamic environment where visible data can sometimes be misleading.
#### 1. Iceberg Orders
Institutional participants trading large volumes of assets like Bitcoin often seek to minimize market impact. To do this, they use "iceberg orders." An iceberg order is an automated order split into smaller visible limit orders. Only a tiny fraction (the tip of the iceberg) appears in the public order book. As soon as that fraction is filled, another portion automatically populates. As a result, true market depth may be significantly larger than what is visibly displayed.
#### 2. Order Spoofing
Spoofing is a manipulative practice where a trader places large limit orders (e.g., a massive buy wall) with no intention of letting them fill. The goal is to create a false perception of strong demand, encouraging other market participants to buy. Once price rises slightly, the spoofer cancels the large buy order and sells their inventory into the inflated market. Although prohibited on regulated exchanges, fake liquidity can still occur in fast-moving crypto environments.
#### 3. Algorithmic Cancellation
In modern markets, automated High-Frequency Trading (HFT) bots manage a substantial portion of resting liquidity. These bots can place and cancel thousands of orders per second based on cross-exchange price movements. Liquidity that appears present one second can vanish instantly if market sentiment shifts rapidly, leaving market orders exposed to deeper execution levels than expected.
---
### Risks and Limitations of Order Book Analysis
While order book reading provides valuable operational insights, it is important to recognize its inherent limitations:
* **Incompleteness Across Venues:** Crypto trading is fragmented across dozens of centralized and decentralized exchanges. Examining the order book on a single exchange provides only a partial view of global supply and demand.
* **Over-the-Counter (OTC) Trading:** Massive institutional trades frequently settle off the exchange order books via OTC desks. These transactions do not show up in market depth charts until after execution, if at all.
* **Deceptive Walls:** Large buy or sell walls can be canceled at a millisecond's notice. Assuming a price wall will act as guaranteed support or resistance is a high-risk assumption.
* **Rapid Shifts During Volatility:** During major macroeconomic announcements or sharp market moves, traders frequently pull their limit orders to avoid being caught on the wrong side of a trend. This causes order book depth to evaporate precisely when traders need liquidity the most.
---
### Practical Execution Strategies for Traders
To navigate these challenges, intermediate traders can implement structured operational habits:
1. **Match Order Type to Liquidity:** When trading illiquid assets or placing larger position sizes, default to **Limit Orders** or **Post-Only Orders**. Limit orders guarantee execution price (though not fill probability), eliminating slippage risk.
2. **Utilize Algorithmic Execution Tools:** For substantial positions, consider utilizing execution algorithms such as Time-Weighted Average Price (TWAP) or Volume-Weighted Average Price (VWAP). These tools slice large orders into smaller trades over time, reducing price impact.
3. **Assess Cumulative Depth Before Market Orders:** Always verify the cumulative depth within a reasonable percentage spread (e.g., 1% or 2% depth) rather than looking solely at the top bid and ask prices.
4. **Combine Depth with Volume Indicators:** Pair order book observation with real-time volume indicators and trade flow logs (Time & Sales data) to confirm whether large resting orders are actually being matched and filled.
---
### Final Thoughts
Market depth offers a clear view into the mechanics of price formation. By learning to interpret order books correctly, recognizing the risks of hidden liquidity, and selecting appropriate order types, traders can dramatically reduce execution costs and better assess market conditions. Market depth analysis is not a standalone crystal ball for predicting price movements, but when integrated into a comprehensive trading methodology, it serves as a critical bridge between theoretical analysis and practical execution.
#CryptoEducation #MarketDepth #TradingStrategy
106
Demystifying Market Depth: How Order Books Shape Price Action and Trade ExecutionWhen trading cryptocurrencies, most beginners focus exclusively on the primary price chart—watching candlesticks move up or down in real time. However, the current spot price displayed on an exchange screen is merely the result of the most recent executed transaction. It tells you where the market was a moment ago, but it reveals very little about how much trading volume the market can handle right now without moving significantly.
To understand how easily an asset's price can move, how orders are filled, and why large transactions sometimes trigger sudden price spikes, traders must look under the hood at market depth.
Market depth is a foundational concept in market structure and liquidity analysis. It reflects an asset's ability to absorb large market orders without experiencing significant, abrupt price changes. In this guide, we will break down what market depth is, how order books function, how to interpret depth charts, and how intermediate traders can use this knowledge to improve trade execution while avoiding common structural pitfalls.
---
### Understanding Order Books and the Bid-Ask Spread
To comprehend market depth, one must first master the structure of an electronic order book. An order book is a real-time, continuously updated list of open limit buy and sell orders for a specific trading pair, organized by price level.
An order book consists of three primary components:
1. **The Bid Side (Buyers):** The bid side displays all active limit buy orders. These represent market participants who want to purchase the asset at a specified price or lower. The highest bid is the best available price for anyone looking to sell immediately.
2. **The Ask Side (Sellers):** The ask side (also known as the offer side) displays all active limit sell orders. These represent participants who want to sell the asset at a specified price or higher. The lowest ask is the best available price for anyone looking to buy immediately.
3. **The Bid-Ask Spread:** The numerical difference between the lowest ask price and the highest bid price is known as the bid-ask spread. In highly liquid markets, this spread is extremely narrow—often just a fraction of a cent or dollar. In illiquid markets, the spread can be wide.
When a trader submits a **market order**, it executes immediately against the best available limit orders resting in the order book. A market buy order sweeps through the ask side starting from the lowest ask price, while a market sell order sweeps through the bid side starting from the highest bid price.
---
### What is Market Depth and Why Does It Matter?
Market depth measures the volume of outstanding limit buy and sell orders at various price levels above and below the current mark price.
If a market has **high depth** (or "deep liquidity"), there are substantial volumes of limit orders residing close to the market price on both sides of the book. In such an environment, a trader can execute a large market order with minimal impact on the overall price.
Conversely, if a market has **shallow depth**, even a relatively modest market order can exhaust the available limit orders at the top level of the order book and force execution into higher or lower price tiers. This difference between the expected execution price and the actual executed price is known as **slippage**.
#### A Practical Example of Slippage and Depth
Imagine a scenario where the current displayed price of Bitcoin on an exchange is $60,000. A trader wants to purchase 10 Bitcoin immediately using a market buy order.
Suppose the order book's ask side looks like this:
* **Level 1:** 2 Bitcoin available at $60,000
* **Level 2:** 3 Bitcoin available at $60,050
* **Level 3:** 5 Bitcoin available at $60,100
When the market buy order for 10 Bitcoin is placed, the exchange order matching engine fills it progressively across available liquidity:
* 2 Bitcoin are bought at $60,000 (Cost: $120,000)
* 3 Bitcoin are bought at $60,050 (Cost: $180,150)
* 5 Bitcoin are bought at $60,100 (Cost: $300,500)
The total expenditure to acquire 10 Bitcoin is $600,650. The effective average purchase price per Bitcoin becomes **$60,065**, rather than the initial mark price of $60,000. The $65 per unit average difference is the direct result of consuming available market depth across multiple price tiers.
---
### Reading Depth Charts and Spotting "Order Walls"
Most visual trading interfaces provide a **Depth Chart** alongside traditional candlestick charts. A depth chart plots cumulative order volume on the Y-axis against price on the X-axis, divided into two colored regions: green for buy orders (bids) and red for sell orders (asks).
* **The Mid-Price:** The center point where the green and red shapes meet represents the current mid-market price.
* **Slope and Volume:** A shallow, gradual slope indicates that limit orders are distributed evenly across price levels. A steep, vertical wall indicates a heavy concentration of limit orders at a single price point.
#### Buy Walls and Sell Walls
* **Buy Wall:** A buy wall occurs when a massive limit buy order (or a dense cluster of orders) rests at a specific price level below the market price. On a depth chart, this appears as a tall green vertical step. Traders often view large buy walls as potential temporary support levels, as price cannot drop further until that entire aggregate buy volume is filled.
* **Sell Wall:** A sell wall occurs when a massive limit sell order rests at a price level above the current market price, appearing as a tall red vertical step. Sell walls represent potential short-term resistance, as buying pressure must absorb all that inventory before price can advance higher.
---
### The Role of Market Makers in Maintaining Depth
Where does market depth actually come from? While individual retail traders contribute limit orders, the bulk of market depth in modern digital asset markets is provided by **Market Makers**.
Market makers are specialized institutional entities or automated high-frequency trading algorithms that continuously place limit buy and limit sell orders on both sides of the book. Their primary objective is to earn small profits from the bid-ask spread while capturing exchange rebates for supplying liquidity.
Market makers play critical roles in market stability:
* **Reducing Slippage:** By placing orders at close intervals, market makers cushion the impact of incoming market orders.
* **Maintaining Efficiency:** Automated market maker bots continuously cross-reference prices across multiple exchanges. If Bitcoin trades at $60,000 on Exchange A and $60,100 on Exchange B, arbitrage algorithms buy on Exchange A and sell on Exchange B, quickly keeping prices and depth synchronized across global venues.
---
### Risks, Limitations, and Manipulative Tactics
While monitoring market depth provides valuable insights into order flow, relying strictly on visible order book data carries distinct risks and limitations:
1. **Spoofing and Fake Depth:** Limit orders are non-binding until filled and can be canceled instantly. Predatory traders sometimes place massive limit orders (e.g., a huge fake buy wall) to manipulate market sentiment and trick retail traders into buying, only to cancel the wall before price reaches it. This illegal tactic is known as spoofing.
2. **Iceberg Orders:** Institutional traders looking to move large positions often use "iceberg orders." These are algorithmic orders split into smaller displayed tranches. For instance, an institutional seller might place an order for 500 Ethereum, but only display 5 Ethereum at a time in the public order book. Once one tranche fills, the next automatically populates. Consequently, real market depth may be significantly larger than what is visible on screen.
3. **Off-Exchange Liquidity (OTC Desks):** Massive trades executed by institutions rarely go through public spot order books to prevent market impact. Instead, they occur Over-The-Counter (OTC). Therefore, exchange depth charts do not reflect total global supply and demand.
4. **Dynamic Liquidity Withdrawal:** During periods of sharp market volatility or macroeconomic announcements, market-making algorithms frequently cancel their limit orders in real time to avoid severe losses. As a result, order book depth can evaporate in milliseconds, leaving the market vulnerable to sharp slippage right when liquidity is needed most.
---
### Practical Execution Strategies for Traders
Understanding order book dynamics allows intermediate traders to make smarter execution decisions:
* **Match Order Types to Market Depth:** For major assets like Bitcoin or Ethereum on high-volume platforms, market orders may experience negligible slippage for small position sizes. However, for lower-capitalization altcoins with shallow order books, traders should rely primarily on **limit orders** or continuous execution algorithms (such as TWAP) to maintain price control.
* **Verify Walls Before Assuming Support:** Do not assume a buy or sell wall will hold as support or resistance simply because it appears on a depth chart. Observe how the wall behaves as price approaches: if the order volume rapidly shrinks or disappears entirely, it may have been a temporary or manipulative wall.
* **Account for Fee Structures:** Exchanges often charge lower fees to "makers" (those who add limit orders to the book) than to "takers" (those who remove orders with market orders). Using limit orders to add depth not only prevents slippage but can also lower transaction costs over time.
---
### Conclusion
Market depth offers a clear window into the real-time mechanics of asset pricing and trading volume distribution. By learning to interpret order books and depth charts, intermediate traders can better evaluate market structure, minimize execution costs, and recognize the structural realities behind rapid price moves.
However, order book analysis should never be viewed as an isolated forecasting tool. Because limit orders can be modified, canceled, or hidden within fractions of a second, market depth analysis must always be paired with prudent risk management, realistic positioning, and a broader analysis of market context.
#CryptoTrading #MarketDepth #OrderBook
Demystifying Market Depth: How Order Books Shape Price Action and Trade Execution
When trading cryptocurrencies, most beginners focus exclusively on the primary price chart—watching candlesticks move up or down in real time. However, the current spot price displayed on an exchange screen is merely the result of the most recent executed transaction. It tells you where the market was a moment ago, but it reveals very little about how much trading volume the market can handle right now without moving significantly.
To understand how easily an asset's price can move, how orders are filled, and why large transactions sometimes trigger sudden price spikes, traders must look under the hood at market depth.
Market depth is a foundational concept in market structure and liquidity analysis. It reflects an asset's ability to absorb large market orders without experiencing significant, abrupt price changes. In this guide, we will break down what market depth is, how order books function, how to interpret depth charts, and how intermediate traders can use this knowledge to improve trade execution while avoiding common structural pitfalls.
---
### Understanding Order Books and the Bid-Ask Spread
To comprehend market depth, one must first master the structure of an electronic order book. An order book is a real-time, continuously updated list of open limit buy and sell orders for a specific trading pair, organized by price level.
An order book consists of three primary components:
1. **The Bid Side (Buyers):** The bid side displays all active limit buy orders. These represent market participants who want to purchase the asset at a specified price or lower. The highest bid is the best available price for anyone looking to sell immediately.
2. **The Ask Side (Sellers):** The ask side (also known as the offer side) displays all active limit sell orders. These represent participants who want to sell the asset at a specified price or higher. The lowest ask is the best available price for anyone looking to buy immediately.
3. **The Bid-Ask Spread:** The numerical difference between the lowest ask price and the highest bid price is known as the bid-ask spread. In highly liquid markets, this spread is extremely narrow—often just a fraction of a cent or dollar. In illiquid markets, the spread can be wide.
When a trader submits a **market order**, it executes immediately against the best available limit orders resting in the order book. A market buy order sweeps through the ask side starting from the lowest ask price, while a market sell order sweeps through the bid side starting from the highest bid price.
---
### What is Market Depth and Why Does It Matter?
Market depth measures the volume of outstanding limit buy and sell orders at various price levels above and below the current mark price.
If a market has **high depth** (or "deep liquidity"), there are substantial volumes of limit orders residing close to the market price on both sides of the book. In such an environment, a trader can execute a large market order with minimal impact on the overall price.
Conversely, if a market has **shallow depth**, even a relatively modest market order can exhaust the available limit orders at the top level of the order book and force execution into higher or lower price tiers. This difference between the expected execution price and the actual executed price is known as **slippage**.
#### A Practical Example of Slippage and Depth
Imagine a scenario where the current displayed price of Bitcoin on an exchange is $60,000. A trader wants to purchase 10 Bitcoin immediately using a market buy order.
Suppose the order book's ask side looks like this:
* **Level 1:** 2 Bitcoin available at $60,000
* **Level 2:** 3 Bitcoin available at $60,050
* **Level 3:** 5 Bitcoin available at $60,100
When the market buy order for 10 Bitcoin is placed, the exchange order matching engine fills it progressively across available liquidity:
* 2 Bitcoin are bought at $60,000 (Cost: $120,000)
* 3 Bitcoin are bought at $60,050 (Cost: $180,150)
* 5 Bitcoin are bought at $60,100 (Cost: $300,500)
The total expenditure to acquire 10 Bitcoin is $600,650. The effective average purchase price per Bitcoin becomes **$60,065**, rather than the initial mark price of $60,000. The $65 per unit average difference is the direct result of consuming available market depth across multiple price tiers.
---
### Reading Depth Charts and Spotting "Order Walls"
Most visual trading interfaces provide a **Depth Chart** alongside traditional candlestick charts. A depth chart plots cumulative order volume on the Y-axis against price on the X-axis, divided into two colored regions: green for buy orders (bids) and red for sell orders (asks).
* **The Mid-Price:** The center point where the green and red shapes meet represents the current mid-market price.
* **Slope and Volume:** A shallow, gradual slope indicates that limit orders are distributed evenly across price levels. A steep, vertical wall indicates a heavy concentration of limit orders at a single price point.
#### Buy Walls and Sell Walls
* **Buy Wall:** A buy wall occurs when a massive limit buy order (or a dense cluster of orders) rests at a specific price level below the market price. On a depth chart, this appears as a tall green vertical step. Traders often view large buy walls as potential temporary support levels, as price cannot drop further until that entire aggregate buy volume is filled.
* **Sell Wall:** A sell wall occurs when a massive limit sell order rests at a price level above the current market price, appearing as a tall red vertical step. Sell walls represent potential short-term resistance, as buying pressure must absorb all that inventory before price can advance higher.
---
### The Role of Market Makers in Maintaining Depth
Where does market depth actually come from? While individual retail traders contribute limit orders, the bulk of market depth in modern digital asset markets is provided by **Market Makers**.
Market makers are specialized institutional entities or automated high-frequency trading algorithms that continuously place limit buy and limit sell orders on both sides of the book. Their primary objective is to earn small profits from the bid-ask spread while capturing exchange rebates for supplying liquidity.
Market makers play critical roles in market stability:
* **Reducing Slippage:** By placing orders at close intervals, market makers cushion the impact of incoming market orders.
* **Maintaining Efficiency:** Automated market maker bots continuously cross-reference prices across multiple exchanges. If Bitcoin trades at $60,000 on Exchange A and $60,100 on Exchange B, arbitrage algorithms buy on Exchange A and sell on Exchange B, quickly keeping prices and depth synchronized across global venues.
---
### Risks, Limitations, and Manipulative Tactics
While monitoring market depth provides valuable insights into order flow, relying strictly on visible order book data carries distinct risks and limitations:
1. **Spoofing and Fake Depth:** Limit orders are non-binding until filled and can be canceled instantly. Predatory traders sometimes place massive limit orders (e.g., a huge fake buy wall) to manipulate market sentiment and trick retail traders into buying, only to cancel the wall before price reaches it. This illegal tactic is known as spoofing.
2. **Iceberg Orders:** Institutional traders looking to move large positions often use "iceberg orders." These are algorithmic orders split into smaller displayed tranches. For instance, an institutional seller might place an order for 500 Ethereum, but only display 5 Ethereum at a time in the public order book. Once one tranche fills, the next automatically populates. Consequently, real market depth may be significantly larger than what is visible on screen.
3. **Off-Exchange Liquidity (OTC Desks):** Massive trades executed by institutions rarely go through public spot order books to prevent market impact. Instead, they occur Over-The-Counter (OTC). Therefore, exchange depth charts do not reflect total global supply and demand.
4. **Dynamic Liquidity Withdrawal:** During periods of sharp market volatility or macroeconomic announcements, market-making algorithms frequently cancel their limit orders in real time to avoid severe losses. As a result, order book depth can evaporate in milliseconds, leaving the market vulnerable to sharp slippage right when liquidity is needed most.
---
### Practical Execution Strategies for Traders
Understanding order book dynamics allows intermediate traders to make smarter execution decisions:
* **Match Order Types to Market Depth:** For major assets like Bitcoin or Ethereum on high-volume platforms, market orders may experience negligible slippage for small position sizes. However, for lower-capitalization altcoins with shallow order books, traders should rely primarily on **limit orders** or continuous execution algorithms (such as TWAP) to maintain price control.
* **Verify Walls Before Assuming Support:** Do not assume a buy or sell wall will hold as support or resistance simply because it appears on a depth chart. Observe how the wall behaves as price approaches: if the order volume rapidly shrinks or disappears entirely, it may have been a temporary or manipulative wall.
* **Account for Fee Structures:** Exchanges often charge lower fees to "makers" (those who add limit orders to the book) than to "takers" (those who remove orders with market orders). Using limit orders to add depth not only prevents slippage but can also lower transaction costs over time.
---
### Conclusion
Market depth offers a clear window into the real-time mechanics of asset pricing and trading volume distribution. By learning to interpret order books and depth charts, intermediate traders can better evaluate market structure, minimize execution costs, and recognize the structural realities behind rapid price moves.
However, order book analysis should never be viewed as an isolated forecasting tool. Because limit orders can be modified, canceled, or hidden within fractions of a second, market depth analysis must always be paired with prudent risk management, realistic positioning, and a broader analysis of market context.
#CryptoTrading #MarketDepth #OrderBook
To understand how easily an asset's price can move, how orders are filled, and why large transactions sometimes trigger sudden price spikes, traders must look under the hood at market depth.
Market depth is a foundational concept in market structure and liquidity analysis. It reflects an asset's ability to absorb large market orders without experiencing significant, abrupt price changes. In this guide, we will break down what market depth is, how order books function, how to interpret depth charts, and how intermediate traders can use this knowledge to improve trade execution while avoiding common structural pitfalls.
---
### Understanding Order Books and the Bid-Ask Spread
To comprehend market depth, one must first master the structure of an electronic order book. An order book is a real-time, continuously updated list of open limit buy and sell orders for a specific trading pair, organized by price level.
An order book consists of three primary components:
1. **The Bid Side (Buyers):** The bid side displays all active limit buy orders. These represent market participants who want to purchase the asset at a specified price or lower. The highest bid is the best available price for anyone looking to sell immediately.
2. **The Ask Side (Sellers):** The ask side (also known as the offer side) displays all active limit sell orders. These represent participants who want to sell the asset at a specified price or higher. The lowest ask is the best available price for anyone looking to buy immediately.
3. **The Bid-Ask Spread:** The numerical difference between the lowest ask price and the highest bid price is known as the bid-ask spread. In highly liquid markets, this spread is extremely narrow—often just a fraction of a cent or dollar. In illiquid markets, the spread can be wide.
When a trader submits a **market order**, it executes immediately against the best available limit orders resting in the order book. A market buy order sweeps through the ask side starting from the lowest ask price, while a market sell order sweeps through the bid side starting from the highest bid price.
---
### What is Market Depth and Why Does It Matter?
Market depth measures the volume of outstanding limit buy and sell orders at various price levels above and below the current mark price.
If a market has **high depth** (or "deep liquidity"), there are substantial volumes of limit orders residing close to the market price on both sides of the book. In such an environment, a trader can execute a large market order with minimal impact on the overall price.
Conversely, if a market has **shallow depth**, even a relatively modest market order can exhaust the available limit orders at the top level of the order book and force execution into higher or lower price tiers. This difference between the expected execution price and the actual executed price is known as **slippage**.
#### A Practical Example of Slippage and Depth
Imagine a scenario where the current displayed price of Bitcoin on an exchange is $60,000. A trader wants to purchase 10 Bitcoin immediately using a market buy order.
Suppose the order book's ask side looks like this:
* **Level 1:** 2 Bitcoin available at $60,000
* **Level 2:** 3 Bitcoin available at $60,050
* **Level 3:** 5 Bitcoin available at $60,100
When the market buy order for 10 Bitcoin is placed, the exchange order matching engine fills it progressively across available liquidity:
* 2 Bitcoin are bought at $60,000 (Cost: $120,000)
* 3 Bitcoin are bought at $60,050 (Cost: $180,150)
* 5 Bitcoin are bought at $60,100 (Cost: $300,500)
The total expenditure to acquire 10 Bitcoin is $600,650. The effective average purchase price per Bitcoin becomes **$60,065**, rather than the initial mark price of $60,000. The $65 per unit average difference is the direct result of consuming available market depth across multiple price tiers.
---
### Reading Depth Charts and Spotting "Order Walls"
Most visual trading interfaces provide a **Depth Chart** alongside traditional candlestick charts. A depth chart plots cumulative order volume on the Y-axis against price on the X-axis, divided into two colored regions: green for buy orders (bids) and red for sell orders (asks).
* **The Mid-Price:** The center point where the green and red shapes meet represents the current mid-market price.
* **Slope and Volume:** A shallow, gradual slope indicates that limit orders are distributed evenly across price levels. A steep, vertical wall indicates a heavy concentration of limit orders at a single price point.
#### Buy Walls and Sell Walls
* **Buy Wall:** A buy wall occurs when a massive limit buy order (or a dense cluster of orders) rests at a specific price level below the market price. On a depth chart, this appears as a tall green vertical step. Traders often view large buy walls as potential temporary support levels, as price cannot drop further until that entire aggregate buy volume is filled.
* **Sell Wall:** A sell wall occurs when a massive limit sell order rests at a price level above the current market price, appearing as a tall red vertical step. Sell walls represent potential short-term resistance, as buying pressure must absorb all that inventory before price can advance higher.
---
### The Role of Market Makers in Maintaining Depth
Where does market depth actually come from? While individual retail traders contribute limit orders, the bulk of market depth in modern digital asset markets is provided by **Market Makers**.
Market makers are specialized institutional entities or automated high-frequency trading algorithms that continuously place limit buy and limit sell orders on both sides of the book. Their primary objective is to earn small profits from the bid-ask spread while capturing exchange rebates for supplying liquidity.
Market makers play critical roles in market stability:
* **Reducing Slippage:** By placing orders at close intervals, market makers cushion the impact of incoming market orders.
* **Maintaining Efficiency:** Automated market maker bots continuously cross-reference prices across multiple exchanges. If Bitcoin trades at $60,000 on Exchange A and $60,100 on Exchange B, arbitrage algorithms buy on Exchange A and sell on Exchange B, quickly keeping prices and depth synchronized across global venues.
---
### Risks, Limitations, and Manipulative Tactics
While monitoring market depth provides valuable insights into order flow, relying strictly on visible order book data carries distinct risks and limitations:
1. **Spoofing and Fake Depth:** Limit orders are non-binding until filled and can be canceled instantly. Predatory traders sometimes place massive limit orders (e.g., a huge fake buy wall) to manipulate market sentiment and trick retail traders into buying, only to cancel the wall before price reaches it. This illegal tactic is known as spoofing.
2. **Iceberg Orders:** Institutional traders looking to move large positions often use "iceberg orders." These are algorithmic orders split into smaller displayed tranches. For instance, an institutional seller might place an order for 500 Ethereum, but only display 5 Ethereum at a time in the public order book. Once one tranche fills, the next automatically populates. Consequently, real market depth may be significantly larger than what is visible on screen.
3. **Off-Exchange Liquidity (OTC Desks):** Massive trades executed by institutions rarely go through public spot order books to prevent market impact. Instead, they occur Over-The-Counter (OTC). Therefore, exchange depth charts do not reflect total global supply and demand.
4. **Dynamic Liquidity Withdrawal:** During periods of sharp market volatility or macroeconomic announcements, market-making algorithms frequently cancel their limit orders in real time to avoid severe losses. As a result, order book depth can evaporate in milliseconds, leaving the market vulnerable to sharp slippage right when liquidity is needed most.
---
### Practical Execution Strategies for Traders
Understanding order book dynamics allows intermediate traders to make smarter execution decisions:
* **Match Order Types to Market Depth:** For major assets like Bitcoin or Ethereum on high-volume platforms, market orders may experience negligible slippage for small position sizes. However, for lower-capitalization altcoins with shallow order books, traders should rely primarily on **limit orders** or continuous execution algorithms (such as TWAP) to maintain price control.
* **Verify Walls Before Assuming Support:** Do not assume a buy or sell wall will hold as support or resistance simply because it appears on a depth chart. Observe how the wall behaves as price approaches: if the order volume rapidly shrinks or disappears entirely, it may have been a temporary or manipulative wall.
* **Account for Fee Structures:** Exchanges often charge lower fees to "makers" (those who add limit orders to the book) than to "takers" (those who remove orders with market orders). Using limit orders to add depth not only prevents slippage but can also lower transaction costs over time.
---
### Conclusion
Market depth offers a clear window into the real-time mechanics of asset pricing and trading volume distribution. By learning to interpret order books and depth charts, intermediate traders can better evaluate market structure, minimize execution costs, and recognize the structural realities behind rapid price moves.
However, order book analysis should never be viewed as an isolated forecasting tool. Because limit orders can be modified, canceled, or hidden within fractions of a second, market depth analysis must always be paired with prudent risk management, realistic positioning, and a broader analysis of market context.
#CryptoTrading #MarketDepth #OrderBook
132
Demystifying Market Depth: How Order Books Drive Crypto Execution and Price StabilityWhen observing cryptocurrency markets, most market participants focus primarily on the candlestick chart. They watch the price tick up or down, tracking resistance levels, support channels, and moving averages. However, a standard price chart only displays historical transactions—the record of where buyers and sellers previously agreed on value. It does not explicitly show the pending supply and demand sitting quietly behind the scenes.
To truly understand price movement, execution efficiency, and market fragility, one must look at market depth. Market depth provides a real-time window into the order book, detailing the volume of buy and sell limit orders waiting to be filled at various price levels. For intermediate traders and market participants, mastering the concepts of market depth is essential for minimizing execution costs, identifying potential manipulation, and gauging true market liquidity.
---
### What Is Market Depth?
At its core, market depth measures a market's ability to absorb relatively large market orders without causing significant price shifts. It reflects the overall volume of open limit orders placed on an exchange's central limit order book (CLOB).
In any standard exchange interface, the order book is split into two primary components:
1. **Bids (Buy Orders):** Located below the current market price, bids represent buyers willing to purchase an asset at a specified price or lower.
2. **Asks (Sell Orders or Offers):** Located above the current market price, asks represent sellers willing to part with their asset at a specified price or higher.
The difference between the lowest ask price and the highest bid price is known as the **bid-ask spread**.
Market depth visualizes how many units of an asset are queued up across price ticks on both the bid side and the ask side. A market is considered "deep" if there are substantial buy and sell orders close to the mid-price. Conversely, a market is considered "shallow" or "thin" if only a few small orders exist near the current trading price.
---
### Anatomy of the Order Book and Depth Chart
To visualize market depth, trading platforms often use a cumulative depth chart. This chart features price on the horizontal axis and cumulative order volume on the vertical axis.
* **The Bid Side (Green):** Slopes downward to the left. It accumulates the total volume of buy orders as price levels decrease from the current mark price.
* **The Ask Side (Red):** Slopes upward to the right. It accumulates the total volume of sell orders as price levels increase from the current mark price.
#### Buy Walls and Sell Walls
When viewing a depth chart, you may notice sharp, steep vertical steps. These are commonly referred to as "walls."
* **A Buy Wall** occurs when a single buyer or a group of buyers places a massive limit order at a specific price level below the current price. It acts as a potential support line because market sellers must fill all the volume within that wall before the price can drop lower.
* **A Sell Wall** occurs when a large limit sell order is placed at a specific price level above the current price. It acts as potential overhead resistance because market buyers must consume all the liquidity at that level before the price can move higher.
While walls appear to show strong support or resistance, intermediate market participants must approach them with caution. Unlike completed trades, unfilled limit orders can be canceled instantly by automated trading systems before price ever reaches them.
---
### Critical Metrics Derived from Market Depth
Understanding market depth requires analyzing specific metrics that quantify how easily orders can be executed.
#### 1. Slippage and Price Impact
Market orders prioritize speed of execution over price. When a trader places a large market buy order, the exchange engine fills the order against the lowest available ask. If the order size exceeds the volume available at the top of the order book, the engine automatically walks up the book, filling remaining portions of the order at progressively higher ask prices.
The difference between the expected execution price (the price visible when the order was submitted) and the actual average filled price is known as **slippage**. Deep market depth minimizes slippage, whereas thin market depth leads to high slippage and severe price impact.
#### 2. The 2% Market Depth Standard
Institutional participants and analytics platforms rarely rely solely on total order book volume, as orders placed 50% away from the current price have little relevance to immediate trading conditions. Instead, they monitor **2% Market Depth**.
This metric calculates the cumulative fiat value of bids and asks sitting within 2% above and below the current mid-price. For major digital assets like Bitcoin and Ethereum, 2% market depth often runs into tens of millions of dollars across top exchanges. For lower-capitalization tokens, 2% market depth might be only a few thousand dollars, rendering them highly vulnerable to sudden volatility caused by modest orders.
#### 3. Bid-Ask Spread Dynamics
The spread itself is a direct reflection of market depth and market-maker risk perception:
* **Tight Spreads:** Indicate high liquidity, dense order depth, and competitive market-making. Trades execute close to market valuation.
* **Wide Spreads:** Indicate low liquidity, sparse order depth, or heightened uncertainty (such as during major macroeconomic announcements), leading market makers to demand a higher risk premium.
---
### Practical Applications in Crypto Trading
Understanding depth allows market participants to move beyond basic chart patterns and make informed operational decisions:
* **Optimizing Order Execution:** If an investor intends to rebalance a portfolio position, inspecting market depth helps determine whether to use market orders, limit orders, or algorithmic execution strategies like Time-Weighted Average Price (TWAP). Placing a single large market order into a shallow book can instantly cause self-inflicted slippage losses.
* **Evaluating Token Fragility:** Market capitalization alone can be misleading. A token may sport a billion-dollar market cap based on circulating supply multiplied by the last trade price, but possess only $50,000 in 2% market depth. Market depth reveals the true capital required to move a token's price up or down.
* **Assessing Liquidity Fragmentation:** Cryptocurrency trading is spread across numerous centralized and decentralized venues. Analyzing market depth across different platforms helps participants identify where real liquidity resides versus venues with inflated reporting or hollow books.
---
### Risks, Manipulations, and Limitations
While market depth provides invaluable insights, relying on it blindly carries distinct risks. The order book is a dynamic environment subject to strategic maneuvering by sophisticated actors.
#### Spoofing and Phantom Liquidity
Spoofing occurs when traders place large, visible limit orders with no intention of executing them. The goal is to create a false impression of heavy buying support or selling pressure, deceiving other market participants into trading in a specific direction. Once price approaches the fake wall, the orders are instantly canceled using high-frequency APIs.
#### Hidden and Iceberg Orders
Not all depth is visible on the public order book. Institutions frequently utilize **iceberg orders**, which split a massive order into small visible tranches. As each visible tranche fills, another is automatically posted. Therefore, a price level that appears thin on the depth chart may actually contain substantial hidden liquidity.
#### Decentralized Automated Market Makers (AMMs)
Market depth mechanics differ substantially between traditional centralized order books and Decentralized Finance (DeFi) protocols using Constant Product Automated Market Makers (e.g., $x \times y = k$). On AMMs, depth is determined by liquidity pool balances rather than pending limit orders. Slippage on AMMs follows a deterministic mathematical curve rather than an aggregated list of individual limit prices.
---
### Final Thoughts
Market depth is the underlying structural engine of crypto market mechanics. While price charts tell you where an asset has been, market depth helps reveal how efficiently an asset can move next.
By analyzing order book density, monitoring 2% depth metrics, and remaining vigilant against phantom liquidity, intermediate crypto participants can execute trades more effectively, protect capital from excessive slippage, and gain a clearer understanding of true supply and demand.
#CryptoEducation #MarketDepth #TradingMechanics
Demystifying Market Depth: How Order Books Drive Crypto Execution and Price Stability
When observing cryptocurrency markets, most market participants focus primarily on the candlestick chart. They watch the price tick up or down, tracking resistance levels, support channels, and moving averages. However, a standard price chart only displays historical transactions—the record of where buyers and sellers previously agreed on value. It does not explicitly show the pending supply and demand sitting quietly behind the scenes.
To truly understand price movement, execution efficiency, and market fragility, one must look at market depth. Market depth provides a real-time window into the order book, detailing the volume of buy and sell limit orders waiting to be filled at various price levels. For intermediate traders and market participants, mastering the concepts of market depth is essential for minimizing execution costs, identifying potential manipulation, and gauging true market liquidity.
---
### What Is Market Depth?
At its core, market depth measures a market's ability to absorb relatively large market orders without causing significant price shifts. It reflects the overall volume of open limit orders placed on an exchange's central limit order book (CLOB).
In any standard exchange interface, the order book is split into two primary components:
1. **Bids (Buy Orders):** Located below the current market price, bids represent buyers willing to purchase an asset at a specified price or lower.
2. **Asks (Sell Orders or Offers):** Located above the current market price, asks represent sellers willing to part with their asset at a specified price or higher.
The difference between the lowest ask price and the highest bid price is known as the **bid-ask spread**.
Market depth visualizes how many units of an asset are queued up across price ticks on both the bid side and the ask side. A market is considered "deep" if there are substantial buy and sell orders close to the mid-price. Conversely, a market is considered "shallow" or "thin" if only a few small orders exist near the current trading price.
---
### Anatomy of the Order Book and Depth Chart
To visualize market depth, trading platforms often use a cumulative depth chart. This chart features price on the horizontal axis and cumulative order volume on the vertical axis.
* **The Bid Side (Green):** Slopes downward to the left. It accumulates the total volume of buy orders as price levels decrease from the current mark price.
* **The Ask Side (Red):** Slopes upward to the right. It accumulates the total volume of sell orders as price levels increase from the current mark price.
#### Buy Walls and Sell Walls
When viewing a depth chart, you may notice sharp, steep vertical steps. These are commonly referred to as "walls."
* **A Buy Wall** occurs when a single buyer or a group of buyers places a massive limit order at a specific price level below the current price. It acts as a potential support line because market sellers must fill all the volume within that wall before the price can drop lower.
* **A Sell Wall** occurs when a large limit sell order is placed at a specific price level above the current price. It acts as potential overhead resistance because market buyers must consume all the liquidity at that level before the price can move higher.
While walls appear to show strong support or resistance, intermediate market participants must approach them with caution. Unlike completed trades, unfilled limit orders can be canceled instantly by automated trading systems before price ever reaches them.
---
### Critical Metrics Derived from Market Depth
Understanding market depth requires analyzing specific metrics that quantify how easily orders can be executed.
#### 1. Slippage and Price Impact
Market orders prioritize speed of execution over price. When a trader places a large market buy order, the exchange engine fills the order against the lowest available ask. If the order size exceeds the volume available at the top of the order book, the engine automatically walks up the book, filling remaining portions of the order at progressively higher ask prices.
The difference between the expected execution price (the price visible when the order was submitted) and the actual average filled price is known as **slippage**. Deep market depth minimizes slippage, whereas thin market depth leads to high slippage and severe price impact.
#### 2. The 2% Market Depth Standard
Institutional participants and analytics platforms rarely rely solely on total order book volume, as orders placed 50% away from the current price have little relevance to immediate trading conditions. Instead, they monitor **2% Market Depth**.
This metric calculates the cumulative fiat value of bids and asks sitting within 2% above and below the current mid-price. For major digital assets like Bitcoin and Ethereum, 2% market depth often runs into tens of millions of dollars across top exchanges. For lower-capitalization tokens, 2% market depth might be only a few thousand dollars, rendering them highly vulnerable to sudden volatility caused by modest orders.
#### 3. Bid-Ask Spread Dynamics
The spread itself is a direct reflection of market depth and market-maker risk perception:
* **Tight Spreads:** Indicate high liquidity, dense order depth, and competitive market-making. Trades execute close to market valuation.
* **Wide Spreads:** Indicate low liquidity, sparse order depth, or heightened uncertainty (such as during major macroeconomic announcements), leading market makers to demand a higher risk premium.
---
### Practical Applications in Crypto Trading
Understanding depth allows market participants to move beyond basic chart patterns and make informed operational decisions:
* **Optimizing Order Execution:** If an investor intends to rebalance a portfolio position, inspecting market depth helps determine whether to use market orders, limit orders, or algorithmic execution strategies like Time-Weighted Average Price (TWAP). Placing a single large market order into a shallow book can instantly cause self-inflicted slippage losses.
* **Evaluating Token Fragility:** Market capitalization alone can be misleading. A token may sport a billion-dollar market cap based on circulating supply multiplied by the last trade price, but possess only $50,000 in 2% market depth. Market depth reveals the true capital required to move a token's price up or down.
* **Assessing Liquidity Fragmentation:** Cryptocurrency trading is spread across numerous centralized and decentralized venues. Analyzing market depth across different platforms helps participants identify where real liquidity resides versus venues with inflated reporting or hollow books.
---
### Risks, Manipulations, and Limitations
While market depth provides invaluable insights, relying on it blindly carries distinct risks. The order book is a dynamic environment subject to strategic maneuvering by sophisticated actors.
#### Spoofing and Phantom Liquidity
Spoofing occurs when traders place large, visible limit orders with no intention of executing them. The goal is to create a false impression of heavy buying support or selling pressure, deceiving other market participants into trading in a specific direction. Once price approaches the fake wall, the orders are instantly canceled using high-frequency APIs.
#### Hidden and Iceberg Orders
Not all depth is visible on the public order book. Institutions frequently utilize **iceberg orders**, which split a massive order into small visible tranches. As each visible tranche fills, another is automatically posted. Therefore, a price level that appears thin on the depth chart may actually contain substantial hidden liquidity.
#### Decentralized Automated Market Makers (AMMs)
Market depth mechanics differ substantially between traditional centralized order books and Decentralized Finance (DeFi) protocols using Constant Product Automated Market Makers (e.g., $x \times y = k$). On AMMs, depth is determined by liquidity pool balances rather than pending limit orders. Slippage on AMMs follows a deterministic mathematical curve rather than an aggregated list of individual limit prices.
---
### Final Thoughts
Market depth is the underlying structural engine of crypto market mechanics. While price charts tell you where an asset has been, market depth helps reveal how efficiently an asset can move next.
By analyzing order book density, monitoring 2% depth metrics, and remaining vigilant against phantom liquidity, intermediate crypto participants can execute trades more effectively, protect capital from excessive slippage, and gain a clearer understanding of true supply and demand.
#CryptoEducation #MarketDepth #TradingMechanics
To truly understand price movement, execution efficiency, and market fragility, one must look at market depth. Market depth provides a real-time window into the order book, detailing the volume of buy and sell limit orders waiting to be filled at various price levels. For intermediate traders and market participants, mastering the concepts of market depth is essential for minimizing execution costs, identifying potential manipulation, and gauging true market liquidity.
---
### What Is Market Depth?
At its core, market depth measures a market's ability to absorb relatively large market orders without causing significant price shifts. It reflects the overall volume of open limit orders placed on an exchange's central limit order book (CLOB).
In any standard exchange interface, the order book is split into two primary components:
1. **Bids (Buy Orders):** Located below the current market price, bids represent buyers willing to purchase an asset at a specified price or lower.
2. **Asks (Sell Orders or Offers):** Located above the current market price, asks represent sellers willing to part with their asset at a specified price or higher.
The difference between the lowest ask price and the highest bid price is known as the **bid-ask spread**.
Market depth visualizes how many units of an asset are queued up across price ticks on both the bid side and the ask side. A market is considered "deep" if there are substantial buy and sell orders close to the mid-price. Conversely, a market is considered "shallow" or "thin" if only a few small orders exist near the current trading price.
---
### Anatomy of the Order Book and Depth Chart
To visualize market depth, trading platforms often use a cumulative depth chart. This chart features price on the horizontal axis and cumulative order volume on the vertical axis.
* **The Bid Side (Green):** Slopes downward to the left. It accumulates the total volume of buy orders as price levels decrease from the current mark price.
* **The Ask Side (Red):** Slopes upward to the right. It accumulates the total volume of sell orders as price levels increase from the current mark price.
#### Buy Walls and Sell Walls
When viewing a depth chart, you may notice sharp, steep vertical steps. These are commonly referred to as "walls."
* **A Buy Wall** occurs when a single buyer or a group of buyers places a massive limit order at a specific price level below the current price. It acts as a potential support line because market sellers must fill all the volume within that wall before the price can drop lower.
* **A Sell Wall** occurs when a large limit sell order is placed at a specific price level above the current price. It acts as potential overhead resistance because market buyers must consume all the liquidity at that level before the price can move higher.
While walls appear to show strong support or resistance, intermediate market participants must approach them with caution. Unlike completed trades, unfilled limit orders can be canceled instantly by automated trading systems before price ever reaches them.
---
### Critical Metrics Derived from Market Depth
Understanding market depth requires analyzing specific metrics that quantify how easily orders can be executed.
#### 1. Slippage and Price Impact
Market orders prioritize speed of execution over price. When a trader places a large market buy order, the exchange engine fills the order against the lowest available ask. If the order size exceeds the volume available at the top of the order book, the engine automatically walks up the book, filling remaining portions of the order at progressively higher ask prices.
The difference between the expected execution price (the price visible when the order was submitted) and the actual average filled price is known as **slippage**. Deep market depth minimizes slippage, whereas thin market depth leads to high slippage and severe price impact.
#### 2. The 2% Market Depth Standard
Institutional participants and analytics platforms rarely rely solely on total order book volume, as orders placed 50% away from the current price have little relevance to immediate trading conditions. Instead, they monitor **2% Market Depth**.
This metric calculates the cumulative fiat value of bids and asks sitting within 2% above and below the current mid-price. For major digital assets like Bitcoin and Ethereum, 2% market depth often runs into tens of millions of dollars across top exchanges. For lower-capitalization tokens, 2% market depth might be only a few thousand dollars, rendering them highly vulnerable to sudden volatility caused by modest orders.
#### 3. Bid-Ask Spread Dynamics
The spread itself is a direct reflection of market depth and market-maker risk perception:
* **Tight Spreads:** Indicate high liquidity, dense order depth, and competitive market-making. Trades execute close to market valuation.
* **Wide Spreads:** Indicate low liquidity, sparse order depth, or heightened uncertainty (such as during major macroeconomic announcements), leading market makers to demand a higher risk premium.
---
### Practical Applications in Crypto Trading
Understanding depth allows market participants to move beyond basic chart patterns and make informed operational decisions:
* **Optimizing Order Execution:** If an investor intends to rebalance a portfolio position, inspecting market depth helps determine whether to use market orders, limit orders, or algorithmic execution strategies like Time-Weighted Average Price (TWAP). Placing a single large market order into a shallow book can instantly cause self-inflicted slippage losses.
* **Evaluating Token Fragility:** Market capitalization alone can be misleading. A token may sport a billion-dollar market cap based on circulating supply multiplied by the last trade price, but possess only $50,000 in 2% market depth. Market depth reveals the true capital required to move a token's price up or down.
* **Assessing Liquidity Fragmentation:** Cryptocurrency trading is spread across numerous centralized and decentralized venues. Analyzing market depth across different platforms helps participants identify where real liquidity resides versus venues with inflated reporting or hollow books.
---
### Risks, Manipulations, and Limitations
While market depth provides invaluable insights, relying on it blindly carries distinct risks. The order book is a dynamic environment subject to strategic maneuvering by sophisticated actors.
#### Spoofing and Phantom Liquidity
Spoofing occurs when traders place large, visible limit orders with no intention of executing them. The goal is to create a false impression of heavy buying support or selling pressure, deceiving other market participants into trading in a specific direction. Once price approaches the fake wall, the orders are instantly canceled using high-frequency APIs.
#### Hidden and Iceberg Orders
Not all depth is visible on the public order book. Institutions frequently utilize **iceberg orders**, which split a massive order into small visible tranches. As each visible tranche fills, another is automatically posted. Therefore, a price level that appears thin on the depth chart may actually contain substantial hidden liquidity.
#### Decentralized Automated Market Makers (AMMs)
Market depth mechanics differ substantially between traditional centralized order books and Decentralized Finance (DeFi) protocols using Constant Product Automated Market Makers (e.g., $x \times y = k$). On AMMs, depth is determined by liquidity pool balances rather than pending limit orders. Slippage on AMMs follows a deterministic mathematical curve rather than an aggregated list of individual limit prices.
---
### Final Thoughts
Market depth is the underlying structural engine of crypto market mechanics. While price charts tell you where an asset has been, market depth helps reveal how efficiently an asset can move next.
By analyzing order book density, monitoring 2% depth metrics, and remaining vigilant against phantom liquidity, intermediate crypto participants can execute trades more effectively, protect capital from excessive slippage, and gain a clearer understanding of true supply and demand.
#CryptoEducation #MarketDepth #TradingMechanics
151
Demystifying Crypto Liquidity: How Order Books, Pools, and Market Depth Shape Price ActionLiquidity is often described as the lifeblood of financial markets, yet it remains one of the most misunderstood concepts among retail crypto market participants. While traders frequently focus on technical chart patterns, fundamental developments, or sentiment indicators, liquidity quietly dictates whether a trade executes seamlessly at a expected price or triggers a costly cascade of slippage.
For intermediate traders moving beyond basic spot buying, developing a structural understanding of crypto liquidity is essential. It explains why sudden market crashes occur, how large orders move markets, and why price action behaves differently across decentralized exchanges compared to centralized order books.
---
### 1. Defining Liquidity in Cryptocurrency Markets
At its core, liquidity measures the ease with which an asset can be bought or sold in the market without causing a significant change in its price.
An asset with high liquidity features numerous active buyers and sellers, heavy trading volume, and deep resting orders close to the current market price. Large market caps like Bitcoin and Ethereum typically exhibit high liquidity across major exchanges, allowing traders to execute multi-million dollar trades with minimal impact on the prevailing price.
Conversely, low-liquidity assets—such as micro-cap altcoins or newly launched tokens—have sparse buying and selling interest. In these markets, even modest trade sizes can push prices drastically up or down, creating extreme volatility and execution risks.
Liquidity is not static; it fluctuates continuously based on market hours, global macroeconomic conditions, exchange health, and overarching market sentiment.
---
### 2. Mechanics of Liquidity: Order Books, Spreads, and Depth
To understand where liquidity lives on a centralized exchange, one must look directly at the order book. An order book is a real-time, dynamic ledger displaying all pending limit buy orders (bids) and limit sell orders (asks).
Three core components define an order book's liquidity profile:
#### The Bid-Ask Spread
The bid-ask spread is the gap between the highest price a buyer is willing to pay (best bid) and the lowest price a seller is willing to accept (best ask). Highly liquid assets feature tight spreads, often mere cents or fractions of a percent apart. Illiquid assets display wide spreads, meaning a trader instantly incurs a loss the moment they buy at the market ask and attempt to sell back at the market bid.
#### Market Depth
Market depth represents the total volume of limit orders stacked at various price levels above and below the current market price. A "deep" order book contains large amounts of capital queued up at incremental price steps. A "shallow" order book has thin volume, meaning a large market order can easily slice through multiple price tiers.
#### Slippage and Price Impact
When a trader submits a market order, the exchange engine fills the order against the best available limit orders on the opposite side of the book. If the order size exceeds the volume available at the top bid or ask, the order sweeps through subsequent levels of the order book until it is fully filled.
The difference between the expected price when the order was submitted and the actual average execution price is known as **slippage**. High liquidity minimizes slippage; low liquidity amplifies it.
---
### 3. Centralized Order Books vs. Decentralized Liquidity Pools
Crypto features two distinct market architectures, each handling liquidity differently: Centralized Exchanges (CEXs) and Decentralized Exchanges (DEXs).
#### Centralized Order Books
CEXs rely on traditional limit order books (LOBs). Liquidity is largely provided by professional market-making firms and individual traders placing limit orders. Orders are processed off-chain matching engines at near-instantaneous speeds, allowing order books to update continuously as market conditions evolve.
#### Decentralized Automated Market Makers (AMMs)
DEXs replace traditional order books with Automated Market Makers and liquidity pools. Instead of matching buyers with sellers directly, trades occur against a smart contract containing a paired pool of assets (for example, Ethereum paired with a stablecoin).
Prices in a standard AMM are determined mathematically, commonly using constant product formulas ($x \times y = k$). As a trader buys asset X out of the pool, the relative supply of asset X decreases while asset Y increases, algorithmically raising the price of asset X for the next transaction. Liquidity in AMMs is supplied by third-party Liquidity Providers (LPs) who deposit asset pairs in exchange for a share of transaction fees.
---
### 4. Practical Scenarios: High Liquidity vs. Low Liquidity Trades
To illustrate the practical effects of liquidity, consider two distinct execution scenarios involving a $50,000 market buy order.
#### Scenario A: High-Liquidity Asset on a Top CEX
A trader places a $50,000 market order to buy Bitcoin. The order book shows millions of dollars in limit sell orders stacked within 0.05% of the current price.
- The trade fills almost instantaneously across a tight band of sell offers.
- Average execution price: $65,000.15 against a mid-market price of $65,000.00.
- Result: Negligible slippage (0.00023%), preserving the trader's capital efficiency.
#### Scenario B: Low-Liquidity Altcoin on a DEX
A trader places a $50,000 market buy order for a newly launched token on a DEX with total pool liquidity of only $150,000.
- Because the order represents a massive percentage of the pool's assets, the mathematical formula drives the price sharply upward during execution.
- Average execution price ends up 18% higher than the quoted spot price before submission.
- Result: Severe slippage. The trader receives significantly fewer tokens than anticipated and immediately suffers an unrealized loss due to price impact.
---
### 5. The Role and Risks of Market Makers
Market liquidity does not appear organically; it is actively cultivated. Professional market-making firms play a vital role in crypto markets by constantly placing buy and sell orders on both sides of the book, capturing small profits from the bid-ask spread while absorbing inventory risk.
However, market makers are profit-driven entities, not public utilities. During periods of extreme uncertainty, bad news, or severe market stress, market makers may pull their limit orders to protect their capital.
When market makers step back, liquidity vanishes instantly. This phenomenon creates a **liquidity vacuum**, leading to sharp "flash crashes" where prices fall rapidly until reaching deep, passive buy orders far below market value.
---
### 6. Critical Risks, Limitations, and Liquidity Traps
Intermediate traders must navigate several key risks associated with liquidity dynamics:
1. **Phantom Liquidity**: Large limit orders displayed in an order book can be cancelled at a millisecond's notice by high-frequency trading algorithms. What appears to be a strong "support wall" on a depth chart may disappear right before price reaches it.
2. **Illiquidity Traps**: An altcoin may display rapid upward price movement on small trading volume. However, entering a large position in such an asset can be a trap—selling out of the position later without crushing the price may prove impossible.
3. **Impermanent Loss for Decentralized LPs**: Providing liquidity on AMMs exposes capital to impermanent loss, where sharp price divergence between paired assets leaves the provider with less value than simply holding the tokens outright.
4. **Rug Pulls and Unlocked Liquidity**: In decentralized finance, if project developers control the liquidity pool tokens without a time-lock, they can withdraw the pool's backing asset instantly, leaving token holders with un-tradable, worthless assets.
---
### 7. Assessing Liquidity Before Entering Trades: A Trader's Checklist
Before executing trades, intermediate participants can use specific metrics to evaluate market health:
- **Analyze Order Depth Metrics**: Do not look solely at total 24-hour volume. Check the 1% or 2% order book depth (the total dollar amount available within 1-2% of the current price). High depth ensures trade stability.
- **Compare Volume to Market Cap**: A healthy market typically displays balanced volume relative to its total valuation. Extremely low volume on a large-cap coin suggests stagnant interest, while abnormally high volume on a tiny market cap can indicate manipulation or elevated risk.
- **Utilize Limit Orders**: To eliminate market slippage entirely, use limit orders rather than market orders when interacting with thin books or volatile assets.
- **Inspect DEX Pool Composition**: When trading on-chain, inspect total value locked (TVL), verification of locked LP tokens, and token concentration among holders before submitting transactions.
---
### Conclusion
Liquidity is the structural foundation that dictates market stability, trade execution quality, and risk management capability in cryptocurrency trading. By moving beyond basic chart analysis and learning to evaluate order book depth, bid-ask spreads, and liquidity pool dynamics, traders can protect themselves from costly slippage, avoid trap assets, and make far more informed execution choices.
#CryptoEducation #MarketDepth #TradingStrategy
Demystifying Crypto Liquidity: How Order Books, Pools, and Market Depth Shape Price Action
Liquidity is often described as the lifeblood of financial markets, yet it remains one of the most misunderstood concepts among retail crypto market participants. While traders frequently focus on technical chart patterns, fundamental developments, or sentiment indicators, liquidity quietly dictates whether a trade executes seamlessly at a expected price or triggers a costly cascade of slippage.
For intermediate traders moving beyond basic spot buying, developing a structural understanding of crypto liquidity is essential. It explains why sudden market crashes occur, how large orders move markets, and why price action behaves differently across decentralized exchanges compared to centralized order books.
---
### 1. Defining Liquidity in Cryptocurrency Markets
At its core, liquidity measures the ease with which an asset can be bought or sold in the market without causing a significant change in its price.
An asset with high liquidity features numerous active buyers and sellers, heavy trading volume, and deep resting orders close to the current market price. Large market caps like Bitcoin and Ethereum typically exhibit high liquidity across major exchanges, allowing traders to execute multi-million dollar trades with minimal impact on the prevailing price.
Conversely, low-liquidity assets—such as micro-cap altcoins or newly launched tokens—have sparse buying and selling interest. In these markets, even modest trade sizes can push prices drastically up or down, creating extreme volatility and execution risks.
Liquidity is not static; it fluctuates continuously based on market hours, global macroeconomic conditions, exchange health, and overarching market sentiment.
---
### 2. Mechanics of Liquidity: Order Books, Spreads, and Depth
To understand where liquidity lives on a centralized exchange, one must look directly at the order book. An order book is a real-time, dynamic ledger displaying all pending limit buy orders (bids) and limit sell orders (asks).
Three core components define an order book's liquidity profile:
#### The Bid-Ask Spread
The bid-ask spread is the gap between the highest price a buyer is willing to pay (best bid) and the lowest price a seller is willing to accept (best ask). Highly liquid assets feature tight spreads, often mere cents or fractions of a percent apart. Illiquid assets display wide spreads, meaning a trader instantly incurs a loss the moment they buy at the market ask and attempt to sell back at the market bid.
#### Market Depth
Market depth represents the total volume of limit orders stacked at various price levels above and below the current market price. A "deep" order book contains large amounts of capital queued up at incremental price steps. A "shallow" order book has thin volume, meaning a large market order can easily slice through multiple price tiers.
#### Slippage and Price Impact
When a trader submits a market order, the exchange engine fills the order against the best available limit orders on the opposite side of the book. If the order size exceeds the volume available at the top bid or ask, the order sweeps through subsequent levels of the order book until it is fully filled.
The difference between the expected price when the order was submitted and the actual average execution price is known as **slippage**. High liquidity minimizes slippage; low liquidity amplifies it.
---
### 3. Centralized Order Books vs. Decentralized Liquidity Pools
Crypto features two distinct market architectures, each handling liquidity differently: Centralized Exchanges (CEXs) and Decentralized Exchanges (DEXs).
#### Centralized Order Books
CEXs rely on traditional limit order books (LOBs). Liquidity is largely provided by professional market-making firms and individual traders placing limit orders. Orders are processed off-chain matching engines at near-instantaneous speeds, allowing order books to update continuously as market conditions evolve.
#### Decentralized Automated Market Makers (AMMs)
DEXs replace traditional order books with Automated Market Makers and liquidity pools. Instead of matching buyers with sellers directly, trades occur against a smart contract containing a paired pool of assets (for example, Ethereum paired with a stablecoin).
Prices in a standard AMM are determined mathematically, commonly using constant product formulas ($x \times y = k$). As a trader buys asset X out of the pool, the relative supply of asset X decreases while asset Y increases, algorithmically raising the price of asset X for the next transaction. Liquidity in AMMs is supplied by third-party Liquidity Providers (LPs) who deposit asset pairs in exchange for a share of transaction fees.
---
### 4. Practical Scenarios: High Liquidity vs. Low Liquidity Trades
To illustrate the practical effects of liquidity, consider two distinct execution scenarios involving a $50,000 market buy order.
#### Scenario A: High-Liquidity Asset on a Top CEX
A trader places a $50,000 market order to buy Bitcoin. The order book shows millions of dollars in limit sell orders stacked within 0.05% of the current price.
- The trade fills almost instantaneously across a tight band of sell offers.
- Average execution price: $65,000.15 against a mid-market price of $65,000.00.
- Result: Negligible slippage (0.00023%), preserving the trader's capital efficiency.
#### Scenario B: Low-Liquidity Altcoin on a DEX
A trader places a $50,000 market buy order for a newly launched token on a DEX with total pool liquidity of only $150,000.
- Because the order represents a massive percentage of the pool's assets, the mathematical formula drives the price sharply upward during execution.
- Average execution price ends up 18% higher than the quoted spot price before submission.
- Result: Severe slippage. The trader receives significantly fewer tokens than anticipated and immediately suffers an unrealized loss due to price impact.
---
### 5. The Role and Risks of Market Makers
Market liquidity does not appear organically; it is actively cultivated. Professional market-making firms play a vital role in crypto markets by constantly placing buy and sell orders on both sides of the book, capturing small profits from the bid-ask spread while absorbing inventory risk.
However, market makers are profit-driven entities, not public utilities. During periods of extreme uncertainty, bad news, or severe market stress, market makers may pull their limit orders to protect their capital.
When market makers step back, liquidity vanishes instantly. This phenomenon creates a **liquidity vacuum**, leading to sharp "flash crashes" where prices fall rapidly until reaching deep, passive buy orders far below market value.
---
### 6. Critical Risks, Limitations, and Liquidity Traps
Intermediate traders must navigate several key risks associated with liquidity dynamics:
1. **Phantom Liquidity**: Large limit orders displayed in an order book can be cancelled at a millisecond's notice by high-frequency trading algorithms. What appears to be a strong "support wall" on a depth chart may disappear right before price reaches it.
2. **Illiquidity Traps**: An altcoin may display rapid upward price movement on small trading volume. However, entering a large position in such an asset can be a trap—selling out of the position later without crushing the price may prove impossible.
3. **Impermanent Loss for Decentralized LPs**: Providing liquidity on AMMs exposes capital to impermanent loss, where sharp price divergence between paired assets leaves the provider with less value than simply holding the tokens outright.
4. **Rug Pulls and Unlocked Liquidity**: In decentralized finance, if project developers control the liquidity pool tokens without a time-lock, they can withdraw the pool's backing asset instantly, leaving token holders with un-tradable, worthless assets.
---
### 7. Assessing Liquidity Before Entering Trades: A Trader's Checklist
Before executing trades, intermediate participants can use specific metrics to evaluate market health:
- **Analyze Order Depth Metrics**: Do not look solely at total 24-hour volume. Check the 1% or 2% order book depth (the total dollar amount available within 1-2% of the current price). High depth ensures trade stability.
- **Compare Volume to Market Cap**: A healthy market typically displays balanced volume relative to its total valuation. Extremely low volume on a large-cap coin suggests stagnant interest, while abnormally high volume on a tiny market cap can indicate manipulation or elevated risk.
- **Utilize Limit Orders**: To eliminate market slippage entirely, use limit orders rather than market orders when interacting with thin books or volatile assets.
- **Inspect DEX Pool Composition**: When trading on-chain, inspect total value locked (TVL), verification of locked LP tokens, and token concentration among holders before submitting transactions.
---
### Conclusion
Liquidity is the structural foundation that dictates market stability, trade execution quality, and risk management capability in cryptocurrency trading. By moving beyond basic chart analysis and learning to evaluate order book depth, bid-ask spreads, and liquidity pool dynamics, traders can protect themselves from costly slippage, avoid trap assets, and make far more informed execution choices.
#CryptoEducation #MarketDepth #TradingStrategy
For intermediate traders moving beyond basic spot buying, developing a structural understanding of crypto liquidity is essential. It explains why sudden market crashes occur, how large orders move markets, and why price action behaves differently across decentralized exchanges compared to centralized order books.
---
### 1. Defining Liquidity in Cryptocurrency Markets
At its core, liquidity measures the ease with which an asset can be bought or sold in the market without causing a significant change in its price.
An asset with high liquidity features numerous active buyers and sellers, heavy trading volume, and deep resting orders close to the current market price. Large market caps like Bitcoin and Ethereum typically exhibit high liquidity across major exchanges, allowing traders to execute multi-million dollar trades with minimal impact on the prevailing price.
Conversely, low-liquidity assets—such as micro-cap altcoins or newly launched tokens—have sparse buying and selling interest. In these markets, even modest trade sizes can push prices drastically up or down, creating extreme volatility and execution risks.
Liquidity is not static; it fluctuates continuously based on market hours, global macroeconomic conditions, exchange health, and overarching market sentiment.
---
### 2. Mechanics of Liquidity: Order Books, Spreads, and Depth
To understand where liquidity lives on a centralized exchange, one must look directly at the order book. An order book is a real-time, dynamic ledger displaying all pending limit buy orders (bids) and limit sell orders (asks).
Three core components define an order book's liquidity profile:
#### The Bid-Ask Spread
The bid-ask spread is the gap between the highest price a buyer is willing to pay (best bid) and the lowest price a seller is willing to accept (best ask). Highly liquid assets feature tight spreads, often mere cents or fractions of a percent apart. Illiquid assets display wide spreads, meaning a trader instantly incurs a loss the moment they buy at the market ask and attempt to sell back at the market bid.
#### Market Depth
Market depth represents the total volume of limit orders stacked at various price levels above and below the current market price. A "deep" order book contains large amounts of capital queued up at incremental price steps. A "shallow" order book has thin volume, meaning a large market order can easily slice through multiple price tiers.
#### Slippage and Price Impact
When a trader submits a market order, the exchange engine fills the order against the best available limit orders on the opposite side of the book. If the order size exceeds the volume available at the top bid or ask, the order sweeps through subsequent levels of the order book until it is fully filled.
The difference between the expected price when the order was submitted and the actual average execution price is known as **slippage**. High liquidity minimizes slippage; low liquidity amplifies it.
---
### 3. Centralized Order Books vs. Decentralized Liquidity Pools
Crypto features two distinct market architectures, each handling liquidity differently: Centralized Exchanges (CEXs) and Decentralized Exchanges (DEXs).
#### Centralized Order Books
CEXs rely on traditional limit order books (LOBs). Liquidity is largely provided by professional market-making firms and individual traders placing limit orders. Orders are processed off-chain matching engines at near-instantaneous speeds, allowing order books to update continuously as market conditions evolve.
#### Decentralized Automated Market Makers (AMMs)
DEXs replace traditional order books with Automated Market Makers and liquidity pools. Instead of matching buyers with sellers directly, trades occur against a smart contract containing a paired pool of assets (for example, Ethereum paired with a stablecoin).
Prices in a standard AMM are determined mathematically, commonly using constant product formulas ($x \times y = k$). As a trader buys asset X out of the pool, the relative supply of asset X decreases while asset Y increases, algorithmically raising the price of asset X for the next transaction. Liquidity in AMMs is supplied by third-party Liquidity Providers (LPs) who deposit asset pairs in exchange for a share of transaction fees.
---
### 4. Practical Scenarios: High Liquidity vs. Low Liquidity Trades
To illustrate the practical effects of liquidity, consider two distinct execution scenarios involving a $50,000 market buy order.
#### Scenario A: High-Liquidity Asset on a Top CEX
A trader places a $50,000 market order to buy Bitcoin. The order book shows millions of dollars in limit sell orders stacked within 0.05% of the current price.
- The trade fills almost instantaneously across a tight band of sell offers.
- Average execution price: $65,000.15 against a mid-market price of $65,000.00.
- Result: Negligible slippage (0.00023%), preserving the trader's capital efficiency.
#### Scenario B: Low-Liquidity Altcoin on a DEX
A trader places a $50,000 market buy order for a newly launched token on a DEX with total pool liquidity of only $150,000.
- Because the order represents a massive percentage of the pool's assets, the mathematical formula drives the price sharply upward during execution.
- Average execution price ends up 18% higher than the quoted spot price before submission.
- Result: Severe slippage. The trader receives significantly fewer tokens than anticipated and immediately suffers an unrealized loss due to price impact.
---
### 5. The Role and Risks of Market Makers
Market liquidity does not appear organically; it is actively cultivated. Professional market-making firms play a vital role in crypto markets by constantly placing buy and sell orders on both sides of the book, capturing small profits from the bid-ask spread while absorbing inventory risk.
However, market makers are profit-driven entities, not public utilities. During periods of extreme uncertainty, bad news, or severe market stress, market makers may pull their limit orders to protect their capital.
When market makers step back, liquidity vanishes instantly. This phenomenon creates a **liquidity vacuum**, leading to sharp "flash crashes" where prices fall rapidly until reaching deep, passive buy orders far below market value.
---
### 6. Critical Risks, Limitations, and Liquidity Traps
Intermediate traders must navigate several key risks associated with liquidity dynamics:
1. **Phantom Liquidity**: Large limit orders displayed in an order book can be cancelled at a millisecond's notice by high-frequency trading algorithms. What appears to be a strong "support wall" on a depth chart may disappear right before price reaches it.
2. **Illiquidity Traps**: An altcoin may display rapid upward price movement on small trading volume. However, entering a large position in such an asset can be a trap—selling out of the position later without crushing the price may prove impossible.
3. **Impermanent Loss for Decentralized LPs**: Providing liquidity on AMMs exposes capital to impermanent loss, where sharp price divergence between paired assets leaves the provider with less value than simply holding the tokens outright.
4. **Rug Pulls and Unlocked Liquidity**: In decentralized finance, if project developers control the liquidity pool tokens without a time-lock, they can withdraw the pool's backing asset instantly, leaving token holders with un-tradable, worthless assets.
---
### 7. Assessing Liquidity Before Entering Trades: A Trader's Checklist
Before executing trades, intermediate participants can use specific metrics to evaluate market health:
- **Analyze Order Depth Metrics**: Do not look solely at total 24-hour volume. Check the 1% or 2% order book depth (the total dollar amount available within 1-2% of the current price). High depth ensures trade stability.
- **Compare Volume to Market Cap**: A healthy market typically displays balanced volume relative to its total valuation. Extremely low volume on a large-cap coin suggests stagnant interest, while abnormally high volume on a tiny market cap can indicate manipulation or elevated risk.
- **Utilize Limit Orders**: To eliminate market slippage entirely, use limit orders rather than market orders when interacting with thin books or volatile assets.
- **Inspect DEX Pool Composition**: When trading on-chain, inspect total value locked (TVL), verification of locked LP tokens, and token concentration among holders before submitting transactions.
---
### Conclusion
Liquidity is the structural foundation that dictates market stability, trade execution quality, and risk management capability in cryptocurrency trading. By moving beyond basic chart analysis and learning to evaluate order book depth, bid-ask spreads, and liquidity pool dynamics, traders can protect themselves from costly slippage, avoid trap assets, and make far more informed execution choices.
#CryptoEducation #MarketDepth #TradingStrategy
1
110


Understanding the Order Book is paramount. $ETH and $VET both show "Heavy Buy Walls," which means significant demand is waiting at lower prices, acting as a cushion. This offers a higher probability of bounces from dips. In contrast, $U 's "Balanced DOM" requires a more nimble approach, as support might not be as concentrated.
#OrderBook #MarketDepth
Understanding the Order Book is paramount. $ETH and $VET both show "Heavy Buy Walls," which means significant demand is waiting at lower prices, acting as a cushion. This offers a higher probability of bounces from dips. In contrast, $U 's "Balanced DOM" requires a more nimble approach, as support might not be as concentrated.
#OrderBook #MarketDepth
#OrderBook #MarketDepth
288
Log in to explore more content
Join global crypto users on Binance Square
⚡️ Get latest and useful information about crypto.
💬 Trusted by the world’s largest crypto exchange.
👍 Discover real insights from verified creators.
Email / Phone number
Trending Topics
1
#EtherGains70.9%InQ3
148,820 views
1,134 Discussing
2
#TreasuryLetsStatesFileStablecoinCertificationsEarly
8,145 views
80 Discussing
3
#US10YearYieldNears5.3%
149,598 views
1,127 Discussing
4
#DollarIndexHitsHighestSinceMay2025
37,426 views
600 Discussing
5
#USWeeklyJoblessClaimsFallTo197000
34,042 views
500 Discussing
6
#BitcoinETFsTake$6.34BillionInQ3
9,612 views
77 Discussing
7
#KoreaProposesTokenizingStocksAndBonds
70,921 views
822 Discussing
8
#MetaMaskExitsLidoValidatorsAfterSecurityIncident
170,491 views
1,548 Discussing
9
#MicronBeatsEarningsLiftsGuidance
86,114 views
1,116 Discussing
10
#CFTCSubmitsTwoEventContractRulesToWhiteHouse
59,340 views
833 Discussing