
#macroanalysis
macroanalysis
262,631 views
1,903 Discussing
Hot
Latest

Article
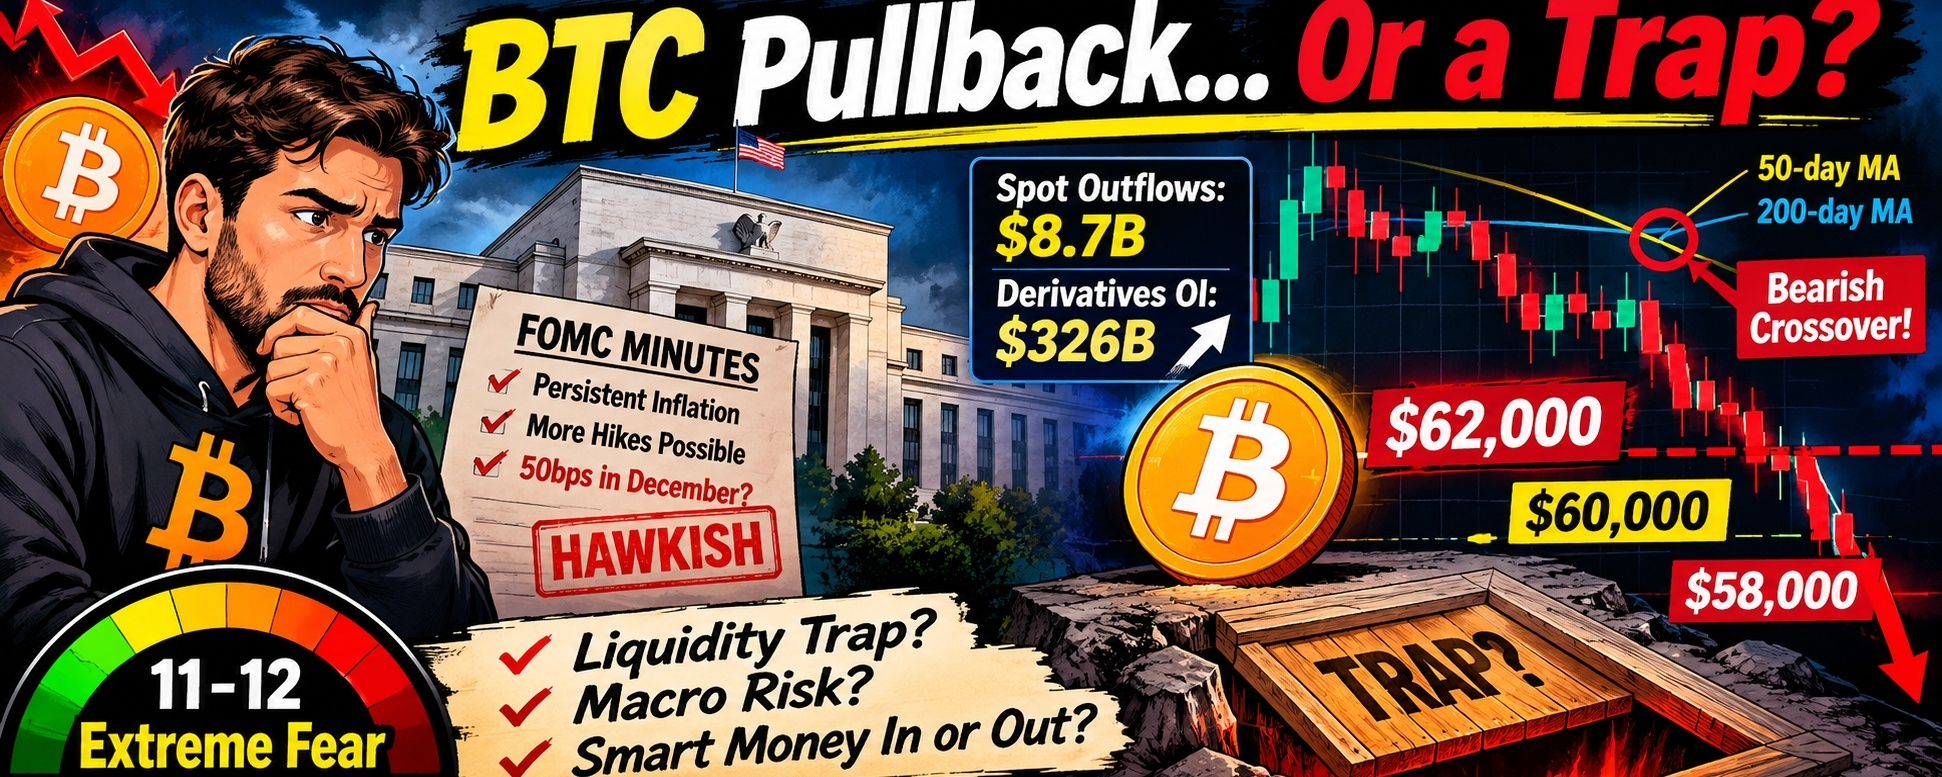
When half the market is already hedged or sitting in stablecoins waiting for $58,000, routine badI spent the last 48 hours digging into the latest Federal Reserve minutes and staring at order books, and I realized we might be reading this pullback completely wrong. 📉
Honestly, my first instinct was to short the bounce—until I pulled up the derivatives data and realized I might be walking straight into a crowded trap.
Everyone on my timeline is panicking because $BTC slipped under $63,000 right after the October FOMC minutes dropped.
The headlines are screaming about persistent inflation, renewed rate hike fears, and the possibility of an aggressive 50-basis-point move in December.
At first glance, it looks like a textbook macro breakdown.
When the Fed keeps its foot on the brake, liquidity dries up, the US dollar flexes, and risk assets usually take the brunt of the damage.
But the more I cross-referenced the actual market reaction against on-chain flows and derivatives positioning, the less this looked like a normal sell-off. 🤔
The "Hawkish" Shock Was Already Baked In
If you read through the Fed’s October meeting notes, the tone is unmistakably tight.
Almost every policymaker agreed that further hikes are still on the table if inflation data keeps running hot.
Normally, that kind of language triggers an instant, violent liquidation cascade across crypto.
Yet $BTC only bled out around 2% to 3% into the $62,000–$62,500 range, while major altcoins like $BNB, ETH, andSOL mostly just drifted lower alongside it.
Not sure if people realize how strange that is, but traders had already priced in over 90% odds of a December hike before the minutes were even published.
The market didn't get hit by a surprise ambush—it just got confirmation of a storm it had been watching on the radar all week.
The Liquidity Paradox: Spot Outflows vs. Rising Leverage
Here is the market loop that actually has my attention right now.
Over the past month, we have seen roughly $8.7 billion in net spot outflows from Bitcoin as ETF allocators and institutional desks de-risk ahead of the December FOMC meeting.
Yet, while spot demand is cooling off, total derivatives open interest has climbed past $326 billion.
Think about the mechanics of what happens when those two forces collide:
Spot holders step back to wait out the macro noise → order book depth thins out → perpetual futures traders pile in to bet on volatility → algorithms hunt stops between $62,000 and $64,000.
Here’s the hard economic constraint nobody wants to admit: derivatives leverage can amplify a short squeeze, but it cannot sustain an uptrend unless spot inflows return to absorb macro selling.
Right now, futures traders are trying to hold up a roof while spot liquidity is quietly walking out the back door.
Extreme Fear vs. On-Chain Reality
I always pay close attention when retail sentiment completely detaches from network activity.
The Crypto Fear & Greed Index is sitting around 11 to 12—deep inside "Extreme Fear" territory, the most washed-out reading we have seen in months.
From my experience tracking these cycles, extreme fear during a slow grind usually means weak hands have already folded.
When half the market is already hedged or sitting in stablecoins waiting for $58,000, routine bad news runs out of panic sellers to push price lower.
Even across active ecosystems like BNB Chain, on-chain activity hasn't collapsed—capital is simply rotating defensively into stablecoins and yield rather than fleeing Web3 altogether.
But here's what makes me nervous... 💡
As tempting as it is to fade consensus panic, ignoring real macro fault lines is how traders get wiped out.
Two things in those FOMC minutes keep me from calling a clean bottom here.
First, the Fed isn't just watching consumer inflation anymore—policymakers explicitly flagged rapidly growing AI-related debt and opaque credit structures as a financial stability risk.
Over the past year, $BTC and AI-heavy tech equities have traded on the exact same liquidity tide.
If traditional tech stocks start unwinding because borrowing costs stay higher for longer, crypto will get dragged into that broader liquidity squeeze whether on-chain metrics look healthy or not.
Second, the daily chart just printed a bearish crossover between the 50-day and 200-day moving averages.
You don't have to believe in chart patterns to respect the fact that thousands of systematic bots execute off them.
If the next inflation print forces the Fed's hand in December, that $60,000 psychological floor is going to face a brutal stress test—and a clean break could wick straight into the $58,000 liquidity pocket before real spot buyers step in.
The Contradiction We're Stuck With
And that’s the paradox I can’t shake right now: on-chain positioning and extreme fear scream seller exhaustion, yet the Fed’s warning on AI-driven credit stress means the real macro liquidity shock might not have even started.
If $BTC keeps holding $62,000 while spot ETFs continue to bleed, is that genuine smart-money absorption—or just leverage building a bigger trapdoor right above $60K? 👇
#BTCRemainsUnderPressureAfterHawkishFOMCMinutes #CryptoMarket #MacroAnalysis #Write2Earn
Not financial advice. Always DYOR.
When half the market is already hedged or sitting in stablecoins waiting for $58,000, routine bad
I spent the last 48 hours digging into the latest Federal Reserve minutes and staring at order books, and I realized we might be reading this pullback completely wrong. 📉
Honestly, my first instinct was to short the bounce—until I pulled up the derivatives data and realized I might be walking straight into a crowded trap.
Everyone on my timeline is panicking because $BTC slipped under $63,000 right after the October FOMC minutes dropped.
The headlines are screaming about persistent inflation, renewed rate hike fears, and the possibility of an aggressive 50-basis-point move in December.
At first glance, it looks like a textbook macro breakdown.
When the Fed keeps its foot on the brake, liquidity dries up, the US dollar flexes, and risk assets usually take the brunt of the damage.
But the more I cross-referenced the actual market reaction against on-chain flows and derivatives positioning, the less this looked like a normal sell-off. 🤔
The "Hawkish" Shock Was Already Baked In
If you read through the Fed’s October meeting notes, the tone is unmistakably tight.
Almost every policymaker agreed that further hikes are still on the table if inflation data keeps running hot.
Normally, that kind of language triggers an instant, violent liquidation cascade across crypto.
Yet $BTC only bled out around 2% to 3% into the $62,000–$62,500 range, while major altcoins like $BNB, ETH, andSOL mostly just drifted lower alongside it.
Not sure if people realize how strange that is, but traders had already priced in over 90% odds of a December hike before the minutes were even published.
The market didn't get hit by a surprise ambush—it just got confirmation of a storm it had been watching on the radar all week.
The Liquidity Paradox: Spot Outflows vs. Rising Leverage
Here is the market loop that actually has my attention right now.
Over the past month, we have seen roughly $8.7 billion in net spot outflows from Bitcoin as ETF allocators and institutional desks de-risk ahead of the December FOMC meeting.
Yet, while spot demand is cooling off, total derivatives open interest has climbed past $326 billion.
Think about the mechanics of what happens when those two forces collide:
Spot holders step back to wait out the macro noise → order book depth thins out → perpetual futures traders pile in to bet on volatility → algorithms hunt stops between $62,000 and $64,000.
Here’s the hard economic constraint nobody wants to admit: derivatives leverage can amplify a short squeeze, but it cannot sustain an uptrend unless spot inflows return to absorb macro selling.
Right now, futures traders are trying to hold up a roof while spot liquidity is quietly walking out the back door.
Extreme Fear vs. On-Chain Reality
I always pay close attention when retail sentiment completely detaches from network activity.
The Crypto Fear & Greed Index is sitting around 11 to 12—deep inside "Extreme Fear" territory, the most washed-out reading we have seen in months.
From my experience tracking these cycles, extreme fear during a slow grind usually means weak hands have already folded.
When half the market is already hedged or sitting in stablecoins waiting for $58,000, routine bad news runs out of panic sellers to push price lower.
Even across active ecosystems like BNB Chain, on-chain activity hasn't collapsed—capital is simply rotating defensively into stablecoins and yield rather than fleeing Web3 altogether.
But here's what makes me nervous... 💡
As tempting as it is to fade consensus panic, ignoring real macro fault lines is how traders get wiped out.
Two things in those FOMC minutes keep me from calling a clean bottom here.
First, the Fed isn't just watching consumer inflation anymore—policymakers explicitly flagged rapidly growing AI-related debt and opaque credit structures as a financial stability risk.
Over the past year, $BTC and AI-heavy tech equities have traded on the exact same liquidity tide.
If traditional tech stocks start unwinding because borrowing costs stay higher for longer, crypto will get dragged into that broader liquidity squeeze whether on-chain metrics look healthy or not.
Second, the daily chart just printed a bearish crossover between the 50-day and 200-day moving averages.
You don't have to believe in chart patterns to respect the fact that thousands of systematic bots execute off them.
If the next inflation print forces the Fed's hand in December, that $60,000 psychological floor is going to face a brutal stress test—and a clean break could wick straight into the $58,000 liquidity pocket before real spot buyers step in.
The Contradiction We're Stuck With
And that’s the paradox I can’t shake right now: on-chain positioning and extreme fear scream seller exhaustion, yet the Fed’s warning on AI-driven credit stress means the real macro liquidity shock might not have even started.
If $BTC keeps holding $62,000 while spot ETFs continue to bleed, is that genuine smart-money absorption—or just leverage building a bigger trapdoor right above $60K? 👇
#BTCRemainsUnderPressureAfterHawkishFOMCMinutes #CryptoMarket #MacroAnalysis #Write2Earn
Not financial advice. Always DYOR.
Honestly, my first instinct was to short the bounce—until I pulled up the derivatives data and realized I might be walking straight into a crowded trap.
Everyone on my timeline is panicking because $BTC slipped under $63,000 right after the October FOMC minutes dropped.
The headlines are screaming about persistent inflation, renewed rate hike fears, and the possibility of an aggressive 50-basis-point move in December.
At first glance, it looks like a textbook macro breakdown.
When the Fed keeps its foot on the brake, liquidity dries up, the US dollar flexes, and risk assets usually take the brunt of the damage.
But the more I cross-referenced the actual market reaction against on-chain flows and derivatives positioning, the less this looked like a normal sell-off. 🤔
The "Hawkish" Shock Was Already Baked In
If you read through the Fed’s October meeting notes, the tone is unmistakably tight.
Almost every policymaker agreed that further hikes are still on the table if inflation data keeps running hot.
Normally, that kind of language triggers an instant, violent liquidation cascade across crypto.
Yet $BTC only bled out around 2% to 3% into the $62,000–$62,500 range, while major altcoins like $BNB, ETH, andSOL mostly just drifted lower alongside it.
Not sure if people realize how strange that is, but traders had already priced in over 90% odds of a December hike before the minutes were even published.
The market didn't get hit by a surprise ambush—it just got confirmation of a storm it had been watching on the radar all week.
The Liquidity Paradox: Spot Outflows vs. Rising Leverage
Here is the market loop that actually has my attention right now.
Over the past month, we have seen roughly $8.7 billion in net spot outflows from Bitcoin as ETF allocators and institutional desks de-risk ahead of the December FOMC meeting.
Yet, while spot demand is cooling off, total derivatives open interest has climbed past $326 billion.
Think about the mechanics of what happens when those two forces collide:
Spot holders step back to wait out the macro noise → order book depth thins out → perpetual futures traders pile in to bet on volatility → algorithms hunt stops between $62,000 and $64,000.
Here’s the hard economic constraint nobody wants to admit: derivatives leverage can amplify a short squeeze, but it cannot sustain an uptrend unless spot inflows return to absorb macro selling.
Right now, futures traders are trying to hold up a roof while spot liquidity is quietly walking out the back door.
Extreme Fear vs. On-Chain Reality
I always pay close attention when retail sentiment completely detaches from network activity.
The Crypto Fear & Greed Index is sitting around 11 to 12—deep inside "Extreme Fear" territory, the most washed-out reading we have seen in months.
From my experience tracking these cycles, extreme fear during a slow grind usually means weak hands have already folded.
When half the market is already hedged or sitting in stablecoins waiting for $58,000, routine bad news runs out of panic sellers to push price lower.
Even across active ecosystems like BNB Chain, on-chain activity hasn't collapsed—capital is simply rotating defensively into stablecoins and yield rather than fleeing Web3 altogether.
But here's what makes me nervous... 💡
As tempting as it is to fade consensus panic, ignoring real macro fault lines is how traders get wiped out.
Two things in those FOMC minutes keep me from calling a clean bottom here.
First, the Fed isn't just watching consumer inflation anymore—policymakers explicitly flagged rapidly growing AI-related debt and opaque credit structures as a financial stability risk.
Over the past year, $BTC and AI-heavy tech equities have traded on the exact same liquidity tide.
If traditional tech stocks start unwinding because borrowing costs stay higher for longer, crypto will get dragged into that broader liquidity squeeze whether on-chain metrics look healthy or not.
Second, the daily chart just printed a bearish crossover between the 50-day and 200-day moving averages.
You don't have to believe in chart patterns to respect the fact that thousands of systematic bots execute off them.
If the next inflation print forces the Fed's hand in December, that $60,000 psychological floor is going to face a brutal stress test—and a clean break could wick straight into the $58,000 liquidity pocket before real spot buyers step in.
The Contradiction We're Stuck With
And that’s the paradox I can’t shake right now: on-chain positioning and extreme fear scream seller exhaustion, yet the Fed’s warning on AI-driven credit stress means the real macro liquidity shock might not have even started.
If $BTC keeps holding $62,000 while spot ETFs continue to bleed, is that genuine smart-money absorption—or just leverage building a bigger trapdoor right above $60K? 👇
#BTCRemainsUnderPressureAfterHawkishFOMCMinutes #CryptoMarket #MacroAnalysis #Write2Earn
Not financial advice. Always DYOR.
2
352

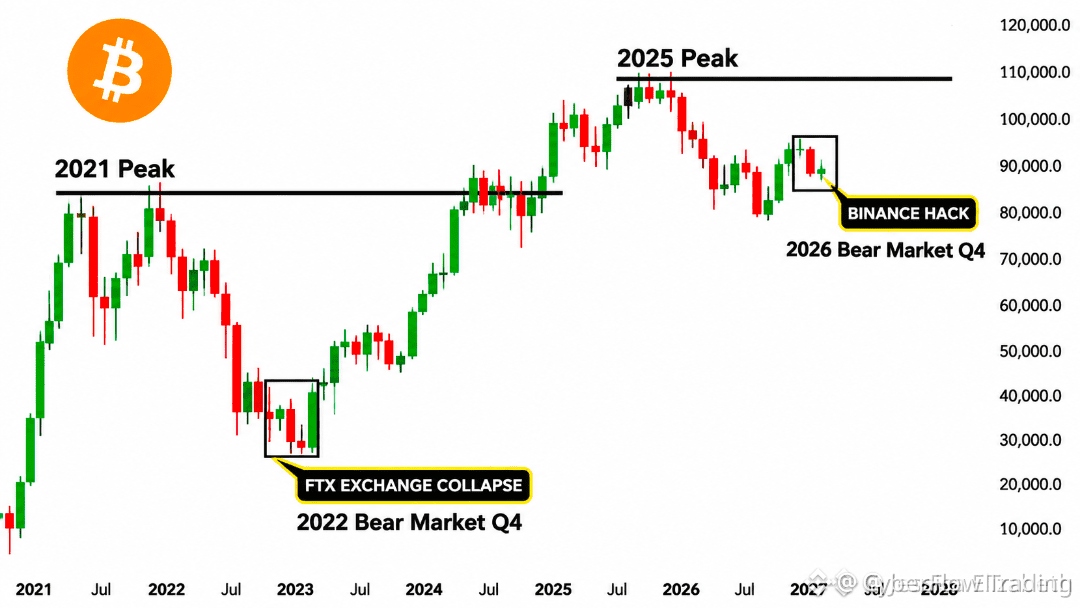
🦈 $BTC MACRO CYCLE LESSON: EVERY BEAR MARKET BOTTOM DEMANDS MAXIMUM LIQUIDITY CAPITULATION ⚡
History shows that macro cyclical bottoms in $BTC are never gentle; they are carved out during extreme systemic panic when market confidence completely shatters. 📊 The 2022 bear market required the sudden collapse of a major exchange to flush out excessive leverage and establish a rock-solid generational floor.
Smart money thrives in these catastrophic liquidity sweeps, systematically absorbing panic-sold supply while the crowd runs for the exits. 🌊 Looking ahead toward future cycle lows, true accumulation windows always emerge from peak black swan events rather than predictable support bounces.
🤔 Are you preparing your dry powder for maximum systemic fear, or waiting for calm waters to step back in? 👇
⚠️ Not financial advice. Always manage your risk. 🛡️
🏷️ #BTC #MarketCycles #MacroAnalysis #Bitcoin
🦈 ⚡
🦈 $BTC MACRO CYCLE LESSON: EVERY BEAR MARKET BOTTOM DEMANDS MAXIMUM LIQUIDITY CAPITULATION ⚡
History shows that macro cyclical bottoms in $BTC are never gentle; they are carved out during extreme systemic panic when market confidence completely shatters. 📊 The 2022 bear market required the sudden collapse of a major exchange to flush out excessive leverage and establish a rock-solid generational floor.
Smart money thrives in these catastrophic liquidity sweeps, systematically absorbing panic-sold supply while the crowd runs for the exits. 🌊 Looking ahead toward future cycle lows, true accumulation windows always emerge from peak black swan events rather than predictable support bounces.
🤔 Are you preparing your dry powder for maximum systemic fear, or waiting for calm waters to step back in? 👇
⚠️ Not financial advice. Always manage your risk. 🛡️
🏷️ #BTC #MarketCycles #MacroAnalysis #Bitcoin
🦈 ⚡
History shows that macro cyclical bottoms in $BTC are never gentle; they are carved out during extreme systemic panic when market confidence completely shatters. 📊 The 2022 bear market required the sudden collapse of a major exchange to flush out excessive leverage and establish a rock-solid generational floor.
Smart money thrives in these catastrophic liquidity sweeps, systematically absorbing panic-sold supply while the crowd runs for the exits. 🌊 Looking ahead toward future cycle lows, true accumulation windows always emerge from peak black swan events rather than predictable support bounces.
🤔 Are you preparing your dry powder for maximum systemic fear, or waiting for calm waters to step back in? 👇
⚠️ Not financial advice. Always manage your risk. 🛡️
🏷️ #BTC #MarketCycles #MacroAnalysis #Bitcoin
🦈 ⚡
12

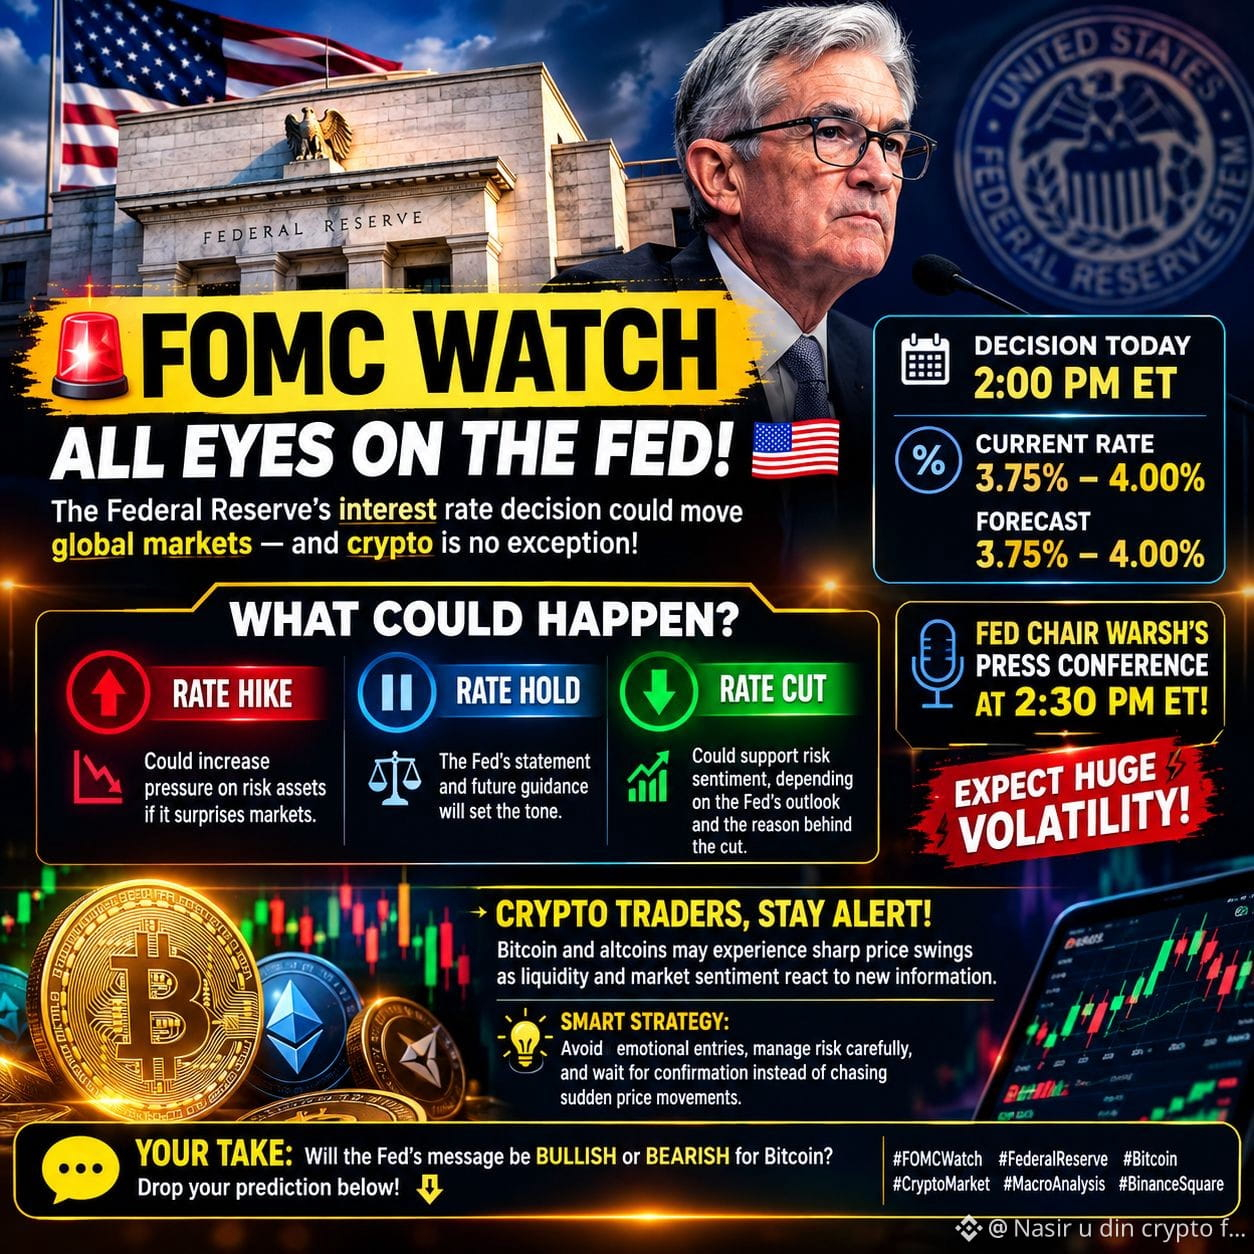
#FOMCWatch 🚨 FOMC WATCH: ALL EYES ON THE FED! 🇺🇸📊
The Federal Reserve’s interest rate decision could become a major catalyst for financial markets. Crypto traders, stock investors, and macro watchers are preparing for a potentially volatile session. ⚡
📌 WHAT SHOULD MARKETS WATCH?
🔹 Rate Hike 📉 — Could increase pressure on risk assets if the decision surprises markets.
🔹 Rate Hold ⚖️ — The Fed’s statement and future policy guidance may determine the market reaction.
🔹 Rate Cut 🚀 — Could support risk sentiment, depending on the Fed’s outlook and the reason behind the cut.
🎤 THE REAL MARKET MOVER?
The Fed Chair’s press conference! Investors will be listening closely for clues about inflation, economic growth, and the direction of future interest rates.
₿ CRYPTO TRADERS, STAY ALERT!
Bitcoin and altcoins may experience sharp price swings as liquidity and market sentiment react to new information. Remember: a decision that matches expectations can still trigger volatility if the Fed’s message surprises investors.
💡 Smart Strategy: Avoid emotional entries, manage risk carefully, and wait for confirmation instead of chasing sudden price movements.
👇 YOUR TAKE:
Will the Fed’s message be BULLISH ' #CryptoMarket #MacroAnalysis #BinanceSquare
#FOMCWatch 🚨 FOMC WATCH: ALL EYES ON THE FED! 🇺🇸📊
The Federal Reserve’s interest rate decision could become a major catalyst for financial markets. Crypto traders, stock investors, and macro watchers are preparing for a potentially volatile session. ⚡
📌 WHAT SHOULD MARKETS WATCH?
🔹 Rate Hike 📉 — Could increase pressure on risk assets if the decision surprises markets.
🔹 Rate Hold ⚖️ — The Fed’s statement and future policy guidance may determine the market reaction.
🔹 Rate Cut 🚀 — Could support risk sentiment, depending on the Fed’s outlook and the reason behind the cut.
🎤 THE REAL MARKET MOVER?
The Fed Chair’s press conference! Investors will be listening closely for clues about inflation, economic growth, and the direction of future interest rates.
₿ CRYPTO TRADERS, STAY ALERT!
Bitcoin and altcoins may experience sharp price swings as liquidity and market sentiment react to new information. Remember: a decision that matches expectations can still trigger volatility if the Fed’s message surprises investors.
💡 Smart Strategy: Avoid emotional entries, manage risk carefully, and wait for confirmation instead of chasing sudden price movements.
👇 YOUR TAKE:
Will the Fed’s message be BULLISH ' #CryptoMarket #MacroAnalysis #BinanceSquare
The Federal Reserve’s interest rate decision could become a major catalyst for financial markets. Crypto traders, stock investors, and macro watchers are preparing for a potentially volatile session. ⚡
📌 WHAT SHOULD MARKETS WATCH?
🔹 Rate Hike 📉 — Could increase pressure on risk assets if the decision surprises markets.
🔹 Rate Hold ⚖️ — The Fed’s statement and future policy guidance may determine the market reaction.
🔹 Rate Cut 🚀 — Could support risk sentiment, depending on the Fed’s outlook and the reason behind the cut.
🎤 THE REAL MARKET MOVER?
The Fed Chair’s press conference! Investors will be listening closely for clues about inflation, economic growth, and the direction of future interest rates.
₿ CRYPTO TRADERS, STAY ALERT!
Bitcoin and altcoins may experience sharp price swings as liquidity and market sentiment react to new information. Remember: a decision that matches expectations can still trigger volatility if the Fed’s message surprises investors.
💡 Smart Strategy: Avoid emotional entries, manage risk carefully, and wait for confirmation instead of chasing sudden price movements.
👇 YOUR TAKE:
Will the Fed’s message be BULLISH ' #CryptoMarket #MacroAnalysis #BinanceSquare
90

Article
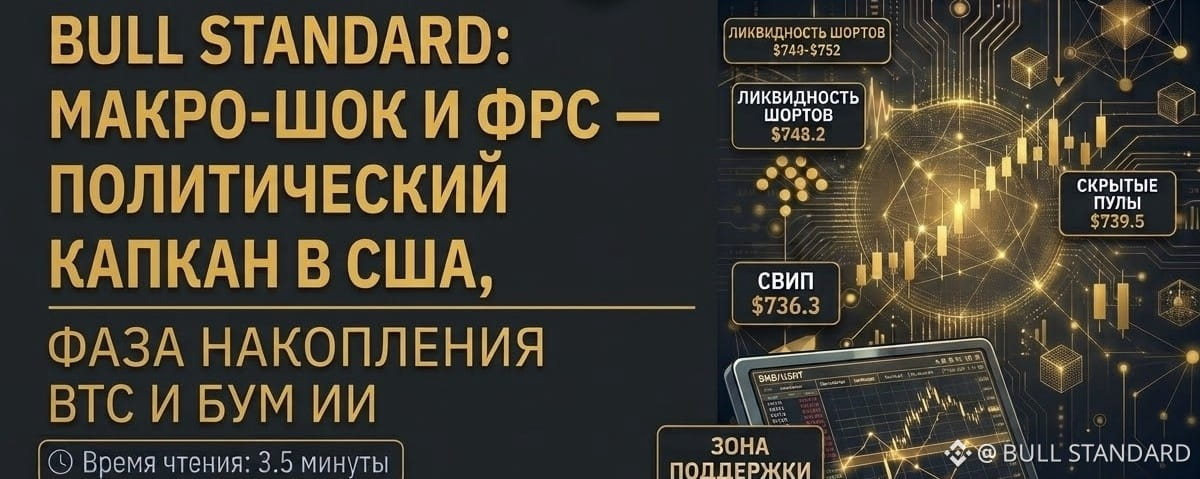
BULL STANDARD: МАКРО-ШОК И ФРС — ПОЛИТИЧЕСКИЙ КАПКАН В США, ФАЗА НАКОПЛЕНИЯ BTC И БУМ ИИ
⏱ Время чтения: 3.5 минуты
Приветствую, друзья!
Пока весь рынок затаил дыхание перед вердиктом ФРС по процентной ставке, на макро-доске разворачивается жесткая институциональная игра. Мы досконально перебрали свежую аналитику от Binance Research и Galaxy, выжали оттуда всю «воду» и сопоставили ключевые факты с реальной картиной в нашем стакане.
Разбираем без академической скуки: куда на самом деле смотрят крупные деньги и как не оказаться выбитым из рынка на эмоциях.
1. Заседание ФРС: Затишье перед ястребиным штормом
Рынки на 90% уверены, что ФРС оставит ставку без изменений (в диапазоне 3.75%–4.00%). Но главный взрыв волатильности упрятан не в цифрах, а в пресс-конференции.
Политический капкан: Заседание проходит всего за 6 дней до промежуточных выборов в США. Любому спикеру регулятора придется филигранно выбирать слова, чтобы избегать упреков в политическом подтексте.
Инфляционные тиски: Годовые инфляционные ожидания потребителей выросли до 4.7%. ФРС обязана держать рынки в тонусе, сохраняя задел на возможное жесткое повышение в декабре.
Логика реагирования: Всё решение уже сидит в ценах. Рынок будет импульсивно отыгрывать тональность риторики и намеки на будущую ликвидностную утяжку.
{future}(BNBUSDT)
2. Фундамент Биткоина: Уход спекулянтов и «тихое» накопление
Аналитики Galaxy дают мощную раскладку по структуре Биткоина, которая объясняет текущую вязкость рынка:
Дно позади: Фундаментальный медвежий рынок BTC остался в июне на уровнях около $58,000. То, что мы видим сейчас (5 недель подряд закрытия выше 50-недельной MA) — это классическая база под будущий бычий ралли-импульс.
Чистка от «быстрых денег»: Чистая лонг-позиция управляющих на CME просела на 57%. Спекулянтов выбило, а фундамент остался.
Институциональный бетон: Спотовые ETF поглотили более 87,000 BTC с лета — это чистые инвестиционные покупки в долгую. Растущий госдолг и дефицит бюджета США лишь подливают масла в огонь дефицита BTC.
Красная линия: Только недельный закрепитель ниже $76,540 сломает этот бычий тезис. До этого момента — рынок просто забирает энергию у слабых рук.
3. Экспертиза Binance: Пре-IPO Anthropic и суперцикл ИИ
Пока классический рынок дрейфует в ожиданиях, крипто-инфраструктура захватывает институциональный капитал:
Лидерство Binance: Площадка забрала 47.6% открытого интереса ($50.4M) и 31% мирового объема по бессрочным контрактам на Anthropic до их официального IPO.
Сигнал рынка: Совокупный OI в $106M по 10 главным биржам доказывает: крупный капитал голосует объемами за экспозицию на ИИ-гигантов именно через нативные крипто-инструменты.
Аппаратный фундамент: Финансовые показатели SK Hynix и выкуп акций на 40T вон подтверждают — суперцикл памяти под ИИ-индустрию продолжает оставаться мощнейшим драйвером всего глобального рынка.
Итог BULL STANDARD
Макро-пружина сжата до предела. В Биткоине идет фундаментальная акулья аккумуляция, пока розницу запугивают заголовками новостей.
Наша позиция 100% кэша перед ФРС — это не трусость, а холодный расчёт. Пускай эмоциональная толпа собирает вертолеты на выходе новостей, а мы зайдем в стакан только тогда, когда дым рассеется и институционалы покажут реальное направление.
⚡ ДЕРЖИМ СВЯЗЬ В КОММЕНТАХ:
Как у вас по ощущениям перед ФРС? Уже задраили люки и сидите в стейблах или держите позиции с открытым забралом? Пишите ниже, как перекрываете эти макро-качели!
#BinanceSquare #Anthropic #MacroAnalysis #BULLSTANDARD #CryptoNews
BULL STANDARD: МАКРО-ШОК И ФРС — ПОЛИТИЧЕСКИЙ КАПКАН В США, ФАЗА НАКОПЛЕНИЯ BTC И БУМ ИИ
⏱ Время чтения: 3.5 минуты
Приветствую, друзья!
Пока весь рынок затаил дыхание перед вердиктом ФРС по процентной ставке, на макро-доске разворачивается жесткая институциональная игра. Мы досконально перебрали свежую аналитику от Binance Research и Galaxy, выжали оттуда всю «воду» и сопоставили ключевые факты с реальной картиной в нашем стакане.
Разбираем без академической скуки: куда на самом деле смотрят крупные деньги и как не оказаться выбитым из рынка на эмоциях.
1. Заседание ФРС: Затишье перед ястребиным штормом
Рынки на 90% уверены, что ФРС оставит ставку без изменений (в диапазоне 3.75%–4.00%). Но главный взрыв волатильности упрятан не в цифрах, а в пресс-конференции.
Политический капкан: Заседание проходит всего за 6 дней до промежуточных выборов в США. Любому спикеру регулятора придется филигранно выбирать слова, чтобы избегать упреков в политическом подтексте.
Инфляционные тиски: Годовые инфляционные ожидания потребителей выросли до 4.7%. ФРС обязана держать рынки в тонусе, сохраняя задел на возможное жесткое повышение в декабре.
Логика реагирования: Всё решение уже сидит в ценах. Рынок будет импульсивно отыгрывать тональность риторики и намеки на будущую ликвидностную утяжку.
2. Фундамент Биткоина: Уход спекулянтов и «тихое» накопление
Аналитики Galaxy дают мощную раскладку по структуре Биткоина, которая объясняет текущую вязкость рынка:
Дно позади: Фундаментальный медвежий рынок BTC остался в июне на уровнях около $58,000. То, что мы видим сейчас (5 недель подряд закрытия выше 50-недельной MA) — это классическая база под будущий бычий ралли-импульс.
Чистка от «быстрых денег»: Чистая лонг-позиция управляющих на CME просела на 57%. Спекулянтов выбило, а фундамент остался.
Институциональный бетон: Спотовые ETF поглотили более 87,000 BTC с лета — это чистые инвестиционные покупки в долгую. Растущий госдолг и дефицит бюджета США лишь подливают масла в огонь дефицита BTC.
Красная линия: Только недельный закрепитель ниже $76,540 сломает этот бычий тезис. До этого момента — рынок просто забирает энергию у слабых рук.
3. Экспертиза Binance: Пре-IPO Anthropic и суперцикл ИИ
Пока классический рынок дрейфует в ожиданиях, крипто-инфраструктура захватывает институциональный капитал:
Лидерство Binance: Площадка забрала 47.6% открытого интереса ($50.4M) и 31% мирового объема по бессрочным контрактам на Anthropic до их официального IPO.
Сигнал рынка: Совокупный OI в $106M по 10 главным биржам доказывает: крупный капитал голосует объемами за экспозицию на ИИ-гигантов именно через нативные крипто-инструменты.
Аппаратный фундамент: Финансовые показатели SK Hynix и выкуп акций на 40T вон подтверждают — суперцикл памяти под ИИ-индустрию продолжает оставаться мощнейшим драйвером всего глобального рынка.
Итог BULL STANDARD
Макро-пружина сжата до предела. В Биткоине идет фундаментальная акулья аккумуляция, пока розницу запугивают заголовками новостей.
Наша позиция 100% кэша перед ФРС — это не трусость, а холодный расчёт. Пускай эмоциональная толпа собирает вертолеты на выходе новостей, а мы зайдем в стакан только тогда, когда дым рассеется и институционалы покажут реальное направление.
⚡ ДЕРЖИМ СВЯЗЬ В КОММЕНТАХ:
Как у вас по ощущениям перед ФРС? Уже задраили люки и сидите в стейблах или держите позиции с открытым забралом? Пишите ниже, как перекрываете эти макро-качели!
#BinanceSquare #Anthropic #MacroAnalysis #BULLSTANDARD #CryptoNews
Приветствую, друзья!
Пока весь рынок затаил дыхание перед вердиктом ФРС по процентной ставке, на макро-доске разворачивается жесткая институциональная игра. Мы досконально перебрали свежую аналитику от Binance Research и Galaxy, выжали оттуда всю «воду» и сопоставили ключевые факты с реальной картиной в нашем стакане.
Разбираем без академической скуки: куда на самом деле смотрят крупные деньги и как не оказаться выбитым из рынка на эмоциях.
1. Заседание ФРС: Затишье перед ястребиным штормом
Рынки на 90% уверены, что ФРС оставит ставку без изменений (в диапазоне 3.75%–4.00%). Но главный взрыв волатильности упрятан не в цифрах, а в пресс-конференции.
Политический капкан: Заседание проходит всего за 6 дней до промежуточных выборов в США. Любому спикеру регулятора придется филигранно выбирать слова, чтобы избегать упреков в политическом подтексте.
Инфляционные тиски: Годовые инфляционные ожидания потребителей выросли до 4.7%. ФРС обязана держать рынки в тонусе, сохраняя задел на возможное жесткое повышение в декабре.
Логика реагирования: Всё решение уже сидит в ценах. Рынок будет импульсивно отыгрывать тональность риторики и намеки на будущую ликвидностную утяжку.
2. Фундамент Биткоина: Уход спекулянтов и «тихое» накопление
Аналитики Galaxy дают мощную раскладку по структуре Биткоина, которая объясняет текущую вязкость рынка:
Дно позади: Фундаментальный медвежий рынок BTC остался в июне на уровнях около $58,000. То, что мы видим сейчас (5 недель подряд закрытия выше 50-недельной MA) — это классическая база под будущий бычий ралли-импульс.
Чистка от «быстрых денег»: Чистая лонг-позиция управляющих на CME просела на 57%. Спекулянтов выбило, а фундамент остался.
Институциональный бетон: Спотовые ETF поглотили более 87,000 BTC с лета — это чистые инвестиционные покупки в долгую. Растущий госдолг и дефицит бюджета США лишь подливают масла в огонь дефицита BTC.
Красная линия: Только недельный закрепитель ниже $76,540 сломает этот бычий тезис. До этого момента — рынок просто забирает энергию у слабых рук.
3. Экспертиза Binance: Пре-IPO Anthropic и суперцикл ИИ
Пока классический рынок дрейфует в ожиданиях, крипто-инфраструктура захватывает институциональный капитал:
Лидерство Binance: Площадка забрала 47.6% открытого интереса ($50.4M) и 31% мирового объема по бессрочным контрактам на Anthropic до их официального IPO.
Сигнал рынка: Совокупный OI в $106M по 10 главным биржам доказывает: крупный капитал голосует объемами за экспозицию на ИИ-гигантов именно через нативные крипто-инструменты.
Аппаратный фундамент: Финансовые показатели SK Hynix и выкуп акций на 40T вон подтверждают — суперцикл памяти под ИИ-индустрию продолжает оставаться мощнейшим драйвером всего глобального рынка.
Итог BULL STANDARD
Макро-пружина сжата до предела. В Биткоине идет фундаментальная акулья аккумуляция, пока розницу запугивают заголовками новостей.
Наша позиция 100% кэша перед ФРС — это не трусость, а холодный расчёт. Пускай эмоциональная толпа собирает вертолеты на выходе новостей, а мы зайдем в стакан только тогда, когда дым рассеется и институционалы покажут реальное направление.
⚡ ДЕРЖИМ СВЯЗЬ В КОММЕНТАХ:
Как у вас по ощущениям перед ФРС? Уже задраили люки и сидите в стейблах или держите позиции с открытым забралом? Пишите ниже, как перекрываете эти макро-качели!
#BinanceSquare #Anthropic #MacroAnalysis #BULLSTANDARD #CryptoNews
205

·
--
The Fed may hold rates tomorrow. That doesn’t automatically make it bullish for Bitcoin.
Markets are preparing for the October 27–28 FOMC meeting, and investors will be watching closely for clues about the Fed’s next move. The statement and press conference could matter just as much as the rate decision itself.
Here’s the setup for $BTC:
🟢 Scenario A Patient Fed: Rates stay unchanged, and policymakers sound less concerned about further tightening. That could support risk appetite but Bitcoin still needs to confirm the move.
🔴 Scenario B Hawkish Fed: Rates stay unchanged, but officials signal that persistent inflation could require tighter policy later. That could keep pressure on risk assets.
My key rule: Don’t trade the headline. Watch the reaction.
Check the dollar, Treasury yields, and whether $BTC
{future}(BTCUSDT)
sustains its initial move after the announcement. A sudden spike can reverse quickly; confirmation matters more than the first candle.
What’s your view: Is the Fed decision already priced in, or could its guidance surprise the crypto market?
#bitcoin #BTC #fomc #CryptoMarket #MacroAnalysis
The Fed may hold rates tomorrow. That doesn’t automatically make it bullish for Bitcoin.
Markets are preparing for the October 27–28 FOMC meeting, and investors will be watching closely for clues about the Fed’s next move. The statement and press conference could matter just as much as the rate decision itself.
Here’s the setup for $BTC :
🟢 Scenario A Patient Fed: Rates stay unchanged, and policymakers sound less concerned about further tightening. That could support risk appetite but Bitcoin still needs to confirm the move.
🔴 Scenario B Hawkish Fed: Rates stay unchanged, but officials signal that persistent inflation could require tighter policy later. That could keep pressure on risk assets.
My key rule: Don’t trade the headline. Watch the reaction.
Check the dollar, Treasury yields, and whether $BTC
sustains its initial move after the announcement. A sudden spike can reverse quickly; confirmation matters more than the first candle.
What’s your view: Is the Fed decision already priced in, or could its guidance surprise the crypto market?
#bitcoin #BTC #fomc #CryptoMarket #MacroAnalysis
Markets are preparing for the October 27–28 FOMC meeting, and investors will be watching closely for clues about the Fed’s next move. The statement and press conference could matter just as much as the rate decision itself.
Here’s the setup for $BTC :
🟢 Scenario A Patient Fed: Rates stay unchanged, and policymakers sound less concerned about further tightening. That could support risk appetite but Bitcoin still needs to confirm the move.
🔴 Scenario B Hawkish Fed: Rates stay unchanged, but officials signal that persistent inflation could require tighter policy later. That could keep pressure on risk assets.
My key rule: Don’t trade the headline. Watch the reaction.
Check the dollar, Treasury yields, and whether $BTC
sustains its initial move after the announcement. A sudden spike can reverse quickly; confirmation matters more than the first candle.
What’s your view: Is the Fed decision already priced in, or could its guidance surprise the crypto market?
#bitcoin #BTC #fomc #CryptoMarket #MacroAnalysis

85


·
--
Verified
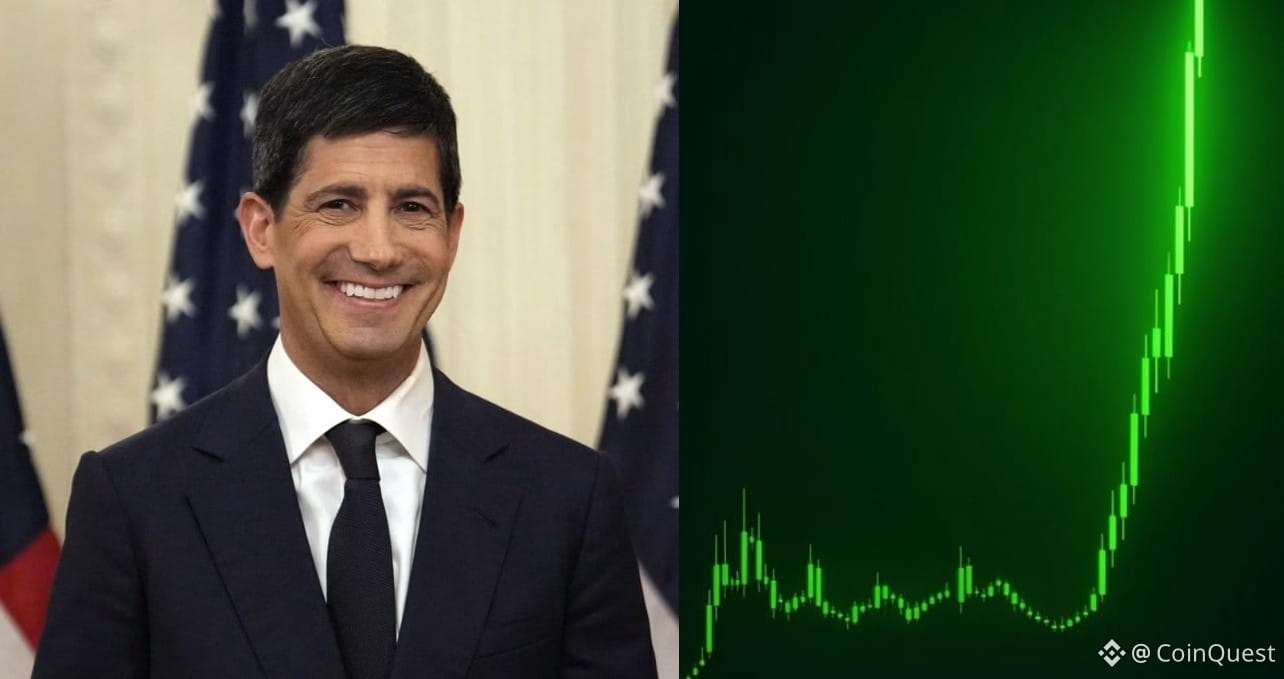
😱 $3.653 BILLION in Fed Treasury purchases… bullish for Bitcoin?
The headline sounds like fresh liquidity entering the market, but there's an important detail traders shouldn't ignore
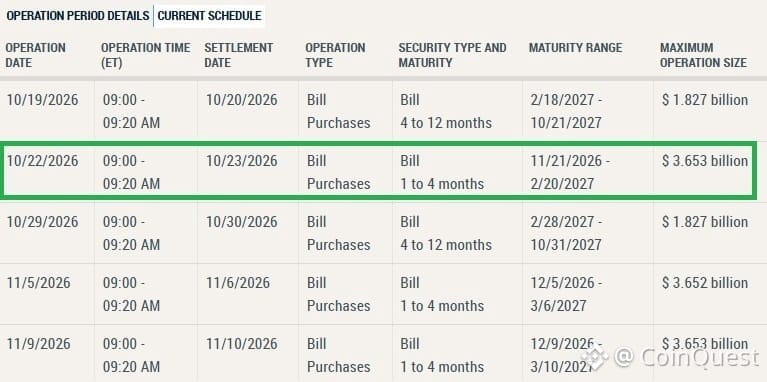
The New York Fed's October 22 operation involved $3.653B in Treasury bill purchases, settling on October 23
These purchases are part of a planned $14.6B reinvestment program running through November 13
This is NOT a new $3.653B liquidity injection
The Fed is reinvesting principal payments from agency securities into Treasuries, changing the composition of its holdings rather than expanding them through this operation
So should $BTC bulls celebrate?
Not from this headline alone. Reinvestment purchases are routine operations, not proof that a new QE program has started
For crypto, the bigger question is whether broader financial conditions and liquidity actually improve
Bullish signal for BTC, or just routine Fed business? 🤔
#CryptoNews #BTC #MacroAnalysis
😱 $3.653 BILLION in Fed Treasury purchases… bullish for Bitcoin?
The headline sounds like fresh liquidity entering the market, but there's an important detail traders shouldn't ignore
The New York Fed's October 22 operation involved $3.653B in Treasury bill purchases, settling on October 23
These purchases are part of a planned $14.6B reinvestment program running through November 13
This is NOT a new $3.653B liquidity injection
The Fed is reinvesting principal payments from agency securities into Treasuries, changing the composition of its holdings rather than expanding them through this operation
So should $BTC bulls celebrate?
Not from this headline alone. Reinvestment purchases are routine operations, not proof that a new QE program has started
For crypto, the bigger question is whether broader financial conditions and liquidity actually improve
Bullish signal for BTC, or just routine Fed business? 🤔
#CryptoNews #BTC #MacroAnalysis
The headline sounds like fresh liquidity entering the market, but there's an important detail traders shouldn't ignore
The New York Fed's October 22 operation involved $3.653B in Treasury bill purchases, settling on October 23
These purchases are part of a planned $14.6B reinvestment program running through November 13
This is NOT a new $3.653B liquidity injection
The Fed is reinvesting principal payments from agency securities into Treasuries, changing the composition of its holdings rather than expanding them through this operation
So should $BTC bulls celebrate?
Not from this headline alone. Reinvestment purchases are routine operations, not proof that a new QE program has started
For crypto, the bigger question is whether broader financial conditions and liquidity actually improve
Bullish signal for BTC, or just routine Fed business? 🤔
#CryptoNews #BTC #MacroAnalysis
3
553

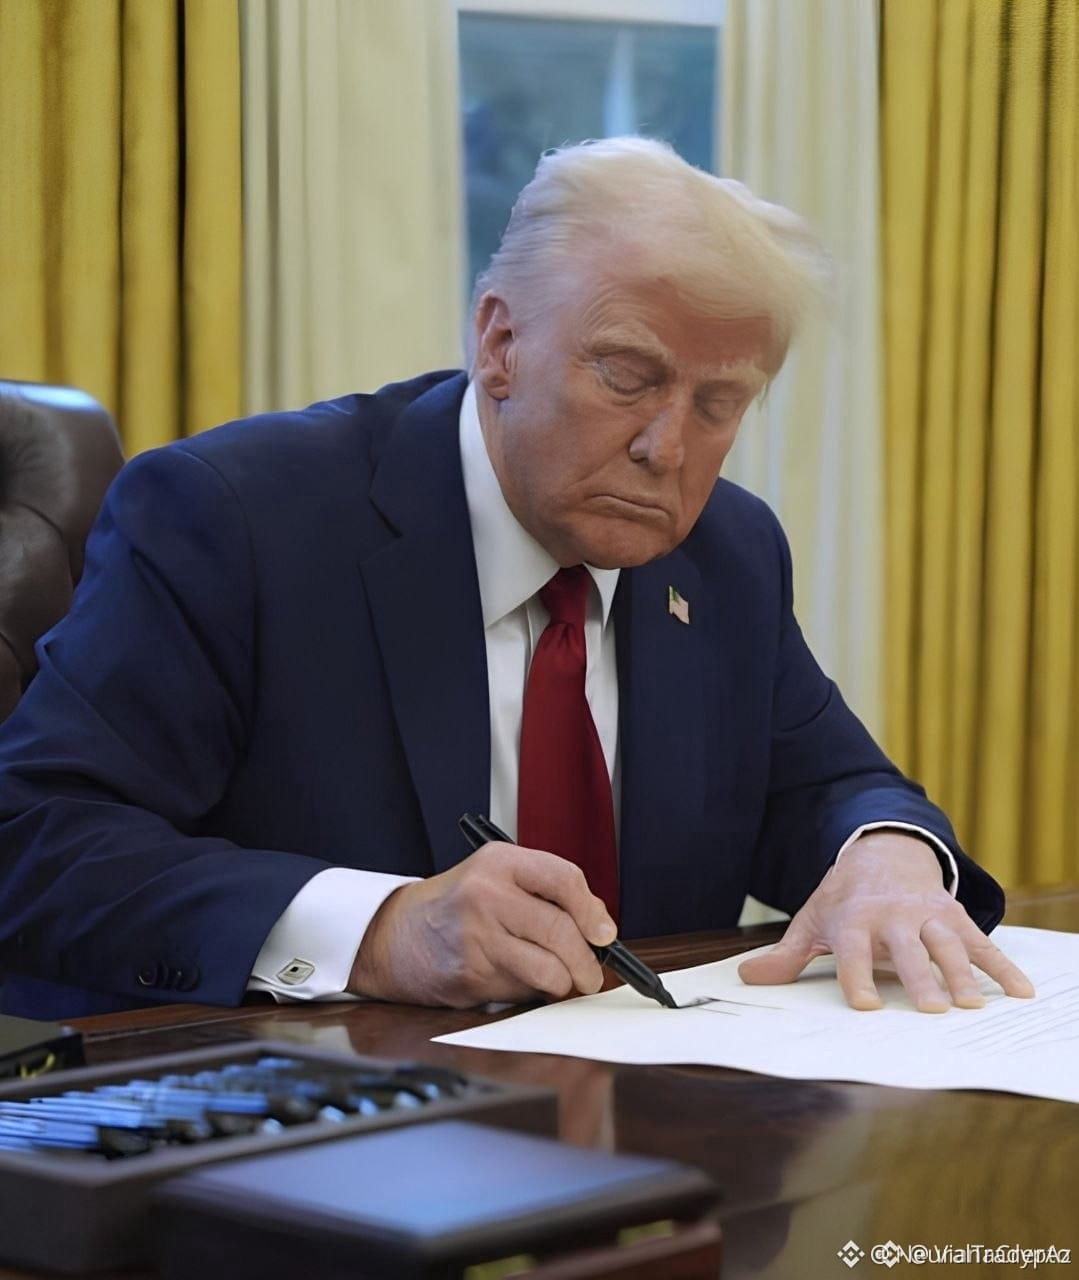
⚡ MACRO VOLATILITY EXPANDS AS $TRUMP COMMENTS SHAKE GLOBAL ENERGY NARRATIVE! 🌍
📌 Geopolitical rhetoric is driving significant headline risk across macro assets, creating acute inefficiency zones across correlated markets. 📊 When energy market uncertainty spikes, institutional liquidity tends to rotate rapidly as capital reprices systemic risk and inflation expectations.
🔍 Discerning market participants are monitoring order flow closely to see whether this macro friction sparks a sustained flight to alternative liquid assets. 💬 How heavily will escalating energy and political friction impact crypto liquidity this quarter? 👇
⚠️ Not financial advice. Always manage your risk. 🛡️
🏷️ #TRUMP #MacroAnalysis #EnergyMarkets #Liquidity #Crypto
🎯 🦈
⚡ MACRO VOLATILITY EXPANDS AS $TRUMP COMMENTS SHAKE GLOBAL ENERGY NARRATIVE! 🌍
📌 Geopolitical rhetoric is driving significant headline risk across macro assets, creating acute inefficiency zones across correlated markets. 📊 When energy market uncertainty spikes, institutional liquidity tends to rotate rapidly as capital reprices systemic risk and inflation expectations.
🔍 Discerning market participants are monitoring order flow closely to see whether this macro friction sparks a sustained flight to alternative liquid assets. 💬 How heavily will escalating energy and political friction impact crypto liquidity this quarter? 👇
⚠️ Not financial advice. Always manage your risk. 🛡️
🏷️ #TRUMP #MacroAnalysis #EnergyMarkets #Liquidity #Crypto
🎯 🦈
📌 Geopolitical rhetoric is driving significant headline risk across macro assets, creating acute inefficiency zones across correlated markets. 📊 When energy market uncertainty spikes, institutional liquidity tends to rotate rapidly as capital reprices systemic risk and inflation expectations.
🔍 Discerning market participants are monitoring order flow closely to see whether this macro friction sparks a sustained flight to alternative liquid assets. 💬 How heavily will escalating energy and political friction impact crypto liquidity this quarter? 👇
⚠️ Not financial advice. Always manage your risk. 🛡️
🏷️ #TRUMP #MacroAnalysis #EnergyMarkets #Liquidity #Crypto
🎯 🦈
1
20
🏛️ CITADEL CHIEF WARNS OF AI BUBBLE DYNAMICS IMPACTING MACRO CAPITAL FLOWS 🔍
Institutional heavyweights are flashing caution over capital misallocation across transformative tech cycles. 🌊 While early euphoria often creates structural inefficiencies and aggressive premiums, historical context reveals that peak cycle compression typically flushes late participants before establishing long-term secular market leaders.
💡 Observing how smart money navigates these valuation excesses provides critical insight into global liquidity rotation. 💬 Do you believe the current AI valuation expansion is due for a macro mean-reversion, or are we still in the early expansion phase? 👇
⚠️ Not financial advice. Always manage your risk. 🛡️
🏷️ #AI #MarketStructure #Liquidity #MacroAnalysis
🎯 🦈
🏛️ CITADEL CHIEF WARNS OF AI BUBBLE DYNAMICS IMPACTING MACRO CAPITAL FLOWS 🔍
Institutional heavyweights are flashing caution over capital misallocation across transformative tech cycles. 🌊 While early euphoria often creates structural inefficiencies and aggressive premiums, historical context reveals that peak cycle compression typically flushes late participants before establishing long-term secular market leaders.
💡 Observing how smart money navigates these valuation excesses provides critical insight into global liquidity rotation. 💬 Do you believe the current AI valuation expansion is due for a macro mean-reversion, or are we still in the early expansion phase? 👇
⚠️ Not financial advice. Always manage your risk. 🛡️
🏷️ #AI #MarketStructure #Liquidity #MacroAnalysis
🎯 🦈
Institutional heavyweights are flashing caution over capital misallocation across transformative tech cycles. 🌊 While early euphoria often creates structural inefficiencies and aggressive premiums, historical context reveals that peak cycle compression typically flushes late participants before establishing long-term secular market leaders.
💡 Observing how smart money navigates these valuation excesses provides critical insight into global liquidity rotation. 💬 Do you believe the current AI valuation expansion is due for a macro mean-reversion, or are we still in the early expansion phase? 👇
⚠️ Not financial advice. Always manage your risk. 🛡️
🏷️ #AI #MarketStructure #Liquidity #MacroAnalysis
🎯 🦈
25

·
--
Interest rates are the invisible gravity that shapes every crypto cycle — yet most traders ignore them.
When real rates (nominal minus inflation) are deeply negative, holding cash bleeds purchasing power. Capital migrates toward scarce, productive, or speculative assets — and crypto thrives in exactly this environment. The 2020-2021 bull market was not a coincidence: it ran alongside the most extreme monetary expansion in modern history.
When the Fed tightened aggressively in 2022, risk assets repriced across the board. Crypto was hit hardest because it had the highest implied growth duration — meaning it had borrowed the most from future expectations. Duration risk cuts both ways.
Now we are in a transition regime. The rate cycle is rolling over, and the key question is whether capital rotates back into high-duration assets before or after rate normalization fully completes.
Historically, the most powerful crypto moves begin during early rate-cut cycles — not at the bottom of rates. The anticipation does more work than the actual cuts.
$BTC benefits first as the hardest asset in the class. $ETH follows as the yield-bearing settlement layer. $SOL captures expanding risk appetite further out the curve.
Watch the 2-year Treasury yield more than any chart pattern. When real rates compress, the gravity weakens — and crypto floats.
#Bitcoin #Crypto #MacroAnalysis #CryptoMarkets #InterestRates
Interest rates are the invisible gravity that shapes every crypto cycle — yet most traders ignore them.
When real rates (nominal minus inflation) are deeply negative, holding cash bleeds purchasing power. Capital migrates toward scarce, productive, or speculative assets — and crypto thrives in exactly this environment. The 2020-2021 bull market was not a coincidence: it ran alongside the most extreme monetary expansion in modern history.
When the Fed tightened aggressively in 2022, risk assets repriced across the board. Crypto was hit hardest because it had the highest implied growth duration — meaning it had borrowed the most from future expectations. Duration risk cuts both ways.
Now we are in a transition regime. The rate cycle is rolling over, and the key question is whether capital rotates back into high-duration assets before or after rate normalization fully completes.
Historically, the most powerful crypto moves begin during early rate-cut cycles — not at the bottom of rates. The anticipation does more work than the actual cuts.
$BTC benefits first as the hardest asset in the class. $ETH follows as the yield-bearing settlement layer. $SOL captures expanding risk appetite further out the curve.
Watch the 2-year Treasury yield more than any chart pattern. When real rates compress, the gravity weakens — and crypto floats.
#Bitcoin #Crypto #MacroAnalysis #CryptoMarkets #InterestRates
When real rates (nominal minus inflation) are deeply negative, holding cash bleeds purchasing power. Capital migrates toward scarce, productive, or speculative assets — and crypto thrives in exactly this environment. The 2020-2021 bull market was not a coincidence: it ran alongside the most extreme monetary expansion in modern history.
When the Fed tightened aggressively in 2022, risk assets repriced across the board. Crypto was hit hardest because it had the highest implied growth duration — meaning it had borrowed the most from future expectations. Duration risk cuts both ways.
Now we are in a transition regime. The rate cycle is rolling over, and the key question is whether capital rotates back into high-duration assets before or after rate normalization fully completes.
Historically, the most powerful crypto moves begin during early rate-cut cycles — not at the bottom of rates. The anticipation does more work than the actual cuts.
$BTC benefits first as the hardest asset in the class. $ETH follows as the yield-bearing settlement layer. $SOL captures expanding risk appetite further out the curve.
Watch the 2-year Treasury yield more than any chart pattern. When real rates compress, the gravity weakens — and crypto floats.
#Bitcoin #Crypto #MacroAnalysis #CryptoMarkets #InterestRates
62

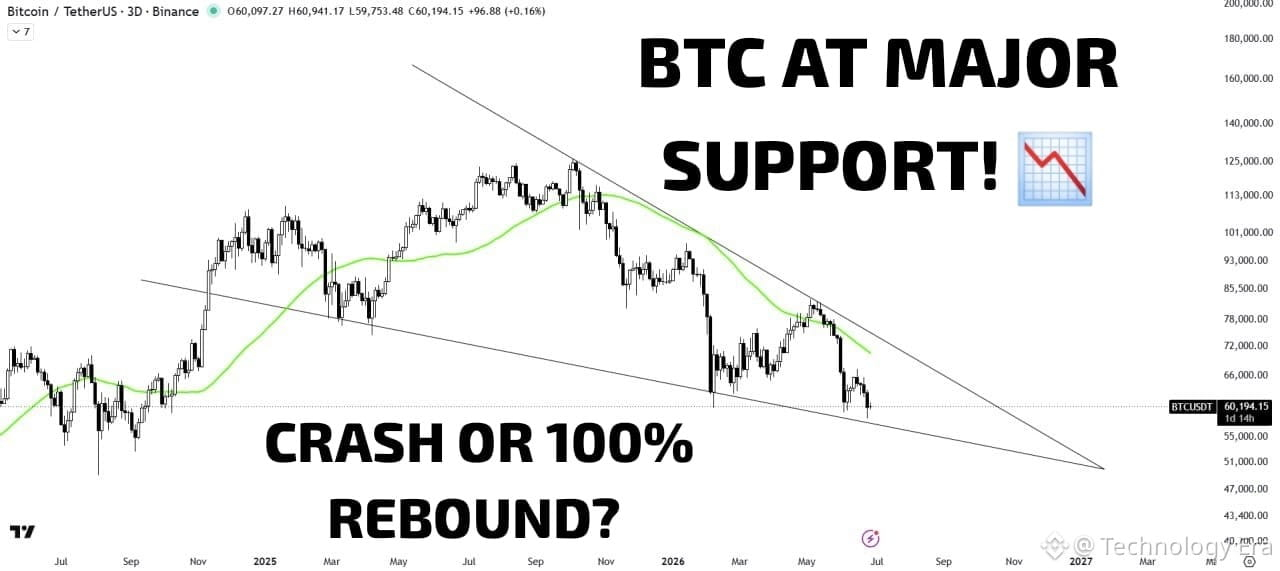
🚨 $BTC Massive Macro Wedge: Make-or-Break Moment! 📉 Or 🚀?
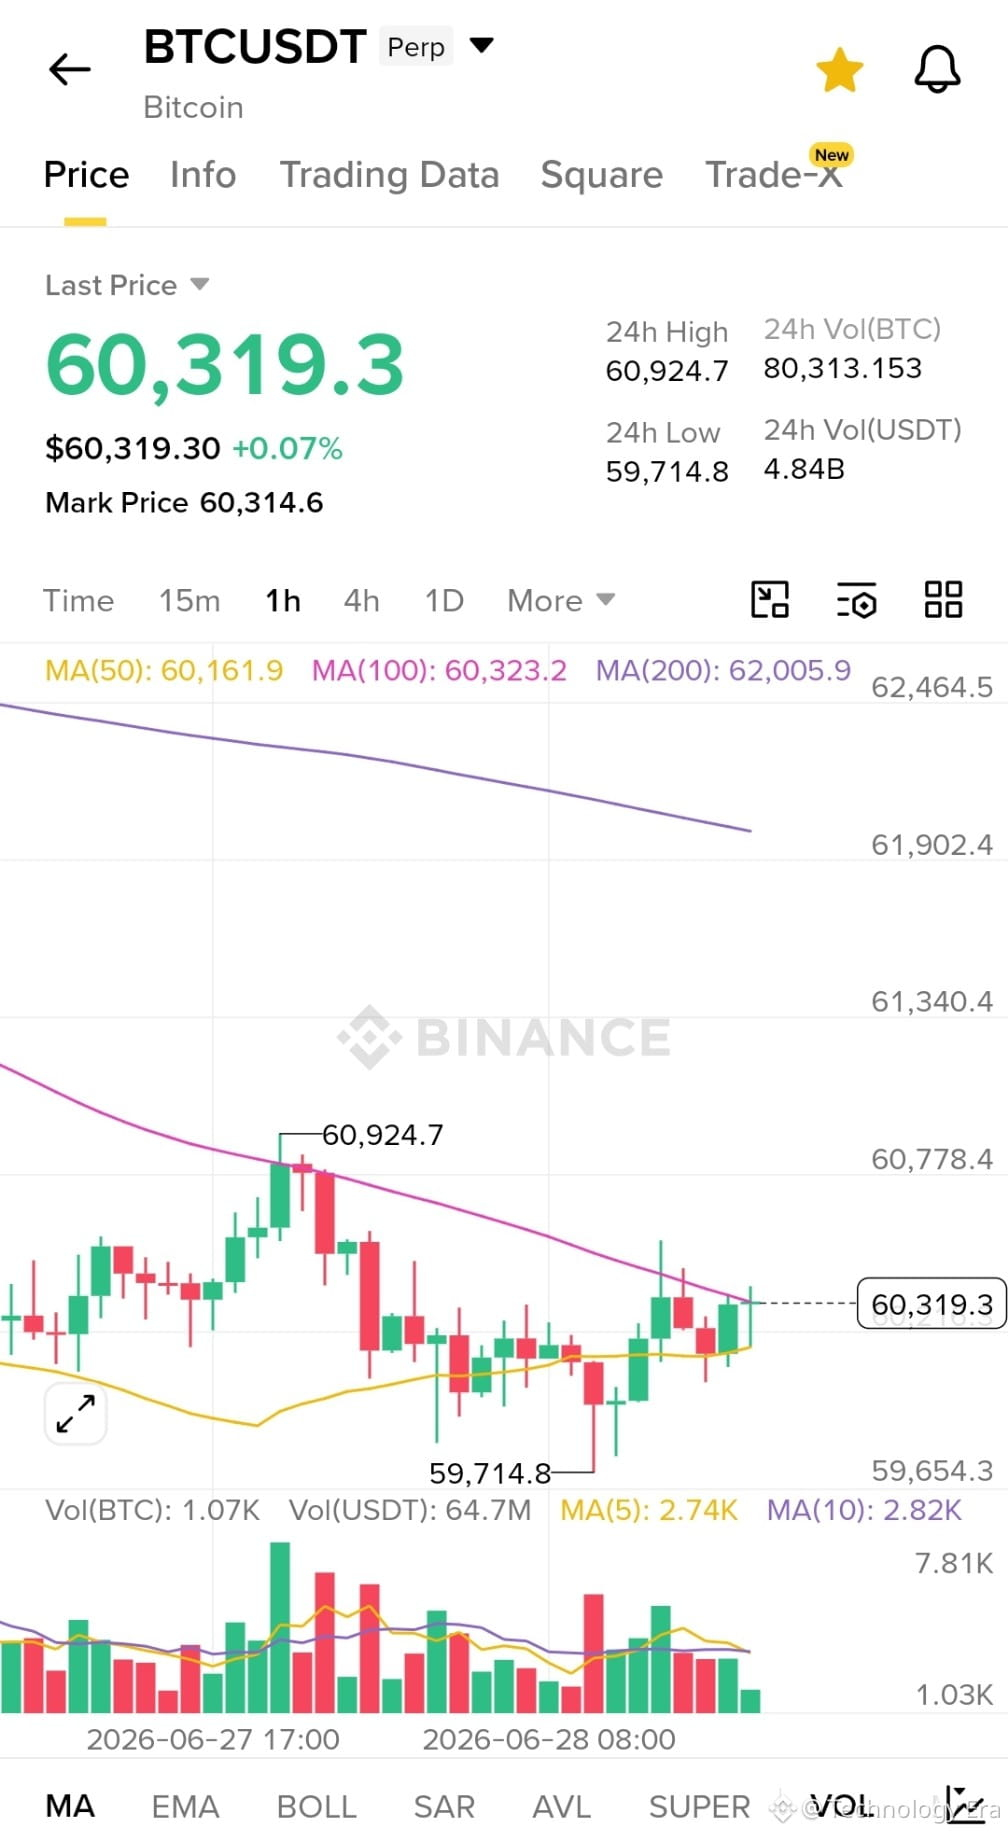
Bitcoin is squeezing into a giant multi-month falling wedge pattern on the macro 3-day chart. Right now, it is trading around $60,194, sitting directly on the make-or-break lower support line.
On the shorter 1-hour timeframe, price is tightly fighting the immediate moving averages, hovering at $60,319. This extreme compression means a powerful structural move is right around the corner!
📊 The Macro Wedge Formula:
Macro Support Squeeze + Short-Term Consolidation = High Velocity Breakout
🎯 Key Macro Levels to Watch
1.The Ultimate Support Floor: The bottom trendline of the macro wedge lines up right around $58,000 - $60,000. If this floor gives way, a deeper correction is on the table.
2.The Resistance Hurdle: To ignite a massive trend reversal, Bitcoin needs a clean break above the overhead descending trendline, currently sitting well above $66,000.
3.My Strategy: The market is testing the patience of both buyers and sellers here. Because we are sitting exactly at major macro support, shorting here carries a high risk of getting trapped. I am tightly monitoring the daily and 3-day candle closes for a confirmed bounce structure before planning any aggressive swing setups.
Preserve your capital and stay disciplined in this high-squeeze zone!
💬 What is your target? Will the macro wedge support trigger a massive rally back to the top trendline, or do we break below $59K next? Vote below! 👇
Disclaimer: This is for educational purposes only. Always do your own research (DYOR) before entering any trade.
📸 Image Source: Binance & TradingView
#TechnicalAnalysisn #MacroAnalysis
#KioxiaADRFallsOver14% #ModernaRisesOver12% #FINMAAcceleratesAIForCryptoOversight
$BTC
{future}(BTCUSDT)
🚨 $BTC Massive Macro Wedge: Make-or-Break Moment! 📉 Or 🚀?
Bitcoin is squeezing into a giant multi-month falling wedge pattern on the macro 3-day chart. Right now, it is trading around $60,194, sitting directly on the make-or-break lower support line.
On the shorter 1-hour timeframe, price is tightly fighting the immediate moving averages, hovering at $60,319. This extreme compression means a powerful structural move is right around the corner!
📊 The Macro Wedge Formula:
Macro Support Squeeze + Short-Term Consolidation = High Velocity Breakout
🎯 Key Macro Levels to Watch
1.The Ultimate Support Floor: The bottom trendline of the macro wedge lines up right around $58,000 - $60,000. If this floor gives way, a deeper correction is on the table.
2.The Resistance Hurdle: To ignite a massive trend reversal, Bitcoin needs a clean break above the overhead descending trendline, currently sitting well above $66,000.
3.My Strategy: The market is testing the patience of both buyers and sellers here. Because we are sitting exactly at major macro support, shorting here carries a high risk of getting trapped. I am tightly monitoring the daily and 3-day candle closes for a confirmed bounce structure before planning any aggressive swing setups.
Preserve your capital and stay disciplined in this high-squeeze zone!
💬 What is your target? Will the macro wedge support trigger a massive rally back to the top trendline, or do we break below $59K next? Vote below! 👇
Disclaimer: This is for educational purposes only. Always do your own research (DYOR) before entering any trade.
📸 Image Source: Binance & TradingView
#TechnicalAnalysisn #MacroAnalysis
#KioxiaADRFallsOver14% #ModernaRisesOver12% #FINMAAcceleratesAIForCryptoOversight
$BTC
Bitcoin is squeezing into a giant multi-month falling wedge pattern on the macro 3-day chart. Right now, it is trading around $60,194, sitting directly on the make-or-break lower support line.
On the shorter 1-hour timeframe, price is tightly fighting the immediate moving averages, hovering at $60,319. This extreme compression means a powerful structural move is right around the corner!
📊 The Macro Wedge Formula:
Macro Support Squeeze + Short-Term Consolidation = High Velocity Breakout
🎯 Key Macro Levels to Watch
1.The Ultimate Support Floor: The bottom trendline of the macro wedge lines up right around $58,000 - $60,000. If this floor gives way, a deeper correction is on the table.
2.The Resistance Hurdle: To ignite a massive trend reversal, Bitcoin needs a clean break above the overhead descending trendline, currently sitting well above $66,000.
3.My Strategy: The market is testing the patience of both buyers and sellers here. Because we are sitting exactly at major macro support, shorting here carries a high risk of getting trapped. I am tightly monitoring the daily and 3-day candle closes for a confirmed bounce structure before planning any aggressive swing setups.
Preserve your capital and stay disciplined in this high-squeeze zone!
💬 What is your target? Will the macro wedge support trigger a massive rally back to the top trendline, or do we break below $59K next? Vote below! 👇
Disclaimer: This is for educational purposes only. Always do your own research (DYOR) before entering any trade.
📸 Image Source: Binance & TradingView
#TechnicalAnalysisn #MacroAnalysis
#KioxiaADRFallsOver14% #ModernaRisesOver12% #FINMAAcceleratesAIForCryptoOversight
$BTC
105

·
--
Bearish
🚨 OIL ERASES GAINS — IS LIQUIDITY RETURNING TO RISK ASSETS? 🛢️📉🚀
Crude oil has wiped out its earlier gains, a move that could ease inflation concerns and shift macro sentiment back toward risk assets.
Why it matters 👇
✅ Lower oil prices = less inflation pressure
✅ Reduced odds of aggressive central bank policy
✅ Improved liquidity outlook
✅ Stronger appetite for Bitcoin and altcoins
✅ Risk-on sentiment could return faster than expected
Macro drives markets. If energy prices continue cooling, crypto could be one of the biggest beneficiaries.
👀 Watching $BTC and the broader altcoin market closely.
#Bitcoin #Crypto #BTC #Altcoins #MacroAnalysis $BTC
{future}(BTCUSDT)
$ETH
{future}(ETHUSDT)
🚨 OIL ERASES GAINS — IS LIQUIDITY RETURNING TO RISK ASSETS? 🛢️📉🚀
Crude oil has wiped out its earlier gains, a move that could ease inflation concerns and shift macro sentiment back toward risk assets.
Why it matters 👇
✅ Lower oil prices = less inflation pressure
✅ Reduced odds of aggressive central bank policy
✅ Improved liquidity outlook
✅ Stronger appetite for Bitcoin and altcoins
✅ Risk-on sentiment could return faster than expected
Macro drives markets. If energy prices continue cooling, crypto could be one of the biggest beneficiaries.
👀 Watching $BTC and the broader altcoin market closely.
#Bitcoin #Crypto #BTC #Altcoins #MacroAnalysis $BTC
$ETH
Crude oil has wiped out its earlier gains, a move that could ease inflation concerns and shift macro sentiment back toward risk assets.
Why it matters 👇
✅ Lower oil prices = less inflation pressure
✅ Reduced odds of aggressive central bank policy
✅ Improved liquidity outlook
✅ Stronger appetite for Bitcoin and altcoins
✅ Risk-on sentiment could return faster than expected
Macro drives markets. If energy prices continue cooling, crypto could be one of the biggest beneficiaries.
👀 Watching $BTC and the broader altcoin market closely.
#Bitcoin #Crypto #BTC #Altcoins #MacroAnalysis $BTC
$ETH
1
34

·
--
Verified
Article
⚠️ XAUUSD Advanced Analysis: Geopolitical Noise, Oil Correlation, and The Inflation FlipGold ( $XAU ) is currently showcasing a fascinating anomaly that separates retail thinking from institutional execution. While textbook logic dictates that "peace talks mean lower Gold," the actual market mechanics are currently being driven by a much deeper Intermarket relationship between Crude Oil, Inflation, and the Federal Reserve's next move.
Here is the updated macro breakdown of why the market is defying basic retail expectations:
📌 The Oil & Inflation Connection: Why Gold is Pumping
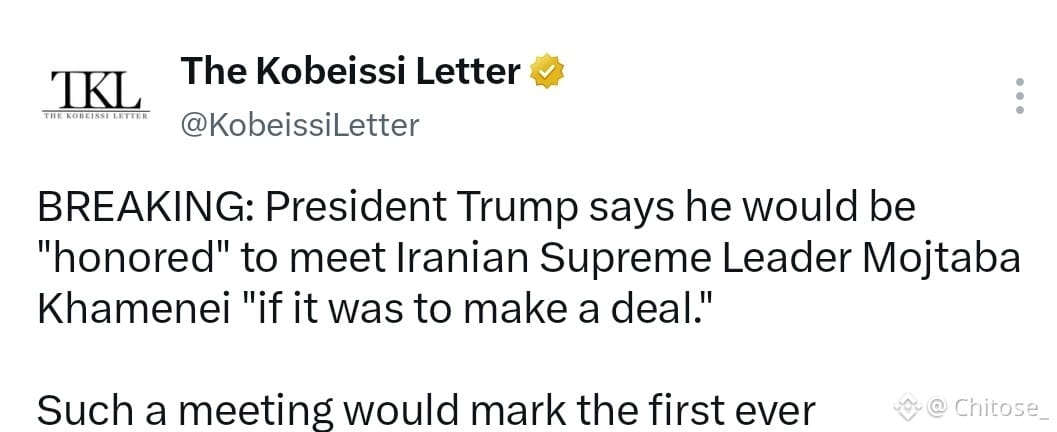
The recent headlines regarding US-Iran negotiations go beyond surface-level geopolitics; they directly impact the global energy corridor.
Resolving the oil transit and supply chain blockades means global Crude Oil prices are expected to stabilize or drop significantly.
Since energy is the primary driver of global production and shipping costs, solving the oil supply issue effectively cools down global inflation.
📌 The Fed Pivot Expectation (The Institutional View)
This is where the paradigm shifts. The Federal Reserve's recent hawkish stance was entirely predicated on "sticky inflation."
If the resolution of the oil route successfully tames inflation, the Fed completely loses its logical backing for maintaining ultra-high interest rates or pursuing further rate hikes.
Institutions are forward-pricing this exact scenario: lower inflation leading to a swift monetary easing cycle (Rate Cuts). As a result, the US Dollar loses its long-term yield advantage, backing up and acting as the main fuel driving Gold prices higher.
📌 Technical Re-evaluation (4H Chart)
Beyond the Surface Mitigation: While the price initially found temporary resistance at the 4H Balanced Price Range (BPR), this sophisticated intermarket dynamic explains why the bears couldn't sustain control mid-range.
Inducement & Stop Hunt: Retail traders who blindly shorted the "peace news" are currently being converted into buy-side liquidity.
Next Key Zones: With the market validating this macro-inflation flip, we must now heavily monitor the upper Daily Key Level BPR and the daily Inverted Fair Value Gap (iFG). These higher premium zones are the true institutional targets for deep liquidity sweeps.
💡 Trading Playbook:
Drop the simplistic "peace = short" bias. Understand that institutions are trading the macro-economic domino effect on the US Dollar.
Treat current mid-range pumps as short-term momentum shifts driven by the oil-inflation narrative.
Wait for the price to fully mature into major daily overhead key levels and look for clean Market Structure Shifts (MSS) before executing high-probability setups.
In a market run by algorithms, understanding the correlation between asset classes is what separates profitable traders from the liquidity. Stay objective and manage your risk.
{future}(XAUUSDT)
{future}(CLUSDT)
#TradeFi #MacroAnalysis #IntermarketAnalysis #postontradefi
⚠️ XAUUSD Advanced Analysis: Geopolitical Noise, Oil Correlation, and The Inflation Flip
Gold ( $XAU ) is currently showcasing a fascinating anomaly that separates retail thinking from institutional execution. While textbook logic dictates that "peace talks mean lower Gold," the actual market mechanics are currently being driven by a much deeper Intermarket relationship between Crude Oil, Inflation, and the Federal Reserve's next move.
Here is the updated macro breakdown of why the market is defying basic retail expectations:
📌 The Oil & Inflation Connection: Why Gold is Pumping
The recent headlines regarding US-Iran negotiations go beyond surface-level geopolitics; they directly impact the global energy corridor.
Resolving the oil transit and supply chain blockades means global Crude Oil prices are expected to stabilize or drop significantly.
Since energy is the primary driver of global production and shipping costs, solving the oil supply issue effectively cools down global inflation.
📌 The Fed Pivot Expectation (The Institutional View)
This is where the paradigm shifts. The Federal Reserve's recent hawkish stance was entirely predicated on "sticky inflation."
If the resolution of the oil route successfully tames inflation, the Fed completely loses its logical backing for maintaining ultra-high interest rates or pursuing further rate hikes.
Institutions are forward-pricing this exact scenario: lower inflation leading to a swift monetary easing cycle (Rate Cuts). As a result, the US Dollar loses its long-term yield advantage, backing up and acting as the main fuel driving Gold prices higher.
📌 Technical Re-evaluation (4H Chart)
Beyond the Surface Mitigation: While the price initially found temporary resistance at the 4H Balanced Price Range (BPR), this sophisticated intermarket dynamic explains why the bears couldn't sustain control mid-range.
Inducement & Stop Hunt: Retail traders who blindly shorted the "peace news" are currently being converted into buy-side liquidity.
Next Key Zones: With the market validating this macro-inflation flip, we must now heavily monitor the upper Daily Key Level BPR and the daily Inverted Fair Value Gap (iFG). These higher premium zones are the true institutional targets for deep liquidity sweeps.
💡 Trading Playbook:
Drop the simplistic "peace = short" bias. Understand that institutions are trading the macro-economic domino effect on the US Dollar.
Treat current mid-range pumps as short-term momentum shifts driven by the oil-inflation narrative.
Wait for the price to fully mature into major daily overhead key levels and look for clean Market Structure Shifts (MSS) before executing high-probability setups.
In a market run by algorithms, understanding the correlation between asset classes is what separates profitable traders from the liquidity. Stay objective and manage your risk.
#TradeFi #MacroAnalysis #IntermarketAnalysis #postontradefi
Here is the updated macro breakdown of why the market is defying basic retail expectations:
📌 The Oil & Inflation Connection: Why Gold is Pumping
The recent headlines regarding US-Iran negotiations go beyond surface-level geopolitics; they directly impact the global energy corridor.
Resolving the oil transit and supply chain blockades means global Crude Oil prices are expected to stabilize or drop significantly.
Since energy is the primary driver of global production and shipping costs, solving the oil supply issue effectively cools down global inflation.
📌 The Fed Pivot Expectation (The Institutional View)
This is where the paradigm shifts. The Federal Reserve's recent hawkish stance was entirely predicated on "sticky inflation."
If the resolution of the oil route successfully tames inflation, the Fed completely loses its logical backing for maintaining ultra-high interest rates or pursuing further rate hikes.
Institutions are forward-pricing this exact scenario: lower inflation leading to a swift monetary easing cycle (Rate Cuts). As a result, the US Dollar loses its long-term yield advantage, backing up and acting as the main fuel driving Gold prices higher.
📌 Technical Re-evaluation (4H Chart)
Beyond the Surface Mitigation: While the price initially found temporary resistance at the 4H Balanced Price Range (BPR), this sophisticated intermarket dynamic explains why the bears couldn't sustain control mid-range.
Inducement & Stop Hunt: Retail traders who blindly shorted the "peace news" are currently being converted into buy-side liquidity.
Next Key Zones: With the market validating this macro-inflation flip, we must now heavily monitor the upper Daily Key Level BPR and the daily Inverted Fair Value Gap (iFG). These higher premium zones are the true institutional targets for deep liquidity sweeps.
💡 Trading Playbook:
Drop the simplistic "peace = short" bias. Understand that institutions are trading the macro-economic domino effect on the US Dollar.
Treat current mid-range pumps as short-term momentum shifts driven by the oil-inflation narrative.
Wait for the price to fully mature into major daily overhead key levels and look for clean Market Structure Shifts (MSS) before executing high-probability setups.
In a market run by algorithms, understanding the correlation between asset classes is what separates profitable traders from the liquidity. Stay objective and manage your risk.
#TradeFi #MacroAnalysis #IntermarketAnalysis #postontradefi
1
221

·
--
GEOPOLITICAL DE-ESCALATION IN THE MIDDLE EAST SIGNALS A SHIFT IN GLOBAL MARKET LIQUIDITY ⚡
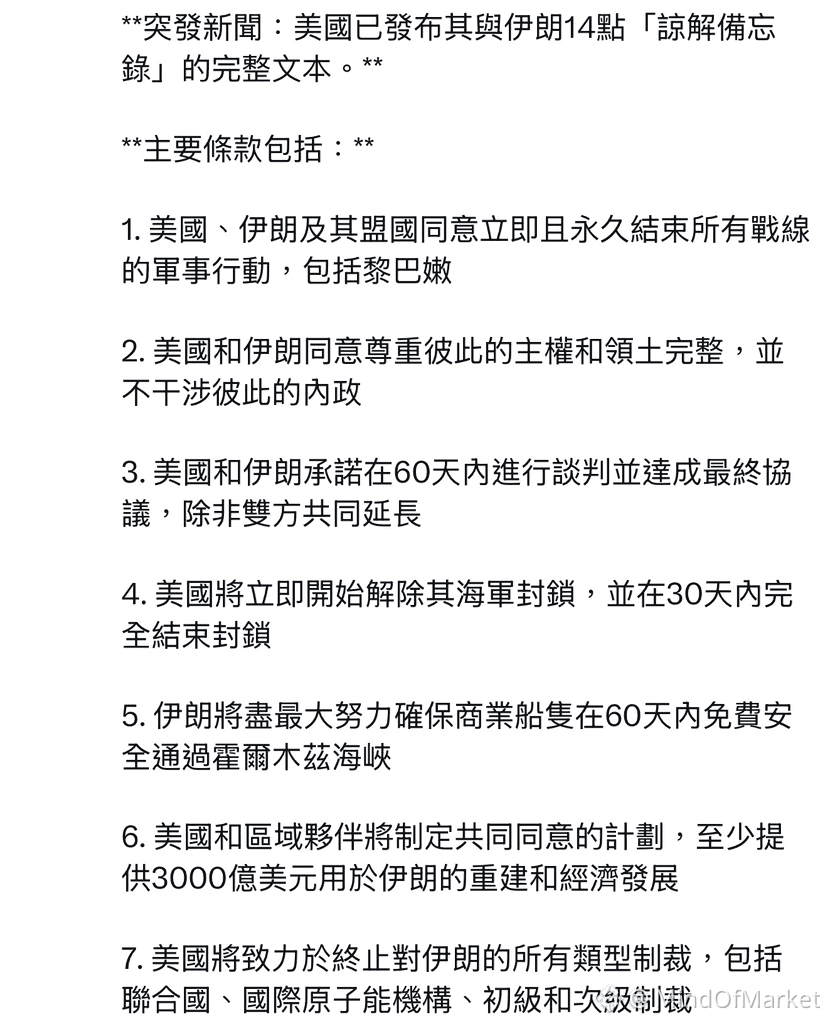
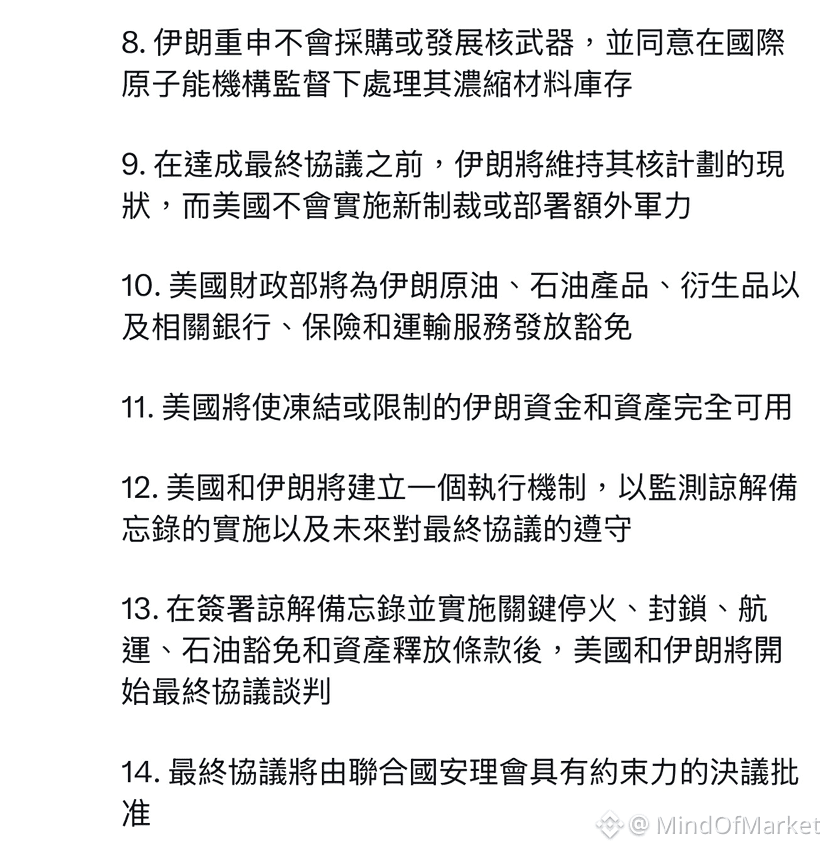
The reported normalization between the US and Iran suggests a significant reduction in regional risk premiums. With the potential lifting of sanctions and the stabilization of the Strait of Hormuz, we are likely to see a shift in capital flow away from safe-haven assets and back into risk-on instruments.
Energy supply chains and global commodity markets are adjusting to this new baseline. Monitor how $BTC and $XAU react to this macro pivot as institutional liquidity rotates in response to the reduced geopolitical tension. How do you expect this shift to impact your current portfolio allocation?
Not financial advice. Always manage your risk.
#BTC #XAU #MacroAnalysis #MarketStructure #Geopolitics
⚡
GEOPOLITICAL DE-ESCALATION IN THE MIDDLE EAST SIGNALS A SHIFT IN GLOBAL MARKET LIQUIDITY ⚡
The reported normalization between the US and Iran suggests a significant reduction in regional risk premiums. With the potential lifting of sanctions and the stabilization of the Strait of Hormuz, we are likely to see a shift in capital flow away from safe-haven assets and back into risk-on instruments.
Energy supply chains and global commodity markets are adjusting to this new baseline. Monitor how $BTC and $XAU react to this macro pivot as institutional liquidity rotates in response to the reduced geopolitical tension. How do you expect this shift to impact your current portfolio allocation?
Not financial advice. Always manage your risk.
#BTC #XAU #MacroAnalysis #MarketStructure #Geopolitics
⚡
The reported normalization between the US and Iran suggests a significant reduction in regional risk premiums. With the potential lifting of sanctions and the stabilization of the Strait of Hormuz, we are likely to see a shift in capital flow away from safe-haven assets and back into risk-on instruments.
Energy supply chains and global commodity markets are adjusting to this new baseline. Monitor how $BTC and $XAU react to this macro pivot as institutional liquidity rotates in response to the reduced geopolitical tension. How do you expect this shift to impact your current portfolio allocation?
Not financial advice. Always manage your risk.
#BTC #XAU #MacroAnalysis #MarketStructure #Geopolitics
⚡
68
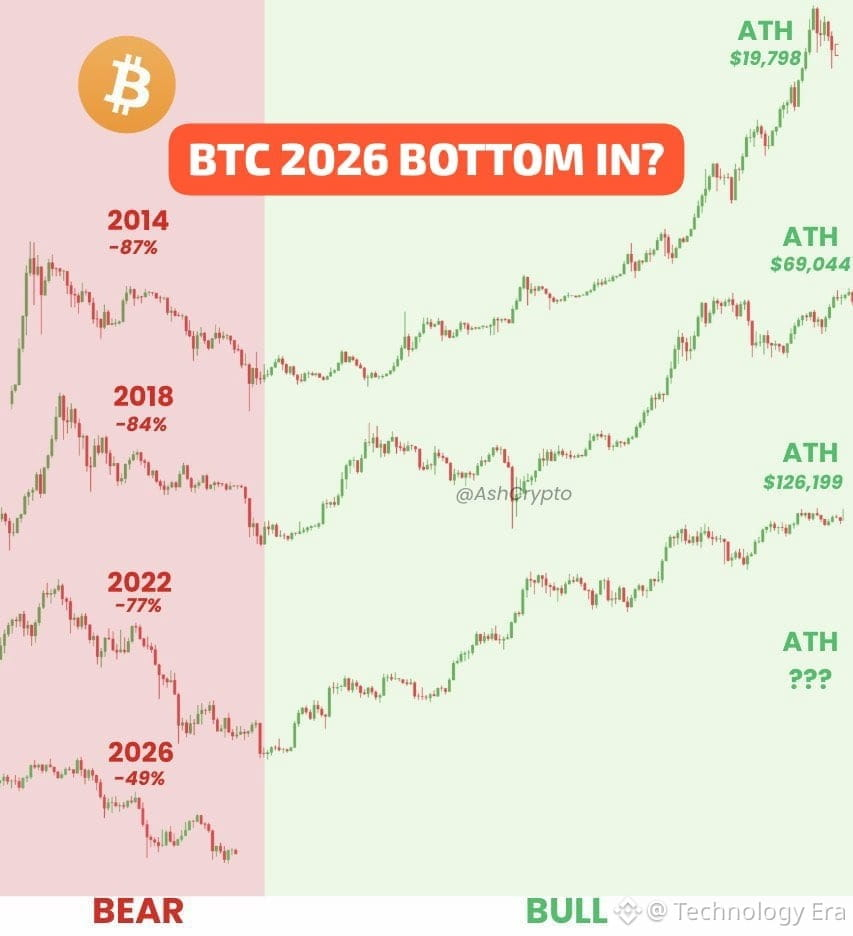
📊 $BTC Diminishing Drawdowns: Is the 2026 Bottom Already In? 📉
The historical macro comparison chart in highlights a massive structural pattern across Bitcoin's major market cycles. Every major bear market is seeing lower percentage drawdowns, signaling that BTC is maturing as a macro asset.
🔍 Historical Bear-to-Bull Patterns
2014: A punishing -87% drop led to a $19,798 All-Time High (ATH).
2018: An -84% correction cleared out the market before hitting a $69,044 ATH.
2022: A -77% drawdown paved the way for the historic $126,199 cycle peak.
2026 Current Status: We are sitting at a -49% drawdown from the peak, with the price currently stabilizing near $62,500 - $63,000.
🌐 The Diminishing Volatility Formula:
Bear Market Drawdowns (-87%--> -- 49%) = Asset Maturation & Floor Stability
💡 Live Market Insights:
Bitcoin is holding firmly above key support thresholds as on-chain data indicates seller exhaustion, with over 50% of the circulating supply currently sitting in a unrealized loss. If historical cycles repeat, this milder -49% drop might be the structural bottom for 2026 before the next macro bull leg starts tracking toward a brand-new uncharted ATH.
💬 Is a -49% correction all the bears get this cycle, or do you think a deeper capitulation is coming? Drop your prediction for the next $BTC ATH below! 👇
Disclaimer: This is for educational purposes only. Always do your own research (DYOR) before entering any trade.
📸 Image Source: AshCrypto & TradingView
#MacroAnalysis #TechnicalAnalysis #CryptoTrading. #BrentRises12%Weekly #NikkeiFalls5%WorstSinceMarch
$BTC
{future}(BTCUSDT)
📊 $BTC Diminishing Drawdowns: Is the 2026 Bottom Already In? 📉
The historical macro comparison chart in highlights a massive structural pattern across Bitcoin's major market cycles. Every major bear market is seeing lower percentage drawdowns, signaling that BTC is maturing as a macro asset.
🔍 Historical Bear-to-Bull Patterns
2014: A punishing -87% drop led to a $19,798 All-Time High (ATH).
2018: An -84% correction cleared out the market before hitting a $69,044 ATH.
2022: A -77% drawdown paved the way for the historic $126,199 cycle peak.
2026 Current Status: We are sitting at a -49% drawdown from the peak, with the price currently stabilizing near $62,500 - $63,000.
🌐 The Diminishing Volatility Formula:
Bear Market Drawdowns (-87%--> -- 49%) = Asset Maturation & Floor Stability
💡 Live Market Insights:
Bitcoin is holding firmly above key support thresholds as on-chain data indicates seller exhaustion, with over 50% of the circulating supply currently sitting in a unrealized loss. If historical cycles repeat, this milder -49% drop might be the structural bottom for 2026 before the next macro bull leg starts tracking toward a brand-new uncharted ATH.
💬 Is a -49% correction all the bears get this cycle, or do you think a deeper capitulation is coming? Drop your prediction for the next $BTC ATH below! 👇
Disclaimer: This is for educational purposes only. Always do your own research (DYOR) before entering any trade.
📸 Image Source: AshCrypto & TradingView
#MacroAnalysis #TechnicalAnalysis #CryptoTrading. #BrentRises12%Weekly #NikkeiFalls5%WorstSinceMarch
$BTC
The historical macro comparison chart in highlights a massive structural pattern across Bitcoin's major market cycles. Every major bear market is seeing lower percentage drawdowns, signaling that BTC is maturing as a macro asset.
🔍 Historical Bear-to-Bull Patterns
2014: A punishing -87% drop led to a $19,798 All-Time High (ATH).
2018: An -84% correction cleared out the market before hitting a $69,044 ATH.
2022: A -77% drawdown paved the way for the historic $126,199 cycle peak.
2026 Current Status: We are sitting at a -49% drawdown from the peak, with the price currently stabilizing near $62,500 - $63,000.
🌐 The Diminishing Volatility Formula:
Bear Market Drawdowns (-87%--> -- 49%) = Asset Maturation & Floor Stability
💡 Live Market Insights:
Bitcoin is holding firmly above key support thresholds as on-chain data indicates seller exhaustion, with over 50% of the circulating supply currently sitting in a unrealized loss. If historical cycles repeat, this milder -49% drop might be the structural bottom for 2026 before the next macro bull leg starts tracking toward a brand-new uncharted ATH.
💬 Is a -49% correction all the bears get this cycle, or do you think a deeper capitulation is coming? Drop your prediction for the next $BTC ATH below! 👇
Disclaimer: This is for educational purposes only. Always do your own research (DYOR) before entering any trade.
📸 Image Source: AshCrypto & TradingView
#MacroAnalysis #TechnicalAnalysis #CryptoTrading. #BrentRises12%Weekly #NikkeiFalls5%WorstSinceMarch
$BTC
2
2
325
·
--
Global liquidity cycles are the most underrated driver of crypto bull markets — and we may be entering a new expansion phase.
Central banks collectively manage trillions in balance sheet assets. When that number expands, risk assets inflate. When it contracts, they deflate. Crypto, as the highest-beta risk asset class, amplifies these moves by 3–5x.
The current macro setup is quietly shifting. The Fed has paused its QT program, the ECB is easing again, and the PBOC has resumed targeted stimulus. Historically, the 6–12 months following a coordinated global liquidity pivot are among the strongest periods for $BTC and $ETH performance.
What makes this cycle different: institutional allocation vehicles now exist at scale. Spot ETFs give traditional investors a direct fiat-to-crypto channel. When macro money looks for risk-on destinations, it no longer has to navigate wallets and seed phrases — it just buys the ETF.
For $BNB, the implication is compounded. Its native fee-burning and staking mechanics turn increased on-chain activity — which tends to follow liquidity inflows — directly into supply compression.
Watch global M2 money supply. Watch central bank balance sheet growth rates. Crypto doesn't move in a vacuum; it moves with global liquidity, just faster and harder.
The macro tide may be turning. Position accordingly.
#Bitcoin #CryptoMarkets #MacroAnalysis #Altcoins #CryptoInvesting
Global liquidity cycles are the most underrated driver of crypto bull markets — and we may be entering a new expansion phase.
Central banks collectively manage trillions in balance sheet assets. When that number expands, risk assets inflate. When it contracts, they deflate. Crypto, as the highest-beta risk asset class, amplifies these moves by 3–5x.
The current macro setup is quietly shifting. The Fed has paused its QT program, the ECB is easing again, and the PBOC has resumed targeted stimulus. Historically, the 6–12 months following a coordinated global liquidity pivot are among the strongest periods for $BTC and $ETH performance.
What makes this cycle different: institutional allocation vehicles now exist at scale. Spot ETFs give traditional investors a direct fiat-to-crypto channel. When macro money looks for risk-on destinations, it no longer has to navigate wallets and seed phrases — it just buys the ETF.
For $BNB , the implication is compounded. Its native fee-burning and staking mechanics turn increased on-chain activity — which tends to follow liquidity inflows — directly into supply compression.
Watch global M2 money supply. Watch central bank balance sheet growth rates. Crypto doesn't move in a vacuum; it moves with global liquidity, just faster and harder.
The macro tide may be turning. Position accordingly.
#Bitcoin #CryptoMarkets #MacroAnalysis #Altcoins #CryptoInvesting
Central banks collectively manage trillions in balance sheet assets. When that number expands, risk assets inflate. When it contracts, they deflate. Crypto, as the highest-beta risk asset class, amplifies these moves by 3–5x.
The current macro setup is quietly shifting. The Fed has paused its QT program, the ECB is easing again, and the PBOC has resumed targeted stimulus. Historically, the 6–12 months following a coordinated global liquidity pivot are among the strongest periods for $BTC and $ETH performance.
What makes this cycle different: institutional allocation vehicles now exist at scale. Spot ETFs give traditional investors a direct fiat-to-crypto channel. When macro money looks for risk-on destinations, it no longer has to navigate wallets and seed phrases — it just buys the ETF.
For $BNB , the implication is compounded. Its native fee-burning and staking mechanics turn increased on-chain activity — which tends to follow liquidity inflows — directly into supply compression.
Watch global M2 money supply. Watch central bank balance sheet growth rates. Crypto doesn't move in a vacuum; it moves with global liquidity, just faster and harder.
The macro tide may be turning. Position accordingly.
#Bitcoin #CryptoMarkets #MacroAnalysis #Altcoins #CryptoInvesting
51

·
--
#CMESeptemberHikeOddsFallTo30.6% 📊 Вероятность повышения ставки ФРС в сентябре упала до 30.6%!
Согласно CME FedWatch, трейдеры оценивают шанс повышения на 25 б.п. до 3.75%-4.00% лишь в 30.6%. Это резкое падение с 52.2% неделей ранее. Вероятность сохранения ставки на уровне 3.50%-3.75% выросла до 69.4%.
Goldman Sachs назвал повышение «крайне маловероятным», отметив, что рыночное ценообразование остаётся «слишком ястребиным».
Для крипторынка это позитивный сигнал: пауза ФРС снижает давление на рискованные активы и может поддержать $BTC .
🔥 Как думаешь, ставку поднимут в 2026 или мы увидим смягчение? Пиши в комментариях! 👇
👉 Подпишись на макро-разборы и сигналы!
#FOMC #MacroAnalysis #Trade 👇
{future}(BTCUSDT)
{spot}(BNBUSDT)
{spot}(XRPUSDT)
#CMESeptemberHikeOddsFallTo30.6% 📊 Вероятность повышения ставки ФРС в сентябре упала до 30.6%!
Согласно CME FedWatch, трейдеры оценивают шанс повышения на 25 б.п. до 3.75%-4.00% лишь в 30.6%. Это резкое падение с 52.2% неделей ранее. Вероятность сохранения ставки на уровне 3.50%-3.75% выросла до 69.4%.
Goldman Sachs назвал повышение «крайне маловероятным», отметив, что рыночное ценообразование остаётся «слишком ястребиным».
Для крипторынка это позитивный сигнал: пауза ФРС снижает давление на рискованные активы и может поддержать $BTC .
🔥 Как думаешь, ставку поднимут в 2026 или мы увидим смягчение? Пиши в комментариях! 👇
👉 Подпишись на макро-разборы и сигналы!
#FOMC #MacroAnalysis #Trade 👇
Согласно CME FedWatch, трейдеры оценивают шанс повышения на 25 б.п. до 3.75%-4.00% лишь в 30.6%. Это резкое падение с 52.2% неделей ранее. Вероятность сохранения ставки на уровне 3.50%-3.75% выросла до 69.4%.
Goldman Sachs назвал повышение «крайне маловероятным», отметив, что рыночное ценообразование остаётся «слишком ястребиным».
Для крипторынка это позитивный сигнал: пауза ФРС снижает давление на рискованные активы и может поддержать $BTC .
🔥 Как думаешь, ставку поднимут в 2026 или мы увидим смягчение? Пиши в комментариях! 👇
👉 Подпишись на макро-разборы и сигналы!
#FOMC #MacroAnalysis #Trade 👇
281
🚨 INSTITUTIONAL DESKS SHIFT TO TACTICAL CAUTION AS SEPTEMBER MACRO VOLATILITY APPROACHES $BTC ⚠️
Institutional trading desks are signaling a shift toward tactical caution, preparing for heightened sector-level turbulence over the next few weeks. 🦈 With Fed rate decision catalysts, seasonal September volatility, and corporate credit issuance stacking up, order flow suggests smart money is trimming one-sided exposure. 📊
Rather than bracing for an immediate index-level collapse, market structure points to rotational choppy price action and liquidity hunts within key ranges. 💡 Hedging exposure and focusing on market-neutral setups remains the optimal approach until clear directional positioning resumes across major pairs. 💬 How are you adjusting your portfolio to navigate this upcoming macro volatility window? 👇
⚠️ Not financial advice. Always manage your risk. 🛡️
🏷️ #BTC #MacroAnalysis #MarketStructure #Crypto
🛡️ 👁️
🚨 INSTITUTIONAL DESKS SHIFT TO TACTICAL CAUTION AS SEPTEMBER MACRO VOLATILITY APPROACHES $BTC ⚠️
Institutional trading desks are signaling a shift toward tactical caution, preparing for heightened sector-level turbulence over the next few weeks. 🦈 With Fed rate decision catalysts, seasonal September volatility, and corporate credit issuance stacking up, order flow suggests smart money is trimming one-sided exposure. 📊
Rather than bracing for an immediate index-level collapse, market structure points to rotational choppy price action and liquidity hunts within key ranges. 💡 Hedging exposure and focusing on market-neutral setups remains the optimal approach until clear directional positioning resumes across major pairs. 💬 How are you adjusting your portfolio to navigate this upcoming macro volatility window? 👇
⚠️ Not financial advice. Always manage your risk. 🛡️
🏷️ #BTC #MacroAnalysis #MarketStructure #Crypto
🛡️ 👁️
Institutional trading desks are signaling a shift toward tactical caution, preparing for heightened sector-level turbulence over the next few weeks. 🦈 With Fed rate decision catalysts, seasonal September volatility, and corporate credit issuance stacking up, order flow suggests smart money is trimming one-sided exposure. 📊
Rather than bracing for an immediate index-level collapse, market structure points to rotational choppy price action and liquidity hunts within key ranges. 💡 Hedging exposure and focusing on market-neutral setups remains the optimal approach until clear directional positioning resumes across major pairs. 💬 How are you adjusting your portfolio to navigate this upcoming macro volatility window? 👇
⚠️ Not financial advice. Always manage your risk. 🛡️
🏷️ #BTC #MacroAnalysis #MarketStructure #Crypto
🛡️ 👁️
16
·
--
📊 1. Macro & Market Infrastructure Trends
$BITCOIN oin’s $81,000 Milestone: $BITCOIN successfully established a new all-time high near $81,272, and the community is heavily discussing whether it can sustain its support zones above $77,000–$78,000 or face a sharp correction. [1, 2]
Liquidity Rotation: Following recent insights from Binance founder CZ, a massive discussion is brewing around "hot money" rotating directly back into crypto assets after a prolonged focus on artificial intelligence. [1]
Regulatory Milestones: Speculation surrounding the CLARITY Act 2026 and the implementation of structural frameworks like the EU's fully operational MiCA guidelines are generating heavy debate regarding future compliance and $ALT.US #coin security. [1, 2, 3]
#HousePressesSenateOnCLARITYAct
#MacroAnalysis
📊 1. Macro & Market Infrastructure Trends
$BITCOIN oin’s $81,000 Milestone: $BITCOIN successfully established a new all-time high near $81,272, and the community is heavily discussing whether it can sustain its support zones above $77,000–$78,000 or face a sharp correction. [1, 2]
Liquidity Rotation: Following recent insights from Binance founder CZ, a massive discussion is brewing around "hot money" rotating directly back into crypto assets after a prolonged focus on artificial intelligence. [1]
Regulatory Milestones: Speculation surrounding the CLARITY Act 2026 and the implementation of structural frameworks like the EU's fully operational MiCA guidelines are generating heavy debate regarding future compliance and $ALT.US #coin security. [1, 2, 3]
#HousePressesSenateOnCLARITYAct
#MacroAnalysis
$BITCOIN oin’s $81,000 Milestone: $BITCOIN successfully established a new all-time high near $81,272, and the community is heavily discussing whether it can sustain its support zones above $77,000–$78,000 or face a sharp correction. [1, 2]
Liquidity Rotation: Following recent insights from Binance founder CZ, a massive discussion is brewing around "hot money" rotating directly back into crypto assets after a prolonged focus on artificial intelligence. [1]
Regulatory Milestones: Speculation surrounding the CLARITY Act 2026 and the implementation of structural frameworks like the EU's fully operational MiCA guidelines are generating heavy debate regarding future compliance and $ALT.US #coin security. [1, 2, 3]
#HousePressesSenateOnCLARITYAct
#MacroAnalysis
88

🚨 $DXY RECLAIMS THE 100 PSYCHOLOGICAL LEVEL FOR THE FIRST TIME SINCE AUGUST! 📊
The US Dollar Index has reclaimed the 100 integer handle, completing a clean range sweep and macro retest. 🔍 Institutional flows are reacting as dollar strength re-establishes liquidity pressure across global risk assets and currency pairs.
📊 From a market structure standpoint, holding above this key pivot signals potential consolidation before the next macro leg. Smart capital is watching how crypto market cap absorbs this headwind at lower time-frame order blocks. 💬 Do you expect crypto to decouple here, or will DXY push risk assets into a deeper liquidity hunt? 👇
⚠️ Not financial advice. Always manage your risk. 🛡️
🏷️ #DXY #MacroAnalysis #MarketStructure #Crypto
🎯 📊
🚨 $DXY RECLAIMS THE 100 PSYCHOLOGICAL LEVEL FOR THE FIRST TIME SINCE AUGUST! 📊
The US Dollar Index has reclaimed the 100 integer handle, completing a clean range sweep and macro retest. 🔍 Institutional flows are reacting as dollar strength re-establishes liquidity pressure across global risk assets and currency pairs.
📊 From a market structure standpoint, holding above this key pivot signals potential consolidation before the next macro leg. Smart capital is watching how crypto market cap absorbs this headwind at lower time-frame order blocks. 💬 Do you expect crypto to decouple here, or will DXY push risk assets into a deeper liquidity hunt? 👇
⚠️ Not financial advice. Always manage your risk. 🛡️
🏷️ #DXY #MacroAnalysis #MarketStructure #Crypto
🎯 📊
The US Dollar Index has reclaimed the 100 integer handle, completing a clean range sweep and macro retest. 🔍 Institutional flows are reacting as dollar strength re-establishes liquidity pressure across global risk assets and currency pairs.
📊 From a market structure standpoint, holding above this key pivot signals potential consolidation before the next macro leg. Smart capital is watching how crypto market cap absorbs this headwind at lower time-frame order blocks. 💬 Do you expect crypto to decouple here, or will DXY push risk assets into a deeper liquidity hunt? 👇
⚠️ Not financial advice. Always manage your risk. 🛡️
🏷️ #DXY #MacroAnalysis #MarketStructure #Crypto
🎯 📊
26

HAWKISH MACRO SHIFT TIGHTENS LIQUIDITY AS $BTC PREPARES FOR QUALITY ROTATION! 🚨 📊
Hawkish undertones from central banking figures are signaling tighter financial conditions ahead, pushing long-term yield momentum into check. 📊 When macro liquidity constricts, risk assets fracture — small-cap tokens lose their bid while blue-chip capital clusters inside $BTC .
Order book data already shows smart money front-running this flight to quality, absorbing dips on high-cap assets while trimming exposure on low-cap beta. 🌊 Expect capital to rotate heavily into market leaders as smaller cap valuations get squeezed under tighter borrowing conditions.
🤔 Are you rebalancing into blue-chip stability or riding high-beta altcoins through the macro tightening phase? 👇
⚠️ Not financial advice. Always manage your risk. 🛡️
🏷️ #BTC #MacroAnalysis #MarketRotation #Crypto
🎯 🦈
HAWKISH MACRO SHIFT TIGHTENS LIQUIDITY AS $BTC PREPARES FOR QUALITY ROTATION! 🚨 📊
Hawkish undertones from central banking figures are signaling tighter financial conditions ahead, pushing long-term yield momentum into check. 📊 When macro liquidity constricts, risk assets fracture — small-cap tokens lose their bid while blue-chip capital clusters inside $BTC .
Order book data already shows smart money front-running this flight to quality, absorbing dips on high-cap assets while trimming exposure on low-cap beta. 🌊 Expect capital to rotate heavily into market leaders as smaller cap valuations get squeezed under tighter borrowing conditions.
🤔 Are you rebalancing into blue-chip stability or riding high-beta altcoins through the macro tightening phase? 👇
⚠️ Not financial advice. Always manage your risk. 🛡️
🏷️ #BTC #MacroAnalysis #MarketRotation #Crypto
🎯 🦈
Hawkish undertones from central banking figures are signaling tighter financial conditions ahead, pushing long-term yield momentum into check. 📊 When macro liquidity constricts, risk assets fracture — small-cap tokens lose their bid while blue-chip capital clusters inside $BTC .
Order book data already shows smart money front-running this flight to quality, absorbing dips on high-cap assets while trimming exposure on low-cap beta. 🌊 Expect capital to rotate heavily into market leaders as smaller cap valuations get squeezed under tighter borrowing conditions.
🤔 Are you rebalancing into blue-chip stability or riding high-beta altcoins through the macro tightening phase? 👇
⚠️ Not financial advice. Always manage your risk. 🛡️
🏷️ #BTC #MacroAnalysis #MarketRotation #Crypto
🎯 🦈
52
Log in to explore more content
Join global crypto users on Binance Square
⚡️ Get latest and useful information about crypto.
💬 Trusted by the world’s largest crypto exchange.
👍 Discover real insights from verified creators.
Email / Phone number
Trending Topics
1
#IsAnthropic’s$1.5TMarketCapJustified?
33,102 views
178 Discussing
2
#BTCBelow$62KAmidHikeFearsAndShiftToAnthropic
1,244 views
26 Discussing
3
#NvidiaBoardReportedlySplitOverHuang’sReturn
164,464 views
1,376 Discussing
4
#CanGTA6'sLaunchLiftTTWOShares?
129,758 views
1,001 Discussing
5
#LedgerProbesTamperedWalletsInBerlinAndDubai
3,317 views
66 Discussing
6
#13FInstitutionsBitcoinSpotETPHoldingsHitRecord
11,280 views
133 Discussing
7
#BTCRemainsUnderPressureAfterHawkishFOMCMinutes
326,415 views
2,329 Discussing
8
#StrategySTRCPreferredSlips3.65%Below$100Par
11,364 views
94 Discussing
9
#MASToUpgradeSGDTestnetToSGDigitalLedger
37,861 views
378 Discussing
10
#Solana2027RoadmapTargetsDoubleComputeCapacity
20,800 views
208 Discussing