
#mub
mub
66,318 views
1,706 Discussing
Hot
Latest


$MUB: Why a Coin Can Fall While Buyers Outnumber Sellers in Count
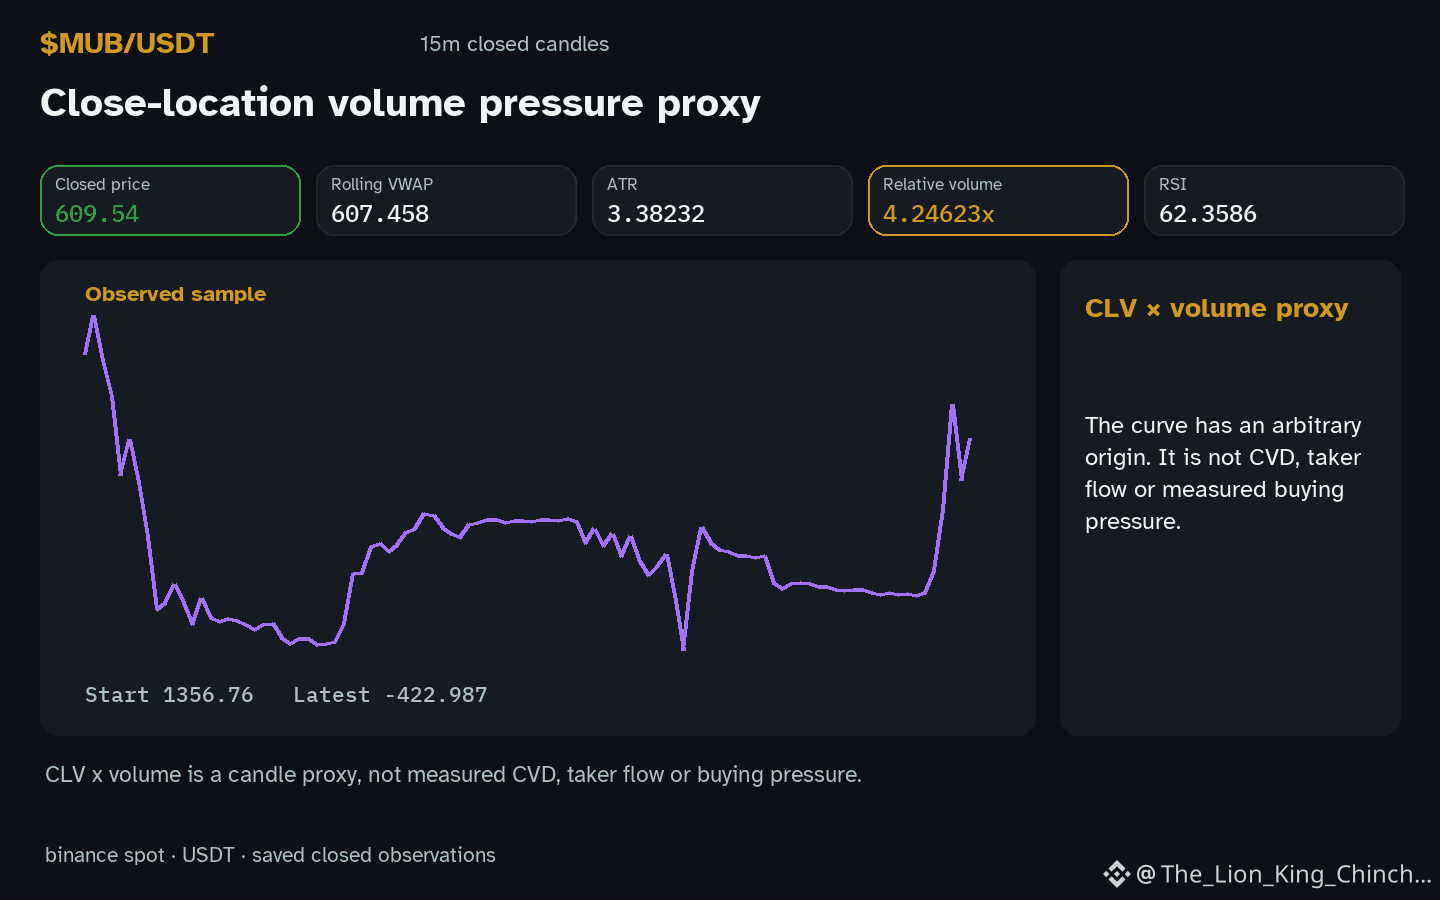
Why does $MUB often rise even when the number of buying participants seems to exceed sellers? A common assumption is that more buyers automatically push price up, while more sellers force a decline.\n\nThe counterexample to consider is the observation that $MUB is currently moving hourly up while volume is above baseline and the price sits inside its recorded range. High volume does not guarantee that large orders dominate; instead, many small orders can create the same volume figure. If most participants trade small sizes, the aggregate order‑size asymmetry may be minimal, allowing price to drift upward despite a numerical buyer majority.\n\nWhat could change the reading? A future closed‑candle where relative volume 4.25x baseline drops sharply while the hourly change 0.673868% remains modest would suggest that order‑size concentration, not participant count, is driving moves. Conversely, if a candle shows a large price swing with low relative volume, the hypothesis that many tiny trades sustain direction would be weakened.\n\nIn practice, reassessing the mechanism means comparing the size distribution of trades against the simple count of participants, and watching for candles where the volume‑price relationship diverges from the current pattern.
Probabilistic market research, not a recommendation or guaranteed return.
Watchlist contrast: $ETH has hourly direction up and volume not above its baseline; $SOXSB has hourly direction down and volume above its baseline. This alone does not establish correlation.
#MUB
$MUB : Why a Coin Can Fall While Buyers Outnumber Sellers in Count
Why does $MUB often rise even when the number of buying participants seems to exceed sellers? A common assumption is that more buyers automatically push price up, while more sellers force a decline.\n\nThe counterexample to consider is the observation that $MUB is currently moving hourly up while volume is above baseline and the price sits inside its recorded range. High volume does not guarantee that large orders dominate; instead, many small orders can create the same volume figure. If most participants trade small sizes, the aggregate order‑size asymmetry may be minimal, allowing price to drift upward despite a numerical buyer majority.\n\nWhat could change the reading? A future closed‑candle where relative volume 4.25x baseline drops sharply while the hourly change 0.673868% remains modest would suggest that order‑size concentration, not participant count, is driving moves. Conversely, if a candle shows a large price swing with low relative volume, the hypothesis that many tiny trades sustain direction would be weakened.\n\nIn practice, reassessing the mechanism means comparing the size distribution of trades against the simple count of participants, and watching for candles where the volume‑price relationship diverges from the current pattern.
Probabilistic market research, not a recommendation or guaranteed return.
Watchlist contrast: $ETH has hourly direction up and volume not above its baseline; $SOXSB has hourly direction down and volume above its baseline. This alone does not establish correlation.
#MUB
Why does $MUB often rise even when the number of buying participants seems to exceed sellers? A common assumption is that more buyers automatically push price up, while more sellers force a decline.\n\nThe counterexample to consider is the observation that $MUB is currently moving hourly up while volume is above baseline and the price sits inside its recorded range. High volume does not guarantee that large orders dominate; instead, many small orders can create the same volume figure. If most participants trade small sizes, the aggregate order‑size asymmetry may be minimal, allowing price to drift upward despite a numerical buyer majority.\n\nWhat could change the reading? A future closed‑candle where relative volume 4.25x baseline drops sharply while the hourly change 0.673868% remains modest would suggest that order‑size concentration, not participant count, is driving moves. Conversely, if a candle shows a large price swing with low relative volume, the hypothesis that many tiny trades sustain direction would be weakened.\n\nIn practice, reassessing the mechanism means comparing the size distribution of trades against the simple count of participants, and watching for candles where the volume‑price relationship diverges from the current pattern.
Probabilistic market research, not a recommendation or guaranteed return.
Watchlist contrast: $ETH has hourly direction up and volume not above its baseline; $SOXSB has hourly direction down and volume above its baseline. This alone does not establish correlation.
#MUB
34

·
--
$MUB Price Breaks Below Recent Four Hour Lows
$MUB trades at 593.97 USD, down 14.6% over the past 24 hours, with 4H RSI at 24.5 (oversold).
Price continued downward over the past day, falling below the lowest level of recent four-hour candles. With the four-hour relative strength index now in oversold territory, market participants are monitoring for signs of stabilization.
KEY LEVELS
▪️ Resistance: 760.28 USD (20-candle 4H swing high)
▪️ Support: 597.12 USD (20-candle 4H swing low)
▪️ EMA 20 / EMA 50: 681.57 / 716.26 USD (short-term trend filter)
WHAT WOULD CONFIRM WEAKNESS
▪️ 4H closes staying below 597.12 USD, turning it into resistance
▪️ Rallies failing near EMA 20 (681.57 USD)
WHAT WOULD INVALIDATE IT
▪️ A 4H close back above 597.12 USD (range reclaimed)
▪️ Price recovering EMA 20 (681.57 USD)
Do you expect a bounce from these oversold levels, or will downward momentum continue?
Not financial advice. Always DYOR.
Like & Follow for Daily Trade Analytics & Insider News. @MistralAK
#MUB #HotTrends #TrendingTopic
{spot}(MUBUSDT)
$MUB Price Breaks Below Recent Four Hour Lows
$MUB trades at 593.97 USD, down 14.6% over the past 24 hours, with 4H RSI at 24.5 (oversold).
Price continued downward over the past day, falling below the lowest level of recent four-hour candles. With the four-hour relative strength index now in oversold territory, market participants are monitoring for signs of stabilization.
KEY LEVELS
▪️ Resistance: 760.28 USD (20-candle 4H swing high)
▪️ Support: 597.12 USD (20-candle 4H swing low)
▪️ EMA 20 / EMA 50: 681.57 / 716.26 USD (short-term trend filter)
WHAT WOULD CONFIRM WEAKNESS
▪️ 4H closes staying below 597.12 USD, turning it into resistance
▪️ Rallies failing near EMA 20 (681.57 USD)
WHAT WOULD INVALIDATE IT
▪️ A 4H close back above 597.12 USD (range reclaimed)
▪️ Price recovering EMA 20 (681.57 USD)
Do you expect a bounce from these oversold levels, or will downward momentum continue?
Not financial advice. Always DYOR.
Like & Follow for Daily Trade Analytics & Insider News. @MistralAK
#MUB #HotTrends #TrendingTopic
$MUB trades at 593.97 USD, down 14.6% over the past 24 hours, with 4H RSI at 24.5 (oversold).
Price continued downward over the past day, falling below the lowest level of recent four-hour candles. With the four-hour relative strength index now in oversold territory, market participants are monitoring for signs of stabilization.
KEY LEVELS
▪️ Resistance: 760.28 USD (20-candle 4H swing high)
▪️ Support: 597.12 USD (20-candle 4H swing low)
▪️ EMA 20 / EMA 50: 681.57 / 716.26 USD (short-term trend filter)
WHAT WOULD CONFIRM WEAKNESS
▪️ 4H closes staying below 597.12 USD, turning it into resistance
▪️ Rallies failing near EMA 20 (681.57 USD)
WHAT WOULD INVALIDATE IT
▪️ A 4H close back above 597.12 USD (range reclaimed)
▪️ Price recovering EMA 20 (681.57 USD)
Do you expect a bounce from these oversold levels, or will downward momentum continue?
Not financial advice. Always DYOR.
Like & Follow for Daily Trade Analytics & Insider News. @MistralAK
#MUB #HotTrends #TrendingTopic

6

📊 TECHNICAL ANALYSIS: $MUB (MUBUSDT) — 🔴 SHORT
💰 Current Price: 632.270 USDT (24h: -14.12% | 24h Vol: 26.94M USDT)
📈 24h Range: Low 632.110 — High 738.400 | 1H Structure (EMA7: 656.880 • RSI: 29)
🎯 Entry Zone: 632.270 - 634.799
✅ Take Profit 1 (TP1): 600.656
✅ Take Profit 2 (TP2): 575.366
🛑 Stop Loss (SL): 643.651
📝 Technical Thesis: On the 1H timeframe, $MUB is facing distribution pressure around 632.270 USDT (-14.12% 24h, Vol 26.94M USDT). Momentum remains capped below the 680.500 resistance (RSI 29), favoring a disciplined short setup on relief bounces.
⚠️ Khuyến cáo: Thông tin và các mốc Entry / TP / SL trên chỉ mang tính chất tham khảo dựa trên dữ liệu thị trường và góc nhìn phân tích kỹ thuật cá nhân, hoàn toàn không phải lời khuyên đầu tư tài chính. Vui lòng tự nghiên cứu (DYOR) và quản lý rủi ro chặt chẽ trước khi giao dịch.
#MUB #BinanceSquare #CryptoAnalysis
📊 TECHNICAL ANALYSIS: $MUB (MUBUSDT) — 🔴 SHORT
💰 Current Price: 632.270 USDT (24h: -14.12% | 24h Vol: 26.94M USDT)
📈 24h Range: Low 632.110 — High 738.400 | 1H Structure (EMA7: 656.880 • RSI: 29)
🎯 Entry Zone: 632.270 - 634.799
✅ Take Profit 1 (TP1): 600.656
✅ Take Profit 2 (TP2): 575.366
🛑 Stop Loss (SL): 643.651
📝 Technical Thesis: On the 1H timeframe, $MUB is facing distribution pressure around 632.270 USDT (-14.12% 24h, Vol 26.94M USDT). Momentum remains capped below the 680.500 resistance (RSI 29), favoring a disciplined short setup on relief bounces.
⚠️ Khuyến cáo: Thông tin và các mốc Entry / TP / SL trên chỉ mang tính chất tham khảo dựa trên dữ liệu thị trường và góc nhìn phân tích kỹ thuật cá nhân, hoàn toàn không phải lời khuyên đầu tư tài chính. Vui lòng tự nghiên cứu (DYOR) và quản lý rủi ro chặt chẽ trước khi giao dịch.
#MUB #BinanceSquare #CryptoAnalysis
💰 Current Price: 632.270 USDT (24h: -14.12% | 24h Vol: 26.94M USDT)
📈 24h Range: Low 632.110 — High 738.400 | 1H Structure (EMA7: 656.880 • RSI: 29)
🎯 Entry Zone: 632.270 - 634.799
✅ Take Profit 1 (TP1): 600.656
✅ Take Profit 2 (TP2): 575.366
🛑 Stop Loss (SL): 643.651
📝 Technical Thesis: On the 1H timeframe, $MUB is facing distribution pressure around 632.270 USDT (-14.12% 24h, Vol 26.94M USDT). Momentum remains capped below the 680.500 resistance (RSI 29), favoring a disciplined short setup on relief bounces.
⚠️ Khuyến cáo: Thông tin và các mốc Entry / TP / SL trên chỉ mang tính chất tham khảo dựa trên dữ liệu thị trường và góc nhìn phân tích kỹ thuật cá nhân, hoàn toàn không phải lời khuyên đầu tư tài chính. Vui lòng tự nghiên cứu (DYOR) và quản lý rủi ro chặt chẽ trước khi giao dịch.
#MUB #BinanceSquare #CryptoAnalysis
4

·
--
Can buyers stabilize $MUB after a steep -13.58% slide?
1. Current state: Price has pulled back to $639.51 on $26.87M in 24-hour volume.
2. Bullish trigger: A conditional reclaim above 651.48 would suggest early stabilization.
3. Invalidation signal: Acceptance below 651.48 keeps the downtrend active and invalidates any recovery setup.
Are you watching for a confirmed reclaim above 651.48, or does continued rejection point to further downside?
Tap $MUB for the live chart. #MUB #BinanceSquare
Can buyers stabilize $MUB after a steep -13.58% slide?
1. Current state: Price has pulled back to $639.51 on $26.87M in 24-hour volume.
2. Bullish trigger: A conditional reclaim above 651.48 would suggest early stabilization.
3. Invalidation signal: Acceptance below 651.48 keeps the downtrend active and invalidates any recovery setup.
Are you watching for a confirmed reclaim above 651.48, or does continued rejection point to further downside?
Tap $MUB for the live chart. #MUB #BinanceSquare
1. Current state: Price has pulled back to $639.51 on $26.87M in 24-hour volume.
2. Bullish trigger: A conditional reclaim above 651.48 would suggest early stabilization.
3. Invalidation signal: Acceptance below 651.48 keeps the downtrend active and invalidates any recovery setup.
Are you watching for a confirmed reclaim above 651.48, or does continued rejection point to further downside?
Tap $MUB for the live chart. #MUB #BinanceSquare
4



·
--
风中浪客:
0.54%……这也叫拉啊 $MUB 回踩再看量能吧
1
30

·
--
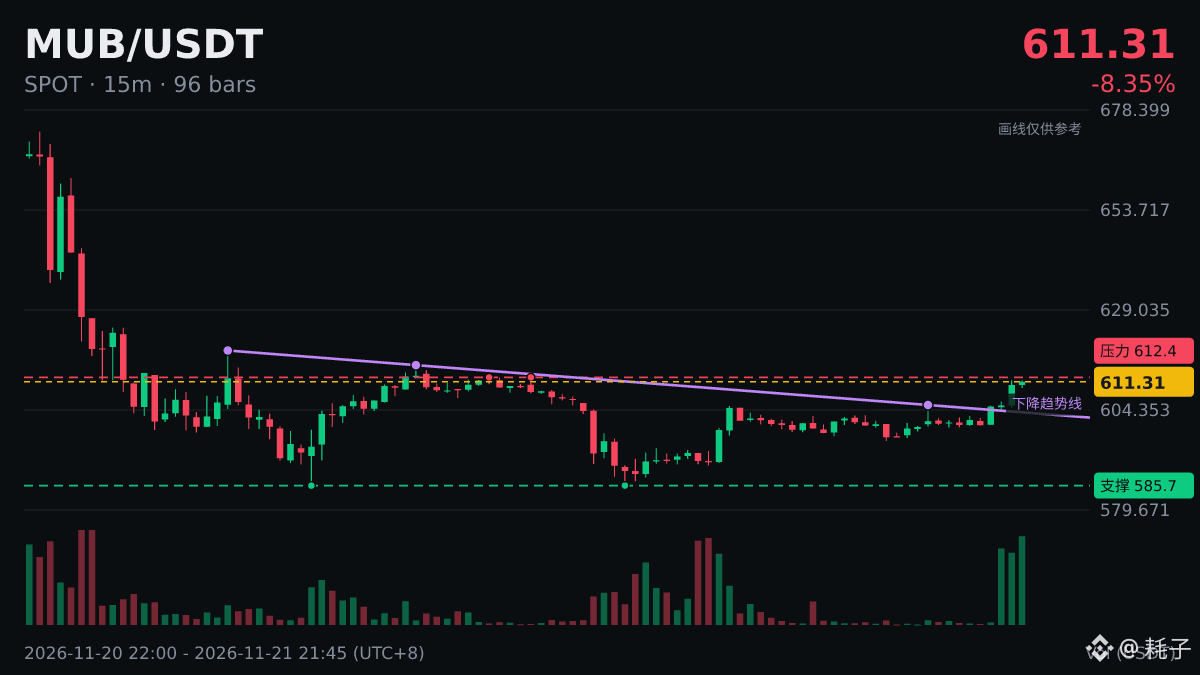
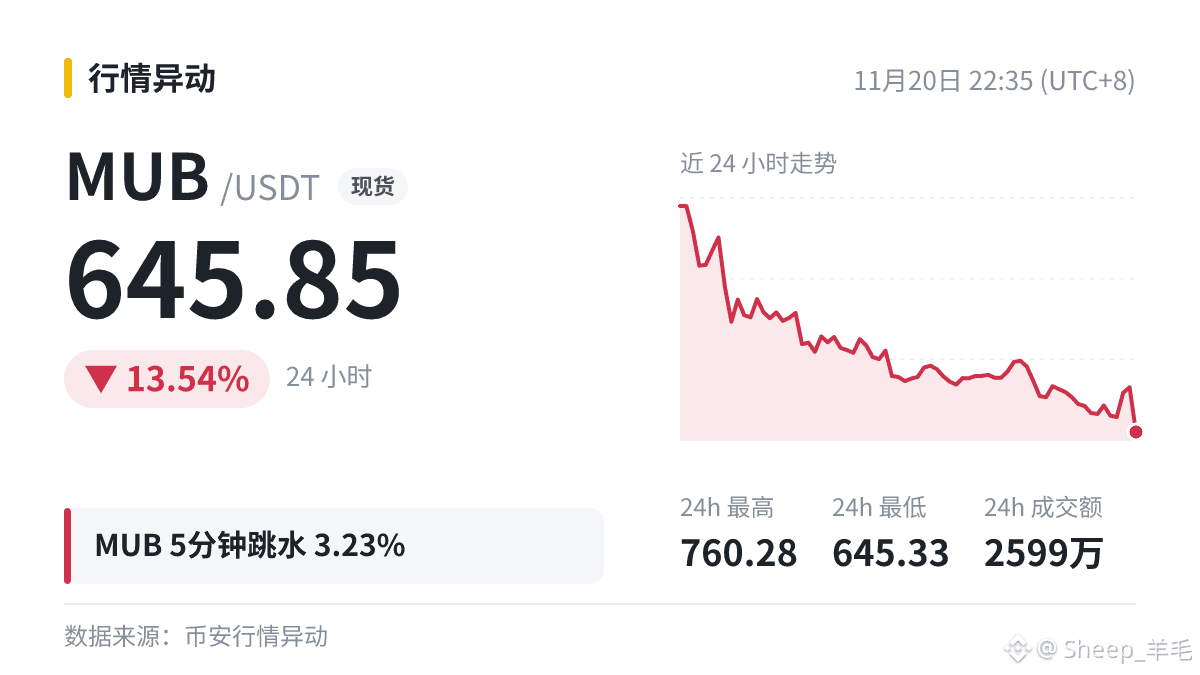
$MUB 今天领跌,24h -8.69%,成交额 $34.7M。
$MUB 现报 610.54(24h -8.69%),24h 区间 584.96–673.11。价格在区间中部,方向还没选出来。上面看 673.11 能否突破,下面看 584.96 的支撑,没走出区间前高抛低吸比追单更合适。
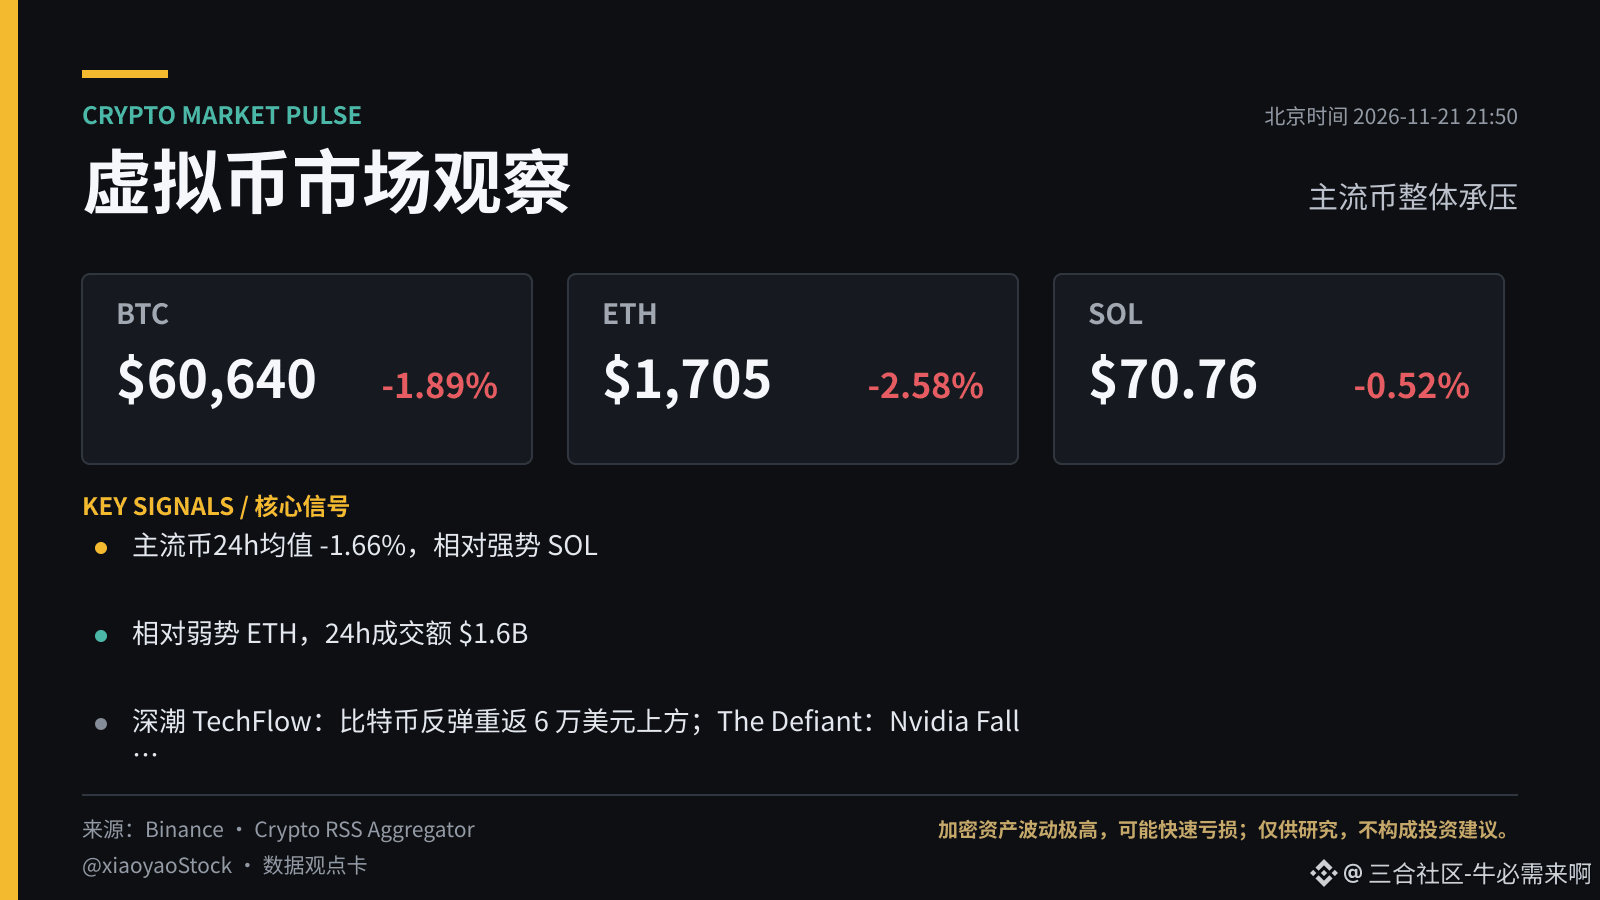
大背景是 $BTC 偏弱(-1.89%),逆势拉升的币更容易冲高回落。同榜第二大波动是 $SOXLB(-21.09%),可以一起对照。
数据:Binance 现货 24h 行情。
以上只是盘面记录,不是买卖建议,注意风险。
#MUB #行情观察
$MUB 今天领跌,24h -8.69%,成交额 $34.7M。
$MUB 现报 610.54(24h -8.69%),24h 区间 584.96–673.11。价格在区间中部,方向还没选出来。上面看 673.11 能否突破,下面看 584.96 的支撑,没走出区间前高抛低吸比追单更合适。
大背景是 $BTC 偏弱(-1.89%),逆势拉升的币更容易冲高回落。同榜第二大波动是 $SOXLB (-21.09%),可以一起对照。
数据:Binance 现货 24h 行情。
以上只是盘面记录,不是买卖建议,注意风险。
#MUB #行情观察
$MUB 现报 610.54(24h -8.69%),24h 区间 584.96–673.11。价格在区间中部,方向还没选出来。上面看 673.11 能否突破,下面看 584.96 的支撑,没走出区间前高抛低吸比追单更合适。
大背景是 $BTC 偏弱(-1.89%),逆势拉升的币更容易冲高回落。同榜第二大波动是 $SOXLB (-21.09%),可以一起对照。
数据:Binance 现货 24h 行情。
以上只是盘面记录,不是买卖建议,注意风险。
#MUB #行情观察
437

·
--
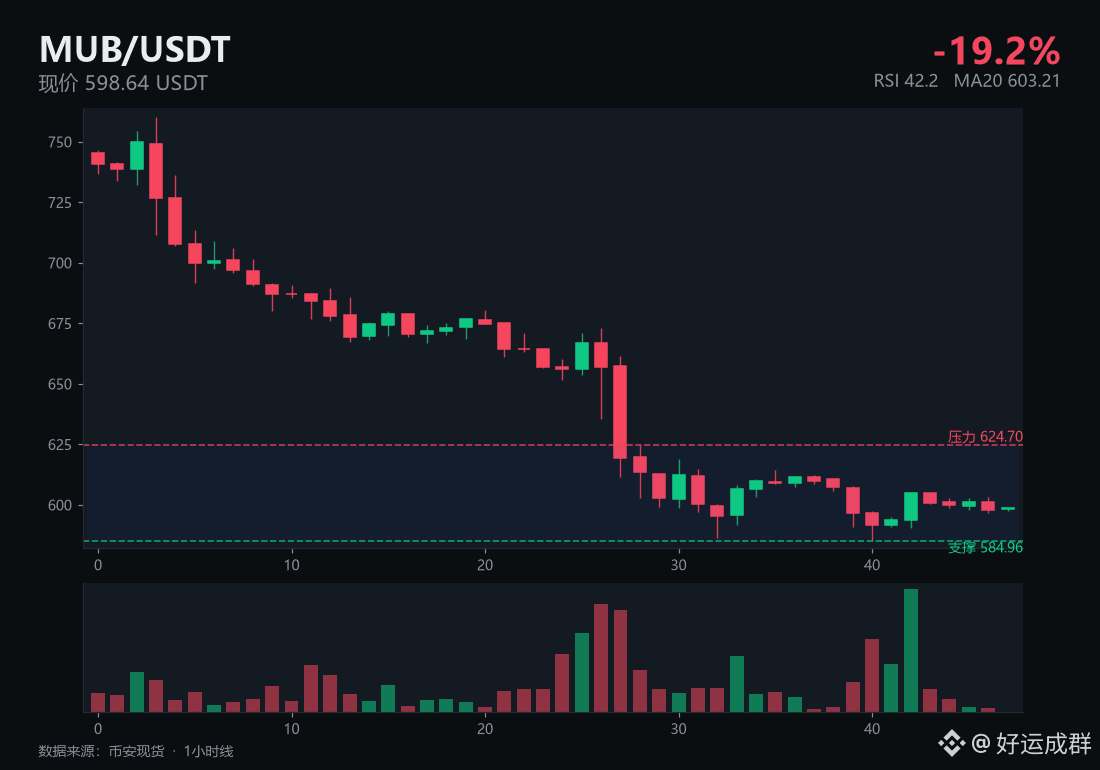
$MUB 今天-19.2%,连大饼的腿都跟不上。$BTC 今天-5.8%。
这种位置最容易犯的错,是把反弹当反转。
现价 598.64,压力 624.7,支撑 584.96,RSI 42.2。
要做就等它站住 624.7 再说,站不住就先看着,钱在手上不会咬人。
你怎么看?
盘面说什么都比嘴硬管用。
#币圈 #MUB
$MUB 今天-19.2%,连大饼的腿都跟不上。$BTC 今天-5.8%。
这种位置最容易犯的错,是把反弹当反转。
现价 598.64,压力 624.7,支撑 584.96,RSI 42.2。
要做就等它站住 624.7 再说,站不住就先看着,钱在手上不会咬人。
你怎么看?
盘面说什么都比嘴硬管用。
#币圈 #MUB
这种位置最容易犯的错,是把反弹当反转。
现价 598.64,压力 624.7,支撑 584.96,RSI 42.2。
要做就等它站住 624.7 再说,站不住就先看着,钱在手上不会咬人。
你怎么看?
盘面说什么都比嘴硬管用。
#币圈 #MUB
35

·
--
$MUB 的这次行情,可以顺手聊聊“买一和卖一之间的差价”。
盘口中的最高买价和最低卖价通常不同,两者之差叫买卖价差。最新成交价只记录最近一笔交易,并不保证此刻可以按同样的价格完成另一笔交易。报价还会随订单新增、取消和成交变化。理解这三个价格的区别,才能读懂页面上看似不同的数字。
对照的真实数据是:币安现货 11/21 12:30–13:30(北京时间),这一小时上涨 0.45%,成交额 296.1 万 USDT,为前一小时的 1.6 倍。区间收盘价 591.96 USDT。
核对报价时,把最新成交价、买一价和卖一价分开看,再确认页面展示的是哪一种。
#MUB #币圈唠嗑
$MUB 的这次行情,可以顺手聊聊“买一和卖一之间的差价”。
盘口中的最高买价和最低卖价通常不同,两者之差叫买卖价差。最新成交价只记录最近一笔交易,并不保证此刻可以按同样的价格完成另一笔交易。报价还会随订单新增、取消和成交变化。理解这三个价格的区别,才能读懂页面上看似不同的数字。
对照的真实数据是:币安现货 11/21 12:30–13:30(北京时间),这一小时上涨 0.45%,成交额 296.1 万 USDT,为前一小时的 1.6 倍。区间收盘价 591.96 USDT。
核对报价时,把最新成交价、买一价和卖一价分开看,再确认页面展示的是哪一种。
#MUB #币圈唠嗑
盘口中的最高买价和最低卖价通常不同,两者之差叫买卖价差。最新成交价只记录最近一笔交易,并不保证此刻可以按同样的价格完成另一笔交易。报价还会随订单新增、取消和成交变化。理解这三个价格的区别,才能读懂页面上看似不同的数字。
对照的真实数据是:币安现货 11/21 12:30–13:30(北京时间),这一小时上涨 0.45%,成交额 296.1 万 USDT,为前一小时的 1.6 倍。区间收盘价 591.96 USDT。
核对报价时,把最新成交价、买一价和卖一价分开看,再确认页面展示的是哪一种。
#MUB #币圈唠嗑
33

·
--
我是不敢在这个位置乱动的,理由很简单。$MUB 一天跌了 9.33%,报 610.19,离 24 小时低点 586.37 只剩一步,成交额 29.7M 美元,卖盘还没收手的意思。
手里还拿着的人,这会儿大概都在算同一笔账:586.37 这条线到底守不守得住。从 680.50 一路滑下来,跌得又急又密,守住了也只是先喘口气。
方向是观察做空,参考区间 633.43 附近,失效位是站回 24 小时高点 680.50 上方,目标位先看 562.83(按 1.5 的盈亏比从 633.43 起算),风险等级高。我自己是不会在这个位置追着往下打的,要动手也得等它弹回 633.43 附近;要是它连 586.37 都守不住直接破下去,我立马改主意。
$MUB 弹回 633.43 附近,你们会动手,还是觉得这波还没跌完?
仅供参考,非投资建议,注意仓位管理。
$MUB
#MUB #交易机会
我是不敢在这个位置乱动的,理由很简单。$MUB 一天跌了 9.33%,报 610.19,离 24 小时低点 586.37 只剩一步,成交额 29.7M 美元,卖盘还没收手的意思。
手里还拿着的人,这会儿大概都在算同一笔账:586.37 这条线到底守不守得住。从 680.50 一路滑下来,跌得又急又密,守住了也只是先喘口气。
方向是观察做空,参考区间 633.43 附近,失效位是站回 24 小时高点 680.50 上方,目标位先看 562.83(按 1.5 的盈亏比从 633.43 起算),风险等级高。我自己是不会在这个位置追着往下打的,要动手也得等它弹回 633.43 附近;要是它连 586.37 都守不住直接破下去,我立马改主意。
$MUB 弹回 633.43 附近,你们会动手,还是觉得这波还没跌完?
仅供参考,非投资建议,注意仓位管理。
$MUB
#MUB #交易机会
手里还拿着的人,这会儿大概都在算同一笔账:586.37 这条线到底守不守得住。从 680.50 一路滑下来,跌得又急又密,守住了也只是先喘口气。
方向是观察做空,参考区间 633.43 附近,失效位是站回 24 小时高点 680.50 上方,目标位先看 562.83(按 1.5 的盈亏比从 633.43 起算),风险等级高。我自己是不会在这个位置追着往下打的,要动手也得等它弹回 633.43 附近;要是它连 586.37 都守不住直接破下去,我立马改主意。
$MUB 弹回 633.43 附近,你们会动手,还是觉得这波还没跌完?
仅供参考,非投资建议,注意仓位管理。
$MUB
#MUB #交易机会
2

·
--
🔍 $MUB 跌幅拆解
5分钟:+0.00%
1h:+0.00%
4h:+0.16%
24h:-8.81%
现价 610.1,24h 成交额 $2971万
单日重挫 -8.81%,下杀没有集中在某个短周期,更像全天缓慢走弱。
你觉得这是情绪出逃还是趋势走坏? 👇
(数据拆解,非投资建议,DYOR)
#MUB
🔍 $MUB 跌幅拆解
5分钟:+0.00%
1h:+0.00%
4h:+0.16%
24h:-8.81%
现价 610.1,24h 成交额 $2971万
单日重挫 -8.81%,下杀没有集中在某个短周期,更像全天缓慢走弱。
你觉得这是情绪出逃还是趋势走坏? 👇
(数据拆解,非投资建议,DYOR)
#MUB
5分钟:+0.00%
1h:+0.00%
4h:+0.16%
24h:-8.81%
现价 610.1,24h 成交额 $2971万
单日重挫 -8.81%,下杀没有集中在某个短周期,更像全天缓慢走弱。
你觉得这是情绪出逃还是趋势走坏? 👇
(数据拆解,非投资建议,DYOR)
#MUB
·
--
凌晨四点多爬起来看盘,$MUB 一天跌了 14.88%,报 591.97,离 24 小时低点 590.90 只剩一步,昨天它还在 701.66。
这种跌法最折腾人的地方是位置:价格几乎贴在全天最低点上,拿着的人这会儿大概率在纠结,割了怕割在地板上,不割又怕醒来更低。成交额 31.0M 美元,卖盘还在出,没看到有人急着来接。
我偏向先不动手,等它在 590.90 上下给个说法;跌破了就是新低,没什么好说的,站住了再聊接不接。
590.90 这条线守不住的话,你们觉得下面还有多少空间?
$MUB
#MUB #行情分析
凌晨四点多爬起来看盘,$MUB 一天跌了 14.88%,报 591.97,离 24 小时低点 590.90 只剩一步,昨天它还在 701.66。
这种跌法最折腾人的地方是位置:价格几乎贴在全天最低点上,拿着的人这会儿大概率在纠结,割了怕割在地板上,不割又怕醒来更低。成交额 31.0M 美元,卖盘还在出,没看到有人急着来接。
我偏向先不动手,等它在 590.90 上下给个说法;跌破了就是新低,没什么好说的,站住了再聊接不接。
590.90 这条线守不住的话,你们觉得下面还有多少空间?
$MUB
#MUB #行情分析
这种跌法最折腾人的地方是位置:价格几乎贴在全天最低点上,拿着的人这会儿大概率在纠结,割了怕割在地板上,不割又怕醒来更低。成交额 31.0M 美元,卖盘还在出,没看到有人急着来接。
我偏向先不动手,等它在 590.90 上下给个说法;跌破了就是新低,没什么好说的,站住了再聊接不接。
590.90 这条线守不住的话,你们觉得下面还有多少空间?
$MUB
#MUB #行情分析
8

·
--
Fast read — $MUB's last completed 1h candle moved -0.9% on 2.2x baseline volume.
But here's the qualifier: The 20-hour baseline uses the prior 20 completed hourly candles.
One busy candle alone does not establish follow-through.
#MUB #AltcoinFlow #VolumeWatch
Fast read — $MUB 's last completed 1h candle moved -0.9% on 2.2x baseline volume.
But here's the qualifier: The 20-hour baseline uses the prior 20 completed hourly candles.
One busy candle alone does not establish follow-through.
#MUB #AltcoinFlow #VolumeWatch
But here's the qualifier: The 20-hour baseline uses the prior 20 completed hourly candles.
One busy candle alone does not establish follow-through.
#MUB #AltcoinFlow #VolumeWatch
244
·
--
凌晨三点多又醒了,顺手瞄了一眼 $MUB:一天跌了 13.48%,报 603.45,离 24 小时低点 598.83 就剩一口气,成交额 30.7M 美元,卖盘还没收手的意思。
这个位置拿着的人,估计正盯着 598.83 发呆:守住了,今晚还能喘口气;守不住,下面就没什么缓冲了,一脚踩空就是新低。从 706.00 一路滑下来,跌得又急又密,短线是有点跌过头了,但跌过头不等于跌完了。
我自己的打算是先不动,现价这个位置追空,往下能看的空间还没往上弹的空间大,不划算。等它弹回 24 小时中点 652.41 附近再看。方向是观察做空,参考区间 652.41 附近,失效位是站回 24 小时高点 706.00 上方,目标位先看 572.03(按 1.5 的盈亏比从 652.41 起算),风险等级高;要是它直接跌破 598.83 接着往下,我立马改主意。
这个盈亏比,换作是你会试吗,还是宁愿错过?
仅供参考,非投资建议,注意仓位管理。
$MUB
#MUB #交易机会
凌晨三点多又醒了,顺手瞄了一眼 $MUB :一天跌了 13.48%,报 603.45,离 24 小时低点 598.83 就剩一口气,成交额 30.7M 美元,卖盘还没收手的意思。
这个位置拿着的人,估计正盯着 598.83 发呆:守住了,今晚还能喘口气;守不住,下面就没什么缓冲了,一脚踩空就是新低。从 706.00 一路滑下来,跌得又急又密,短线是有点跌过头了,但跌过头不等于跌完了。
我自己的打算是先不动,现价这个位置追空,往下能看的空间还没往上弹的空间大,不划算。等它弹回 24 小时中点 652.41 附近再看。方向是观察做空,参考区间 652.41 附近,失效位是站回 24 小时高点 706.00 上方,目标位先看 572.03(按 1.5 的盈亏比从 652.41 起算),风险等级高;要是它直接跌破 598.83 接着往下,我立马改主意。
这个盈亏比,换作是你会试吗,还是宁愿错过?
仅供参考,非投资建议,注意仓位管理。
$MUB
#MUB #交易机会
这个位置拿着的人,估计正盯着 598.83 发呆:守住了,今晚还能喘口气;守不住,下面就没什么缓冲了,一脚踩空就是新低。从 706.00 一路滑下来,跌得又急又密,短线是有点跌过头了,但跌过头不等于跌完了。
我自己的打算是先不动,现价这个位置追空,往下能看的空间还没往上弹的空间大,不划算。等它弹回 24 小时中点 652.41 附近再看。方向是观察做空,参考区间 652.41 附近,失效位是站回 24 小时高点 706.00 上方,目标位先看 572.03(按 1.5 的盈亏比从 652.41 起算),风险等级高;要是它直接跌破 598.83 接着往下,我立马改主意。
这个盈亏比,换作是你会试吗,还是宁愿错过?
仅供参考,非投资建议,注意仓位管理。
$MUB
#MUB #交易机会
10
·
--
🔍 $MUB 跌幅拆解
5分钟:-0.10%
1h:-3.99%
4h:-3.96%
24h:-14.45%
现价 631.2,24h 成交额 $2786万
跌幅主要集中在1h,是突发下杀。
你觉得这是情绪出逃还是趋势走坏? 👇
(数据拆解,非投资建议,DYOR)
#MUB
🔍 $MUB 跌幅拆解
5分钟:-0.10%
1h:-3.99%
4h:-3.96%
24h:-14.45%
现价 631.2,24h 成交额 $2786万
跌幅主要集中在1h,是突发下杀。
你觉得这是情绪出逃还是趋势走坏? 👇
(数据拆解,非投资建议,DYOR)
#MUB
5分钟:-0.10%
1h:-3.99%
4h:-3.96%
24h:-14.45%
现价 631.2,24h 成交额 $2786万
跌幅主要集中在1h,是突发下杀。
你觉得这是情绪出逃还是趋势走坏? 👇
(数据拆解,非投资建议,DYOR)
#MUB
5


·
--
Is $MUB coiling for expansion or flashing late-entry risk?
1. Flat daily action signals tight compression, meaning entries before volume confirmation risk severe chop.
2. Bullish scenario: A clean move above the 760.28 range high confirms buyers are driving momentum.
3. Invalidation scenario: Slipping below the 691.75 range low cancels the breakout setup and favors downside.
Will buyers clear 760.28 to confirm strength, or will a drop below 691.75 trigger invalidation?
Tap $MUB for the live chart. #MUB #BinanceSquare
Is $MUB coiling for expansion or flashing late-entry risk?
1. Flat daily action signals tight compression, meaning entries before volume confirmation risk severe chop.
2. Bullish scenario: A clean move above the 760.28 range high confirms buyers are driving momentum.
3. Invalidation scenario: Slipping below the 691.75 range low cancels the breakout setup and favors downside.
Will buyers clear 760.28 to confirm strength, or will a drop below 691.75 trigger invalidation?
Tap $MUB for the live chart. #MUB #BinanceSquare
1. Flat daily action signals tight compression, meaning entries before volume confirmation risk severe chop.
2. Bullish scenario: A clean move above the 760.28 range high confirms buyers are driving momentum.
3. Invalidation scenario: Slipping below the 691.75 range low cancels the breakout setup and favors downside.
Will buyers clear 760.28 to confirm strength, or will a drop below 691.75 trigger invalidation?
Tap $MUB for the live chart. #MUB #BinanceSquare
5

·
--
$MUB +5.66% | $SKHYB +5.65% | $SNDKB +5.58%
#MUB pushed up to $750.55, a 5.66 % gain on $16.1 M of volume. The climb feels solid, especially with that amount of trading behind it.
#SKHYB rose to $129.71, climbing 5.65 % while moving $10.3 M. The price jump matches the volume, suggesting balanced interest.
#SNDKB hit $822.00, up 5.58 % on $7.0 M of volume. The lower turnover could mean the rally is more price‑driven than demand‑driven.
🔎 Keep an eye on whether the volume can keep pace with these percentage gains as the session progresses.
#Write2Earn #Binance
$MUB +5.66% | $SKHYB +5.65% | $SNDKB +5.58%
#MUB pushed up to $750.55, a 5.66 % gain on $16.1 M of volume. The climb feels solid, especially with that amount of trading behind it.
#SKHYB rose to $129.71, climbing 5.65 % while moving $10.3 M. The price jump matches the volume, suggesting balanced interest.
#SNDKB hit $822.00, up 5.58 % on $7.0 M of volume. The lower turnover could mean the rally is more price‑driven than demand‑driven.
🔎 Keep an eye on whether the volume can keep pace with these percentage gains as the session progresses.
#Write2Earn #Binance
#MUB pushed up to $750.55, a 5.66 % gain on $16.1 M of volume. The climb feels solid, especially with that amount of trading behind it.
#SKHYB rose to $129.71, climbing 5.65 % while moving $10.3 M. The price jump matches the volume, suggesting balanced interest.
#SNDKB hit $822.00, up 5.58 % on $7.0 M of volume. The lower turnover could mean the rally is more price‑driven than demand‑driven.
🔎 Keep an eye on whether the volume can keep pace with these percentage gains as the session progresses.
#Write2Earn #Binance
11
$MUB: MUB: The Dilemma of Invalidation Quality
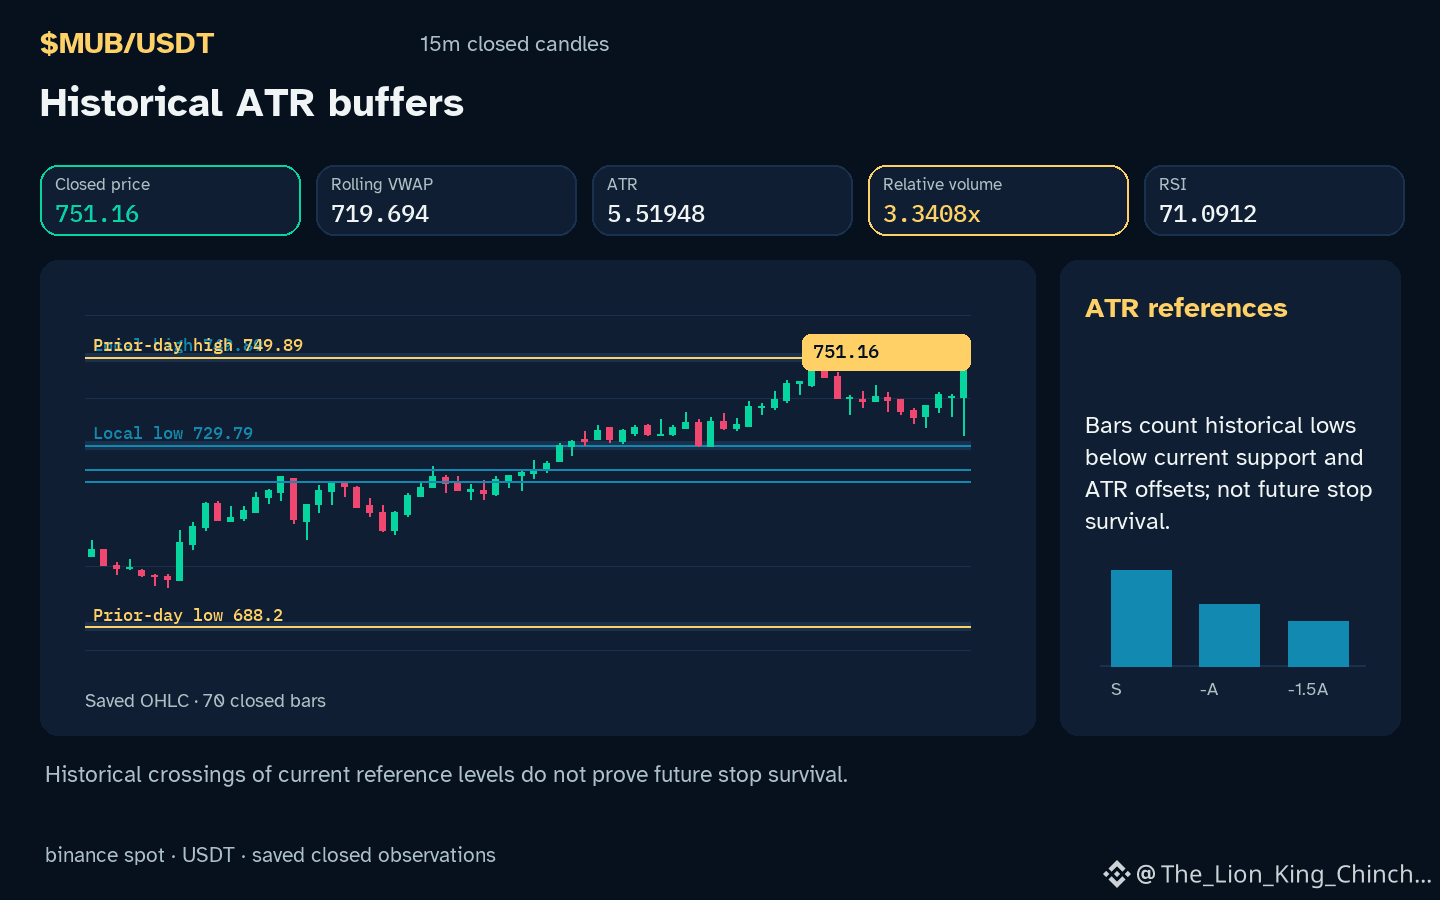
Does the local chart structure for $MUB offer a clear point of failure or merely a high-conviction visual pattern? With the hourly direction up and volume 3.34x the baseline, the current price sits above resistance. While upward momentum is visible, the feasibility of a trade often depends on the distance to a structural exit rather than the strength of the move itself.
Consider the trade-off between entry quality and invalidation distance. A hypothetical entry near the current level assumes the previous resistance 749.89 will now serve as a floor. If a trader waits for a deeper retracement toward support 729.79 to improve the potential reward ratio, they risk the asset continuing higher without them. Conversely, entering immediately creates a wider gap to a meaningful invalidation point. This gap represents the cost of certainty; a tighter stop might be triggered by noise, while a wider stop requires a larger price drop to prove the initial thesis wrong.
This tension highlights the limits of current observations. RSI 71.1 and daily change 6.98151% describe the recent window but do not forecast where buyers might return. A counterexample occurs when price drifts sideways: the lack of volatility makes the stop appear safe, yet the absence of momentum weakens the original reason for entry. If a closed hourly candle returns below the local support 729.79, the current interpretation of an upward trend would require immediate reassessment.
Probabilistic market research, not a recommendation or guaranteed return.
#MUB #RiskManagement #CryptoLearning
$MUB : MUB: The Dilemma of Invalidation Quality
Does the local chart structure for $MUB offer a clear point of failure or merely a high-conviction visual pattern? With the hourly direction up and volume 3.34x the baseline, the current price sits above resistance. While upward momentum is visible, the feasibility of a trade often depends on the distance to a structural exit rather than the strength of the move itself.
Consider the trade-off between entry quality and invalidation distance. A hypothetical entry near the current level assumes the previous resistance 749.89 will now serve as a floor. If a trader waits for a deeper retracement toward support 729.79 to improve the potential reward ratio, they risk the asset continuing higher without them. Conversely, entering immediately creates a wider gap to a meaningful invalidation point. This gap represents the cost of certainty; a tighter stop might be triggered by noise, while a wider stop requires a larger price drop to prove the initial thesis wrong.
This tension highlights the limits of current observations. RSI 71.1 and daily change 6.98151% describe the recent window but do not forecast where buyers might return. A counterexample occurs when price drifts sideways: the lack of volatility makes the stop appear safe, yet the absence of momentum weakens the original reason for entry. If a closed hourly candle returns below the local support 729.79, the current interpretation of an upward trend would require immediate reassessment.
Probabilistic market research, not a recommendation or guaranteed return.
#MUB #RiskManagement #CryptoLearning
Does the local chart structure for $MUB offer a clear point of failure or merely a high-conviction visual pattern? With the hourly direction up and volume 3.34x the baseline, the current price sits above resistance. While upward momentum is visible, the feasibility of a trade often depends on the distance to a structural exit rather than the strength of the move itself.
Consider the trade-off between entry quality and invalidation distance. A hypothetical entry near the current level assumes the previous resistance 749.89 will now serve as a floor. If a trader waits for a deeper retracement toward support 729.79 to improve the potential reward ratio, they risk the asset continuing higher without them. Conversely, entering immediately creates a wider gap to a meaningful invalidation point. This gap represents the cost of certainty; a tighter stop might be triggered by noise, while a wider stop requires a larger price drop to prove the initial thesis wrong.
This tension highlights the limits of current observations. RSI 71.1 and daily change 6.98151% describe the recent window but do not forecast where buyers might return. A counterexample occurs when price drifts sideways: the lack of volatility makes the stop appear safe, yet the absence of momentum weakens the original reason for entry. If a closed hourly candle returns below the local support 729.79, the current interpretation of an upward trend would require immediate reassessment.
Probabilistic market research, not a recommendation or guaranteed return.
#MUB #RiskManagement #CryptoLearning
25
·
--
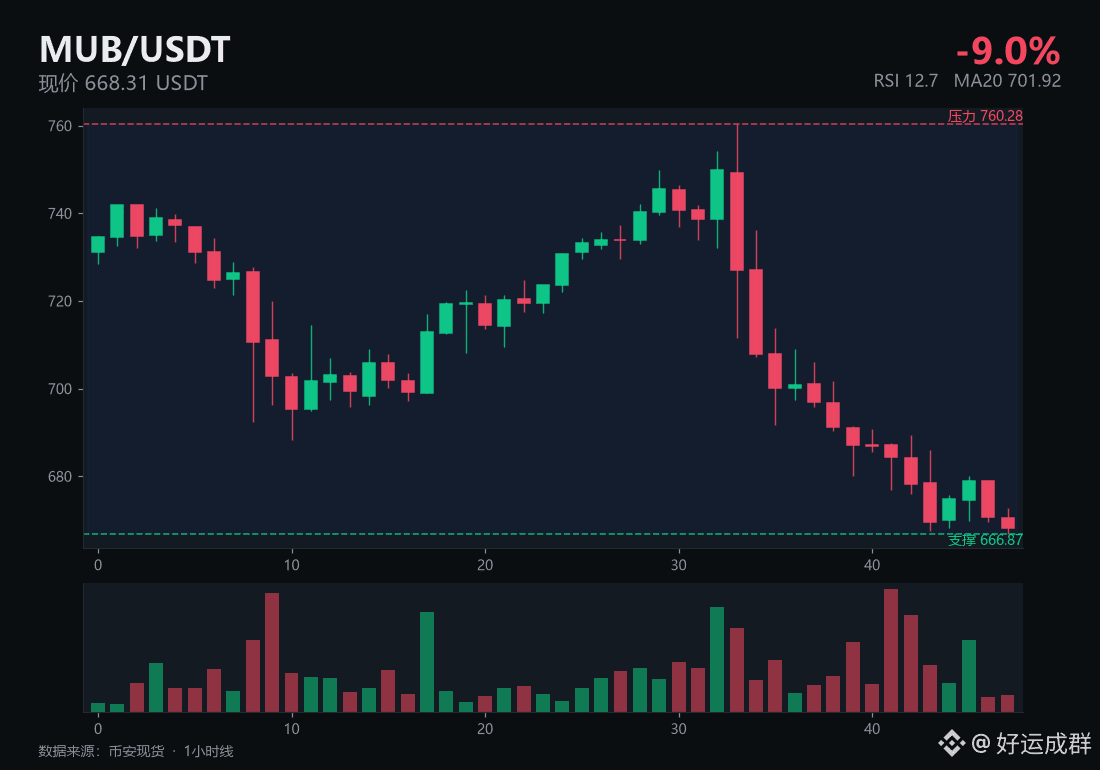
$MUB 今天-9.0%,比$BTC更难看,现价 668.31。
换个角度想:如果你是庄,这个位置会怎么做?
往上拉到 760.28 骗一波追多的,再回头扫 666.87 下面的止损,两头都能吃。
RSI 12.7 这个数,正好够制造点情绪。
这一波你站哪边?
市场不缺机会,缺的是等机会的耐心。
#币圈 #MUB
$MUB 今天-9.0%,比$BTC 更难看,现价 668.31。
换个角度想:如果你是庄,这个位置会怎么做?
往上拉到 760.28 骗一波追多的,再回头扫 666.87 下面的止损,两头都能吃。
RSI 12.7 这个数,正好够制造点情绪。
这一波你站哪边?
市场不缺机会,缺的是等机会的耐心。
#币圈 #MUB
换个角度想:如果你是庄,这个位置会怎么做?
往上拉到 760.28 骗一波追多的,再回头扫 666.87 下面的止损,两头都能吃。
RSI 12.7 这个数,正好够制造点情绪。
这一波你站哪边?
市场不缺机会,缺的是等机会的耐心。
#币圈 #MUB
29
Log in to explore more content
Join global crypto users on Binance Square
⚡️ Get latest and useful information about crypto.
💬 Trusted by the world’s largest crypto exchange.
👍 Discover real insights from verified creators.
Email / Phone number
Trending Topics
1
#BTCReboundsAbove$60KAmidWhaleDipBuying
21,702 views
141 Discussing
2
#SolanaSets2027RoadmapToDoubleComputeCapacity
5,920 views
217 Discussing
3
#CaliforniaNvidiaProbeExaminesPotentialCriminalViolations
2,986 views
42 Discussing
4
#BlackRockLaunchesHKDollarDigitalLiquidityFund
6,857 views
210 Discussing
5
#NvidiaLoses$2.7TrillionInMonthAndAHalf
53,840 views
249 Discussing
6
#GlobalStocksFaceLongestLosingStreakSince2023
453,121 views
2,915 Discussing
7
#BlackRockIBITPostsRecord$541MSingleDayOutflow
70,596 views
157 Discussing
8
#AnthropicPlungesTowardIPOPriceonDay2
246,777 views
1,917 Discussing
9
#TwentyOneCapitalAdds172.25BTC
122,603 views
1,278 Discussing
10
#HKBillWouldExcludeTokenizedDepositsFromVirtualAssets
15,606 views
89 Discussing