
#bitcoinpriceanalysis
bitcoinpriceanalysis
26,892 views
73 Discussing
Hot
Latest

LATEST : 📊 JPMorgan analysts say Bitcoin has traded below its estimated $78,000 production cost for 5 straight months.
{spot}(BTCUSDT)
$BTC #BitcoinPriceAnalysis #Bitcoin
LATEST : 📊 JPMorgan analysts say Bitcoin has traded below its estimated $78,000 production cost for 5 straight months.
$BTC #BitcoinPriceAnalysis #Bitcoin
$BTC #BitcoinPriceAnalysis #Bitcoin

1
21


·
--

Article
Oil Surges While Bitcoin Slips as U.S. Strikes Iranian Oil Tankers⚠️ Geopolitical Tensions Shake Markets
🛢️ Oil prices climbed around 1% after escalating U.S.-Iran tensions and strikes on Iranian crude carriers.₿ Bitcoin fell nearly 1%, trading around $79,700, after spending much of the weekend near the $80,000 level.🚢 U.S. Central Command confirmed strikes on three Iranian oil tankers near Kharg Island, Jask and the Gulf of Oman.🌍 U.S. forces have reportedly redirected 92 merchant ships, disabled three and boarded two as maritime enforcement around Iran intensifies.
📈 Rising Oil Creates Inflation Concerns
🔥 WTI crude reached about $92.72, gaining more than 6% during the first seven days of September.💰 Higher energy costs could increase global inflation and make it more difficult for central banks to reduce interest rates.🏦 Tighter monetary-policy expectations could create additional pressure on risk assets such as Bitcoin and equities.
₿ Bitcoin Faces Multiple Headwinds
📉 BTC was trading near $79,700, down roughly 1% from midnight UTC.⚡ Bitcoin also faced additional market uncertainty following a reported $320 million exploit involving Liquid Network.📊 Stronger-than-expected U.S. employment data has increased expectations for a less dovish Federal Reserve.
🏦 Fed Policy Adds More Uncertainty
🇺🇸 President Donald Trump has renewed pressure on the Federal Reserve to lower interest rates.⚖️ Markets are therefore balancing strong labor-market data, geopolitical risks, rising oil prices and political pressure for easier monetary policy.🌪️ This combination could keep Bitcoin and broader risk assets volatile in the near term.
🔮 Key Takeaway
🛢️ Higher oil + geopolitical escalation = inflation risk.📉 Higher rates or delayed cuts could pressure Bitcoin.₿ BTC's ability to reclaim and hold $80,000 remains an important short-term market signal.👀 Traders should closely monitor oil prices, Fed expectations, U.S. economic data and developments in the U.S.-Iran conflict.
🏷️ #BitcoinPriceAnalysis #OilPriceAnalysis #USIranConflict #GeopoliticalMarketRisk
$BTC
{spot}(BTCUSDT)
Oil Surges While Bitcoin Slips as U.S. Strikes Iranian Oil Tankers
⚠️ Geopolitical Tensions Shake Markets
🛢️ Oil prices climbed around 1% after escalating U.S.-Iran tensions and strikes on Iranian crude carriers.₿ Bitcoin fell nearly 1%, trading around $79,700, after spending much of the weekend near the $80,000 level.🚢 U.S. Central Command confirmed strikes on three Iranian oil tankers near Kharg Island, Jask and the Gulf of Oman.🌍 U.S. forces have reportedly redirected 92 merchant ships, disabled three and boarded two as maritime enforcement around Iran intensifies.
📈 Rising Oil Creates Inflation Concerns
🔥 WTI crude reached about $92.72, gaining more than 6% during the first seven days of September.💰 Higher energy costs could increase global inflation and make it more difficult for central banks to reduce interest rates.🏦 Tighter monetary-policy expectations could create additional pressure on risk assets such as Bitcoin and equities.
₿ Bitcoin Faces Multiple Headwinds
📉 BTC was trading near $79,700, down roughly 1% from midnight UTC.⚡ Bitcoin also faced additional market uncertainty following a reported $320 million exploit involving Liquid Network.📊 Stronger-than-expected U.S. employment data has increased expectations for a less dovish Federal Reserve.
🏦 Fed Policy Adds More Uncertainty
🇺🇸 President Donald Trump has renewed pressure on the Federal Reserve to lower interest rates.⚖️ Markets are therefore balancing strong labor-market data, geopolitical risks, rising oil prices and political pressure for easier monetary policy.🌪️ This combination could keep Bitcoin and broader risk assets volatile in the near term.
🔮 Key Takeaway
🛢️ Higher oil + geopolitical escalation = inflation risk.📉 Higher rates or delayed cuts could pressure Bitcoin.₿ BTC's ability to reclaim and hold $80,000 remains an important short-term market signal.👀 Traders should closely monitor oil prices, Fed expectations, U.S. economic data and developments in the U.S.-Iran conflict.
🏷️ #BitcoinPriceAnalysis #OilPriceAnalysis #USIranConflict #GeopoliticalMarketRisk
$BTC
🛢️ Oil prices climbed around 1% after escalating U.S.-Iran tensions and strikes on Iranian crude carriers.₿ Bitcoin fell nearly 1%, trading around $79,700, after spending much of the weekend near the $80,000 level.🚢 U.S. Central Command confirmed strikes on three Iranian oil tankers near Kharg Island, Jask and the Gulf of Oman.🌍 U.S. forces have reportedly redirected 92 merchant ships, disabled three and boarded two as maritime enforcement around Iran intensifies.
📈 Rising Oil Creates Inflation Concerns
🔥 WTI crude reached about $92.72, gaining more than 6% during the first seven days of September.💰 Higher energy costs could increase global inflation and make it more difficult for central banks to reduce interest rates.🏦 Tighter monetary-policy expectations could create additional pressure on risk assets such as Bitcoin and equities.
₿ Bitcoin Faces Multiple Headwinds
📉 BTC was trading near $79,700, down roughly 1% from midnight UTC.⚡ Bitcoin also faced additional market uncertainty following a reported $320 million exploit involving Liquid Network.📊 Stronger-than-expected U.S. employment data has increased expectations for a less dovish Federal Reserve.
🏦 Fed Policy Adds More Uncertainty
🇺🇸 President Donald Trump has renewed pressure on the Federal Reserve to lower interest rates.⚖️ Markets are therefore balancing strong labor-market data, geopolitical risks, rising oil prices and political pressure for easier monetary policy.🌪️ This combination could keep Bitcoin and broader risk assets volatile in the near term.
🔮 Key Takeaway
🛢️ Higher oil + geopolitical escalation = inflation risk.📉 Higher rates or delayed cuts could pressure Bitcoin.₿ BTC's ability to reclaim and hold $80,000 remains an important short-term market signal.👀 Traders should closely monitor oil prices, Fed expectations, U.S. economic data and developments in the U.S.-Iran conflict.
🏷️ #BitcoinPriceAnalysis #OilPriceAnalysis #USIranConflict #GeopoliticalMarketRisk
$BTC
1
2
334
·
--
🚀 Following a 43% rally, Bitcoin steps into its prime season with $147,000 now firmly in sight
📈 Bitcoin surged about 43% in Q3 2026, making it one of its strongest quarters in recent years and significantly outperforming the Nasdaq, S&P 500 and gold.
💰 The rally was supported by renewed institutional demand, while Bitcoin rose from around $58,600 in July toward the mid-$80,000s.
🏦 ETF Demand Returns
💵 US spot Bitcoin ETFs shifted from roughly $5B in year-to-date outflows at the end of July to about $1B in inflows by late September.
📊 ETF demand reached $2.39B in one week, while falling futures open interest suggests traders are reducing leverage.
⚔️ $85K–$86.5K Supply Wall
🚧 Around 1.39M BTC is estimated to have been accumulated between $84K and $86.5K, creating significant potential selling pressure.
🔥 A sustained break above $86.5K could bring $88K–$90K into focus, followed by the important $96.7K area.
🎯 Could Bitcoin Reach $147K?
📅 Q4 has historically been Bitcoin's strongest quarter, with historical average returns estimated around 77%–85%.
📈 Applying a 77% historical average from current levels produces a mechanical projection near $147,000, while a median Q4 return could imply around $123,000.
⚠️ These are historical-based calculations, not guaranteed price targets.
🏛️ Fed & Treasury Yields Remain Key
💼 Bitcoin's next move will also depend on Federal Reserve policy, inflation, Treasury yields and ETF flows.
🔻 Bitfinex identifies around $81,300 as an important downside level, with $77K potentially becoming relevant if ETF outflows return.
📊 Meanwhile, strong ETF buying and a breakout above $86.5K could shift attention toward $90K and beyond.
🔥#BitcoinQ4Rally #BitcoinPriceAnalysis #BitcoinMarketOutlook
$BTC
{spot}(BTCUSDT)
🚀 Following a 43% rally, Bitcoin steps into its prime season with $147,000 now firmly in sight
📈 Bitcoin surged about 43% in Q3 2026, making it one of its strongest quarters in recent years and significantly outperforming the Nasdaq, S&P 500 and gold.
💰 The rally was supported by renewed institutional demand, while Bitcoin rose from around $58,600 in July toward the mid-$80,000s.
🏦 ETF Demand Returns
💵 US spot Bitcoin ETFs shifted from roughly $5B in year-to-date outflows at the end of July to about $1B in inflows by late September.
📊 ETF demand reached $2.39B in one week, while falling futures open interest suggests traders are reducing leverage.
⚔️ $85K–$86.5K Supply Wall
🚧 Around 1.39M BTC is estimated to have been accumulated between $84K and $86.5K, creating significant potential selling pressure.
🔥 A sustained break above $86.5K could bring $88K–$90K into focus, followed by the important $96.7K area.
🎯 Could Bitcoin Reach $147K?
📅 Q4 has historically been Bitcoin's strongest quarter, with historical average returns estimated around 77%–85%.
📈 Applying a 77% historical average from current levels produces a mechanical projection near $147,000, while a median Q4 return could imply around $123,000.
⚠️ These are historical-based calculations, not guaranteed price targets.
🏛️ Fed & Treasury Yields Remain Key
💼 Bitcoin's next move will also depend on Federal Reserve policy, inflation, Treasury yields and ETF flows.
🔻 Bitfinex identifies around $81,300 as an important downside level, with $77K potentially becoming relevant if ETF outflows return.
📊 Meanwhile, strong ETF buying and a breakout above $86.5K could shift attention toward $90K and beyond.
🔥#BitcoinQ4Rally #BitcoinPriceAnalysis #BitcoinMarketOutlook
$BTC
📈 Bitcoin surged about 43% in Q3 2026, making it one of its strongest quarters in recent years and significantly outperforming the Nasdaq, S&P 500 and gold.
💰 The rally was supported by renewed institutional demand, while Bitcoin rose from around $58,600 in July toward the mid-$80,000s.
🏦 ETF Demand Returns
💵 US spot Bitcoin ETFs shifted from roughly $5B in year-to-date outflows at the end of July to about $1B in inflows by late September.
📊 ETF demand reached $2.39B in one week, while falling futures open interest suggests traders are reducing leverage.
⚔️ $85K–$86.5K Supply Wall
🚧 Around 1.39M BTC is estimated to have been accumulated between $84K and $86.5K, creating significant potential selling pressure.
🔥 A sustained break above $86.5K could bring $88K–$90K into focus, followed by the important $96.7K area.
🎯 Could Bitcoin Reach $147K?
📅 Q4 has historically been Bitcoin's strongest quarter, with historical average returns estimated around 77%–85%.
📈 Applying a 77% historical average from current levels produces a mechanical projection near $147,000, while a median Q4 return could imply around $123,000.
⚠️ These are historical-based calculations, not guaranteed price targets.
🏛️ Fed & Treasury Yields Remain Key
💼 Bitcoin's next move will also depend on Federal Reserve policy, inflation, Treasury yields and ETF flows.
🔻 Bitfinex identifies around $81,300 as an important downside level, with $77K potentially becoming relevant if ETF outflows return.
📊 Meanwhile, strong ETF buying and a breakout above $86.5K could shift attention toward $90K and beyond.
🔥#BitcoinQ4Rally #BitcoinPriceAnalysis #BitcoinMarketOutlook
$BTC

1
172

·
--
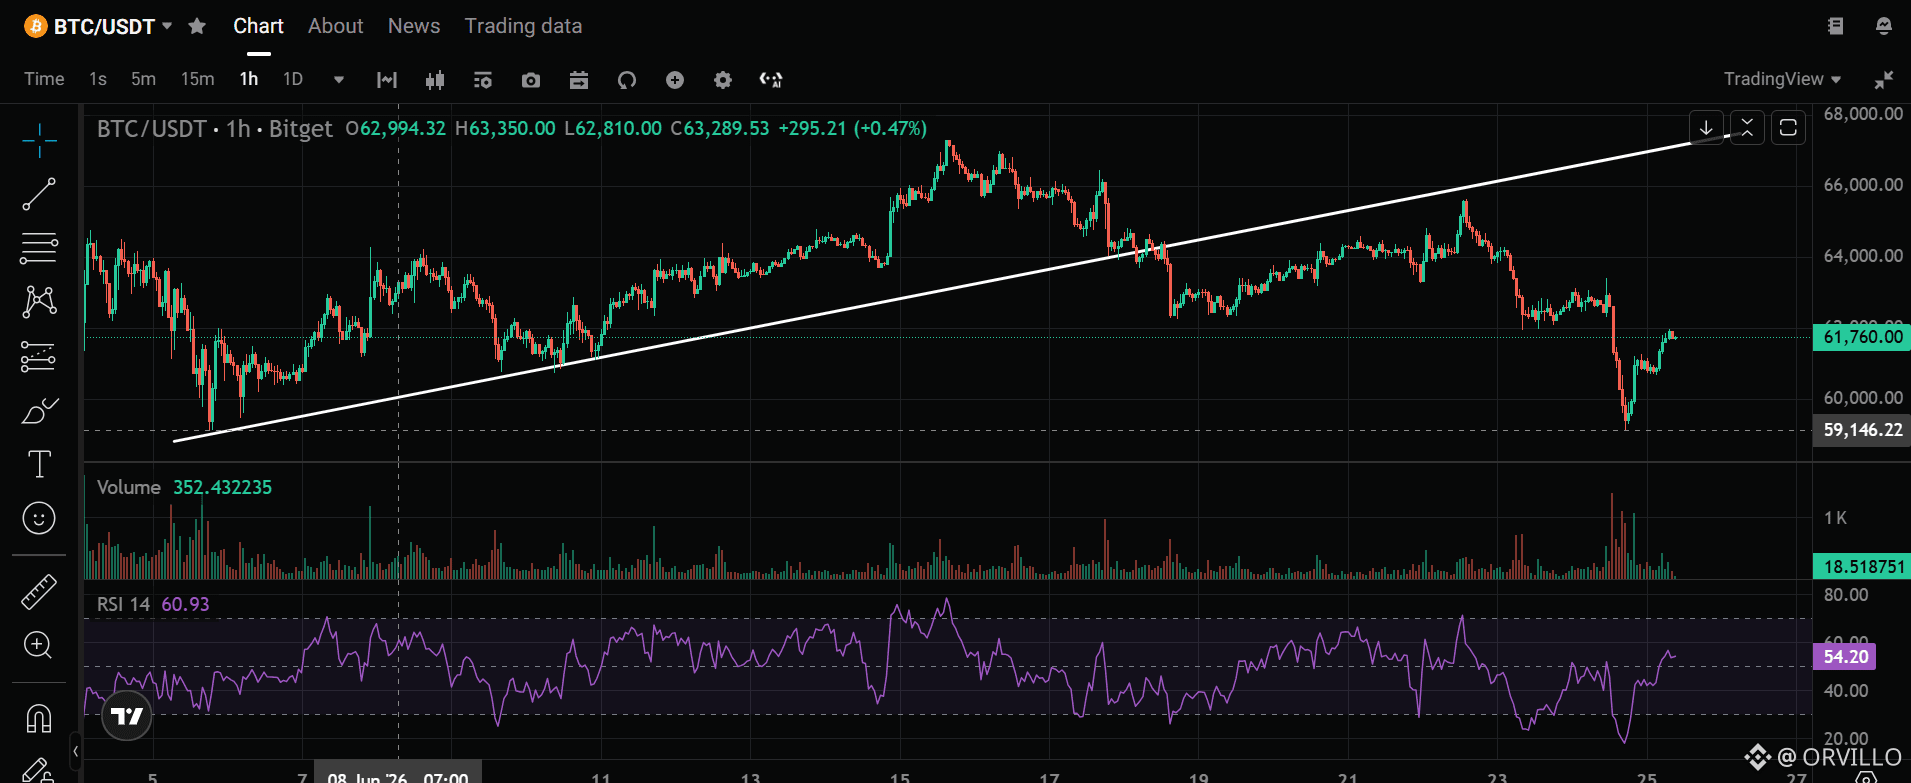
$BTC must go below $59,200 again
Here is why:
$BTC obeys RSI divergences 90% of the time (atleast on the lower timeframe)
Yesterday, just as my TA predicted, $BTC dumped from $62,300 to $59,200 and then bounced back to $62,000
At that low point, the RSI gave no divergence signal before the bounce.
For this reason, Bitcoin MUST revisit $59,200
How fast do you think it is gonna take place?
#BitcoinPriceAnalysis
$BTC must go below $59,200 again
Here is why:
$BTC obeys RSI divergences 90% of the time (atleast on the lower timeframe)
Yesterday, just as my TA predicted, $BTC dumped from $62,300 to $59,200 and then bounced back to $62,000
At that low point, the RSI gave no divergence signal before the bounce.
For this reason, Bitcoin MUST revisit $59,200
How fast do you think it is gonna take place?
#BitcoinPriceAnalysis
Here is why:
$BTC obeys RSI divergences 90% of the time (atleast on the lower timeframe)
Yesterday, just as my TA predicted, $BTC dumped from $62,300 to $59,200 and then bounced back to $62,000
At that low point, the RSI gave no divergence signal before the bounce.
For this reason, Bitcoin MUST revisit $59,200
How fast do you think it is gonna take place?
#BitcoinPriceAnalysis
150

·
--
Bitcoin bounces from new 2026 lows.
Bitcoin just hit fresh 2026 lows, dropping below the previous support zone as spot Bitcoin ETFs recorded their largest daily outflows of June. The sell-off accelerated after a bearish monthly options expiry added pressure to an already strained market.
The bounce came quickly, but the macro backdrop remains challenging. Strategy's widening unrealized losses have become a talking point, with critics comparing Bitcoin performance against AI-linked equities that have outpaced the market this year. US equity weakness, particularly in tech-heavy indices, continues to weigh on crypto sentiment as institutional investors reassess risk allocations.
Bitcoin correlation with US stocks has tightened in recent weeks. When equities sold off earlier this week, crypto followed within hours, suggesting large players are treating both markets as part of the same risk trade. The ETF outflows reflect this shift, with investors rotating out of speculative assets and into defensive positions.
The bounce off lows suggests some buyers are stepping in at these levels, but the question remains whether this is genuine accumulation or a dead-cat bounce before another leg down. Options market data shows more puts than calls expiring next week, indicating traders expect further downside pressure.
If US stocks continue to weaken, Bitcoin could test even lower levels. But if the macro stabilizes and ETF inflows reverse, this dip might mark a turning point for the quarter.
Will US stock weakness drag Bitcoin to fresh lows or is this bounce the start of a recovery? 👇
#BitcoinPriceAnalysis #ETFOutflows #CryptoStockCorrelation
Bitcoin bounces from new 2026 lows.
Bitcoin just hit fresh 2026 lows, dropping below the previous support zone as spot Bitcoin ETFs recorded their largest daily outflows of June. The sell-off accelerated after a bearish monthly options expiry added pressure to an already strained market.
The bounce came quickly, but the macro backdrop remains challenging. Strategy's widening unrealized losses have become a talking point, with critics comparing Bitcoin performance against AI-linked equities that have outpaced the market this year. US equity weakness, particularly in tech-heavy indices, continues to weigh on crypto sentiment as institutional investors reassess risk allocations.
Bitcoin correlation with US stocks has tightened in recent weeks. When equities sold off earlier this week, crypto followed within hours, suggesting large players are treating both markets as part of the same risk trade. The ETF outflows reflect this shift, with investors rotating out of speculative assets and into defensive positions.
The bounce off lows suggests some buyers are stepping in at these levels, but the question remains whether this is genuine accumulation or a dead-cat bounce before another leg down. Options market data shows more puts than calls expiring next week, indicating traders expect further downside pressure.
If US stocks continue to weaken, Bitcoin could test even lower levels. But if the macro stabilizes and ETF inflows reverse, this dip might mark a turning point for the quarter.
Will US stock weakness drag Bitcoin to fresh lows or is this bounce the start of a recovery? 👇
#BitcoinPriceAnalysis #ETFOutflows #CryptoStockCorrelation
Bitcoin just hit fresh 2026 lows, dropping below the previous support zone as spot Bitcoin ETFs recorded their largest daily outflows of June. The sell-off accelerated after a bearish monthly options expiry added pressure to an already strained market.
The bounce came quickly, but the macro backdrop remains challenging. Strategy's widening unrealized losses have become a talking point, with critics comparing Bitcoin performance against AI-linked equities that have outpaced the market this year. US equity weakness, particularly in tech-heavy indices, continues to weigh on crypto sentiment as institutional investors reassess risk allocations.
Bitcoin correlation with US stocks has tightened in recent weeks. When equities sold off earlier this week, crypto followed within hours, suggesting large players are treating both markets as part of the same risk trade. The ETF outflows reflect this shift, with investors rotating out of speculative assets and into defensive positions.
The bounce off lows suggests some buyers are stepping in at these levels, but the question remains whether this is genuine accumulation or a dead-cat bounce before another leg down. Options market data shows more puts than calls expiring next week, indicating traders expect further downside pressure.
If US stocks continue to weaken, Bitcoin could test even lower levels. But if the macro stabilizes and ETF inflows reverse, this dip might mark a turning point for the quarter.
Will US stock weakness drag Bitcoin to fresh lows or is this bounce the start of a recovery? 👇
#BitcoinPriceAnalysis #ETFOutflows #CryptoStockCorrelation
1
26
·
--
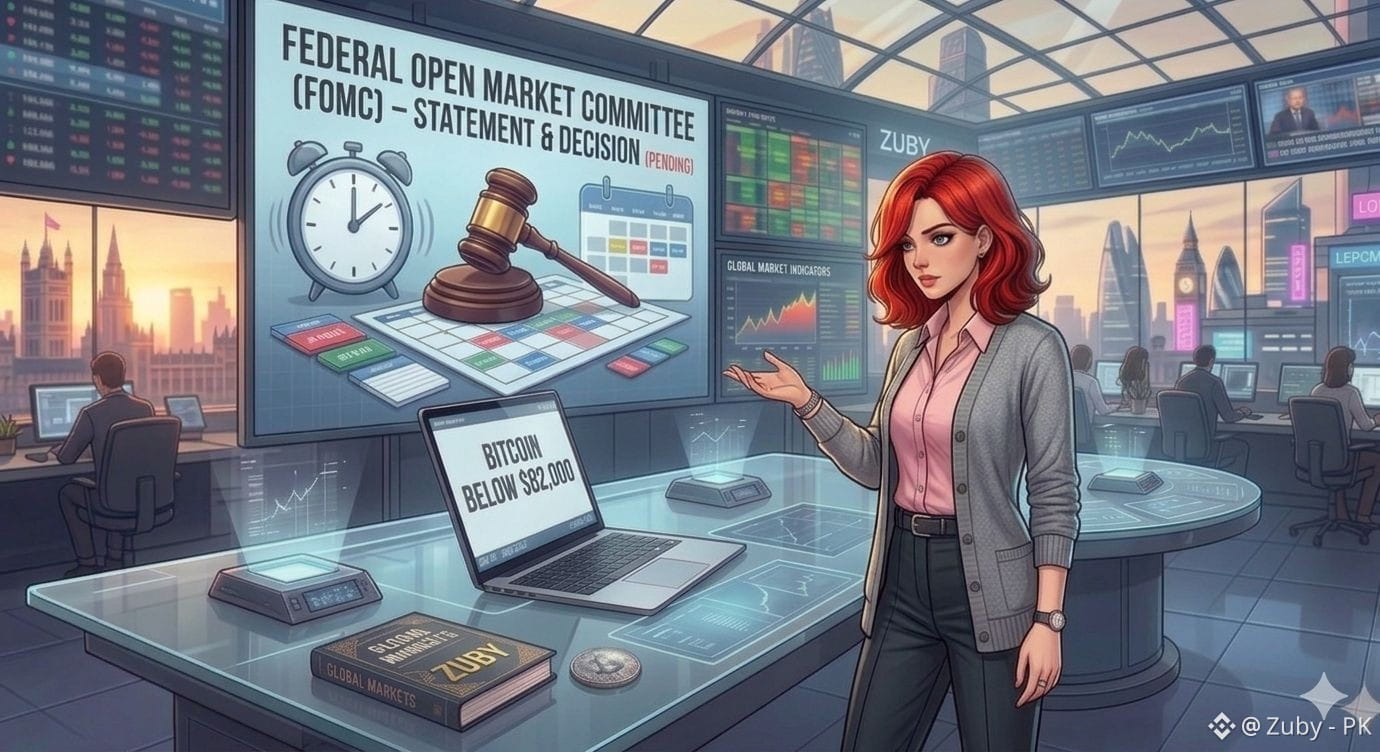
₿ Bitcoin May Stay Below $82K Until Fed Decision
📊 BTC Stays Range-Bound
🔹 Bitcoin is around $79,176, down about 0.8%.
📉 Analysts expect BTC to remain between $78K–$82K until the Fed decision.
🚧 $80.5K is the first resistance, while $77.2K is key downside support.
💰 ETF Inflows Support BTC
💵 U.S. spot Bitcoin ETFs attracted nearly $987M in weekly inflows.
📈 Three-week inflows reached about $3.8B, helping support BTC near $79K.
🏦 Fed & CPI in Focus
📅 CPI on Sept. 11 and the Fed decision on Sept. 16 could trigger Bitcoin’s next major move.
🔥 Hot inflation and higher yields could pressure BTC.
🚀 Softer inflation and lower yields could support a breakout.
🎯 Key Levels
🟢 Bullish: Break above $82K
🔴 Resistance: $80.5K–$82K
🟡 Support: $78K–$79K
⚠️ Bearish: Below $77.2K
🔥 Outlook
⏳ Bitcoin may remain volatile and range-bound until upcoming U.S. economic data and the Fed provide clearer direction.
🏷️#BitcoinPriceAnalysis #BTCMarketOutlook #BitcoinFedDecision #CryptoMarketAnalysis
$BTC
{spot}(BTCUSDT)
₿ Bitcoin May Stay Below $82K Until Fed Decision
📊 BTC Stays Range-Bound
🔹 Bitcoin is around $79,176, down about 0.8%.
📉 Analysts expect BTC to remain between $78K–$82K until the Fed decision.
🚧 $80.5K is the first resistance, while $77.2K is key downside support.
💰 ETF Inflows Support BTC
💵 U.S. spot Bitcoin ETFs attracted nearly $987M in weekly inflows.
📈 Three-week inflows reached about $3.8B, helping support BTC near $79K.
🏦 Fed & CPI in Focus
📅 CPI on Sept. 11 and the Fed decision on Sept. 16 could trigger Bitcoin’s next major move.
🔥 Hot inflation and higher yields could pressure BTC.
🚀 Softer inflation and lower yields could support a breakout.
🎯 Key Levels
🟢 Bullish: Break above $82K
🔴 Resistance: $80.5K–$82K
🟡 Support: $78K–$79K
⚠️ Bearish: Below $77.2K
🔥 Outlook
⏳ Bitcoin may remain volatile and range-bound until upcoming U.S. economic data and the Fed provide clearer direction.
🏷️#BitcoinPriceAnalysis #BTCMarketOutlook #BitcoinFedDecision #CryptoMarketAnalysis
$BTC
📊 BTC Stays Range-Bound
🔹 Bitcoin is around $79,176, down about 0.8%.
📉 Analysts expect BTC to remain between $78K–$82K until the Fed decision.
🚧 $80.5K is the first resistance, while $77.2K is key downside support.
💰 ETF Inflows Support BTC
💵 U.S. spot Bitcoin ETFs attracted nearly $987M in weekly inflows.
📈 Three-week inflows reached about $3.8B, helping support BTC near $79K.
🏦 Fed & CPI in Focus
📅 CPI on Sept. 11 and the Fed decision on Sept. 16 could trigger Bitcoin’s next major move.
🔥 Hot inflation and higher yields could pressure BTC.
🚀 Softer inflation and lower yields could support a breakout.
🎯 Key Levels
🟢 Bullish: Break above $82K
🔴 Resistance: $80.5K–$82K
🟡 Support: $78K–$79K
⚠️ Bearish: Below $77.2K
🔥 Outlook
⏳ Bitcoin may remain volatile and range-bound until upcoming U.S. economic data and the Fed provide clearer direction.
🏷️#BitcoinPriceAnalysis #BTCMarketOutlook #BitcoinFedDecision #CryptoMarketAnalysis
$BTC
1
46
·
--
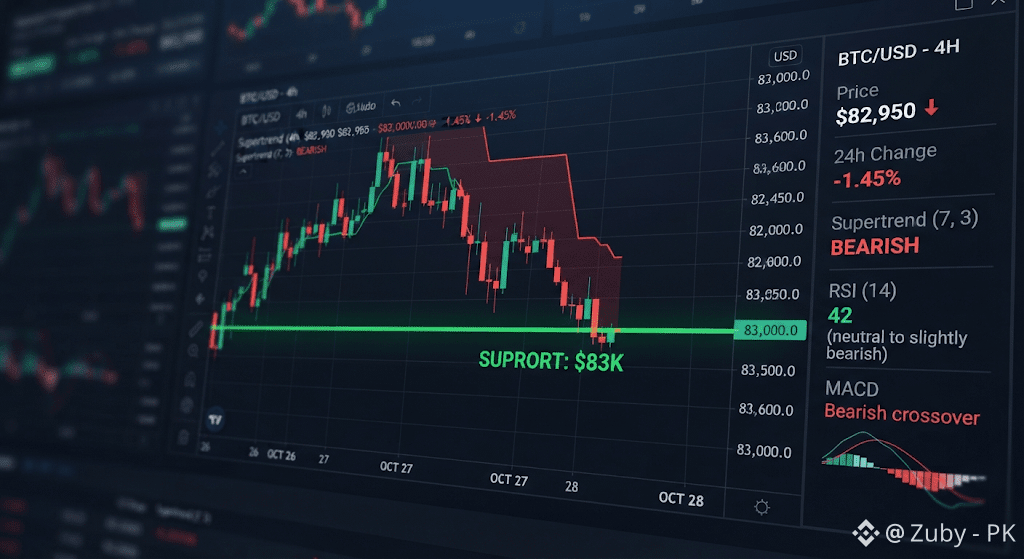
₿ Bitcoin Tests $83K Support as Short-Term Trend Weakens
📉 BTC Pullback
🔸 Bitcoin traded near $83,960, retreating from the recent $87K high.
🔸 BTC remains above its major daily moving averages, while RSI cooled to 62.83.
💰 ETF Demand
🔸 U.S. spot Bitcoin ETFs recorded around $2.39B in net inflows from Sep. 21–25.
🔸 However, daily inflows slowed toward the end of the week.
⚠️ Key Technical Levels
🔸 The 4-hour Supertrend is bearish near $85,087, creating immediate resistance.
🔸 $83,250 is nearby support, followed by the key $81,500–$83,000 zone.
🔸 A break below $82K could expose BTC to deeper downside toward the $80,730 20-day average.
🔸 A move above $85K could reopen the path toward $87K.
📊 Outlook
🔸 The daily trend remains relatively supported, but short-term momentum has weakened.
🔸 $82K–$85K is the key range to watch for Bitcoin’s next major move.
🏷️#BitcoinPriceAnalysis #BitcoinResistanceLevels #CryptoMarketAnalysis
$BTC
{spot}(BTCUSDT)
₿ Bitcoin Tests $83K Support as Short-Term Trend Weakens
📉 BTC Pullback
🔸 Bitcoin traded near $83,960, retreating from the recent $87K high.
🔸 BTC remains above its major daily moving averages, while RSI cooled to 62.83.
💰 ETF Demand
🔸 U.S. spot Bitcoin ETFs recorded around $2.39B in net inflows from Sep. 21–25.
🔸 However, daily inflows slowed toward the end of the week.
⚠️ Key Technical Levels
🔸 The 4-hour Supertrend is bearish near $85,087, creating immediate resistance.
🔸 $83,250 is nearby support, followed by the key $81,500–$83,000 zone.
🔸 A break below $82K could expose BTC to deeper downside toward the $80,730 20-day average.
🔸 A move above $85K could reopen the path toward $87K.
📊 Outlook
🔸 The daily trend remains relatively supported, but short-term momentum has weakened.
🔸 $82K–$85K is the key range to watch for Bitcoin’s next major move.
🏷️#BitcoinPriceAnalysis #BitcoinResistanceLevels #CryptoMarketAnalysis
$BTC
📉 BTC Pullback
🔸 Bitcoin traded near $83,960, retreating from the recent $87K high.
🔸 BTC remains above its major daily moving averages, while RSI cooled to 62.83.
💰 ETF Demand
🔸 U.S. spot Bitcoin ETFs recorded around $2.39B in net inflows from Sep. 21–25.
🔸 However, daily inflows slowed toward the end of the week.
⚠️ Key Technical Levels
🔸 The 4-hour Supertrend is bearish near $85,087, creating immediate resistance.
🔸 $83,250 is nearby support, followed by the key $81,500–$83,000 zone.
🔸 A break below $82K could expose BTC to deeper downside toward the $80,730 20-day average.
🔸 A move above $85K could reopen the path toward $87K.
📊 Outlook
🔸 The daily trend remains relatively supported, but short-term momentum has weakened.
🔸 $82K–$85K is the key range to watch for Bitcoin’s next major move.
🏷️#BitcoinPriceAnalysis #BitcoinResistanceLevels #CryptoMarketAnalysis
$BTC
1
2
180

·
--
"HODLing just got a bit more... interesting Bitcoin just got liquidated for breakfast, but bulls are fighting to save the day and keep $60K in the picture Don't get it twisted, folks - just because the market's choppy doesn't mean we're not making moves The #bulls are clinging to technical support, so we'll keep an eye on that $60K level. #cryptoincome #bitcoinpriceanalysis The million-dollar question is, will you be a part of the recovery or will you be swept away with the liquidation? Share your thoughts!"
"HODLing just got a bit more... interesting Bitcoin just got liquidated for breakfast, but bulls are fighting to save the day and keep $60K in the picture Don't get it twisted, folks - just because the market's choppy doesn't mean we're not making moves The #bulls are clinging to technical support, so we'll keep an eye on that $60K level. #cryptoincome #bitcoinpriceanalysis The million-dollar question is, will you be a part of the recovery or will you be swept away with the liquidation? Share your thoughts!"
72

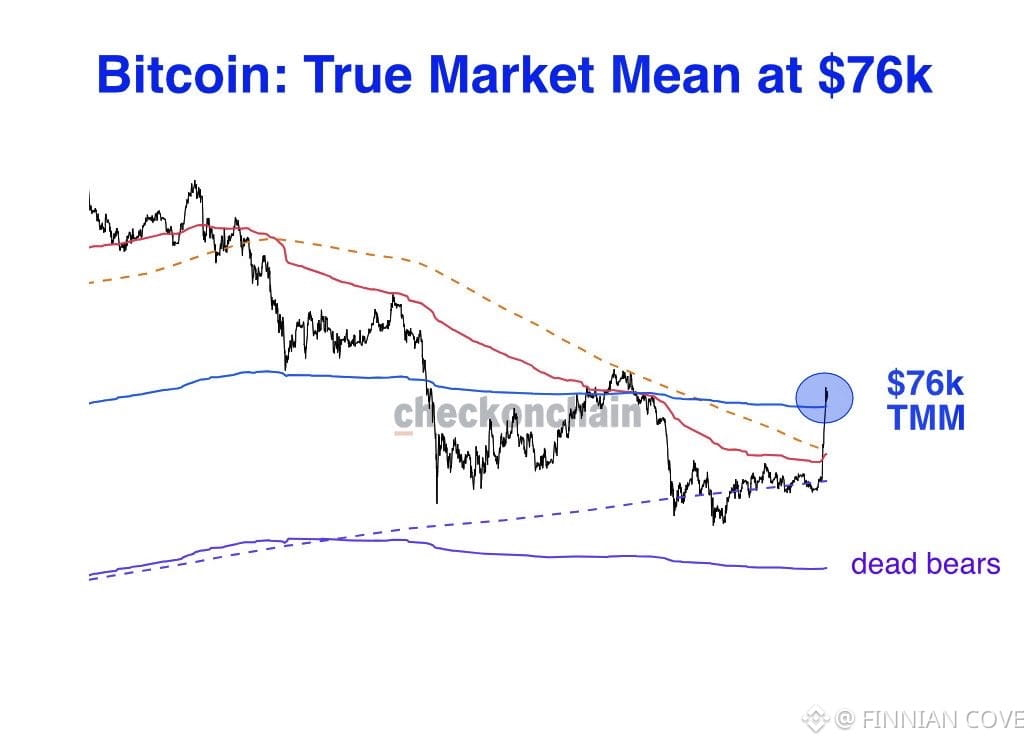
$BTC is testing the critical $76K True Market Mean.
A clean reclaim of this level could signal that bearish pressure is fading and give Bitcoin room to push higher.
But if $76K continues to reject price, the downside risk remains.
📌 $76K is the key level to watch.
What’s Bitcoin’s next move? 👀
#Bitcoin #BTC #BitcoinPriceAnalysis #crypto
{spot}(BTCUSDT)
$BTC is testing the critical $76K True Market Mean.
A clean reclaim of this level could signal that bearish pressure is fading and give Bitcoin room to push higher.
But if $76K continues to reject price, the downside risk remains.
📌 $76K is the key level to watch.
What’s Bitcoin’s next move? 👀
#Bitcoin #BTC #BitcoinPriceAnalysis #crypto
A clean reclaim of this level could signal that bearish pressure is fading and give Bitcoin room to push higher.
But if $76K continues to reject price, the downside risk remains.
📌 $76K is the key level to watch.
What’s Bitcoin’s next move? 👀
#Bitcoin #BTC #BitcoinPriceAnalysis #crypto
103
·
--
🚀 Bitcoin Nears $80,000 Milestone
📈 Bullish Momentum: Bitcoin has surged roughly 27% over the past month, breaking key moving averages and testing the $80,000 threshold.
⚡ Drivers of the Rally: The surge is fueled by short-covering liquidations exceeding $2.7 billion, declining Treasury yields, a weaker dollar, and renewed ETF demand.
📉 The Importance of a Pullback & Consolidation
🔄 Healthy Cool-Down: Analysts warn that Bitcoin is currently overbought. A pullback to the $75,000–$76,000 range (or $67,000–$70,000 for deeper support) is considered necessary to test rally strength and build a solid base.
⚠️ Thin Trading Zones: Experts note that historical volume between $80,000 and $90,000 is sparse, which could trigger sharper price swings in either direction. Consolidation between $75,000 and $83,000 is viewed as a healthy precursor to higher targets.
🎯 What’s Next for BTC?
🔮 Key Resistance Levels: Watch for a sustained move past $83,000, which could clear a path toward $87,000 and ultimately test the psychological $100,000 milestone.
💼 The Need for Spot Demand: With short-sellers closing out, the market now requires sustained spot demand and continued ETF inflows to sustain upward momentum.
🏷️#CryptoMarketPullback #BitcoinPriceAnalysis #CryptoTradingStrategies
$BTC
{spot}(BTCUSDT)
🚀 Bitcoin Nears $80,000 Milestone
📈 Bullish Momentum: Bitcoin has surged roughly 27% over the past month, breaking key moving averages and testing the $80,000 threshold.
⚡ Drivers of the Rally: The surge is fueled by short-covering liquidations exceeding $2.7 billion, declining Treasury yields, a weaker dollar, and renewed ETF demand.
📉 The Importance of a Pullback & Consolidation
🔄 Healthy Cool-Down: Analysts warn that Bitcoin is currently overbought. A pullback to the $75,000–$76,000 range (or $67,000–$70,000 for deeper support) is considered necessary to test rally strength and build a solid base.
⚠️ Thin Trading Zones: Experts note that historical volume between $80,000 and $90,000 is sparse, which could trigger sharper price swings in either direction. Consolidation between $75,000 and $83,000 is viewed as a healthy precursor to higher targets.
🎯 What’s Next for BTC?
🔮 Key Resistance Levels: Watch for a sustained move past $83,000, which could clear a path toward $87,000 and ultimately test the psychological $100,000 milestone.
💼 The Need for Spot Demand: With short-sellers closing out, the market now requires sustained spot demand and continued ETF inflows to sustain upward momentum.
🏷️#CryptoMarketPullback #BitcoinPriceAnalysis #CryptoTradingStrategies
$BTC
📈 Bullish Momentum: Bitcoin has surged roughly 27% over the past month, breaking key moving averages and testing the $80,000 threshold.
⚡ Drivers of the Rally: The surge is fueled by short-covering liquidations exceeding $2.7 billion, declining Treasury yields, a weaker dollar, and renewed ETF demand.
📉 The Importance of a Pullback & Consolidation
🔄 Healthy Cool-Down: Analysts warn that Bitcoin is currently overbought. A pullback to the $75,000–$76,000 range (or $67,000–$70,000 for deeper support) is considered necessary to test rally strength and build a solid base.
⚠️ Thin Trading Zones: Experts note that historical volume between $80,000 and $90,000 is sparse, which could trigger sharper price swings in either direction. Consolidation between $75,000 and $83,000 is viewed as a healthy precursor to higher targets.
🎯 What’s Next for BTC?
🔮 Key Resistance Levels: Watch for a sustained move past $83,000, which could clear a path toward $87,000 and ultimately test the psychological $100,000 milestone.
💼 The Need for Spot Demand: With short-sellers closing out, the market now requires sustained spot demand and continued ETF inflows to sustain upward momentum.
🏷️#CryptoMarketPullback #BitcoinPriceAnalysis #CryptoTradingStrategies
$BTC

4
237

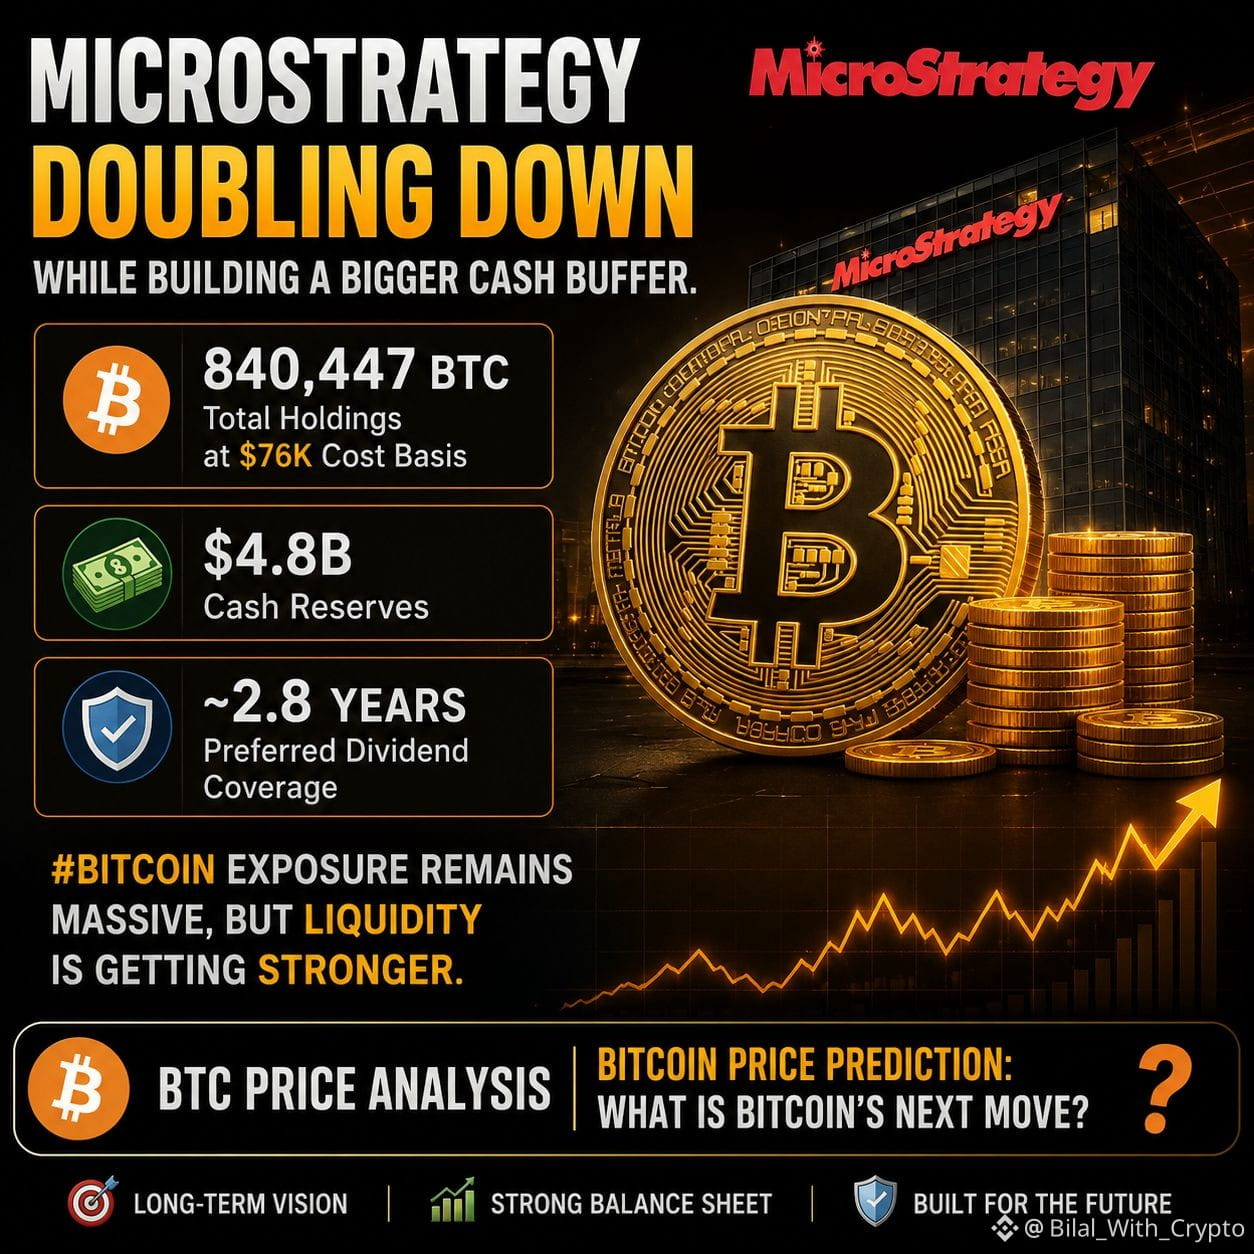
🚨 MicroStrategy is doubling down while building an even bigger cash buffer.
With 840,447 $BTC at an average cost of around $76K and $4.8B in cash reserves, the company now has roughly 2.8 years of preferred dividend coverage.
Massive #Bitcoin exposure, but stronger liquidity too. 👀
The big question: What’s the next move for $BTC ? 📈
#BTC #bitcoin #BitcoinPriceAnalysis #BitcoinPrediction
🚨 MicroStrategy is doubling down while building an even bigger cash buffer.
With 840,447 $BTC at an average cost of around $76K and $4.8B in cash reserves, the company now has roughly 2.8 years of preferred dividend coverage.
Massive #Bitcoin exposure, but stronger liquidity too. 👀
The big question: What’s the next move for $BTC ? 📈
#BTC #bitcoin #BitcoinPriceAnalysis #BitcoinPrediction
With 840,447 $BTC at an average cost of around $76K and $4.8B in cash reserves, the company now has roughly 2.8 years of preferred dividend coverage.
Massive #Bitcoin exposure, but stronger liquidity too. 👀
The big question: What’s the next move for $BTC ? 📈
#BTC #bitcoin #BitcoinPriceAnalysis #BitcoinPrediction
104
·
--
Article
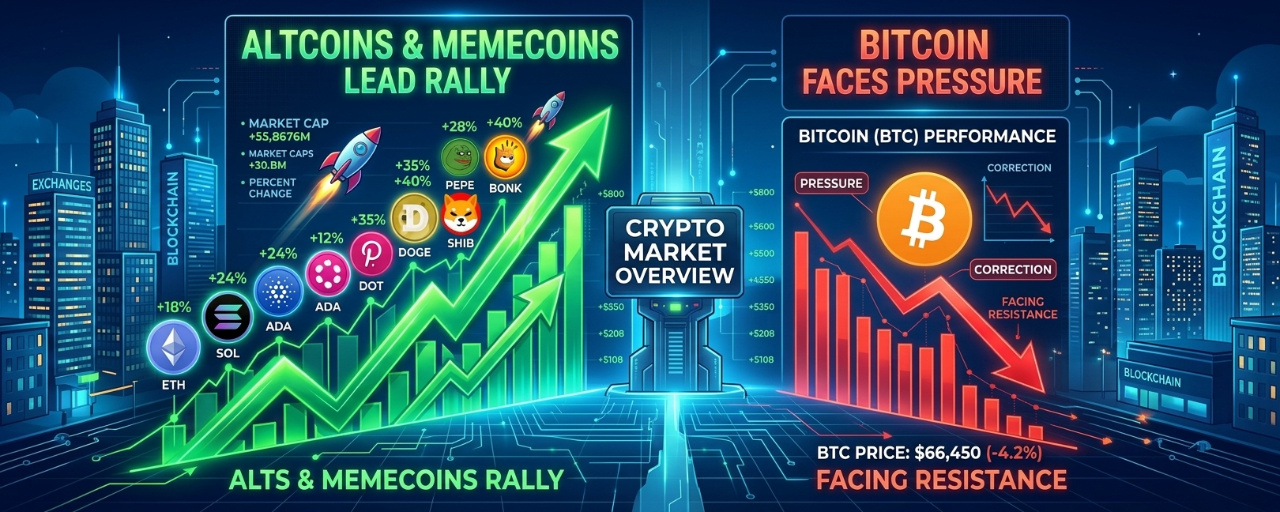
Crypto Market Overview: Altcoins and Memecoins Lead the Rally as Bitcoin Faces Pressure🌍 Macro Crypto Market Overview
The cryptocurrency market is experiencing heightened volatility, with Bitcoin struggling to establish a clear bullish direction while selected altcoins and memecoins are attracting significant speculative interest. Although certain sectors are showing impressive gains, the broader market remains cautious as investors assess macroeconomic conditions, liquidity trends, and the possibility of further downside.
📊 Total Market Capitalization and Bitcoin Dominance
- 💰 Total Market Capitalization: The overall cryptocurrency market capitalization currently stands at approximately $2.58 trillion, highlighting the scale of the digital asset market despite recent selling pressure.
- 🟠 Bitcoin Dominance: Bitcoin continues to dominate the broader crypto market, accounting for approximately 59% of total market capitalization, with an estimated market value of $1.53 trillion.
- 📉 Critical Bitcoin Support: Following volatile movements after the latest Federal Open Market Committee (FOMC) developments, Bitcoin has been struggling around the important support region of $75,600–$76,000.
- 📈 Potential Recovery: If Bitcoin successfully defends this support zone, buyers could regain confidence and attempt to push prices toward higher resistance levels.
- ⚠️ Downside Risk: A decisive breakdown below this region could increase selling pressure, weaken market sentiment, and potentially trigger another wave of liquidations.
- 🔍 Market Direction: Bitcoin's inability to establish strong upward momentum is also limiting confidence in the broader altcoin market.
💵 Macroeconomic Pressure and Federal Reserve Expectations
- 🇺🇸 Strong U.S. Dollar: The U.S. Dollar Index (DXY) remains relatively firm, creating additional pressure on risk-sensitive assets such as Bitcoin, Ethereum, and smaller cryptocurrencies.
- 🏦 Federal Reserve Policy: Interest rate expectations remain an important factor. Investors are closely monitoring Federal Reserve signals to determine whether financial conditions will become more supportive of risk assets.
- 📉 Interest Rate Concerns: If interest rates remain elevated for longer than expected, speculative investments could face additional pressure.
- 📈 Liquidity Expectations: Expectations of easier monetary policy could improve liquidity conditions and encourage investors to return to cryptocurrencies.
- 💥 Massive Liquidations: More than $1 billion in liquidations have reportedly occurred recently, demonstrating how quickly leveraged positions can be wiped out during sudden market movements.
- 📊 Stock Market Correlation: Pressure across high-growth technology stocks and the Nasdaq has added another layer of uncertainty, as cryptocurrencies continue to demonstrate sensitivity to broader financial market conditions.
⛓️ Bitcoin, Ethereum, and Altcoin Market Dynamics
- 🟠 Bitcoin Market Leadership: Bitcoin remains the primary indicator of overall cryptocurrency market direction, with its price movements influencing investor confidence across the altcoin sector.
- 🔵 Ethereum Weakness: Ethereum (ETH) has experienced a pullback, reflecting cautious sentiment toward major alternative cryptocurrencies.
- 🟣 Solana Performance: Solana (SOL) has also faced downward pressure, indicating that even established Layer-1 projects are struggling to maintain bullish momentum.
- 🔄 Capital Rotation: Instead of moving uniformly into established cryptocurrencies, some traders appear to be shifting toward smaller-cap projects, AI-related tokens, and speculative narratives.
- 🤖 AI Crypto Interest: Artificial intelligence-related cryptocurrencies are attracting attention as traders search for emerging opportunities beyond traditional blockchain projects.
- 📈 Tokenized Real-World Assets: Binance-listed bStocks are also gaining visibility, with several tokenized stock-related assets recording notable daily gains.
- ⚠️ Liquidity Risks: Smaller-cap tokens and tokenized assets can experience wider spreads, limited liquidity, sudden price movements, and platform-specific trading restrictions.
🔥 Market Sentiment: Selective Optimism Amid Uncertainty
- ⚖️ Mixed Market Sentiment: The current environment reflects a combination of caution and speculative optimism.
- 📊 Selective Buying: Bitcoin's relatively weak momentum is preventing a broad-based altcoin rally, but individual tokens are still recording substantial gains.
- 💰 Trading Volume: Strong price appreciation accompanied by increasing volume can indicate growing market participation and potentially stronger momentum.
- ⚠️ Profit-Taking Risks: Sharp rallies in low-market-cap tokens can attract momentum buyers but may also create conditions for sudden corrections.
- 🔍 Bitcoin Dominance: Further increases in Bitcoin dominance could indicate that capital is concentrating in Bitcoin rather than spreading into altcoins.
- 🔄 Sector Rotation: AI tokens, memecoins, and tokenized assets are attracting speculative interest despite weakness in major cryptocurrencies.
- 🎯 Overall Outlook: The market is showing selective strength rather than a confirmed broad-based recovery. Traders should remain cautious and pay close attention to Bitcoin's next major move.
🏆 Top Altcoin Gainers on Binance (Overall Market)
Despite broader market uncertainty, several cryptocurrencies and tokenized stock-related assets have delivered impressive gains over the past 24 hours.
Harmony (ONE) is leading the gainers, while Quantinuum-related bStocks and other emerging projects are also attracting speculative buying interest.
🚀 Harmony (ONE) Dominates the Market
- 📈 Impressive Price Performance: Harmony (ONE) is the standout performer among the leading Binance gainers, recording an impressive 60.43% increase over the past 24 hours.
- 💰 Strong Trading Activity: Its trading volume has reached approximately $105.37 million, considerably exceeding the volume of other tokens on this list.
- 🔥 Speculative Interest: The combination of strong price appreciation and substantial trading activity suggests heightened speculative interest.
- ⚠️ Potential Correction: Traders should be careful when approaching such rapid rallies. A sharp increase in price can attract momentum buyers, but it can also create conditions for profit-taking and sudden reversals.
🧪 AI, Emerging Projects, and Tokenized Assets Gain Attention
- 🧬 Quantinuum (QNTB): The tokenized asset recorded a gain of 20.39%, attracting attention from traders interested in tokenized equity-related markets.
- 🔄 Mitosis (MITO): Mitosis advanced by 18.21%, making it another notable performer among the leading gainers.
- 🔐 Cypherpunk Tech (CYPHB): The tokenized asset recorded a 14.23% increase, reflecting growing trading activity in this category.
- 🚀 Rocket Lab (RKLBB): Rocket Lab-related bStocks gained 13.91%, adding to the positive performance of tokenized stock-related assets.
- 🤖 AI and Blockchain Narratives: AI-related projects, emerging blockchain protocols, and tokenized real-world assets are increasingly attracting traders searching for opportunities beyond established cryptocurrencies.
📌 Key Market Takeaway
- 🏆 ONE Leads the Rally: Harmony is leading the overall gainers with a 60.43% increase and more than $105 million in reported 24-hour trading volume.
- 🔥 ACT Also Gains Attention: ACT (Act I: The AI Prophecy) recorded a 12.78% gain alongside approximately $41.50 million in trading volume.
🐸 Top Memecoin Gainers on Binance
The memecoin market is also showing positive momentum, although gains remain relatively selective.
Unlike previous periods when speculative enthusiasm spread across numerous meme-based cryptocurrencies, the latest activity appears concentrated in a smaller group of tokens.
AI-themed memecoins and community-driven projects are attracting attention as traders search for short-term opportunities.
🔥 ACT Leads the Memecoin Rally
- 📈 Strongest Performer: Act I: The AI Prophecy (ACT) is currently leading the listed memecoin gainers, recording a 13.38% increase over the past 24 hours.
- 💰 High Trading Volume: Its reported trading volume of approximately $41.50 million makes it the most actively traded token among the listed memecoin performers.
- 🤖 AI Narrative: The combination of AI-related branding and speculative community interest may be contributing to its trading activity.
- 📊 Market Participation: The relatively strong volume suggests that ACT is attracting considerable attention from short-term traders.
- ⚠️ Volatility Warning: Memecoins are particularly sensitive to market sentiment, social-media trends, and sudden changes in liquidity.
🍌 Community-Driven Tokens Maintain Positive Momentum
- 🍌 Banana For Scale (BANANAS31): The token gained 4.63%, maintaining positive momentum in the memecoin category.
- 🕌 Mubarak (MUBARAK): The token advanced by 3.94%, with reported trading volume of $10.19 million.
- 🚀 Binance Life: The token recorded a 3.82% increase, maintaining its position among the leading memecoin gainers.
- 📚 Tutorial (TUT): TUT gained 2.90%, showing relatively modest positive movement compared with the leading performers.
- ⚖️ Sector Performance: Although these gains are smaller than ACT's rally, they demonstrate that buying interest has not disappeared entirely from the memecoin sector.
- 🔍 Market Observation: The relatively limited gains across most of these tokens suggest that speculative enthusiasm remains selective rather than widespread.
📌 Key Memecoin Takeaway
- 🏆 ACT Takes the Lead: ACT is outperforming its competitors, leading the listed memecoin gainers in both percentage appreciation and reported 24-hour trading volume.
- 💵 Strong Liquidity Activity: Its $41.50 million trading volume indicates considerably stronger market activity compared with the other tokens in this group.
🎯 Final Market Conclusion
- 🌍 Overall Market: The crypto market is showing a mixed picture, with Bitcoin facing pressure from broader macroeconomic uncertainty while selected altcoins and memecoins continue to attract speculative capital.
- 🟠 Bitcoin: The $75,600–$76,000 support region remains an important area to monitor for the next major market move.
- 🚀 Top Altcoin Performer: Harmony (ONE) is the strongest performer among the highlighted overall Binance gainers.
- 🔥 Top Memecoin Performer: ACT is leading the memecoin category in both percentage gains and reported trading volume.
- 📊 Market Momentum: The broader market has not yet demonstrated convincing signs of a sustained recovery.
- 🛡️ Trading Strategy: Day traders should remain disciplined, monitor volume confirmation, identify important support and resistance zones, and avoid chasing assets after unusually large price increases.
- ⚠️ Risk Management: Strong short-term gains do not necessarily indicate a sustainable bullish trend. Always consider liquidity, volatility, and downside risk before entering a trade.
🔥#CryptoMarketAnalysis #CryptocurrencyMarketToday #BitcoinMarketOutlook #BitcoinPriceAnalysis #BinanceTopGainers
$ONE $QNTB $MITO
{spot}(MITOUSDT)
{spot}(QNTBUSDT)
{spot}(ONEUSDT)
Crypto Market Overview: Altcoins and Memecoins Lead the Rally as Bitcoin Faces Pressure
🌍 Macro Crypto Market Overview
The cryptocurrency market is experiencing heightened volatility, with Bitcoin struggling to establish a clear bullish direction while selected altcoins and memecoins are attracting significant speculative interest. Although certain sectors are showing impressive gains, the broader market remains cautious as investors assess macroeconomic conditions, liquidity trends, and the possibility of further downside.
📊 Total Market Capitalization and Bitcoin Dominance
- 💰 Total Market Capitalization: The overall cryptocurrency market capitalization currently stands at approximately $2.58 trillion, highlighting the scale of the digital asset market despite recent selling pressure.
- 🟠 Bitcoin Dominance: Bitcoin continues to dominate the broader crypto market, accounting for approximately 59% of total market capitalization, with an estimated market value of $1.53 trillion.
- 📉 Critical Bitcoin Support: Following volatile movements after the latest Federal Open Market Committee (FOMC) developments, Bitcoin has been struggling around the important support region of $75,600–$76,000.
- 📈 Potential Recovery: If Bitcoin successfully defends this support zone, buyers could regain confidence and attempt to push prices toward higher resistance levels.
- ⚠️ Downside Risk: A decisive breakdown below this region could increase selling pressure, weaken market sentiment, and potentially trigger another wave of liquidations.
- 🔍 Market Direction: Bitcoin's inability to establish strong upward momentum is also limiting confidence in the broader altcoin market.
💵 Macroeconomic Pressure and Federal Reserve Expectations
- 🇺🇸 Strong U.S. Dollar: The U.S. Dollar Index (DXY) remains relatively firm, creating additional pressure on risk-sensitive assets such as Bitcoin, Ethereum, and smaller cryptocurrencies.
- 🏦 Federal Reserve Policy: Interest rate expectations remain an important factor. Investors are closely monitoring Federal Reserve signals to determine whether financial conditions will become more supportive of risk assets.
- 📉 Interest Rate Concerns: If interest rates remain elevated for longer than expected, speculative investments could face additional pressure.
- 📈 Liquidity Expectations: Expectations of easier monetary policy could improve liquidity conditions and encourage investors to return to cryptocurrencies.
- 💥 Massive Liquidations: More than $1 billion in liquidations have reportedly occurred recently, demonstrating how quickly leveraged positions can be wiped out during sudden market movements.
- 📊 Stock Market Correlation: Pressure across high-growth technology stocks and the Nasdaq has added another layer of uncertainty, as cryptocurrencies continue to demonstrate sensitivity to broader financial market conditions.
⛓️ Bitcoin, Ethereum, and Altcoin Market Dynamics
- 🟠 Bitcoin Market Leadership: Bitcoin remains the primary indicator of overall cryptocurrency market direction, with its price movements influencing investor confidence across the altcoin sector.
- 🔵 Ethereum Weakness: Ethereum (ETH) has experienced a pullback, reflecting cautious sentiment toward major alternative cryptocurrencies.
- 🟣 Solana Performance: Solana (SOL) has also faced downward pressure, indicating that even established Layer-1 projects are struggling to maintain bullish momentum.
- 🔄 Capital Rotation: Instead of moving uniformly into established cryptocurrencies, some traders appear to be shifting toward smaller-cap projects, AI-related tokens, and speculative narratives.
- 🤖 AI Crypto Interest: Artificial intelligence-related cryptocurrencies are attracting attention as traders search for emerging opportunities beyond traditional blockchain projects.
- 📈 Tokenized Real-World Assets: Binance-listed bStocks are also gaining visibility, with several tokenized stock-related assets recording notable daily gains.
- ⚠️ Liquidity Risks: Smaller-cap tokens and tokenized assets can experience wider spreads, limited liquidity, sudden price movements, and platform-specific trading restrictions.
🔥 Market Sentiment: Selective Optimism Amid Uncertainty
- ⚖️ Mixed Market Sentiment: The current environment reflects a combination of caution and speculative optimism.
- 📊 Selective Buying: Bitcoin's relatively weak momentum is preventing a broad-based altcoin rally, but individual tokens are still recording substantial gains.
- 💰 Trading Volume: Strong price appreciation accompanied by increasing volume can indicate growing market participation and potentially stronger momentum.
- ⚠️ Profit-Taking Risks: Sharp rallies in low-market-cap tokens can attract momentum buyers but may also create conditions for sudden corrections.
- 🔍 Bitcoin Dominance: Further increases in Bitcoin dominance could indicate that capital is concentrating in Bitcoin rather than spreading into altcoins.
- 🔄 Sector Rotation: AI tokens, memecoins, and tokenized assets are attracting speculative interest despite weakness in major cryptocurrencies.
- 🎯 Overall Outlook: The market is showing selective strength rather than a confirmed broad-based recovery. Traders should remain cautious and pay close attention to Bitcoin's next major move.
🏆 Top Altcoin Gainers on Binance (Overall Market)
Despite broader market uncertainty, several cryptocurrencies and tokenized stock-related assets have delivered impressive gains over the past 24 hours.
Harmony (ONE) is leading the gainers, while Quantinuum-related bStocks and other emerging projects are also attracting speculative buying interest.
🚀 Harmony (ONE) Dominates the Market
- 📈 Impressive Price Performance: Harmony (ONE) is the standout performer among the leading Binance gainers, recording an impressive 60.43% increase over the past 24 hours.
- 💰 Strong Trading Activity: Its trading volume has reached approximately $105.37 million, considerably exceeding the volume of other tokens on this list.
- 🔥 Speculative Interest: The combination of strong price appreciation and substantial trading activity suggests heightened speculative interest.
- ⚠️ Potential Correction: Traders should be careful when approaching such rapid rallies. A sharp increase in price can attract momentum buyers, but it can also create conditions for profit-taking and sudden reversals.
🧪 AI, Emerging Projects, and Tokenized Assets Gain Attention
- 🧬 Quantinuum (QNTB): The tokenized asset recorded a gain of 20.39%, attracting attention from traders interested in tokenized equity-related markets.
- 🔄 Mitosis (MITO): Mitosis advanced by 18.21%, making it another notable performer among the leading gainers.
- 🔐 Cypherpunk Tech (CYPHB): The tokenized asset recorded a 14.23% increase, reflecting growing trading activity in this category.
- 🚀 Rocket Lab (RKLBB): Rocket Lab-related bStocks gained 13.91%, adding to the positive performance of tokenized stock-related assets.
- 🤖 AI and Blockchain Narratives: AI-related projects, emerging blockchain protocols, and tokenized real-world assets are increasingly attracting traders searching for opportunities beyond established cryptocurrencies.
📌 Key Market Takeaway
- 🏆 ONE Leads the Rally: Harmony is leading the overall gainers with a 60.43% increase and more than $105 million in reported 24-hour trading volume.
- 🔥 ACT Also Gains Attention: ACT (Act I: The AI Prophecy) recorded a 12.78% gain alongside approximately $41.50 million in trading volume.
🐸 Top Memecoin Gainers on Binance
The memecoin market is also showing positive momentum, although gains remain relatively selective.
Unlike previous periods when speculative enthusiasm spread across numerous meme-based cryptocurrencies, the latest activity appears concentrated in a smaller group of tokens.
AI-themed memecoins and community-driven projects are attracting attention as traders search for short-term opportunities.
🔥 ACT Leads the Memecoin Rally
- 📈 Strongest Performer: Act I: The AI Prophecy (ACT) is currently leading the listed memecoin gainers, recording a 13.38% increase over the past 24 hours.
- 💰 High Trading Volume: Its reported trading volume of approximately $41.50 million makes it the most actively traded token among the listed memecoin performers.
- 🤖 AI Narrative: The combination of AI-related branding and speculative community interest may be contributing to its trading activity.
- 📊 Market Participation: The relatively strong volume suggests that ACT is attracting considerable attention from short-term traders.
- ⚠️ Volatility Warning: Memecoins are particularly sensitive to market sentiment, social-media trends, and sudden changes in liquidity.
🍌 Community-Driven Tokens Maintain Positive Momentum
- 🍌 Banana For Scale (BANANAS31): The token gained 4.63%, maintaining positive momentum in the memecoin category.
- 🕌 Mubarak (MUBARAK): The token advanced by 3.94%, with reported trading volume of $10.19 million.
- 🚀 Binance Life: The token recorded a 3.82% increase, maintaining its position among the leading memecoin gainers.
- 📚 Tutorial (TUT): TUT gained 2.90%, showing relatively modest positive movement compared with the leading performers.
- ⚖️ Sector Performance: Although these gains are smaller than ACT's rally, they demonstrate that buying interest has not disappeared entirely from the memecoin sector.
- 🔍 Market Observation: The relatively limited gains across most of these tokens suggest that speculative enthusiasm remains selective rather than widespread.
📌 Key Memecoin Takeaway
- 🏆 ACT Takes the Lead: ACT is outperforming its competitors, leading the listed memecoin gainers in both percentage appreciation and reported 24-hour trading volume.
- 💵 Strong Liquidity Activity: Its $41.50 million trading volume indicates considerably stronger market activity compared with the other tokens in this group.
🎯 Final Market Conclusion
- 🌍 Overall Market: The crypto market is showing a mixed picture, with Bitcoin facing pressure from broader macroeconomic uncertainty while selected altcoins and memecoins continue to attract speculative capital.
- 🟠 Bitcoin: The $75,600–$76,000 support region remains an important area to monitor for the next major market move.
- 🚀 Top Altcoin Performer: Harmony (ONE) is the strongest performer among the highlighted overall Binance gainers.
- 🔥 Top Memecoin Performer: ACT is leading the memecoin category in both percentage gains and reported trading volume.
- 📊 Market Momentum: The broader market has not yet demonstrated convincing signs of a sustained recovery.
- 🛡️ Trading Strategy: Day traders should remain disciplined, monitor volume confirmation, identify important support and resistance zones, and avoid chasing assets after unusually large price increases.
- ⚠️ Risk Management: Strong short-term gains do not necessarily indicate a sustainable bullish trend. Always consider liquidity, volatility, and downside risk before entering a trade.
🔥#CryptoMarketAnalysis #CryptocurrencyMarketToday #BitcoinMarketOutlook #BitcoinPriceAnalysis #BinanceTopGainers
$ONE $QNTB $MITO
The cryptocurrency market is experiencing heightened volatility, with Bitcoin struggling to establish a clear bullish direction while selected altcoins and memecoins are attracting significant speculative interest. Although certain sectors are showing impressive gains, the broader market remains cautious as investors assess macroeconomic conditions, liquidity trends, and the possibility of further downside.
📊 Total Market Capitalization and Bitcoin Dominance
- 💰 Total Market Capitalization: The overall cryptocurrency market capitalization currently stands at approximately $2.58 trillion, highlighting the scale of the digital asset market despite recent selling pressure.
- 🟠 Bitcoin Dominance: Bitcoin continues to dominate the broader crypto market, accounting for approximately 59% of total market capitalization, with an estimated market value of $1.53 trillion.
- 📉 Critical Bitcoin Support: Following volatile movements after the latest Federal Open Market Committee (FOMC) developments, Bitcoin has been struggling around the important support region of $75,600–$76,000.
- 📈 Potential Recovery: If Bitcoin successfully defends this support zone, buyers could regain confidence and attempt to push prices toward higher resistance levels.
- ⚠️ Downside Risk: A decisive breakdown below this region could increase selling pressure, weaken market sentiment, and potentially trigger another wave of liquidations.
- 🔍 Market Direction: Bitcoin's inability to establish strong upward momentum is also limiting confidence in the broader altcoin market.
💵 Macroeconomic Pressure and Federal Reserve Expectations
- 🇺🇸 Strong U.S. Dollar: The U.S. Dollar Index (DXY) remains relatively firm, creating additional pressure on risk-sensitive assets such as Bitcoin, Ethereum, and smaller cryptocurrencies.
- 🏦 Federal Reserve Policy: Interest rate expectations remain an important factor. Investors are closely monitoring Federal Reserve signals to determine whether financial conditions will become more supportive of risk assets.
- 📉 Interest Rate Concerns: If interest rates remain elevated for longer than expected, speculative investments could face additional pressure.
- 📈 Liquidity Expectations: Expectations of easier monetary policy could improve liquidity conditions and encourage investors to return to cryptocurrencies.
- 💥 Massive Liquidations: More than $1 billion in liquidations have reportedly occurred recently, demonstrating how quickly leveraged positions can be wiped out during sudden market movements.
- 📊 Stock Market Correlation: Pressure across high-growth technology stocks and the Nasdaq has added another layer of uncertainty, as cryptocurrencies continue to demonstrate sensitivity to broader financial market conditions.
⛓️ Bitcoin, Ethereum, and Altcoin Market Dynamics
- 🟠 Bitcoin Market Leadership: Bitcoin remains the primary indicator of overall cryptocurrency market direction, with its price movements influencing investor confidence across the altcoin sector.
- 🔵 Ethereum Weakness: Ethereum (ETH) has experienced a pullback, reflecting cautious sentiment toward major alternative cryptocurrencies.
- 🟣 Solana Performance: Solana (SOL) has also faced downward pressure, indicating that even established Layer-1 projects are struggling to maintain bullish momentum.
- 🔄 Capital Rotation: Instead of moving uniformly into established cryptocurrencies, some traders appear to be shifting toward smaller-cap projects, AI-related tokens, and speculative narratives.
- 🤖 AI Crypto Interest: Artificial intelligence-related cryptocurrencies are attracting attention as traders search for emerging opportunities beyond traditional blockchain projects.
- 📈 Tokenized Real-World Assets: Binance-listed bStocks are also gaining visibility, with several tokenized stock-related assets recording notable daily gains.
- ⚠️ Liquidity Risks: Smaller-cap tokens and tokenized assets can experience wider spreads, limited liquidity, sudden price movements, and platform-specific trading restrictions.
🔥 Market Sentiment: Selective Optimism Amid Uncertainty
- ⚖️ Mixed Market Sentiment: The current environment reflects a combination of caution and speculative optimism.
- 📊 Selective Buying: Bitcoin's relatively weak momentum is preventing a broad-based altcoin rally, but individual tokens are still recording substantial gains.
- 💰 Trading Volume: Strong price appreciation accompanied by increasing volume can indicate growing market participation and potentially stronger momentum.
- ⚠️ Profit-Taking Risks: Sharp rallies in low-market-cap tokens can attract momentum buyers but may also create conditions for sudden corrections.
- 🔍 Bitcoin Dominance: Further increases in Bitcoin dominance could indicate that capital is concentrating in Bitcoin rather than spreading into altcoins.
- 🔄 Sector Rotation: AI tokens, memecoins, and tokenized assets are attracting speculative interest despite weakness in major cryptocurrencies.
- 🎯 Overall Outlook: The market is showing selective strength rather than a confirmed broad-based recovery. Traders should remain cautious and pay close attention to Bitcoin's next major move.
🏆 Top Altcoin Gainers on Binance (Overall Market)
Despite broader market uncertainty, several cryptocurrencies and tokenized stock-related assets have delivered impressive gains over the past 24 hours.
Harmony (ONE) is leading the gainers, while Quantinuum-related bStocks and other emerging projects are also attracting speculative buying interest.
🚀 Harmony (ONE) Dominates the Market
- 📈 Impressive Price Performance: Harmony (ONE) is the standout performer among the leading Binance gainers, recording an impressive 60.43% increase over the past 24 hours.
- 💰 Strong Trading Activity: Its trading volume has reached approximately $105.37 million, considerably exceeding the volume of other tokens on this list.
- 🔥 Speculative Interest: The combination of strong price appreciation and substantial trading activity suggests heightened speculative interest.
- ⚠️ Potential Correction: Traders should be careful when approaching such rapid rallies. A sharp increase in price can attract momentum buyers, but it can also create conditions for profit-taking and sudden reversals.
🧪 AI, Emerging Projects, and Tokenized Assets Gain Attention
- 🧬 Quantinuum (QNTB): The tokenized asset recorded a gain of 20.39%, attracting attention from traders interested in tokenized equity-related markets.
- 🔄 Mitosis (MITO): Mitosis advanced by 18.21%, making it another notable performer among the leading gainers.
- 🔐 Cypherpunk Tech (CYPHB): The tokenized asset recorded a 14.23% increase, reflecting growing trading activity in this category.
- 🚀 Rocket Lab (RKLBB): Rocket Lab-related bStocks gained 13.91%, adding to the positive performance of tokenized stock-related assets.
- 🤖 AI and Blockchain Narratives: AI-related projects, emerging blockchain protocols, and tokenized real-world assets are increasingly attracting traders searching for opportunities beyond established cryptocurrencies.
📌 Key Market Takeaway
- 🏆 ONE Leads the Rally: Harmony is leading the overall gainers with a 60.43% increase and more than $105 million in reported 24-hour trading volume.
- 🔥 ACT Also Gains Attention: ACT (Act I: The AI Prophecy) recorded a 12.78% gain alongside approximately $41.50 million in trading volume.
🐸 Top Memecoin Gainers on Binance
The memecoin market is also showing positive momentum, although gains remain relatively selective.
Unlike previous periods when speculative enthusiasm spread across numerous meme-based cryptocurrencies, the latest activity appears concentrated in a smaller group of tokens.
AI-themed memecoins and community-driven projects are attracting attention as traders search for short-term opportunities.
🔥 ACT Leads the Memecoin Rally
- 📈 Strongest Performer: Act I: The AI Prophecy (ACT) is currently leading the listed memecoin gainers, recording a 13.38% increase over the past 24 hours.
- 💰 High Trading Volume: Its reported trading volume of approximately $41.50 million makes it the most actively traded token among the listed memecoin performers.
- 🤖 AI Narrative: The combination of AI-related branding and speculative community interest may be contributing to its trading activity.
- 📊 Market Participation: The relatively strong volume suggests that ACT is attracting considerable attention from short-term traders.
- ⚠️ Volatility Warning: Memecoins are particularly sensitive to market sentiment, social-media trends, and sudden changes in liquidity.
🍌 Community-Driven Tokens Maintain Positive Momentum
- 🍌 Banana For Scale (BANANAS31): The token gained 4.63%, maintaining positive momentum in the memecoin category.
- 🕌 Mubarak (MUBARAK): The token advanced by 3.94%, with reported trading volume of $10.19 million.
- 🚀 Binance Life: The token recorded a 3.82% increase, maintaining its position among the leading memecoin gainers.
- 📚 Tutorial (TUT): TUT gained 2.90%, showing relatively modest positive movement compared with the leading performers.
- ⚖️ Sector Performance: Although these gains are smaller than ACT's rally, they demonstrate that buying interest has not disappeared entirely from the memecoin sector.
- 🔍 Market Observation: The relatively limited gains across most of these tokens suggest that speculative enthusiasm remains selective rather than widespread.
📌 Key Memecoin Takeaway
- 🏆 ACT Takes the Lead: ACT is outperforming its competitors, leading the listed memecoin gainers in both percentage appreciation and reported 24-hour trading volume.
- 💵 Strong Liquidity Activity: Its $41.50 million trading volume indicates considerably stronger market activity compared with the other tokens in this group.
🎯 Final Market Conclusion
- 🌍 Overall Market: The crypto market is showing a mixed picture, with Bitcoin facing pressure from broader macroeconomic uncertainty while selected altcoins and memecoins continue to attract speculative capital.
- 🟠 Bitcoin: The $75,600–$76,000 support region remains an important area to monitor for the next major market move.
- 🚀 Top Altcoin Performer: Harmony (ONE) is the strongest performer among the highlighted overall Binance gainers.
- 🔥 Top Memecoin Performer: ACT is leading the memecoin category in both percentage gains and reported trading volume.
- 📊 Market Momentum: The broader market has not yet demonstrated convincing signs of a sustained recovery.
- 🛡️ Trading Strategy: Day traders should remain disciplined, monitor volume confirmation, identify important support and resistance zones, and avoid chasing assets after unusually large price increases.
- ⚠️ Risk Management: Strong short-term gains do not necessarily indicate a sustainable bullish trend. Always consider liquidity, volatility, and downside risk before entering a trade.
🔥#CryptoMarketAnalysis #CryptocurrencyMarketToday #BitcoinMarketOutlook #BitcoinPriceAnalysis #BinanceTopGainers
$ONE $QNTB $MITO
1
227

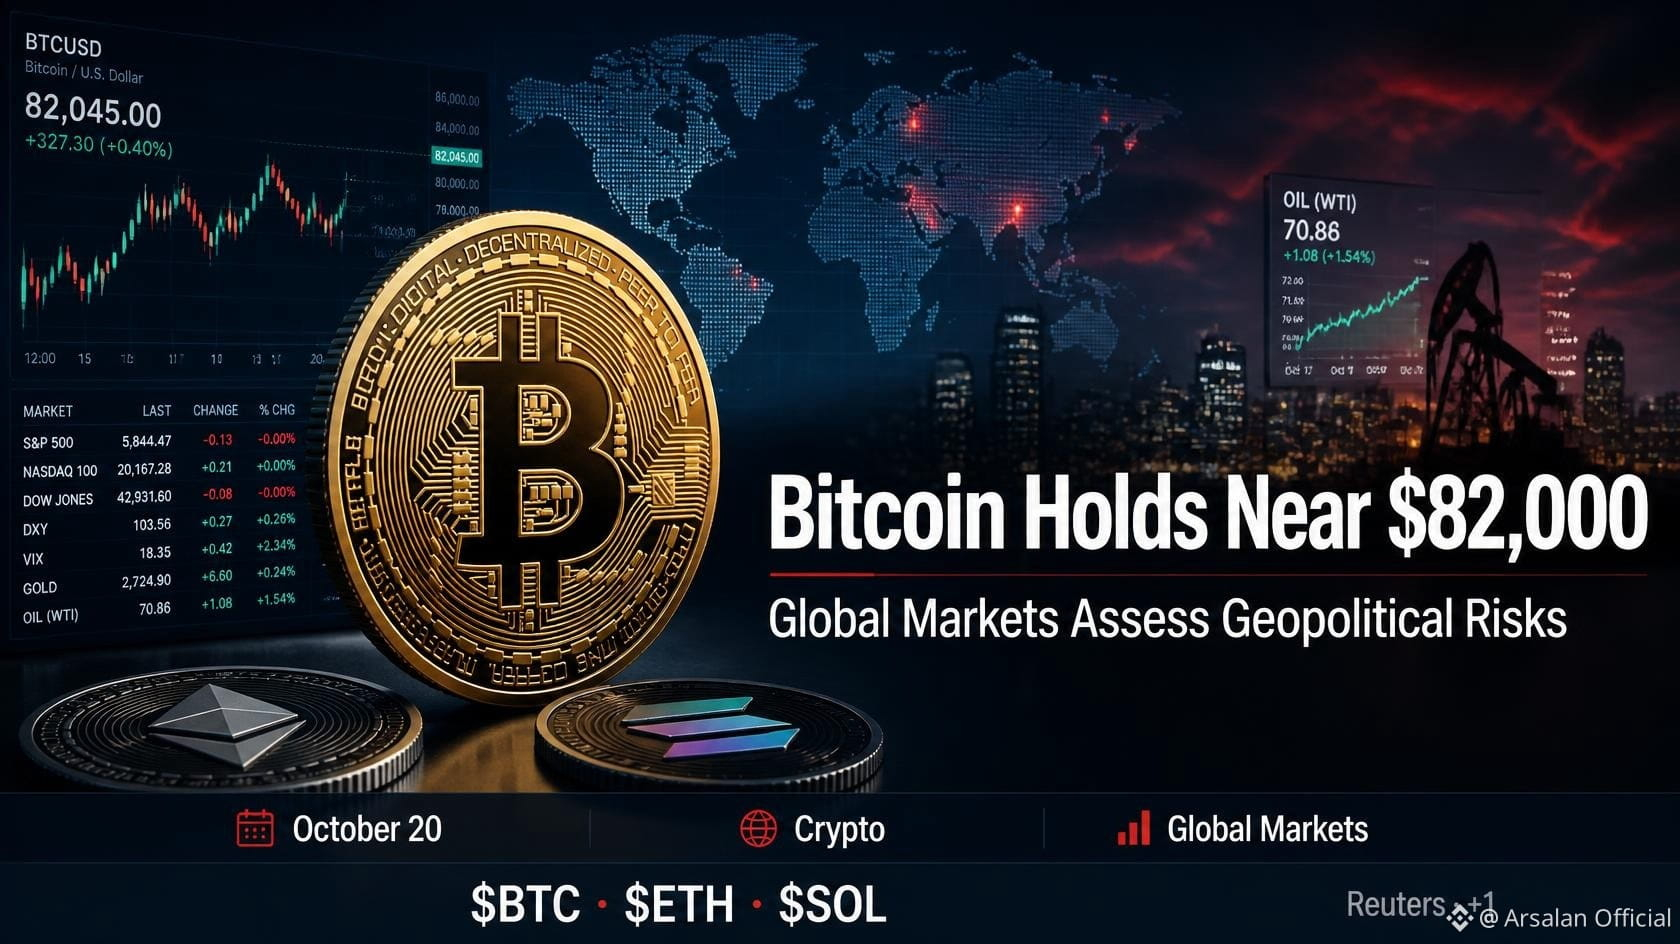
🚨 Bitcoin Holds Near $82,000 as Global Markets Assess Geopolitical Risks
Bitcoin traded around $81,900 on October 20, while Ethereum edged higher as currency markets showed a modest improvement in risk appetite. Investors are also monitoring geopolitical tensions, oil-market uncertainty, and shifting expectations for global growth. Whether crypto prices can sustain their momentum will depend on continued demand and broader market conditions.
Reuters
+1
Hashtags
#BitcoinMarketUpdate #CryptoMarketSentiment #BitcoinPriceAnalysis #EthereumMarketWatch #GlobalFinancialMarkets
Tokens
$BTC · $ETH · $SOL
🚨 Bitcoin Holds Near $82,000 as Global Markets Assess Geopolitical Risks
Bitcoin traded around $81,900 on October 20, while Ethereum edged higher as currency markets showed a modest improvement in risk appetite. Investors are also monitoring geopolitical tensions, oil-market uncertainty, and shifting expectations for global growth. Whether crypto prices can sustain their momentum will depend on continued demand and broader market conditions.
Reuters
+1
Hashtags
#BitcoinMarketUpdate #CryptoMarketSentiment #BitcoinPriceAnalysis #EthereumMarketWatch #GlobalFinancialMarkets
Tokens
$BTC · $ETH · $SOL
Bitcoin traded around $81,900 on October 20, while Ethereum edged higher as currency markets showed a modest improvement in risk appetite. Investors are also monitoring geopolitical tensions, oil-market uncertainty, and shifting expectations for global growth. Whether crypto prices can sustain their momentum will depend on continued demand and broader market conditions.
Reuters
+1
Hashtags
#BitcoinMarketUpdate #CryptoMarketSentiment #BitcoinPriceAnalysis #EthereumMarketWatch #GlobalFinancialMarkets
Tokens
$BTC · $ETH · $SOL
1
140

·
--
$BTC
{spot}(BTCUSDT)
🚨 **BREAKING: BITCOIN PRIVACY COULD ENTER A NEW ERA!** 🟠🔐
🇬🇧 Researchers at **Imperial College London** have proposed a framework aimed at enabling post-quantum private transfers on the Bitcoin network — potentially without requiring a soft fork.
⚡ **WHY THIS MATTERS:**
🔹 **Quantum Resistance:** Explores ways to strengthen Bitcoin’s privacy against potential future quantum-computing threats.
🔹 **Private Transfers:** Aims to improve transaction confidentiality while preserving Bitcoin’s existing infrastructure.
🔹 **No Soft Fork Required:** The proposed approach could offer a path to privacy improvements without changing Bitcoin’s consensus rules through a soft fork.
🔹 **Future of Bitcoin:** As quantum computing advances, researchers are exploring how blockchain networks can prepare for emerging cryptographic risks.
👀 **THE BIG QUESTION:** Could this research help shape Bitcoin’s next generation of privacy and security?
⚠️ **IMPORTANT:** This is a research proposal, not confirmation that Bitcoin has already implemented quantum-resistant private transfers. Practical deployment, security testing, and adoption remain key considerations.
₿ **Bitcoin’s future may depend on how well it prepares for tomorrow’s threats.**
#Bitcoin #BTC #CryptoNews #QuantumComputingThreat #blockchains #BitcoinPriceAnalysis #AyanXAlpha
$BTC
🚨 **BREAKING: BITCOIN PRIVACY COULD ENTER A NEW ERA!** 🟠🔐
🇬🇧 Researchers at **Imperial College London** have proposed a framework aimed at enabling post-quantum private transfers on the Bitcoin network — potentially without requiring a soft fork.
⚡ **WHY THIS MATTERS:**
🔹 **Quantum Resistance:** Explores ways to strengthen Bitcoin’s privacy against potential future quantum-computing threats.
🔹 **Private Transfers:** Aims to improve transaction confidentiality while preserving Bitcoin’s existing infrastructure.
🔹 **No Soft Fork Required:** The proposed approach could offer a path to privacy improvements without changing Bitcoin’s consensus rules through a soft fork.
🔹 **Future of Bitcoin:** As quantum computing advances, researchers are exploring how blockchain networks can prepare for emerging cryptographic risks.
👀 **THE BIG QUESTION:** Could this research help shape Bitcoin’s next generation of privacy and security?
⚠️ **IMPORTANT:** This is a research proposal, not confirmation that Bitcoin has already implemented quantum-resistant private transfers. Practical deployment, security testing, and adoption remain key considerations.
₿ **Bitcoin’s future may depend on how well it prepares for tomorrow’s threats.**
#Bitcoin #BTC #CryptoNews #QuantumComputingThreat #blockchains #BitcoinPriceAnalysis #AyanXAlpha
🚨 **BREAKING: BITCOIN PRIVACY COULD ENTER A NEW ERA!** 🟠🔐
🇬🇧 Researchers at **Imperial College London** have proposed a framework aimed at enabling post-quantum private transfers on the Bitcoin network — potentially without requiring a soft fork.
⚡ **WHY THIS MATTERS:**
🔹 **Quantum Resistance:** Explores ways to strengthen Bitcoin’s privacy against potential future quantum-computing threats.
🔹 **Private Transfers:** Aims to improve transaction confidentiality while preserving Bitcoin’s existing infrastructure.
🔹 **No Soft Fork Required:** The proposed approach could offer a path to privacy improvements without changing Bitcoin’s consensus rules through a soft fork.
🔹 **Future of Bitcoin:** As quantum computing advances, researchers are exploring how blockchain networks can prepare for emerging cryptographic risks.
👀 **THE BIG QUESTION:** Could this research help shape Bitcoin’s next generation of privacy and security?
⚠️ **IMPORTANT:** This is a research proposal, not confirmation that Bitcoin has already implemented quantum-resistant private transfers. Practical deployment, security testing, and adoption remain key considerations.
₿ **Bitcoin’s future may depend on how well it prepares for tomorrow’s threats.**
#Bitcoin #BTC #CryptoNews #QuantumComputingThreat #blockchains #BitcoinPriceAnalysis #AyanXAlpha

30

·
--
Bullish
📊 Gen Z & Crypto: The Shift Is Already Here
73% of Gen Z & 77% of Millennials are interested in digital currencies like $BTC.
In the US, 28% of Gen Z already own crypto — the fastest-growing demographic.
Small businesses report 82% of crypto-related inquiries come from Gen Z customers.
In Nigeria, 74% of crypto holders are under 30.
This isn't just adoption — it's a generational wealth transfer in motion.
🔥 Trending now:
$SWEAT +425%
$LAYER +54%
$BILL +16%
$LO +6%
How quickly do you think we reach the point where crypto is basic for everyone?
👇 Drop your prediction below.
#BTC #CryptoAdoption #GenZ #WealthTransfer #BitcoinPriceAnalysis
$BTC
{spot}(BTCUSDT)
📊 Gen Z & Crypto: The Shift Is Already Here
73% of Gen Z & 77% of Millennials are interested in digital currencies like $BTC .
In the US, 28% of Gen Z already own crypto — the fastest-growing demographic.
Small businesses report 82% of crypto-related inquiries come from Gen Z customers.
In Nigeria, 74% of crypto holders are under 30.
This isn't just adoption — it's a generational wealth transfer in motion.
🔥 Trending now:
$SWEAT +425%
$LAYER +54%
$BILL +16%
$LO +6%
How quickly do you think we reach the point where crypto is basic for everyone?
👇 Drop your prediction below.
#BTC #CryptoAdoption #GenZ #WealthTransfer #BitcoinPriceAnalysis
$BTC
73% of Gen Z & 77% of Millennials are interested in digital currencies like $BTC .
In the US, 28% of Gen Z already own crypto — the fastest-growing demographic.
Small businesses report 82% of crypto-related inquiries come from Gen Z customers.
In Nigeria, 74% of crypto holders are under 30.
This isn't just adoption — it's a generational wealth transfer in motion.
🔥 Trending now:
$SWEAT +425%
$LAYER +54%
$BILL +16%
$LO +6%
How quickly do you think we reach the point where crypto is basic for everyone?
👇 Drop your prediction below.
#BTC #CryptoAdoption #GenZ #WealthTransfer #BitcoinPriceAnalysis
$BTC
54
·
--
₿ Bitcoin Pulls Back as Bond Yields Surge
📉 Bitcoin slipped to around $84,400, down about 2.2% in 24 hours, as a sharp rise in U.S. Treasury yields pressured risk assets.
📊 Markets Under Pressure
🏦 The 10-year U.S. Treasury yield jumped 18 basis points, reaching its highest level since 2007.
📉 The Nasdaq fell 1.15%, while the S&P 500 declined 0.7% as borrowing costs increased.
💼 Crypto-related stocks also weakened, with Strategy (MSTR) down 3.1%, Coinbase (COIN) down 1.5%, and Circle (CRCL) down 3%.
🛢️ Oil Moves Higher
⛽ Oil prices rebounded 2.5%, reversing a recent decline, while the energy sector gained as broader markets faced selling pressure.
⚠️ Treasury & Debt Concerns
💰 Analysts highlighted concerns that rising yields could increase the U.S. government's borrowing and interest costs.
🔄 Some market observers warn that higher rates, larger deficits and increasing Treasury issuance could create additional pressure across financial markets.
🔍 Bitcoin Outlook
📌 Bitcoin remains sensitive to Treasury yields, interest-rate expectations and broader risk sentiment.
📉 Continued yield strength could keep pressure on BTC and other risk assets, while stabilization in bond markets could help improve sentiment.
⚠️ Disclaimer: This article is for informational purposes only and should not be considered financial or investment advice.
🏷️#BitcoinMarketUpdate #BitcoinPriceAnalysis #CryptoMarketOutlook #TreasuryYieldSurge #USBondMarket
$BTC
{spot}(BTCUSDT)
₿ Bitcoin Pulls Back as Bond Yields Surge
📉 Bitcoin slipped to around $84,400, down about 2.2% in 24 hours, as a sharp rise in U.S. Treasury yields pressured risk assets.
📊 Markets Under Pressure
🏦 The 10-year U.S. Treasury yield jumped 18 basis points, reaching its highest level since 2007.
📉 The Nasdaq fell 1.15%, while the S&P 500 declined 0.7% as borrowing costs increased.
💼 Crypto-related stocks also weakened, with Strategy (MSTR) down 3.1%, Coinbase (COIN) down 1.5%, and Circle (CRCL) down 3%.
🛢️ Oil Moves Higher
⛽ Oil prices rebounded 2.5%, reversing a recent decline, while the energy sector gained as broader markets faced selling pressure.
⚠️ Treasury & Debt Concerns
💰 Analysts highlighted concerns that rising yields could increase the U.S. government's borrowing and interest costs.
🔄 Some market observers warn that higher rates, larger deficits and increasing Treasury issuance could create additional pressure across financial markets.
🔍 Bitcoin Outlook
📌 Bitcoin remains sensitive to Treasury yields, interest-rate expectations and broader risk sentiment.
📉 Continued yield strength could keep pressure on BTC and other risk assets, while stabilization in bond markets could help improve sentiment.
⚠️ Disclaimer: This article is for informational purposes only and should not be considered financial or investment advice.
🏷️#BitcoinMarketUpdate #BitcoinPriceAnalysis #CryptoMarketOutlook #TreasuryYieldSurge #USBondMarket
$BTC
📉 Bitcoin slipped to around $84,400, down about 2.2% in 24 hours, as a sharp rise in U.S. Treasury yields pressured risk assets.
📊 Markets Under Pressure
🏦 The 10-year U.S. Treasury yield jumped 18 basis points, reaching its highest level since 2007.
📉 The Nasdaq fell 1.15%, while the S&P 500 declined 0.7% as borrowing costs increased.
💼 Crypto-related stocks also weakened, with Strategy (MSTR) down 3.1%, Coinbase (COIN) down 1.5%, and Circle (CRCL) down 3%.
🛢️ Oil Moves Higher
⛽ Oil prices rebounded 2.5%, reversing a recent decline, while the energy sector gained as broader markets faced selling pressure.
⚠️ Treasury & Debt Concerns
💰 Analysts highlighted concerns that rising yields could increase the U.S. government's borrowing and interest costs.
🔄 Some market observers warn that higher rates, larger deficits and increasing Treasury issuance could create additional pressure across financial markets.
🔍 Bitcoin Outlook
📌 Bitcoin remains sensitive to Treasury yields, interest-rate expectations and broader risk sentiment.
📉 Continued yield strength could keep pressure on BTC and other risk assets, while stabilization in bond markets could help improve sentiment.
⚠️ Disclaimer: This article is for informational purposes only and should not be considered financial or investment advice.
🏷️#BitcoinMarketUpdate #BitcoinPriceAnalysis #CryptoMarketOutlook #TreasuryYieldSurge #USBondMarket
$BTC

2
197

·
--
Replying to the Sell in May discussion…
Checked $BTC this morning and it’s doing the usual up and down dance. One moment green, next red
Got me thinking step by step
On one side, the chart setup looks familiar: 4 straight green weeks heading into May, same as 2018 $BTC right before the reversal. That creates real hesitation for me. Maybe it’s smart to lock in some gains
On the other hand, this doesn’t feel like 2018. Back then we had almost no institutional money or ETFs. Now liquidity is stronger, the halving is still fresh, and the market structure seems more mature
📍My personal view: I’m not rushing to sell everything, but I’m also not ignoring the risks
Today’s swings are a reminder to stay careful
What’s your logic on this seeing history repeat or a new cycle?
just sharing thoughts
#BTC #BitcoinPriceAnalysis #Write2Earn #Bullrun
Replying to the Sell in May discussion…
Checked $BTC this morning and it’s doing the usual up and down dance. One moment green, next red
Got me thinking step by step
On one side, the chart setup looks familiar: 4 straight green weeks heading into May, same as 2018 $BTC right before the reversal. That creates real hesitation for me. Maybe it’s smart to lock in some gains
On the other hand, this doesn’t feel like 2018. Back then we had almost no institutional money or ETFs. Now liquidity is stronger, the halving is still fresh, and the market structure seems more mature
📍My personal view: I’m not rushing to sell everything, but I’m also not ignoring the risks
Today’s swings are a reminder to stay careful
What’s your logic on this seeing history repeat or a new cycle?
just sharing thoughts
#BTC #BitcoinPriceAnalysis #Write2Earn #Bullrun
Checked $BTC this morning and it’s doing the usual up and down dance. One moment green, next red
Got me thinking step by step
On one side, the chart setup looks familiar: 4 straight green weeks heading into May, same as 2018 $BTC right before the reversal. That creates real hesitation for me. Maybe it’s smart to lock in some gains
On the other hand, this doesn’t feel like 2018. Back then we had almost no institutional money or ETFs. Now liquidity is stronger, the halving is still fresh, and the market structure seems more mature
📍My personal view: I’m not rushing to sell everything, but I’m also not ignoring the risks
Today’s swings are a reminder to stay careful
What’s your logic on this seeing history repeat or a new cycle?
just sharing thoughts
#BTC #BitcoinPriceAnalysis #Write2Earn #Bullrun
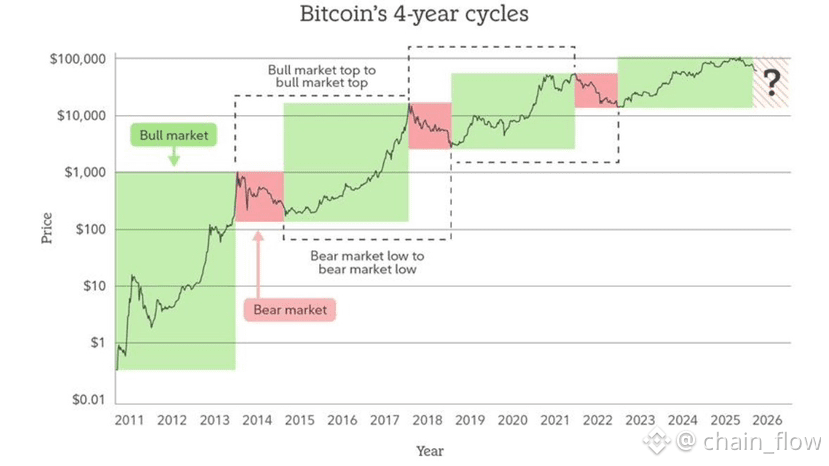
1
1
96
Log in to explore more content
Join global crypto users on Binance Square
⚡️ Get latest and useful information about crypto.
💬 Trusted by the world’s largest crypto exchange.
👍 Discover real insights from verified creators.
Email / Phone number
Trending Topics
1
#JobsReportRaisesHikeOdds
193,056 views
1,602 Discussing
2
#CPITestsDecemberRateOutlook
3,782 views
73 Discussing
3
#BitcoinRebounds$75KAsChipsLead
17,855 views
190 Discussing
4
#US Data Center Rules May Constrain AI Expansion
31,865 views
140 Discussing
5
#WillAnthropicListOnTime
45,061 views
601 Discussing
6
#WillUS-IranTensionsBoostSafe-HavenDemand?
547 views
8 Discussing
7
#BitcoinETFsSee$412MNetOutflows
1,057 views
35 Discussing
8
#HKSFCPlansToRestrictCryptoAndExchangeTerms
6,418 views
148 Discussing
9
#FinCENAndFedWithdraw$250CryptoTransferProposal
5,893 views
14 Discussing
10
#TradFiForBeginners
30,642 views
496 Discussing