How to Customize the Candlestick Colours and Technical Indicators
Published on 2022-03-29 01:29
Original View
TradingView
How to Customize the Candlestick Colors and Technical Indicators on TradingView
You can customize the candlestick colors and technical indicators displayed on the TradingView mode.
To customize the candlestick colors on TradingView:
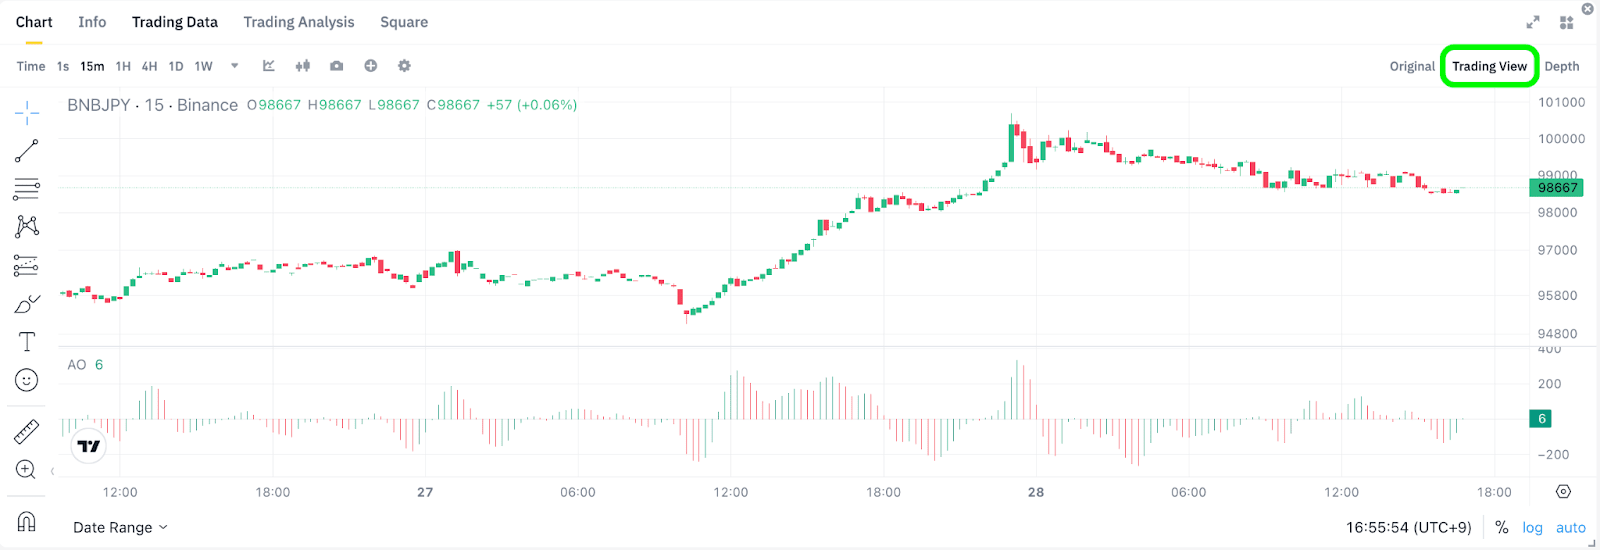
1. Click [TradingView] to go to the TradingView mode.
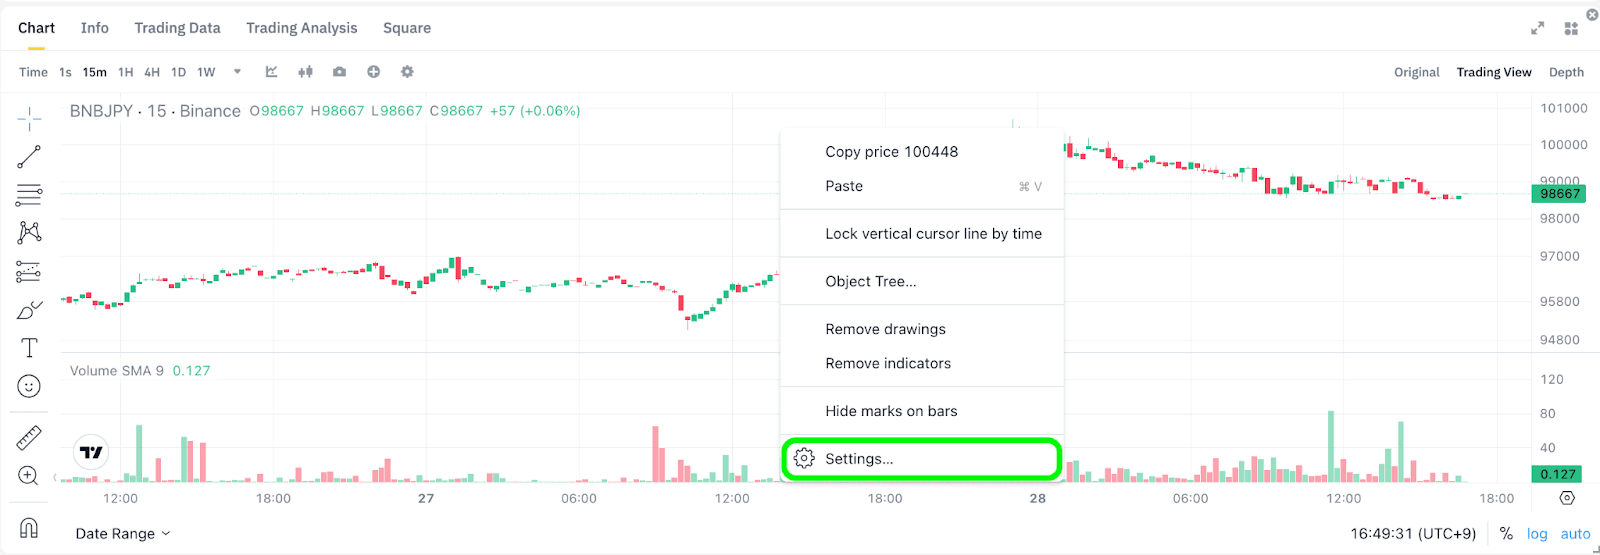
2. Right-click on the chart and choose [Setting].
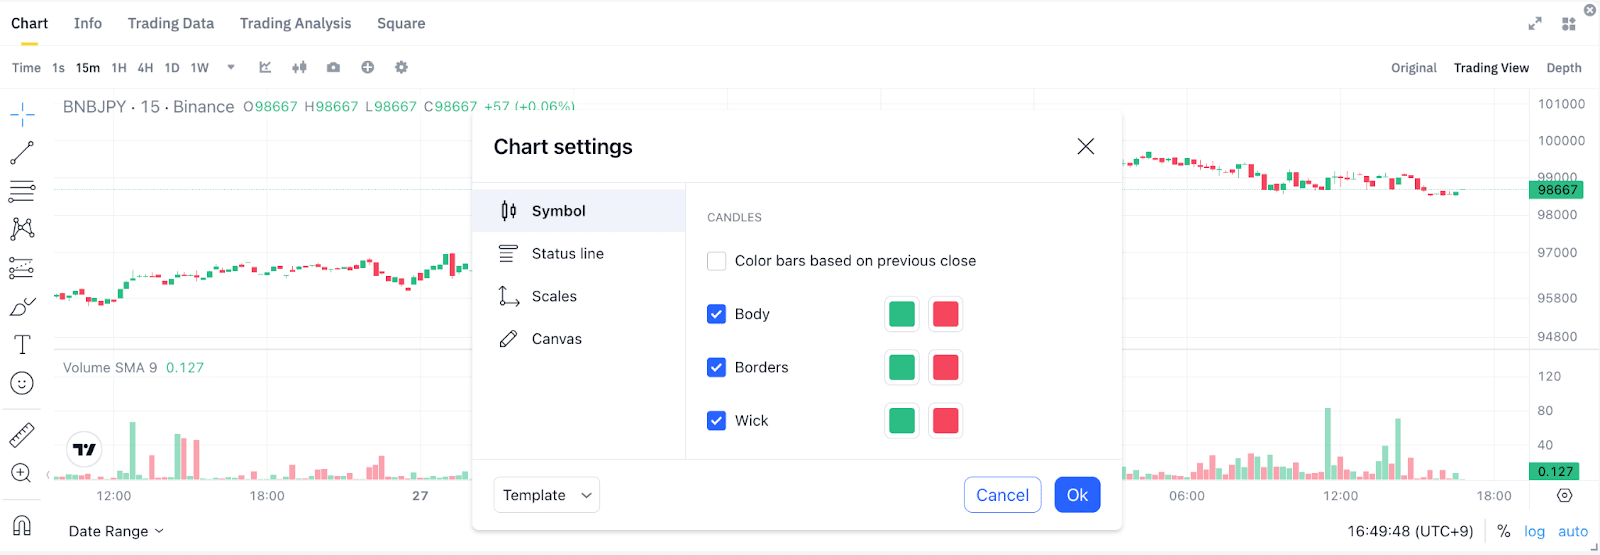
3. Select your preferred colors. To restore to the default colors, click [Template] - [Apply defaults]-[Ok]]
To customize the technical indicators on TradingView:
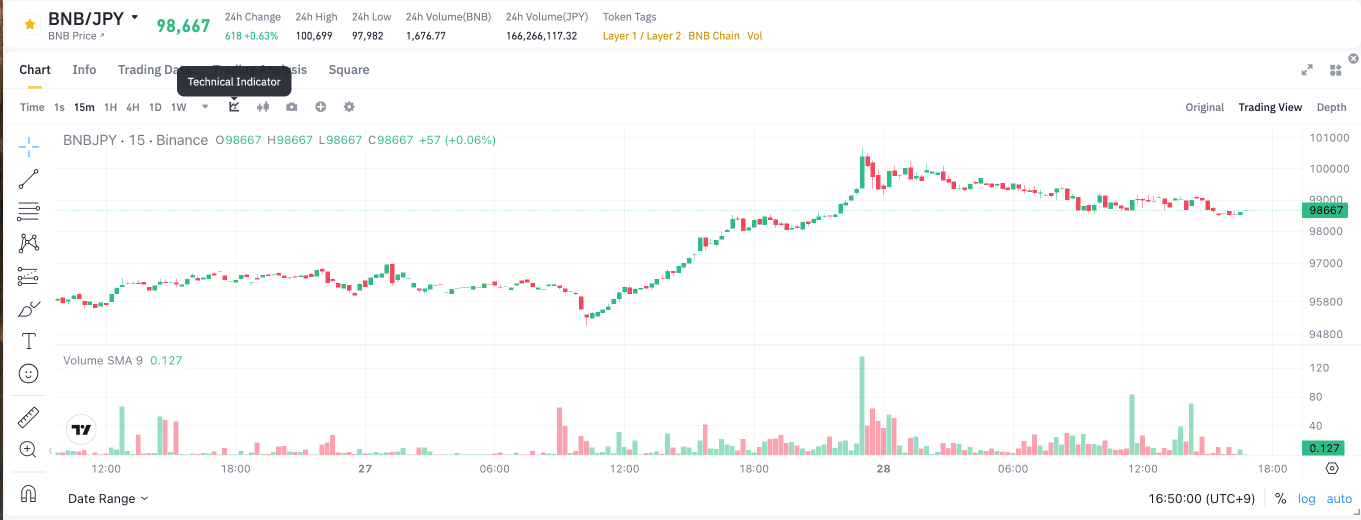
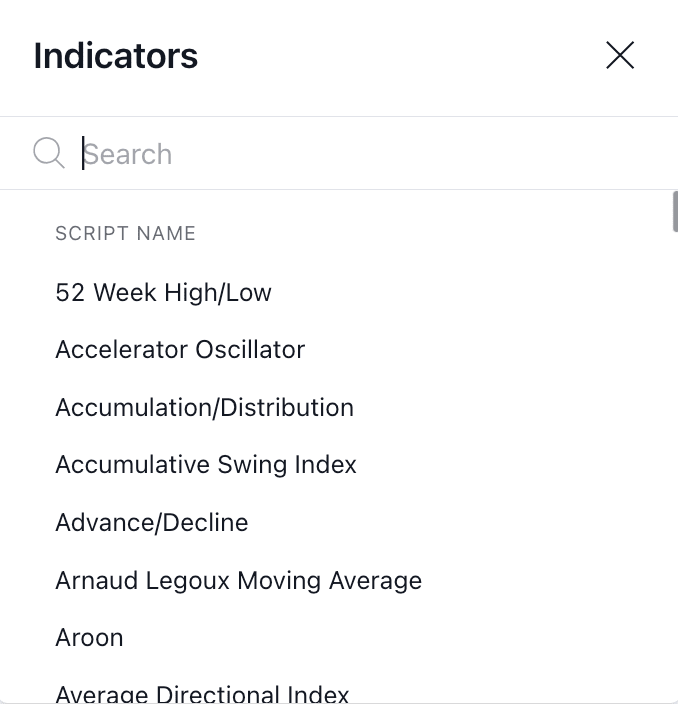
1. In the [TradingView] mode, click on the [Technical Indicator] icon.
2. You can search for the indices you wish to display. To add an index, simply click on its name and it will appear on the chart.
There is no limit to the number of indices you can add. Please note that you cannot customize the colors of the indices.
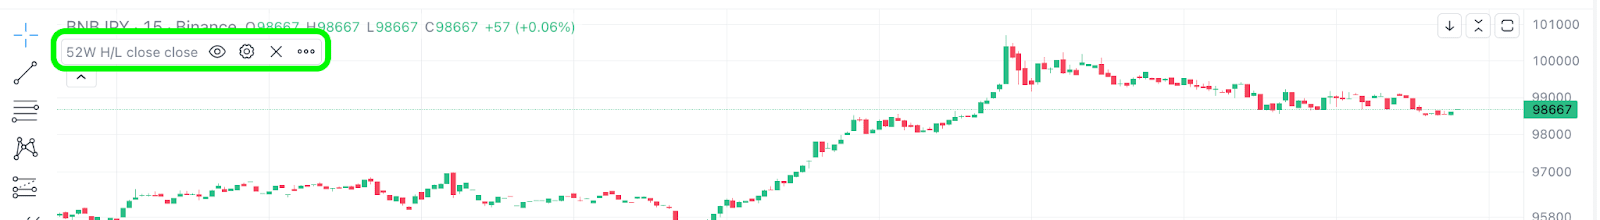
3. To manage a pane, hover over the chart and you will see the buttons appear on the top right corner for you to reorder or delete the panes.
4. You can also customize the candlestick chart by clicking on the candlestick icon.
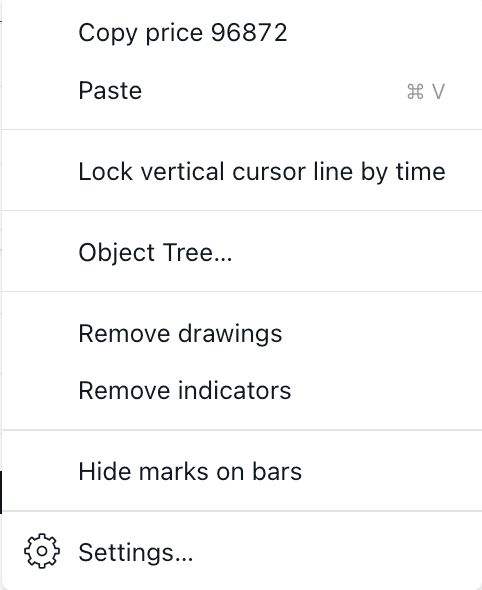
5. You can right click on the chat, click [Remove Indicators] to remove all the indices you added in one go.
How to Customize the Candlestick Colors and Technical Indicators on TradingView
You can customize the candlestick colors and technical indicators displayed on the TradingView mode.
To customize the candlestick colors on TradingView:
1. Click [TradingView] to go to the TradingView mode.
2. Right-click on the chart and choose [Setting].
3. Select your preferred colors. To restore to the default colors, click [Reset].
To customize the technical indicators on TradingView:
1. In the [TradingView] mode, click on the [Technical Indicator] icon.
2. You can search for the indices you wish to display. To add an index, simply click on its name and it will appear on the chart.
There is no limit to the number of indices you can add. Please note that you cannot customize the colors of the indices.
3. To manage a pane, hover over the chart and you will see the buttons appear on the top right corner for you to reorder or delete the panes.
4. You can also customize the candlestick chart by clicking on the candlestick icon.
5. To reset to the default mode, right-click on the chart and click [Reset Chart]. You can also click [Remove Indicators] to remove all the indices you added in one go.