

YOoRy
754 Posts

YOoRy
Report
Block User
كن متعطشاا للنجاح، لا للفت الانتباه
Open Trade
High-Frequency Trader
1.8 Years
61 Following
273 Followers
385 Liked
Posts
Portfolio
All
Quotes
Videos
·
--
$BTC
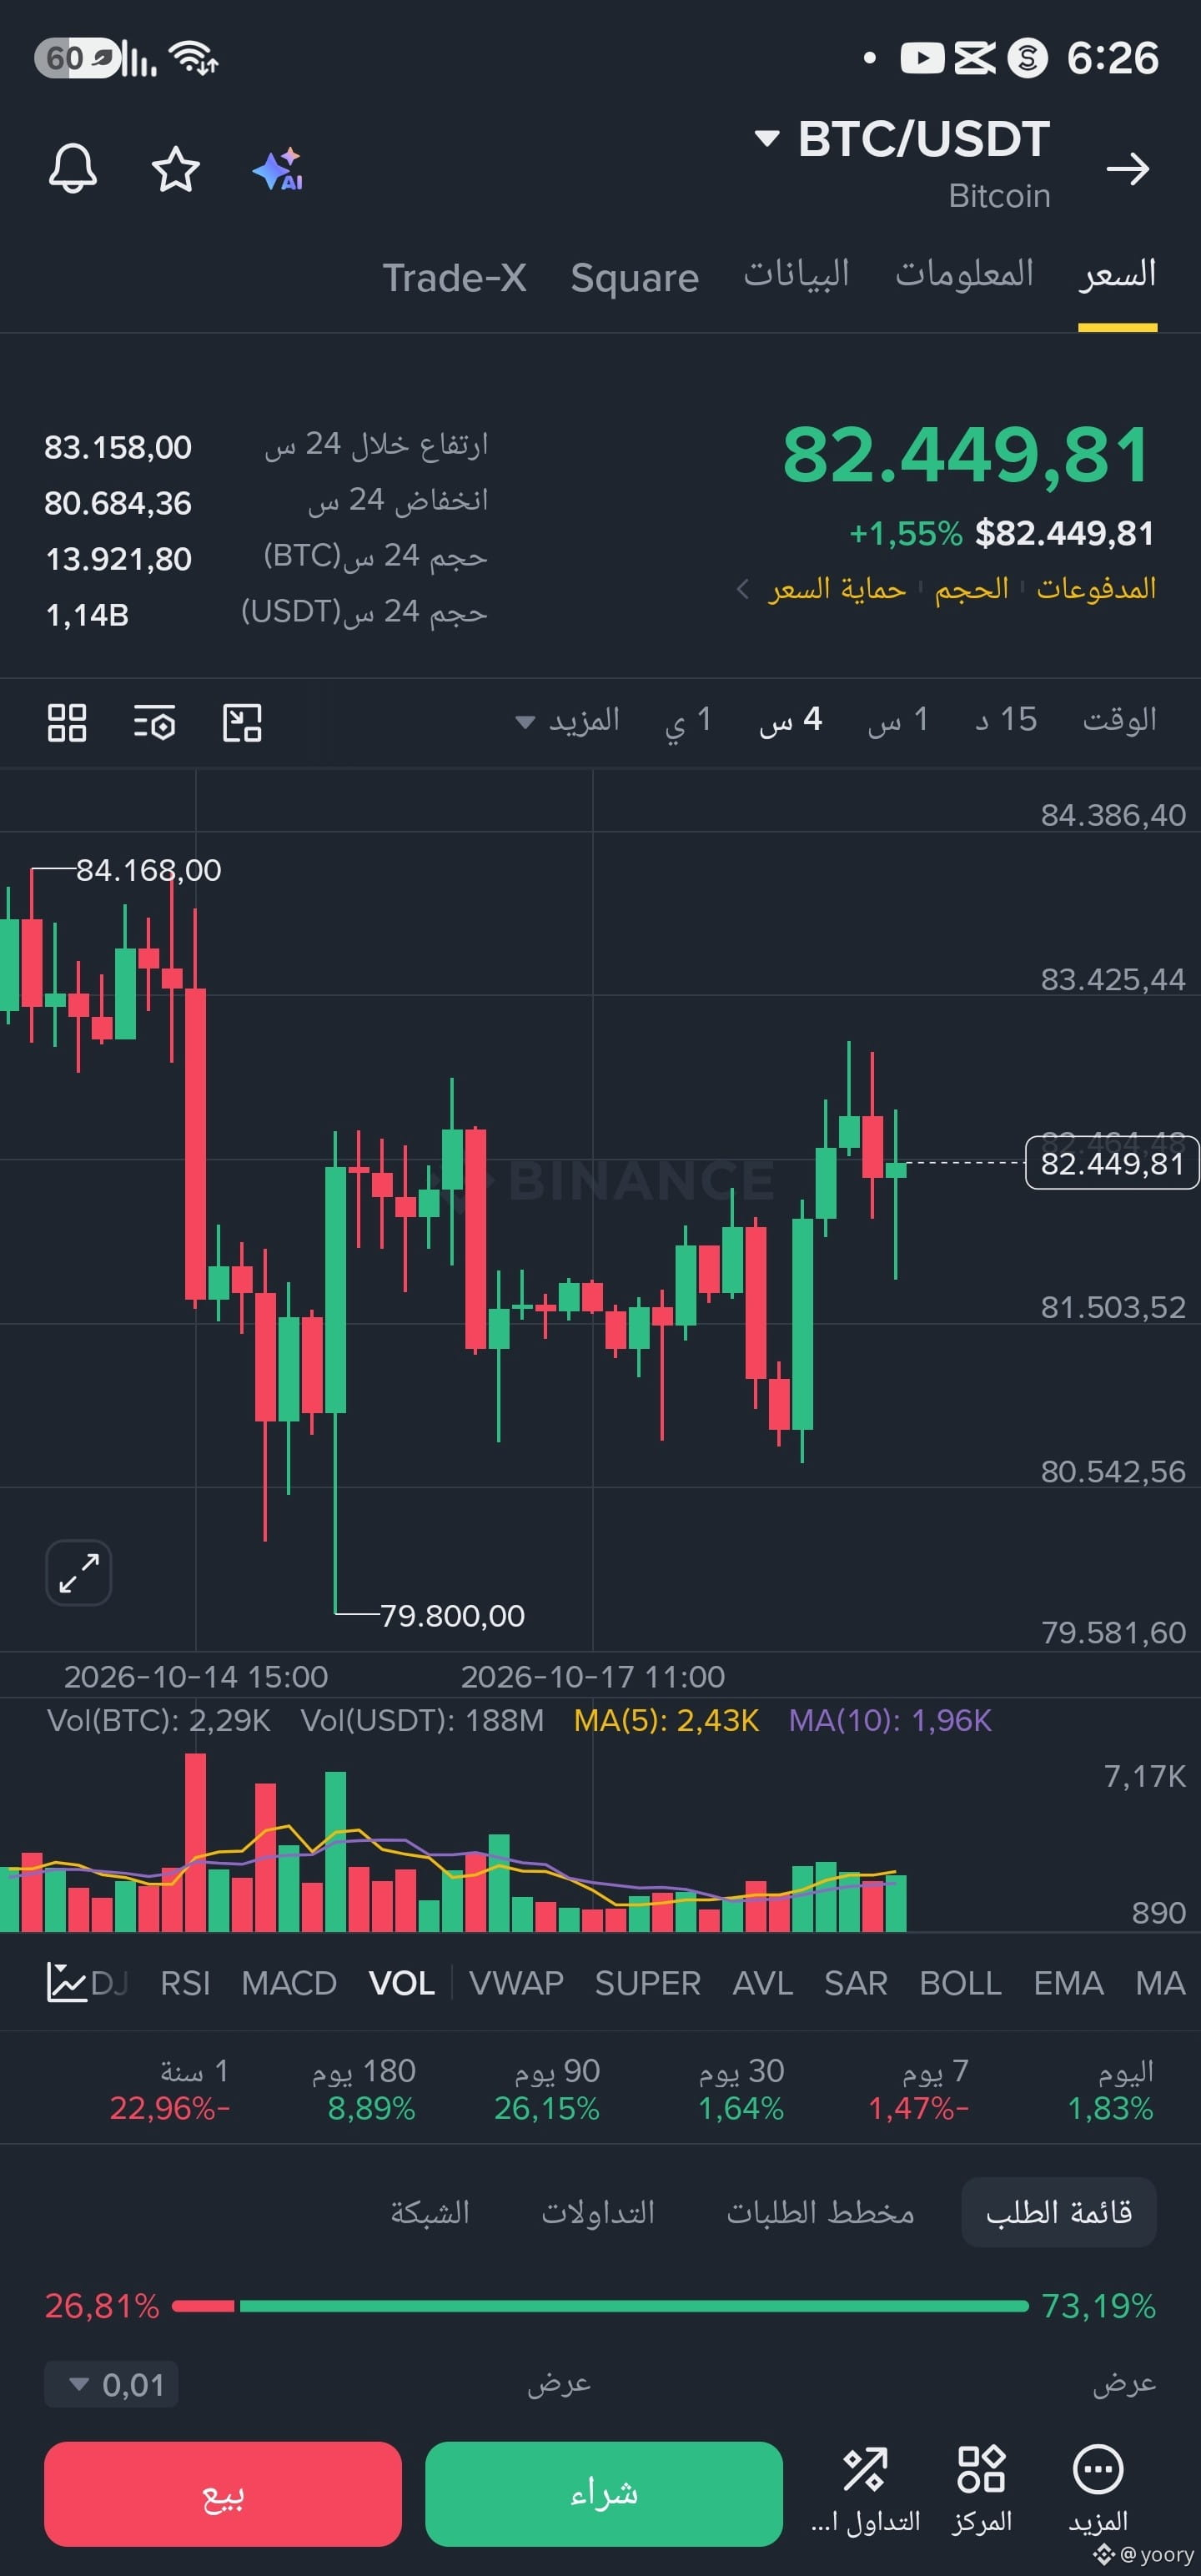
I'm unsure whether to go long or short today. The market is very strange.
$BTC
I'm unsure whether to go long or short today. The market is very strange.
I'm unsure whether to go long or short today. The market is very strange.
114
·
--
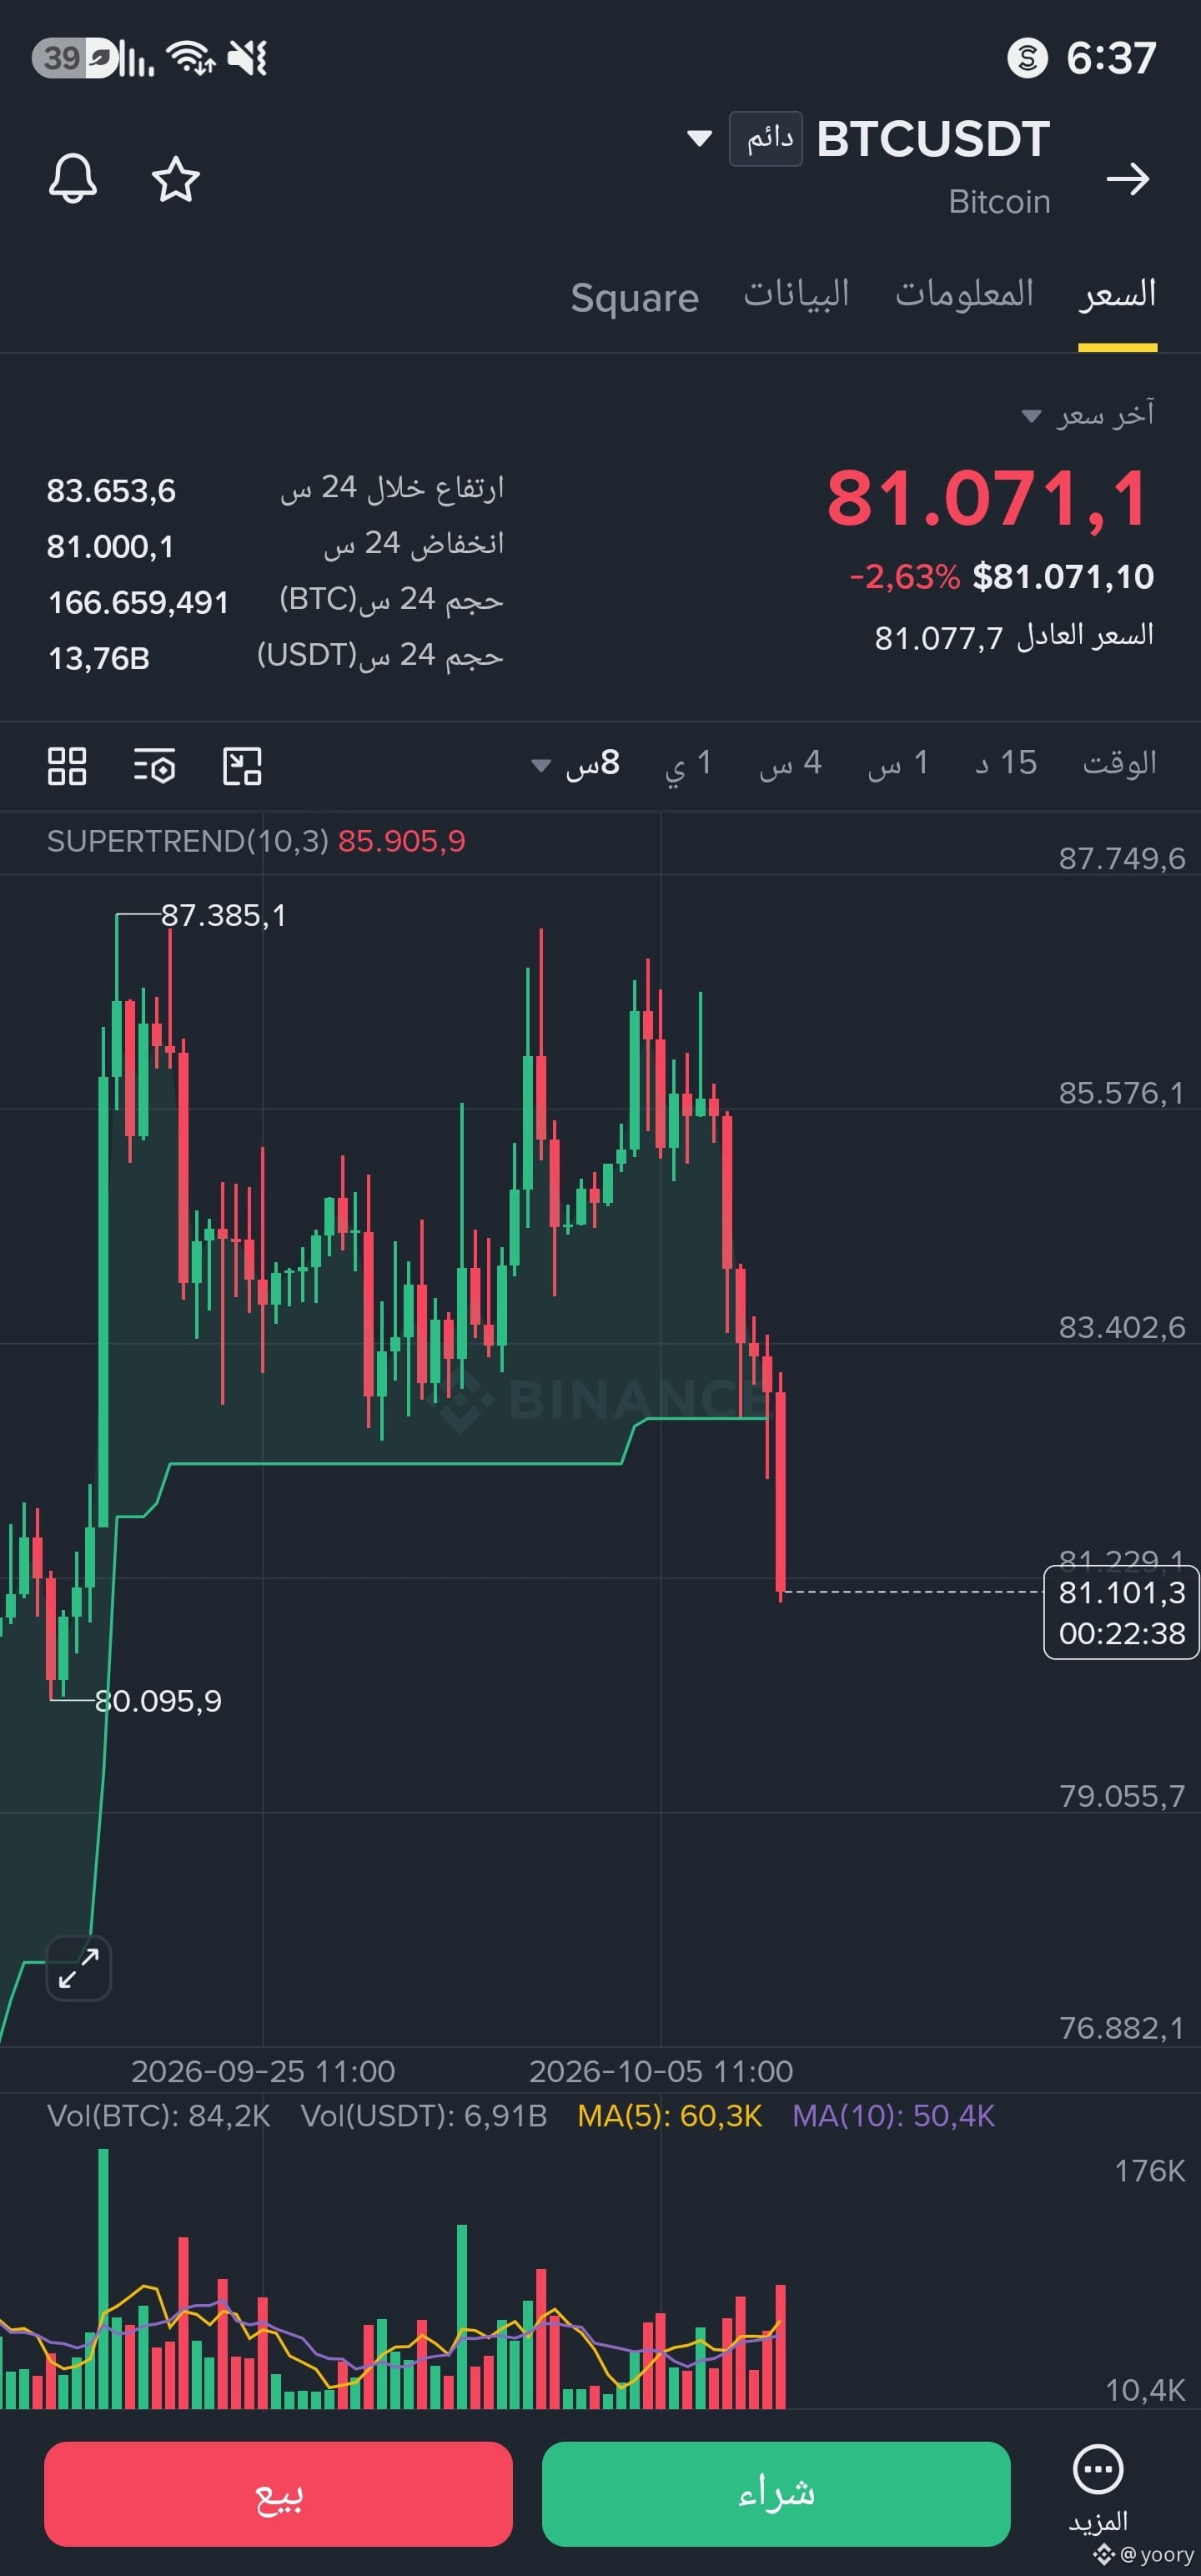
Has the collapse started, or are people afraid of the story repeating 😭🥺
Has the collapse started, or are people afraid of the story repeating 😭🥺
151
·
--
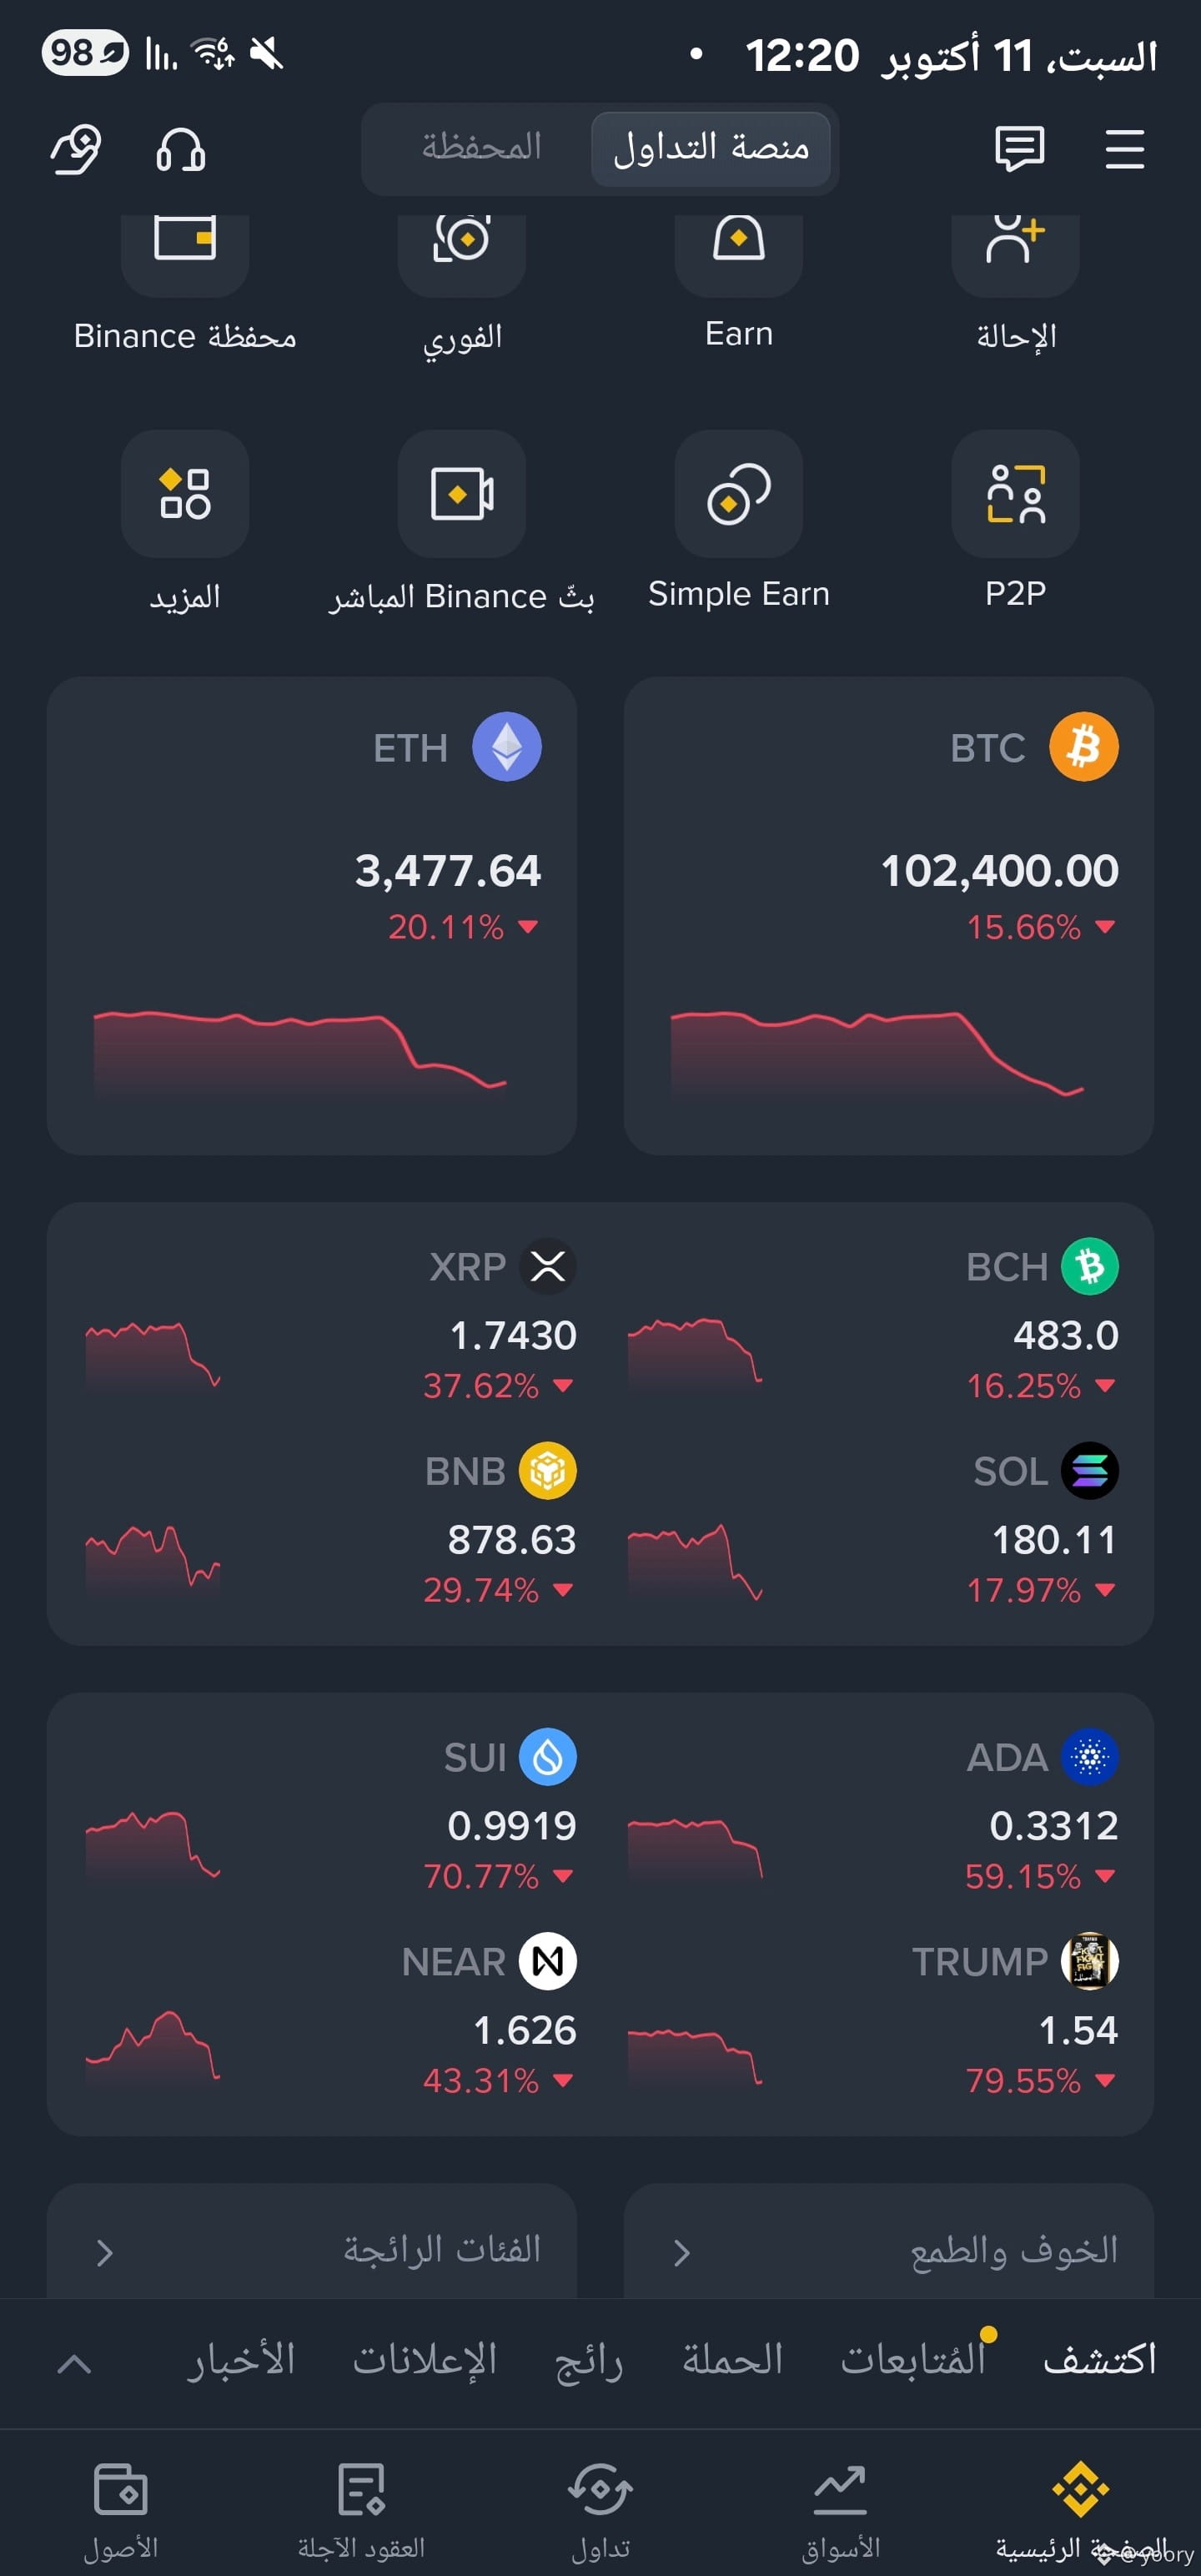
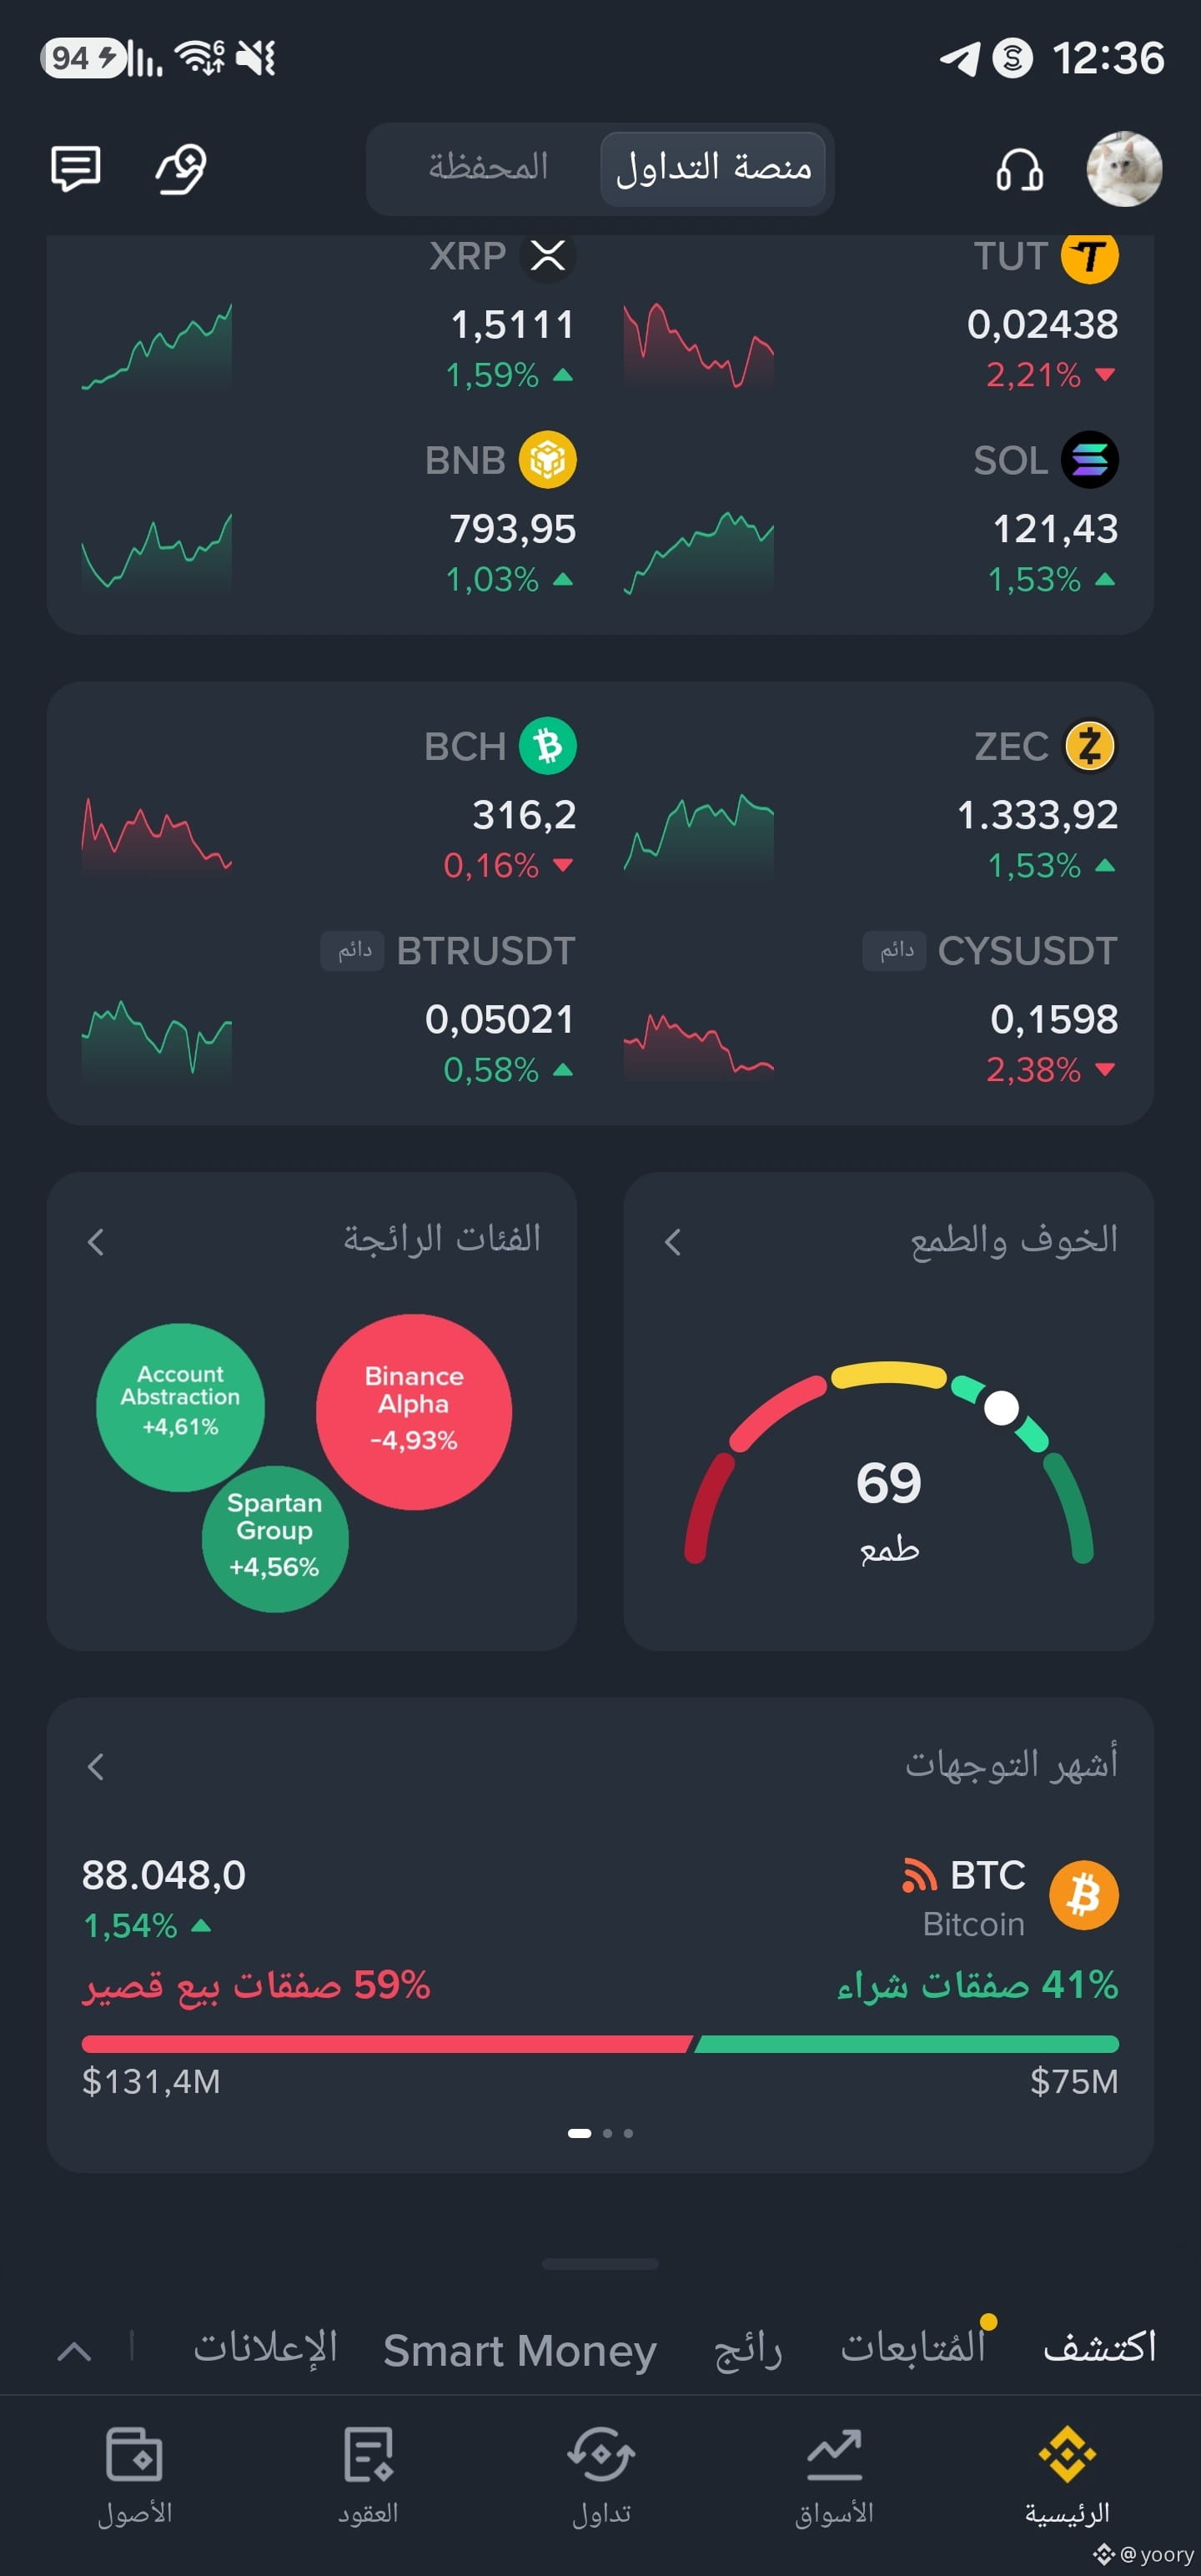
On October 10 of last year, it was a very terrifying day in the market. Will this terror happen again? Look at the picture—it was a very terrifying day.
On October 10 of last year, it was a very terrifying day in the market. Will this terror happen again? Look at the picture—it was a very terrifying day.
396
·
--
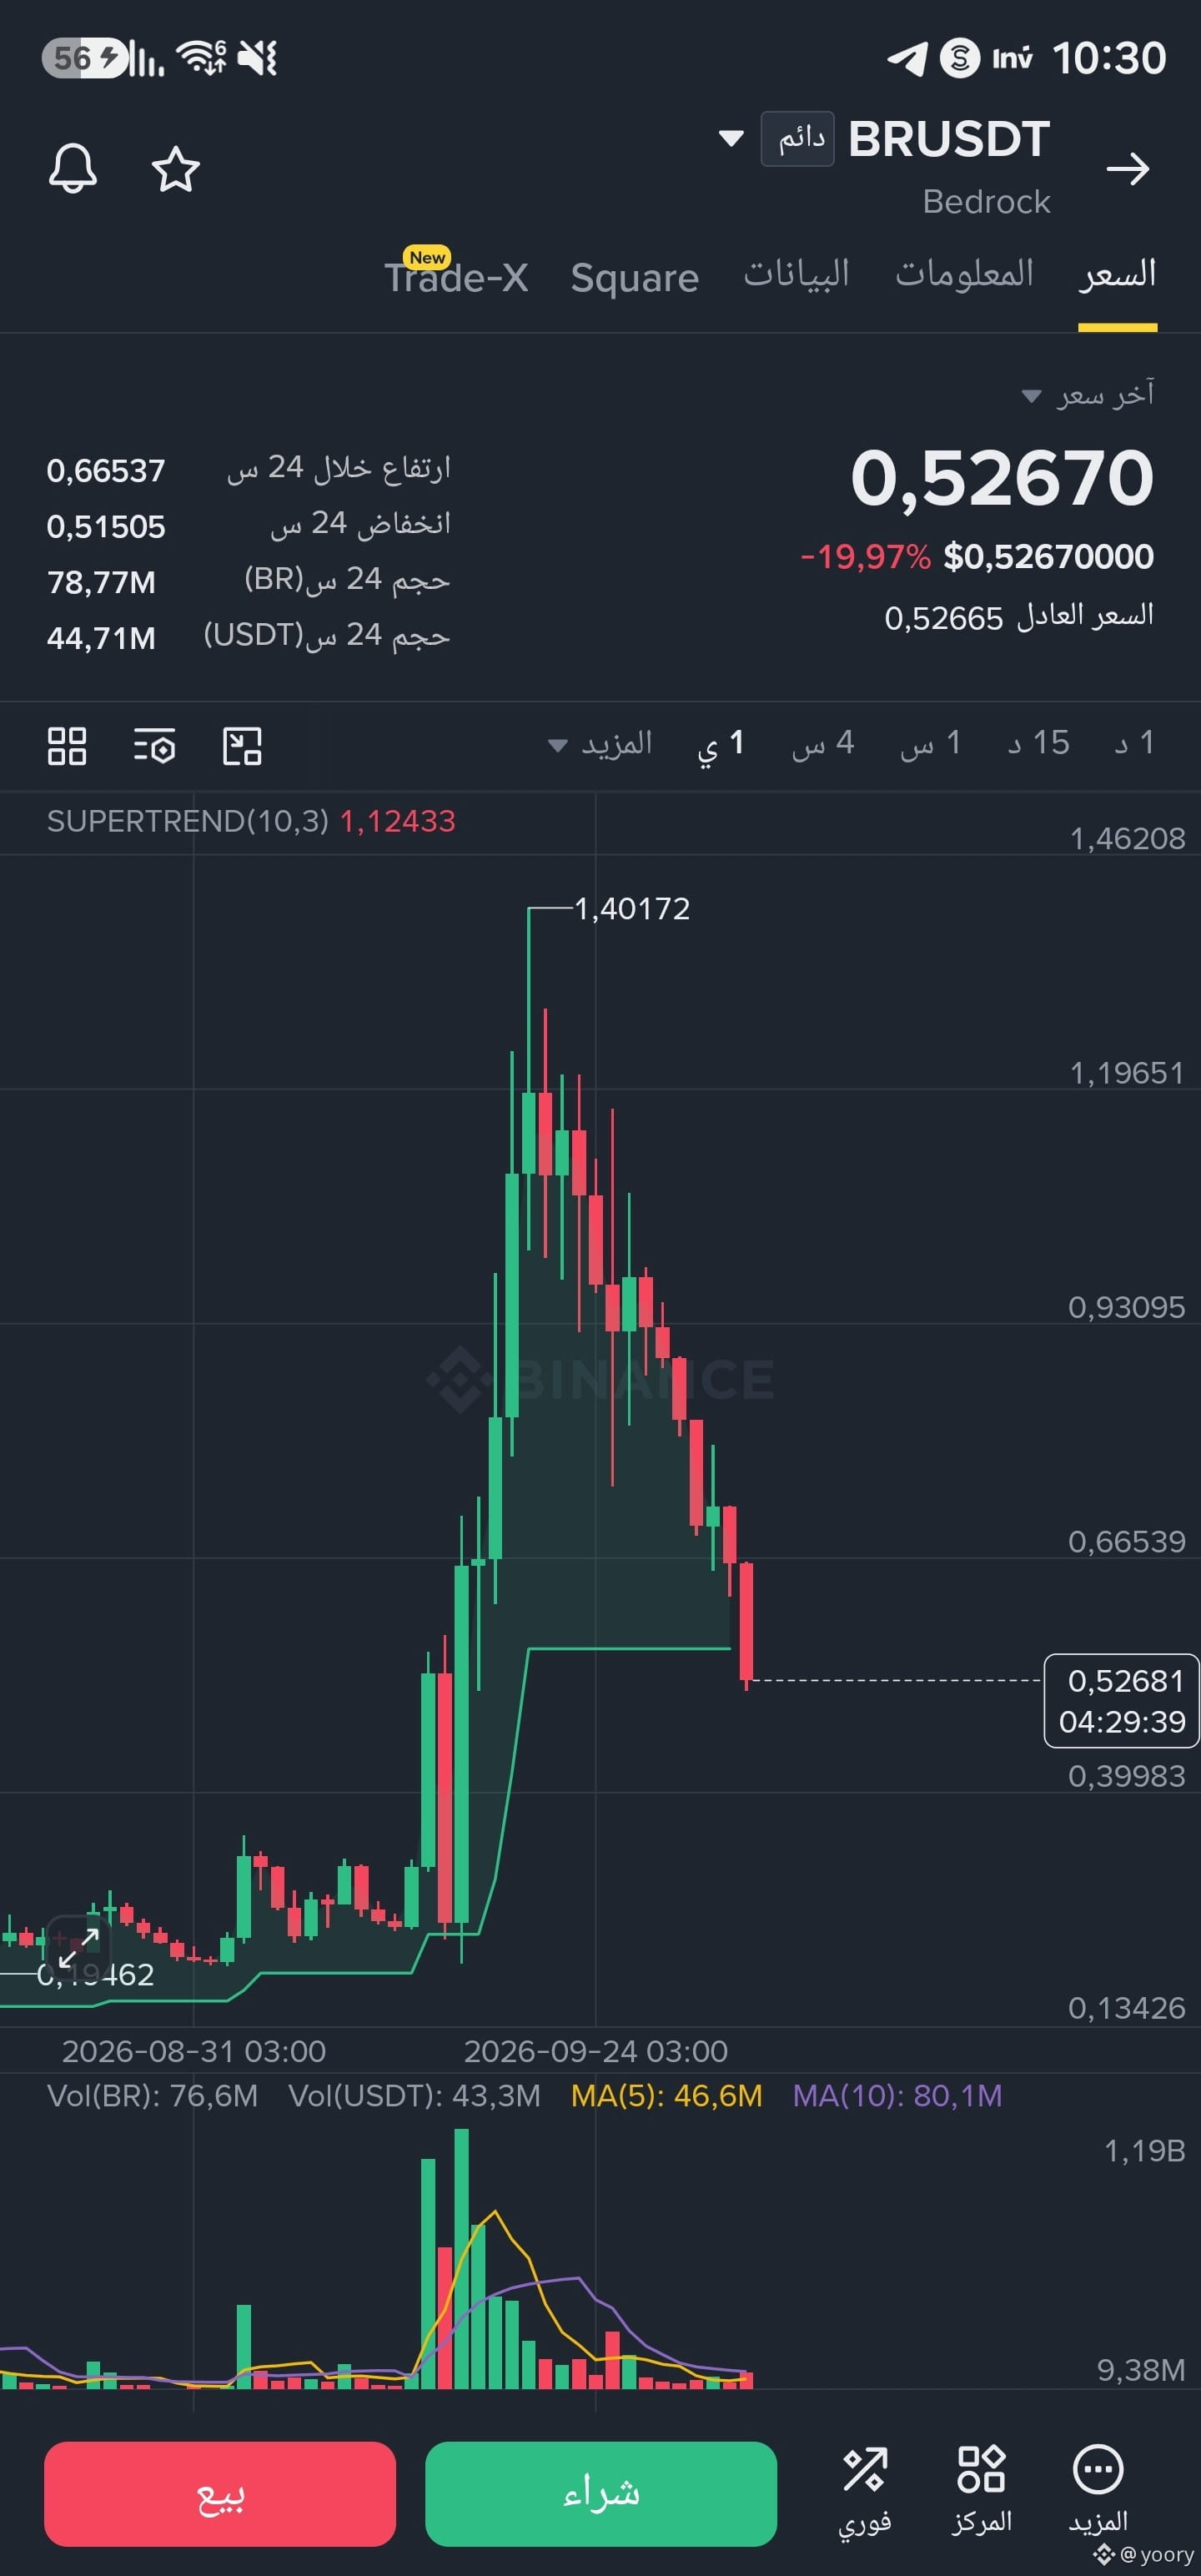
The BRUSD coin chart shows the following:
Short analysis🧑💻
The trend is sharply bearish with a strong correction of 19.97% after the rise.
The previous level was toward the 1.401 peak.
Current support: the price is currently trading at 0.5267, which
is exactly at the Supertrend support line (at 0.5268).
Volume: a noticeable decline in trading volumes compared to the rise, reflecting the current weakness in momentum.
Technical view: a break below the 0.526 level and holding under it opens the door to continued downside, while staying above it may cause a temporary upward corrective rebound.
$BR
600
·
--
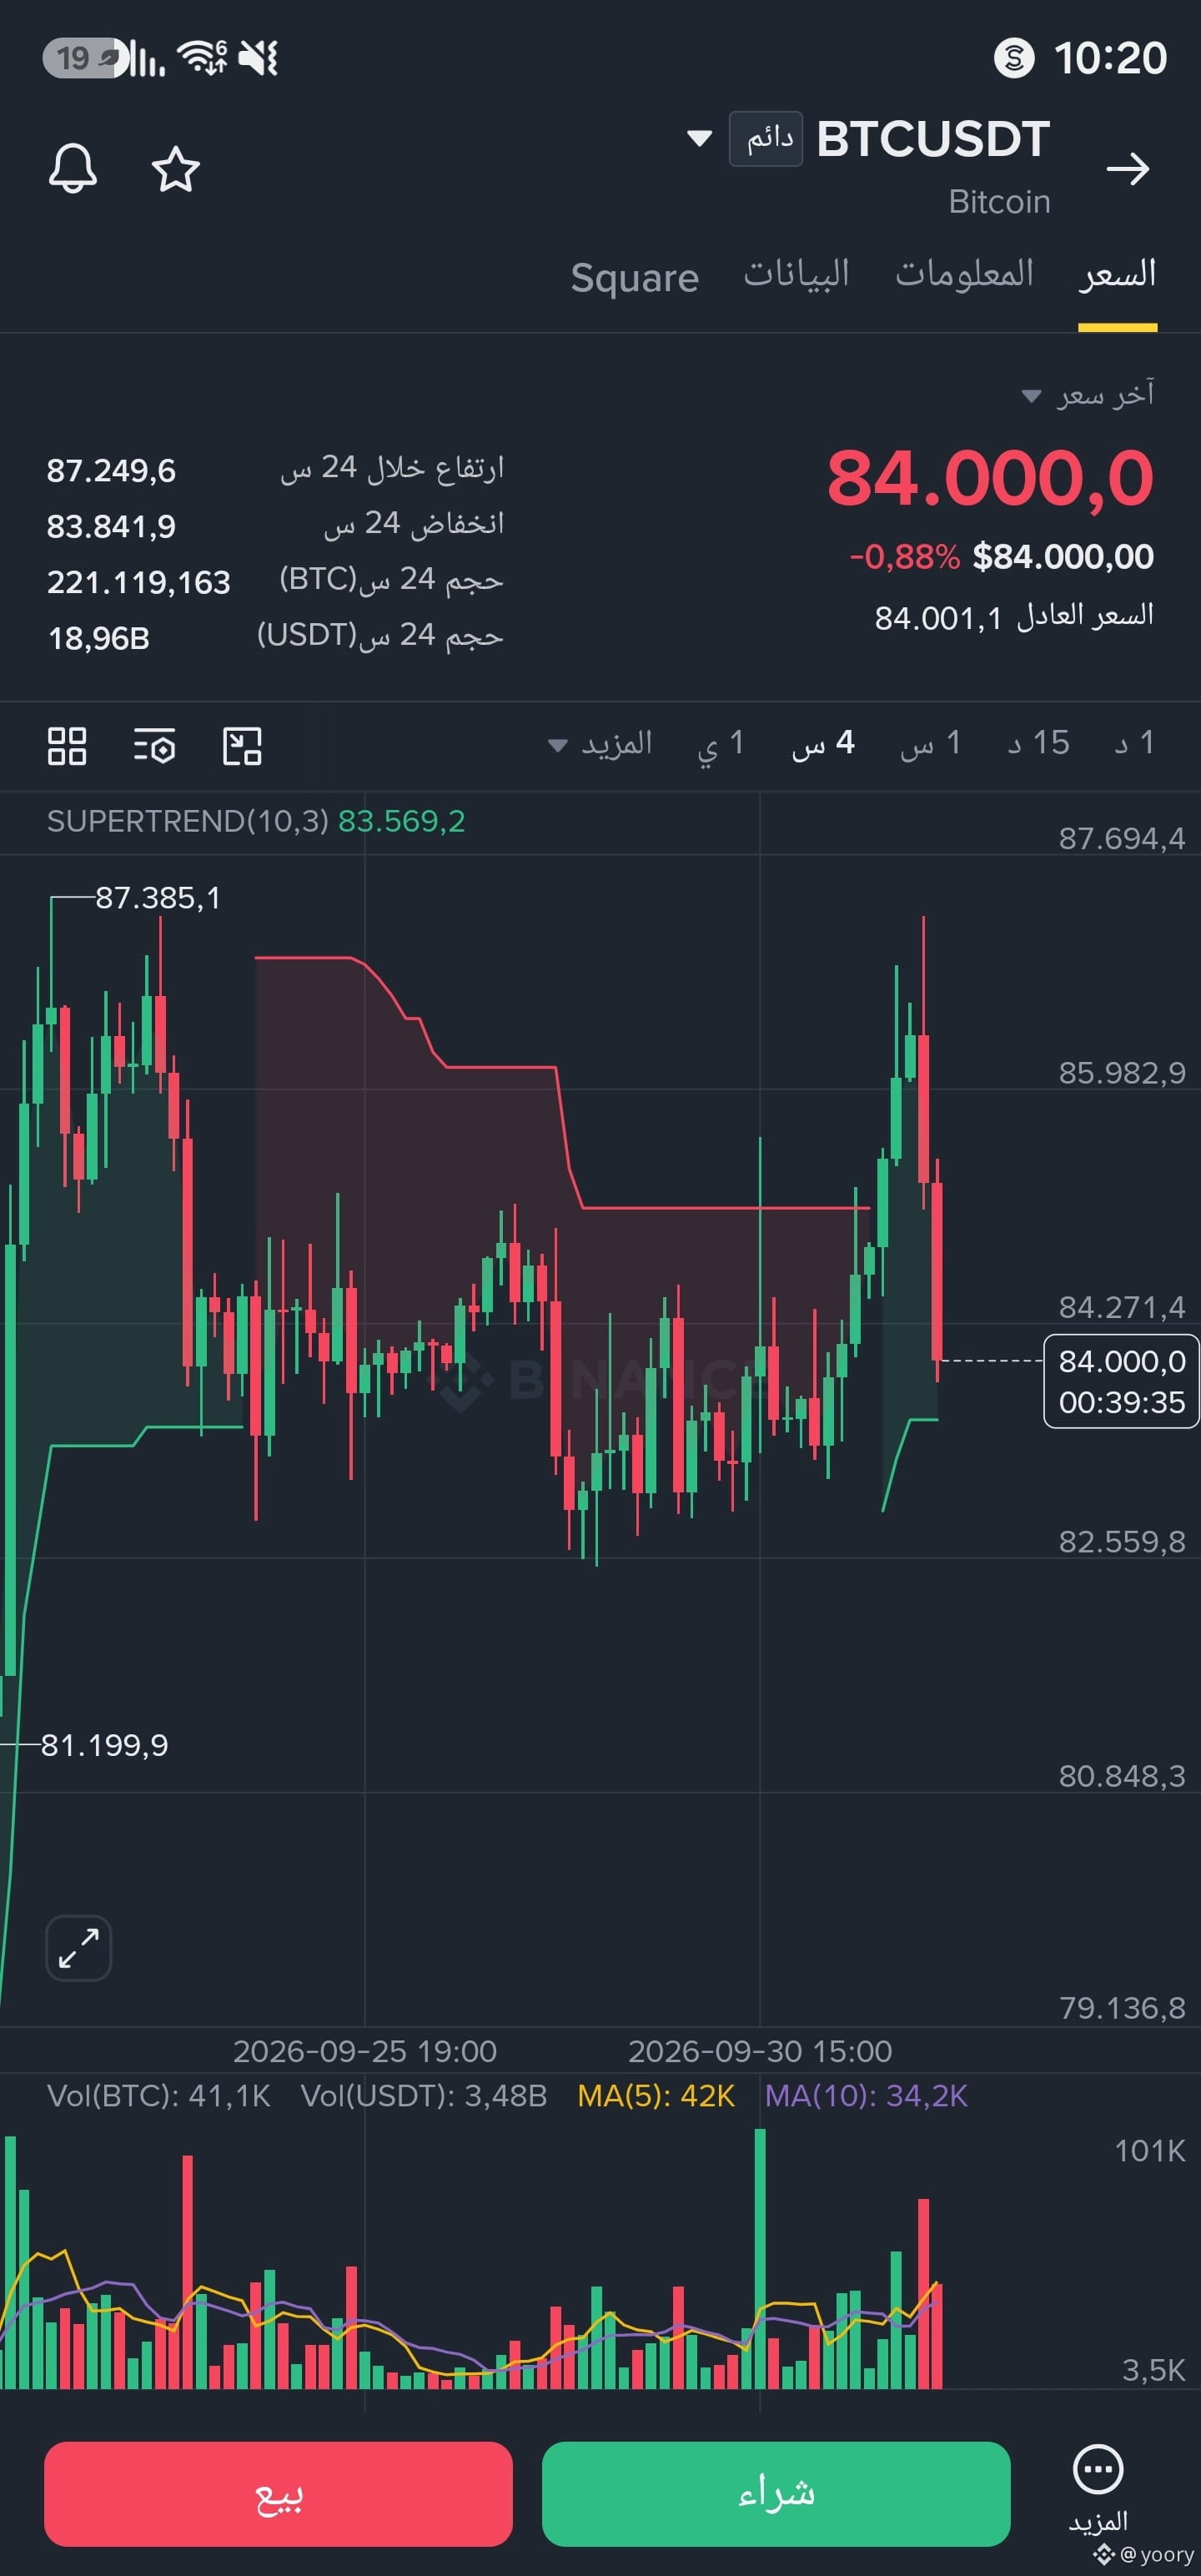
84.000,0$
Very very very special number what happens to the market this is madness 🤯
$BTC
84.000,0$
Very very very special number what happens to the market this is madness 🤯
$BTC
Very very very special number what happens to the market this is madness 🤯
$BTC
212
·
--
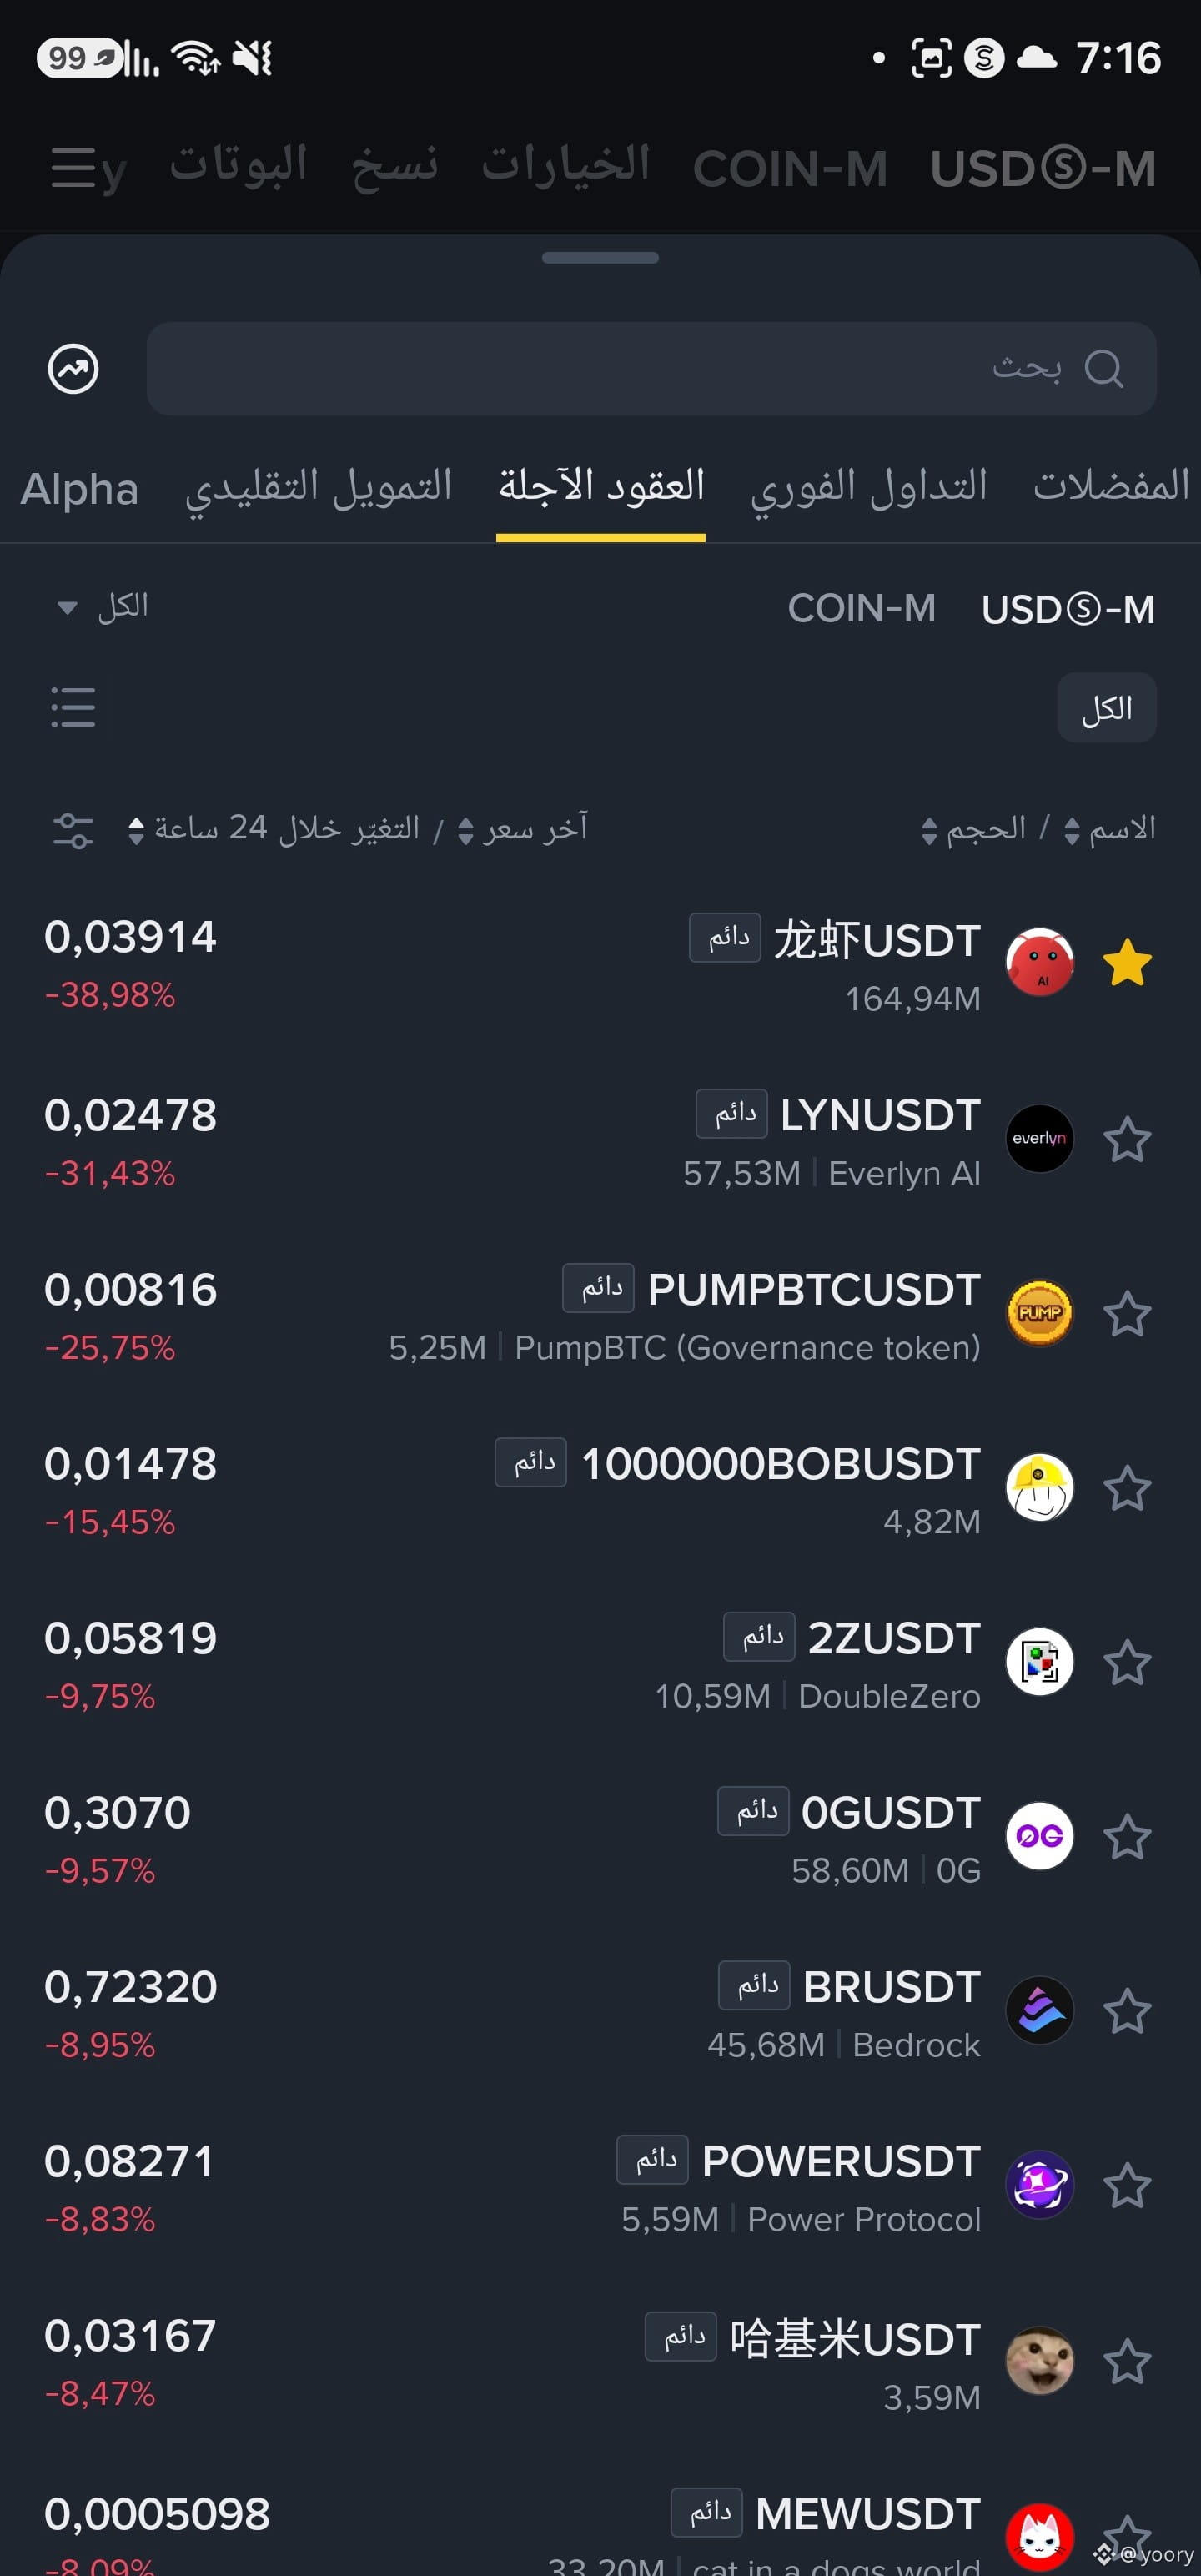
Trying to catch the falling knife, all this work like it’s the highest winner yesterday 🤷♂️ Don’t sleep on the currency, my friend
Trying to catch the falling knife, all this work like it’s the highest winner yesterday 🤷♂️ Don’t sleep on the currency, my friend
1
1.1k
·
--
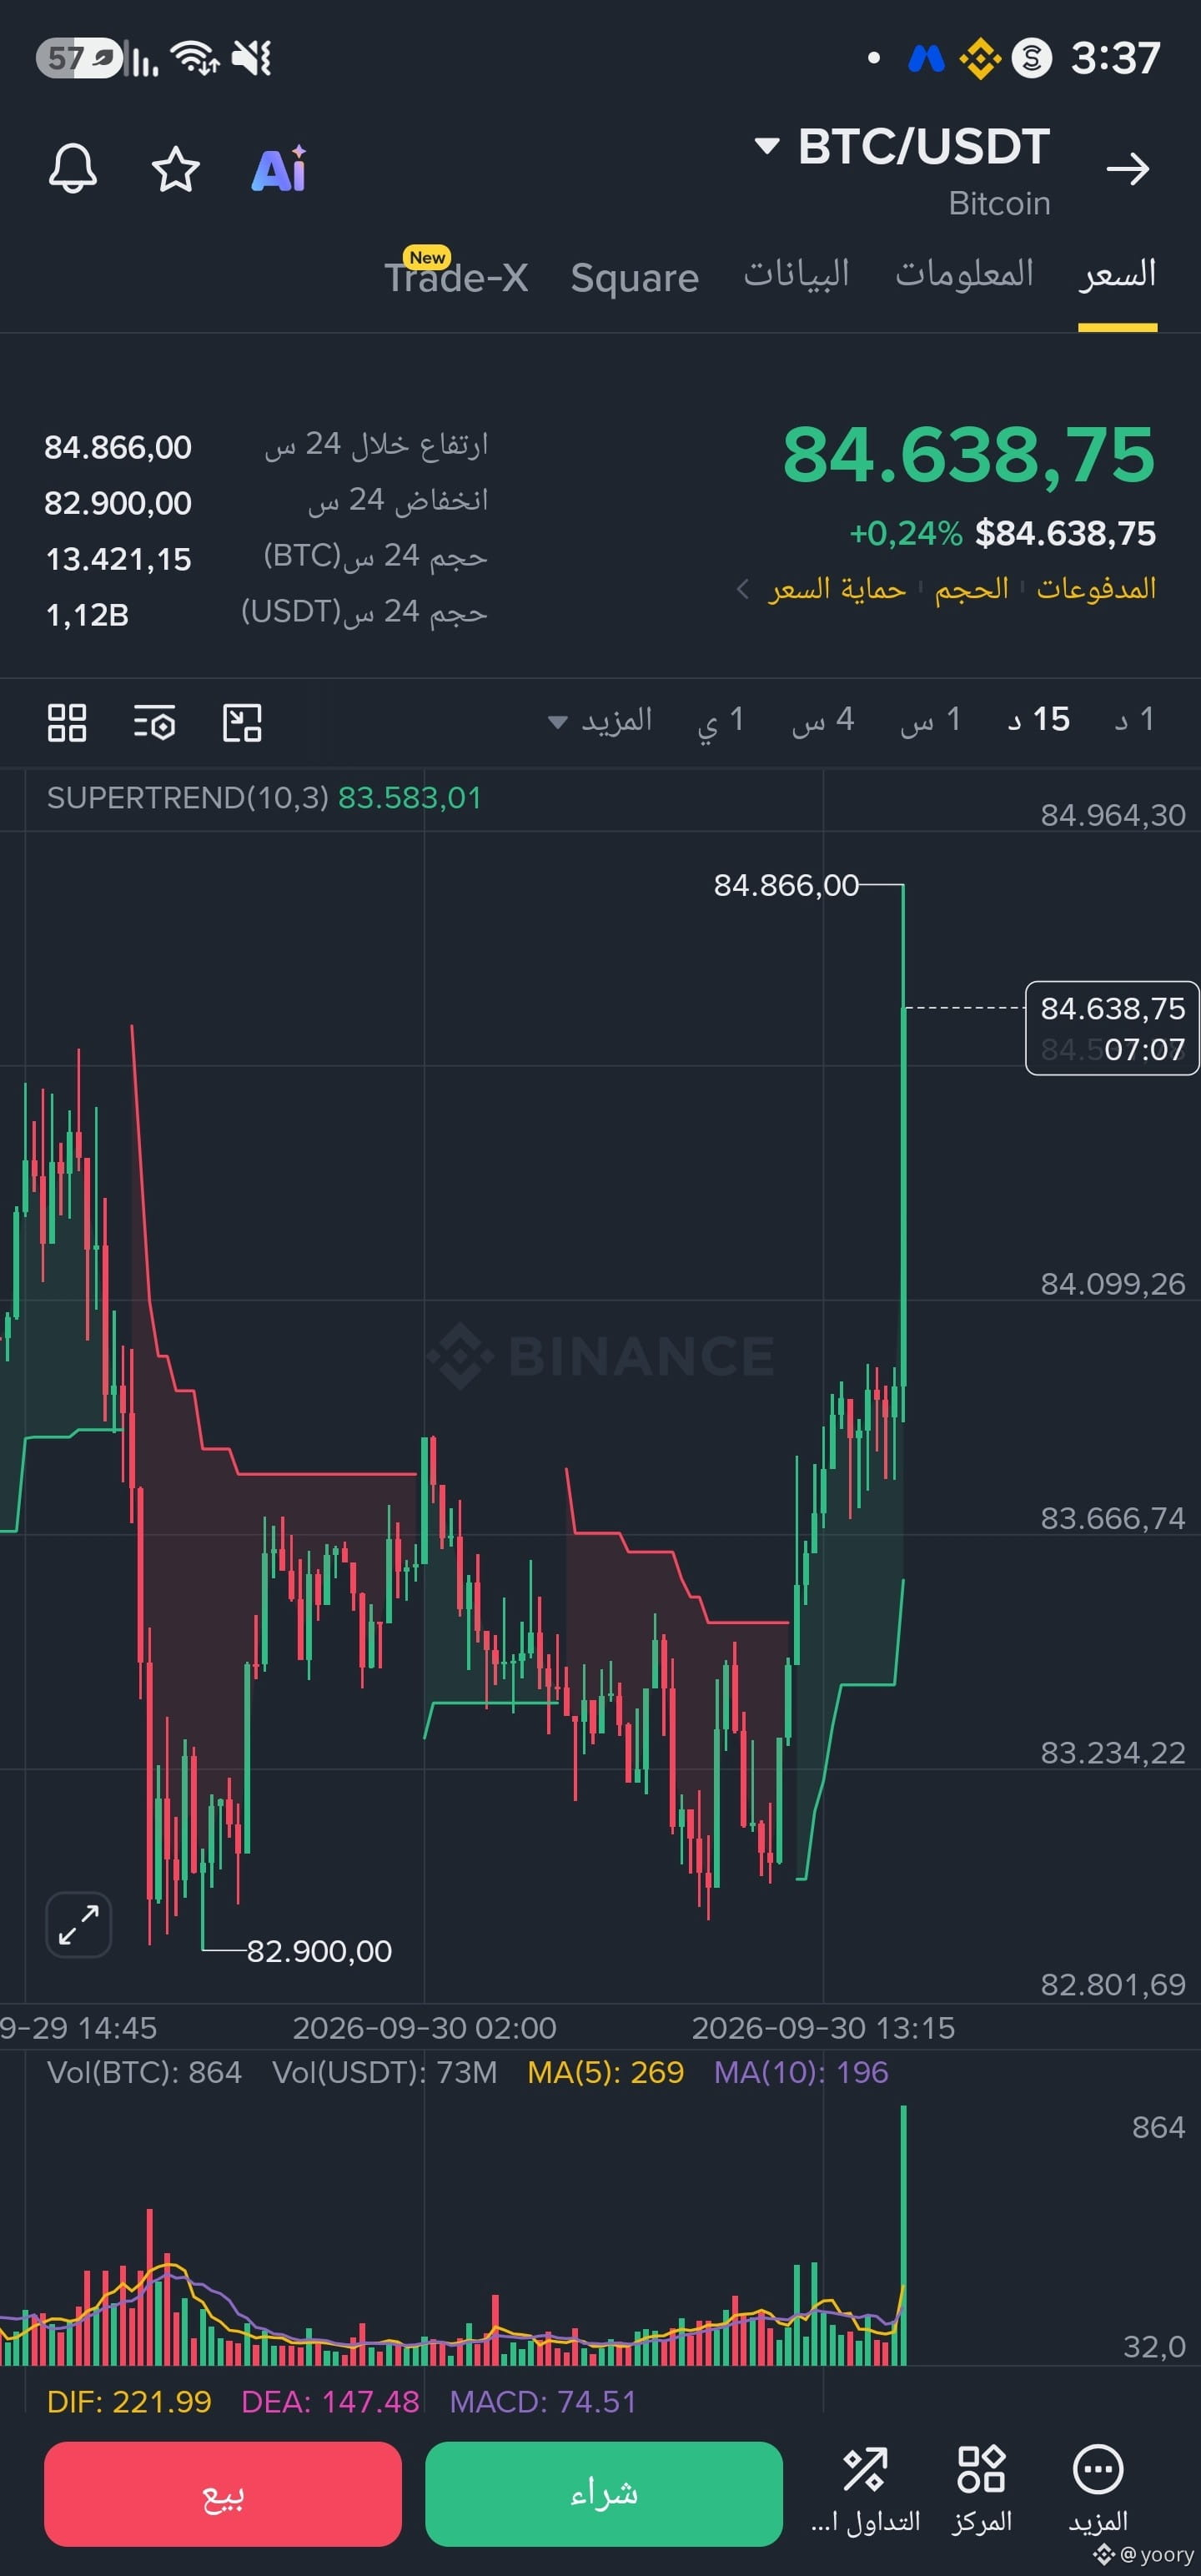
Unfortunately my father made planes taaaaaaa with me
🤧🤧🤧🤧😭
$BTC
Unfortunately my father made planes taaaaaaa with me
🤧🤧🤧🤧😭
$BTC
🤧🤧🤧🤧😭
$BTC
108
·
--
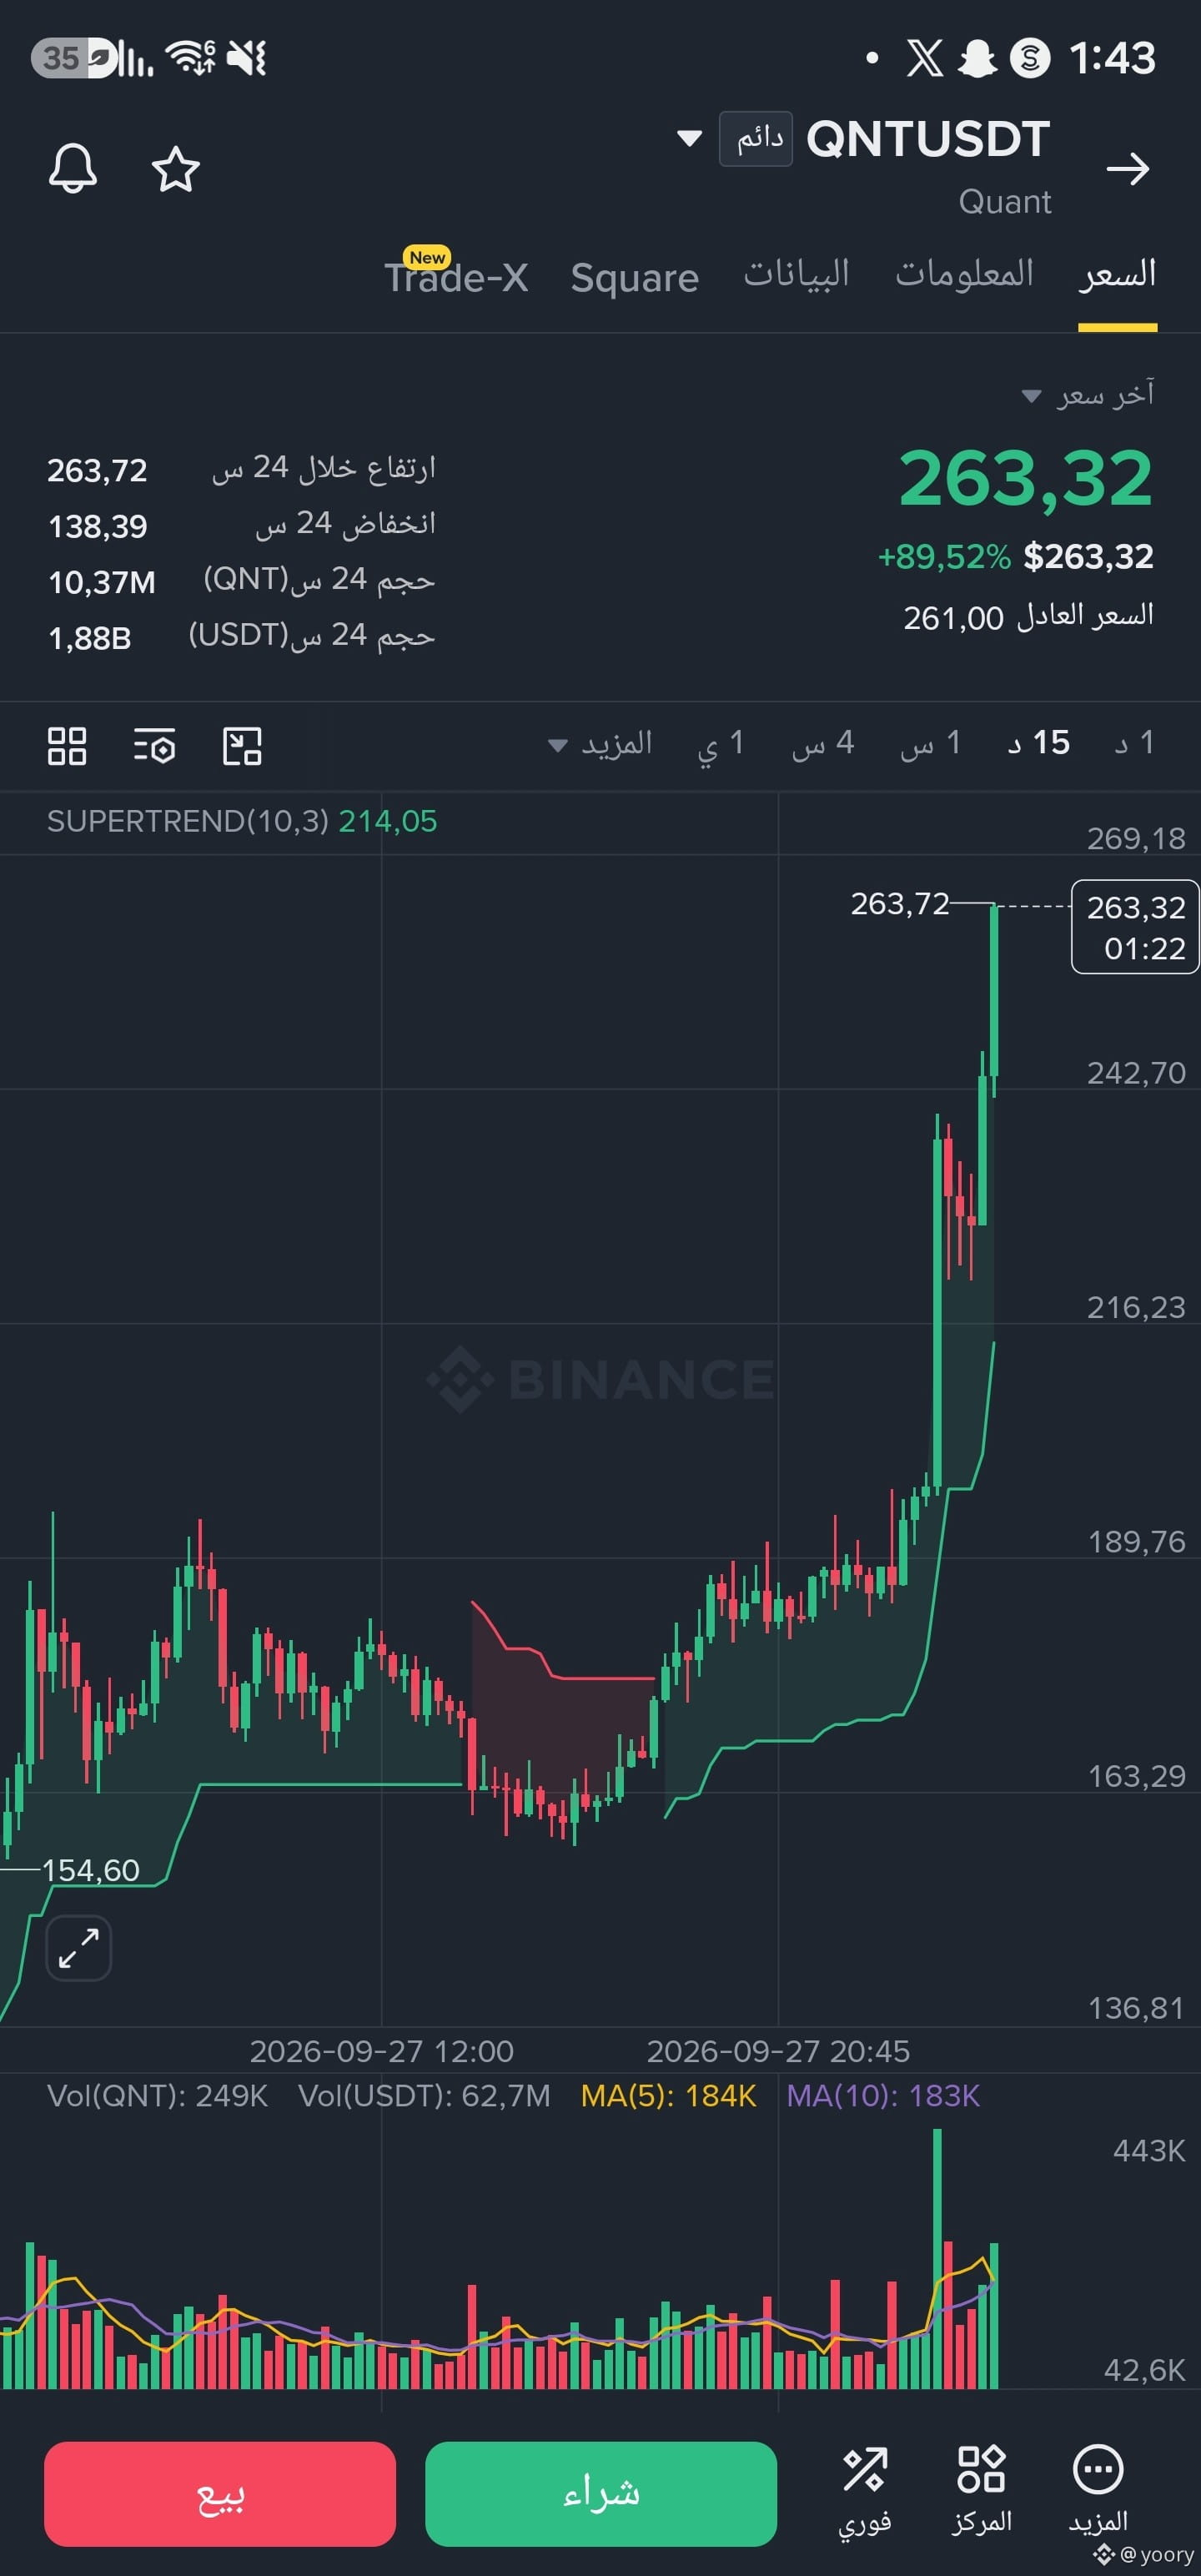
Bullish
Walking against the market like that, it's a strange thing 😂
$QNT
🚀🚀🚀🚀🚀🔥
Walking against the market like that, it's a strange thing 😂
$QNT
🚀🚀🚀🚀🚀🔥
$QNT
🚀🚀🚀🚀🚀🔥
110
·
--
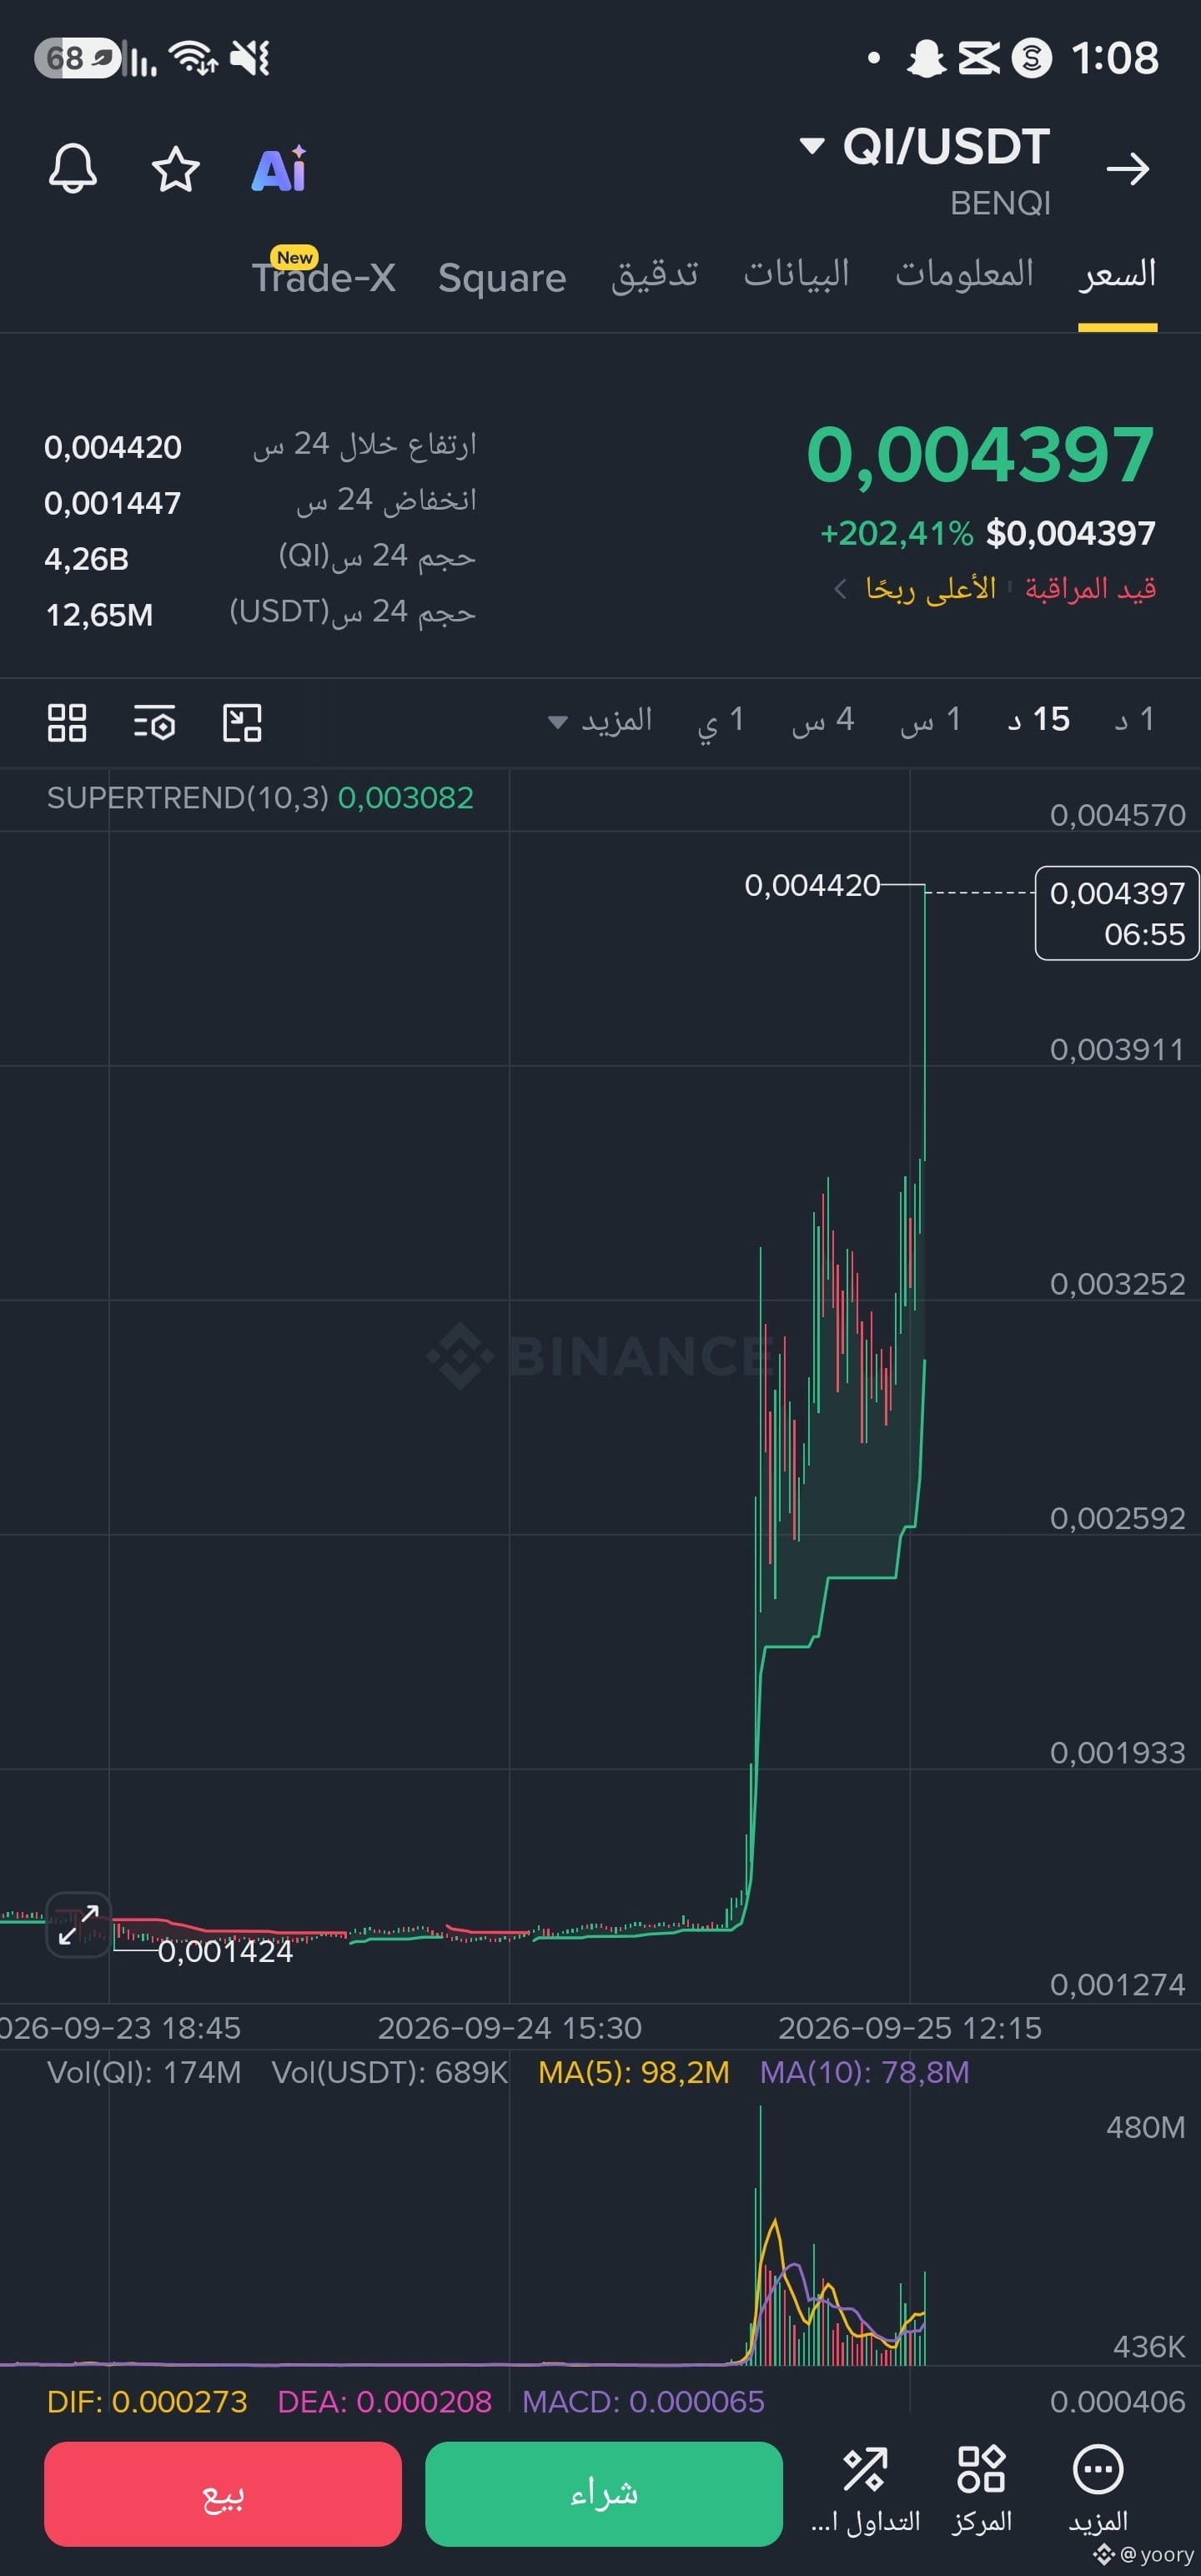
What caused it to be placed under surveillance and to rise like crazy? What is happening?
$QI 🚀🚀🚀🚀🚀
What caused it to be placed under surveillance and to rise like crazy? What is happening?
$QI 🚀🚀🚀🚀🚀
$QI 🚀🚀🚀🚀🚀
1
469
·
--
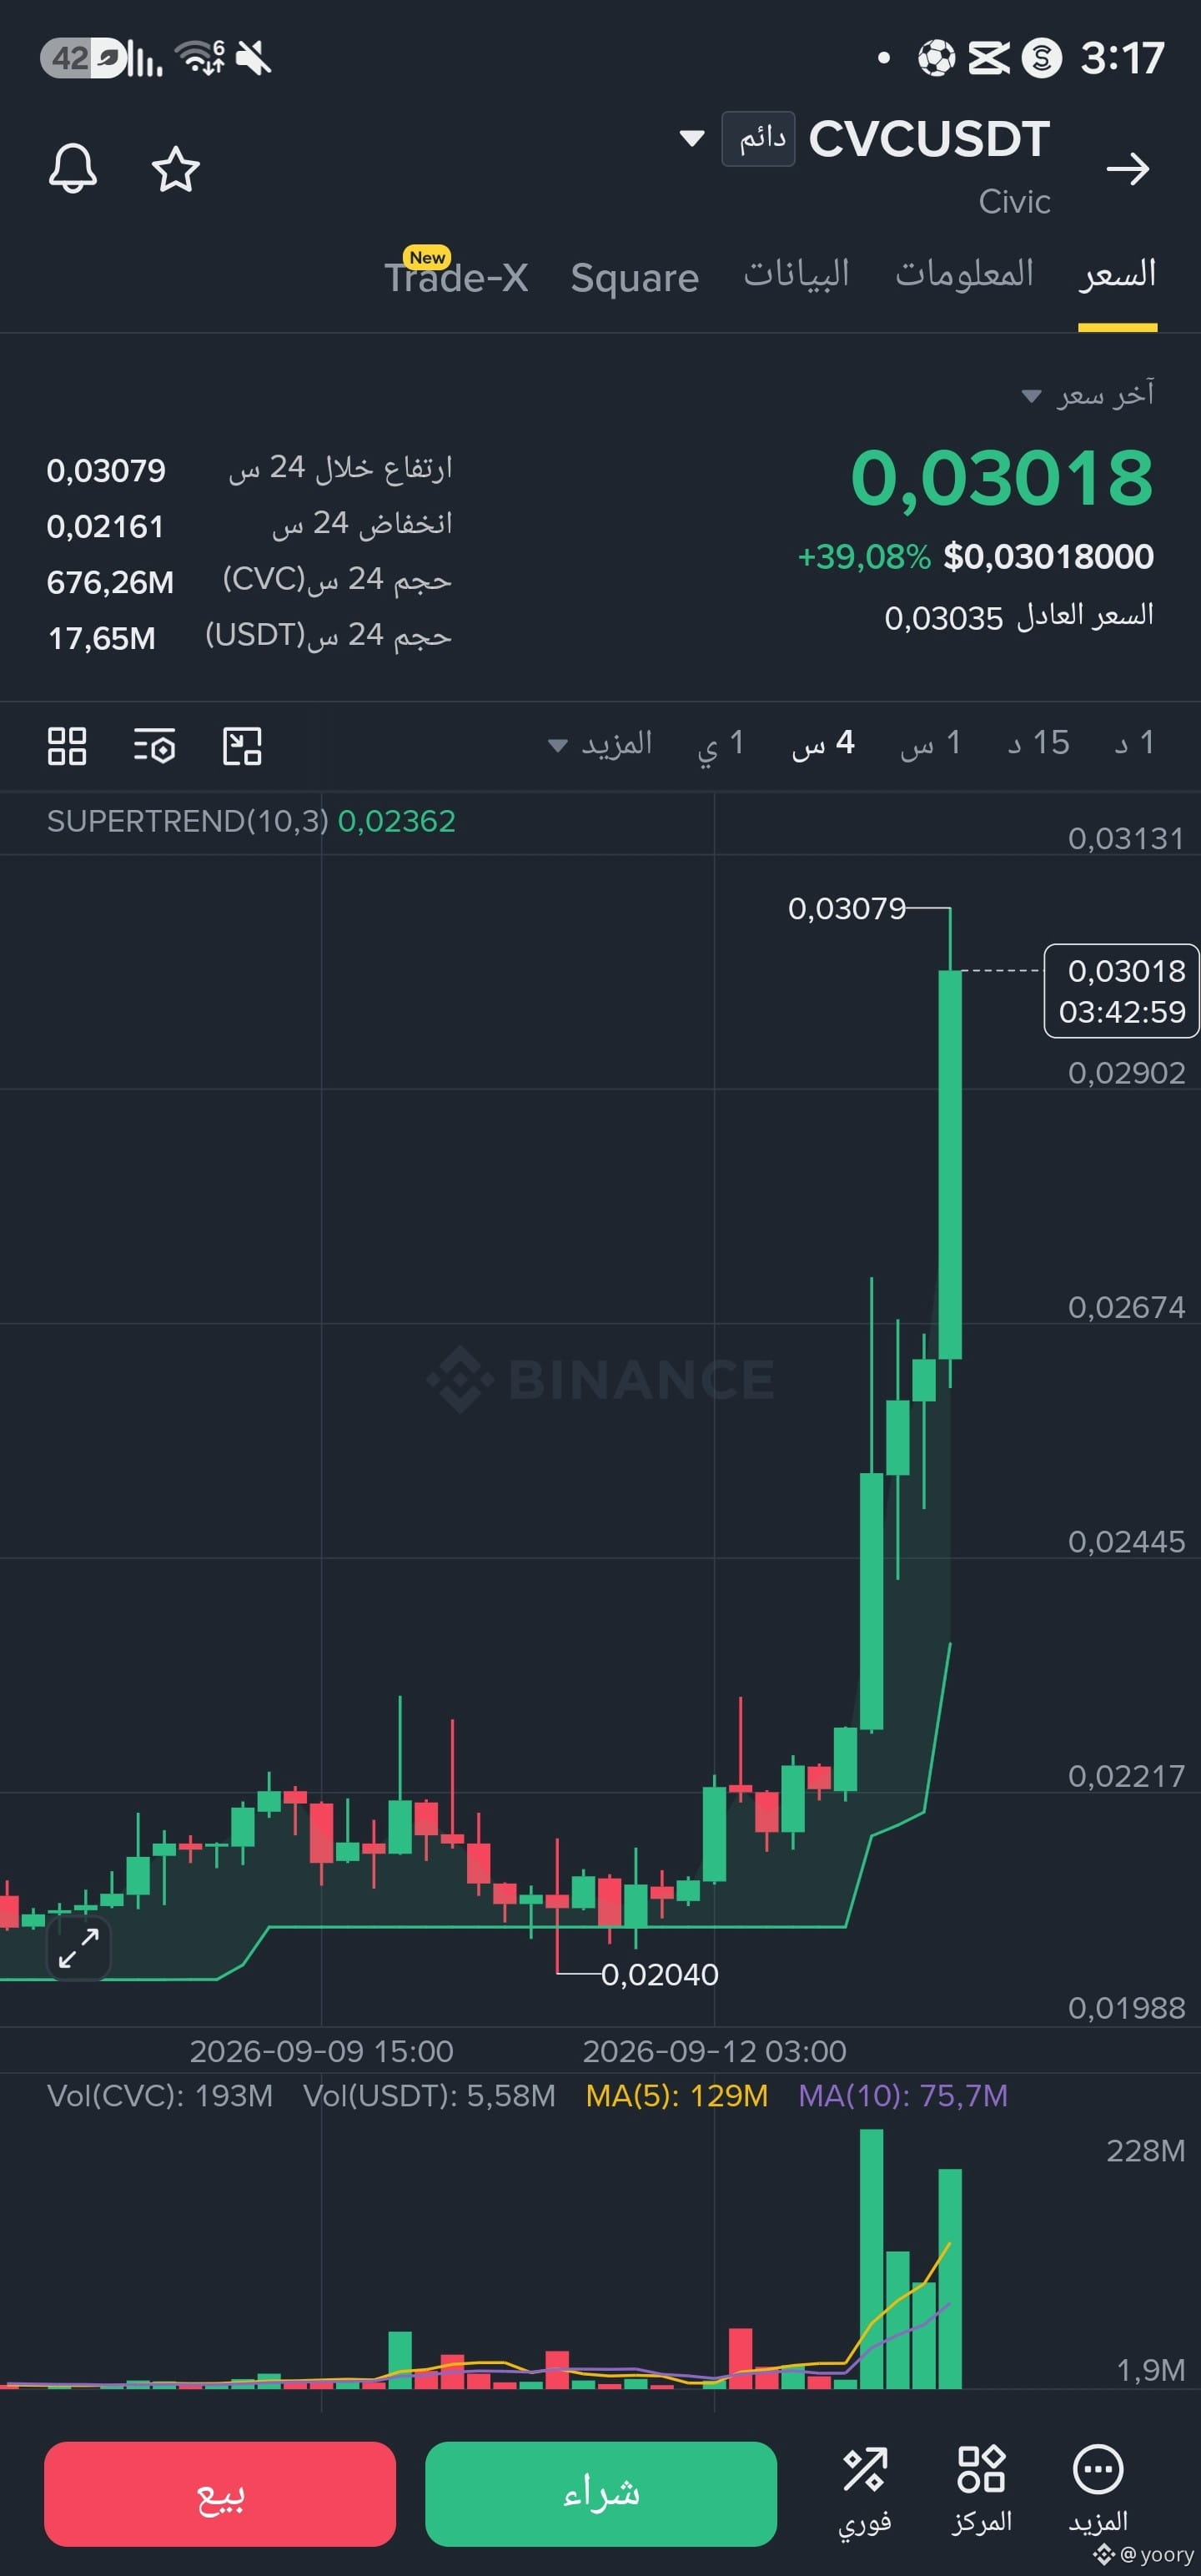
It seemed to me like I was going up 🤯🚀🚀🚀
🧑💻🧑💻🧑💻🤷♂️
$CVC
It seemed to me like I was going up 🤯🚀🚀🚀
🧑💻🧑💻🧑💻🤷♂️
$CVC
🧑💻🧑💻🧑💻🤷♂️
$CVC
1
136
·
--
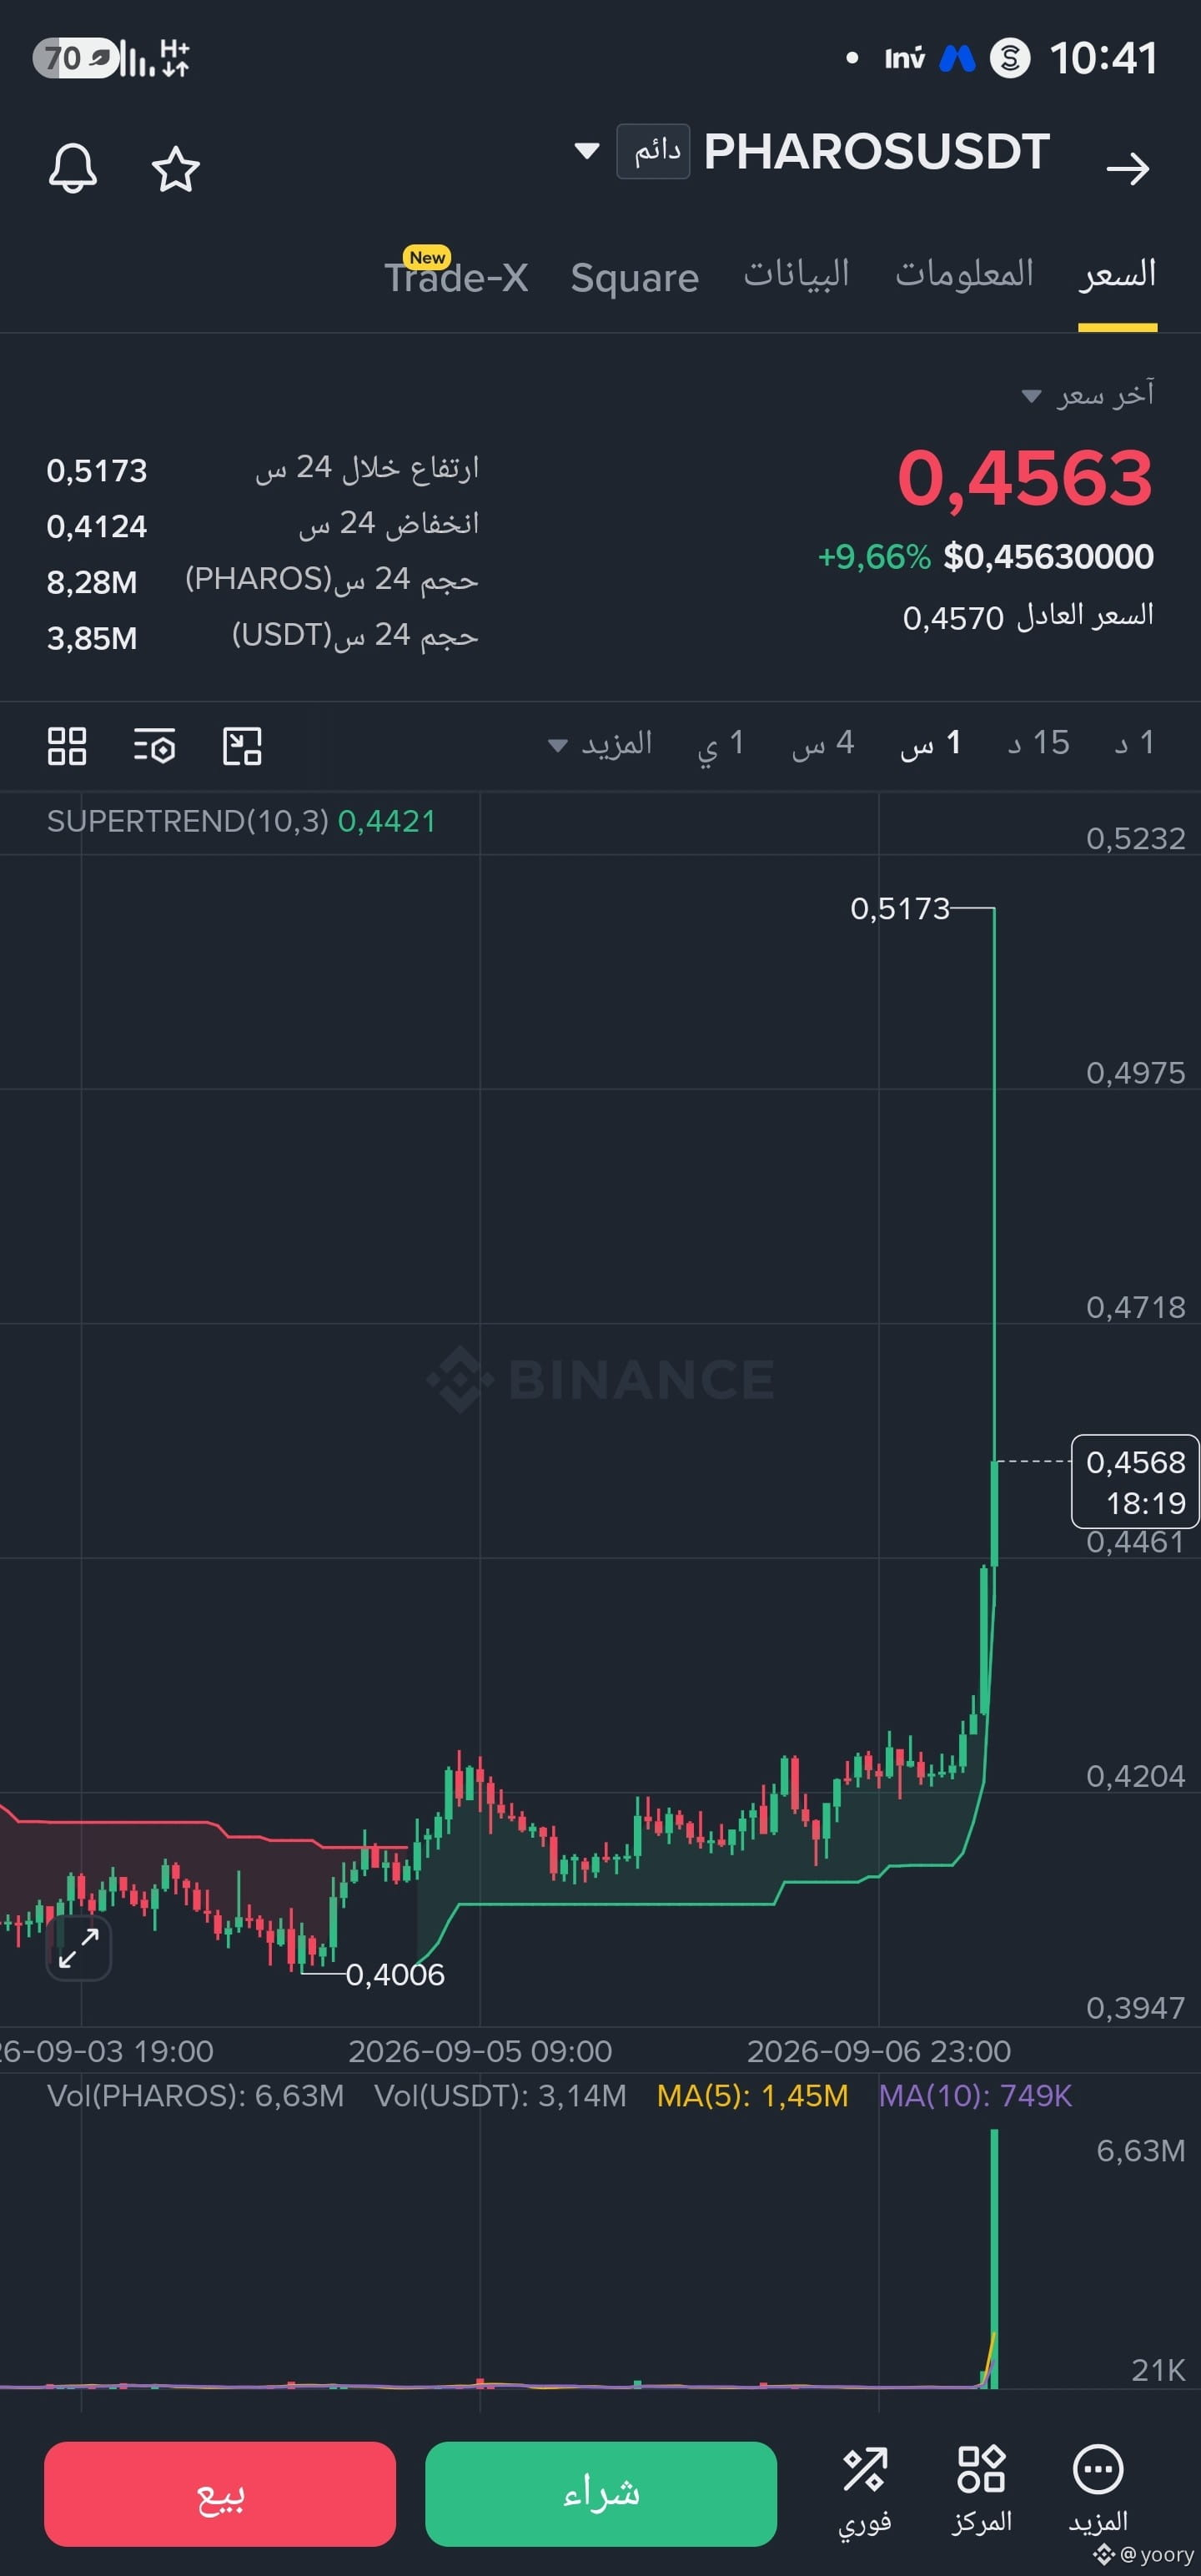
Quickly look at the $PHAROS coin
It has already exploded in fact
Will it continue, or will it burst and explode soon?
🚀🚀🚀🚀🚀
Quickly look at the $PHAROS coin
It has already exploded in fact
Will it continue, or will it burst and explode soon?
🚀🚀🚀🚀🚀
It has already exploded in fact
Will it continue, or will it burst and explode soon?
🚀🚀🚀🚀🚀
125
·
--
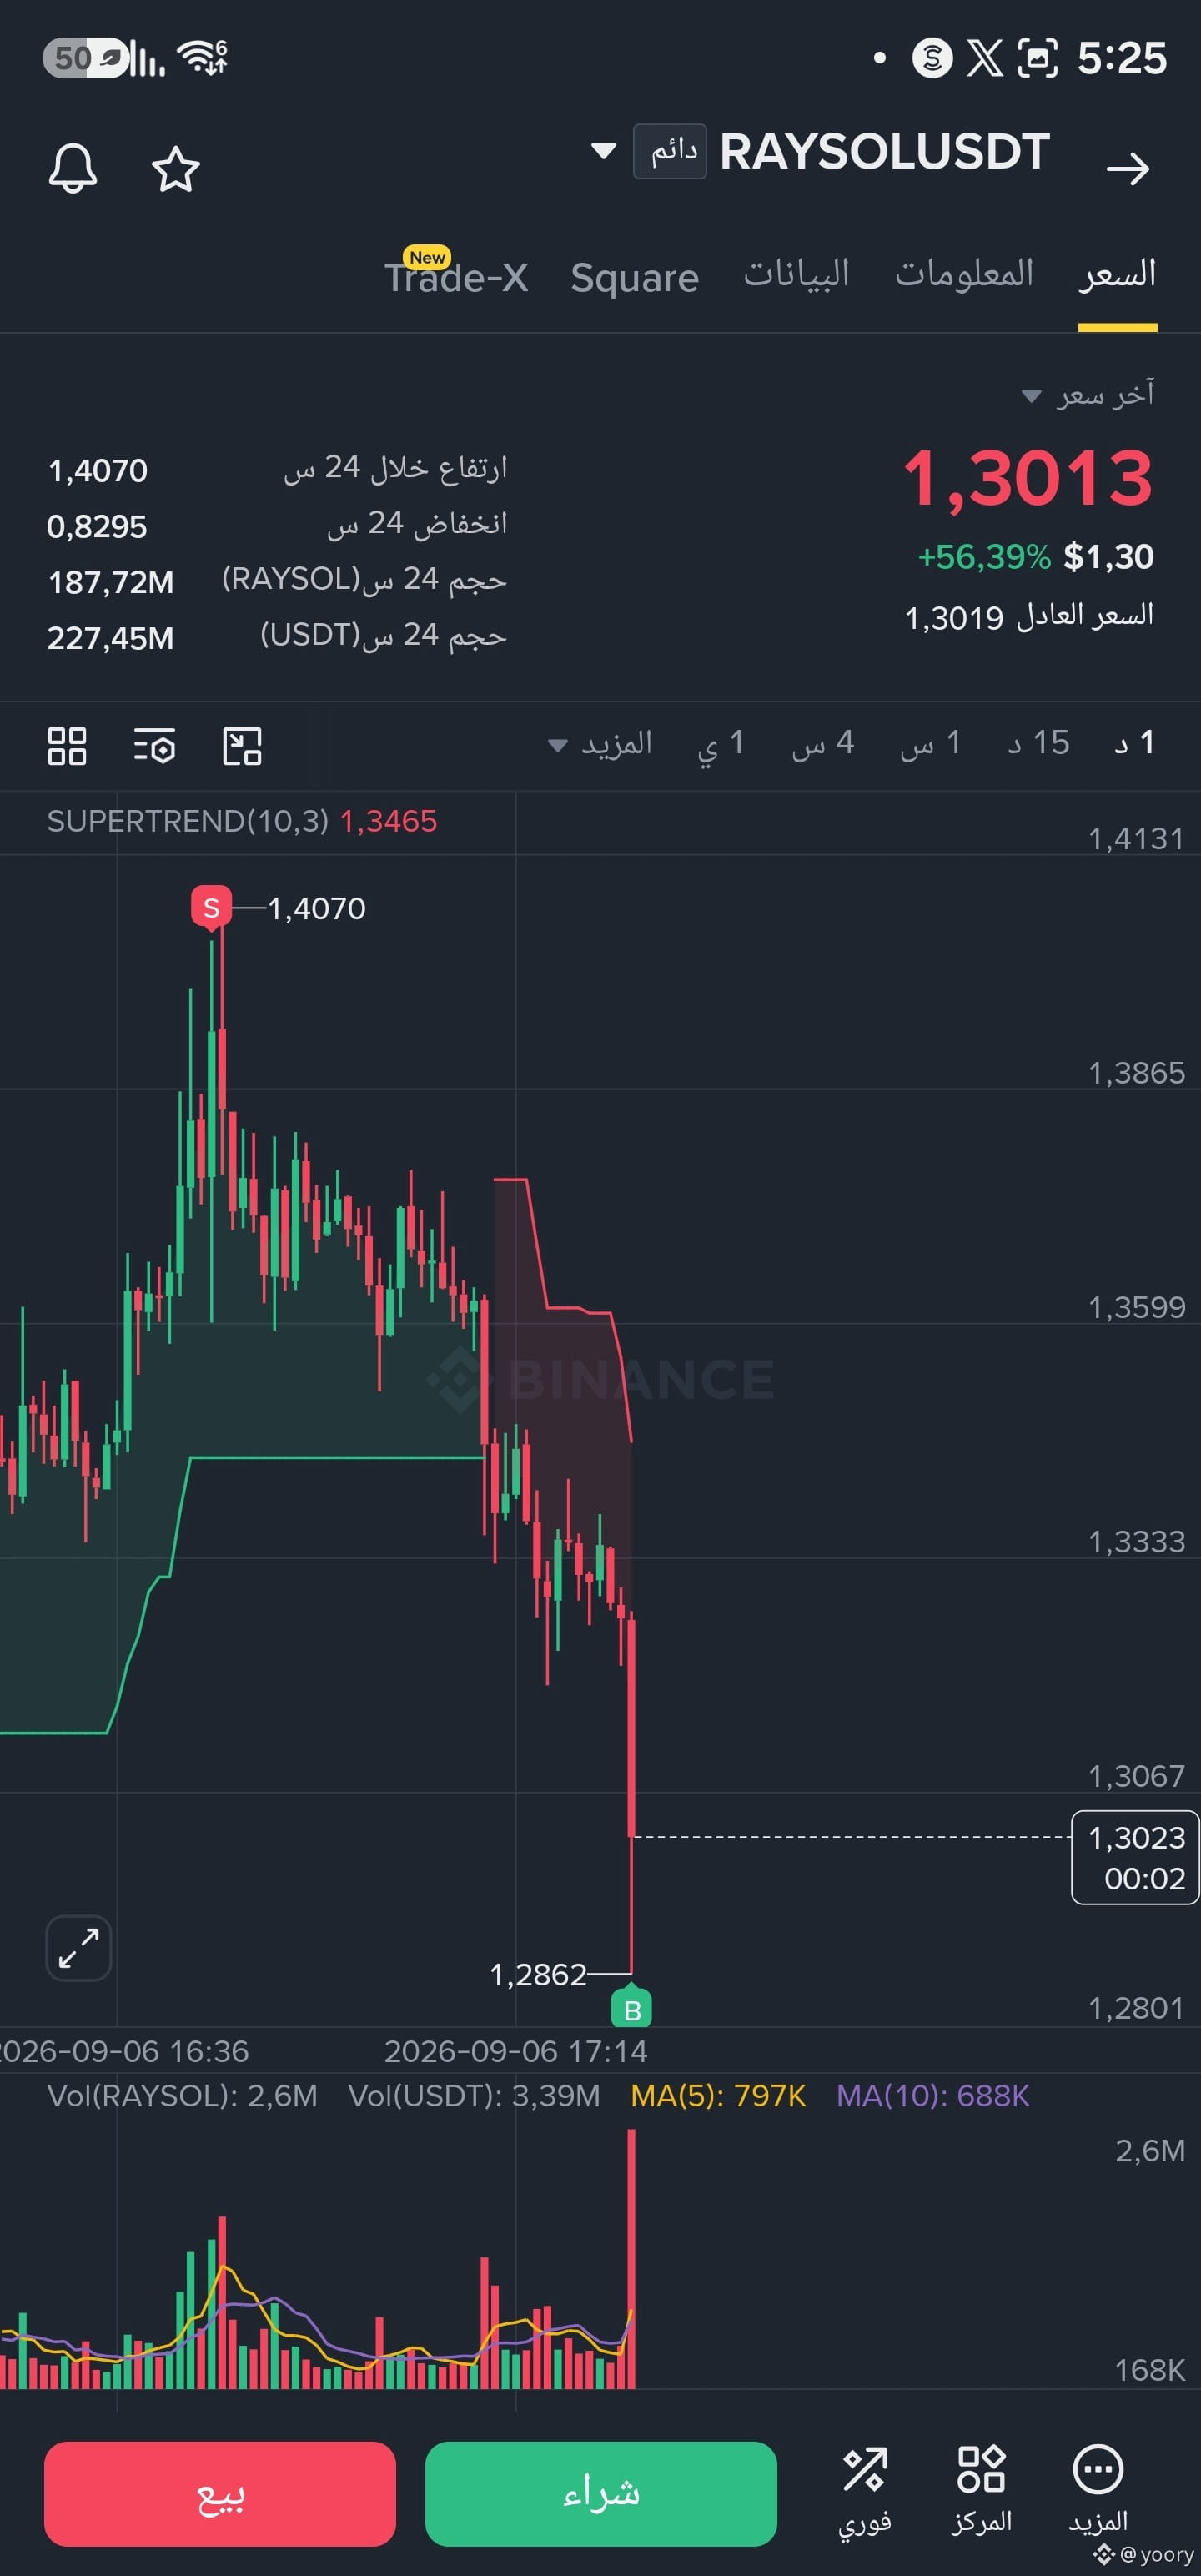
Bearish
167
·
--
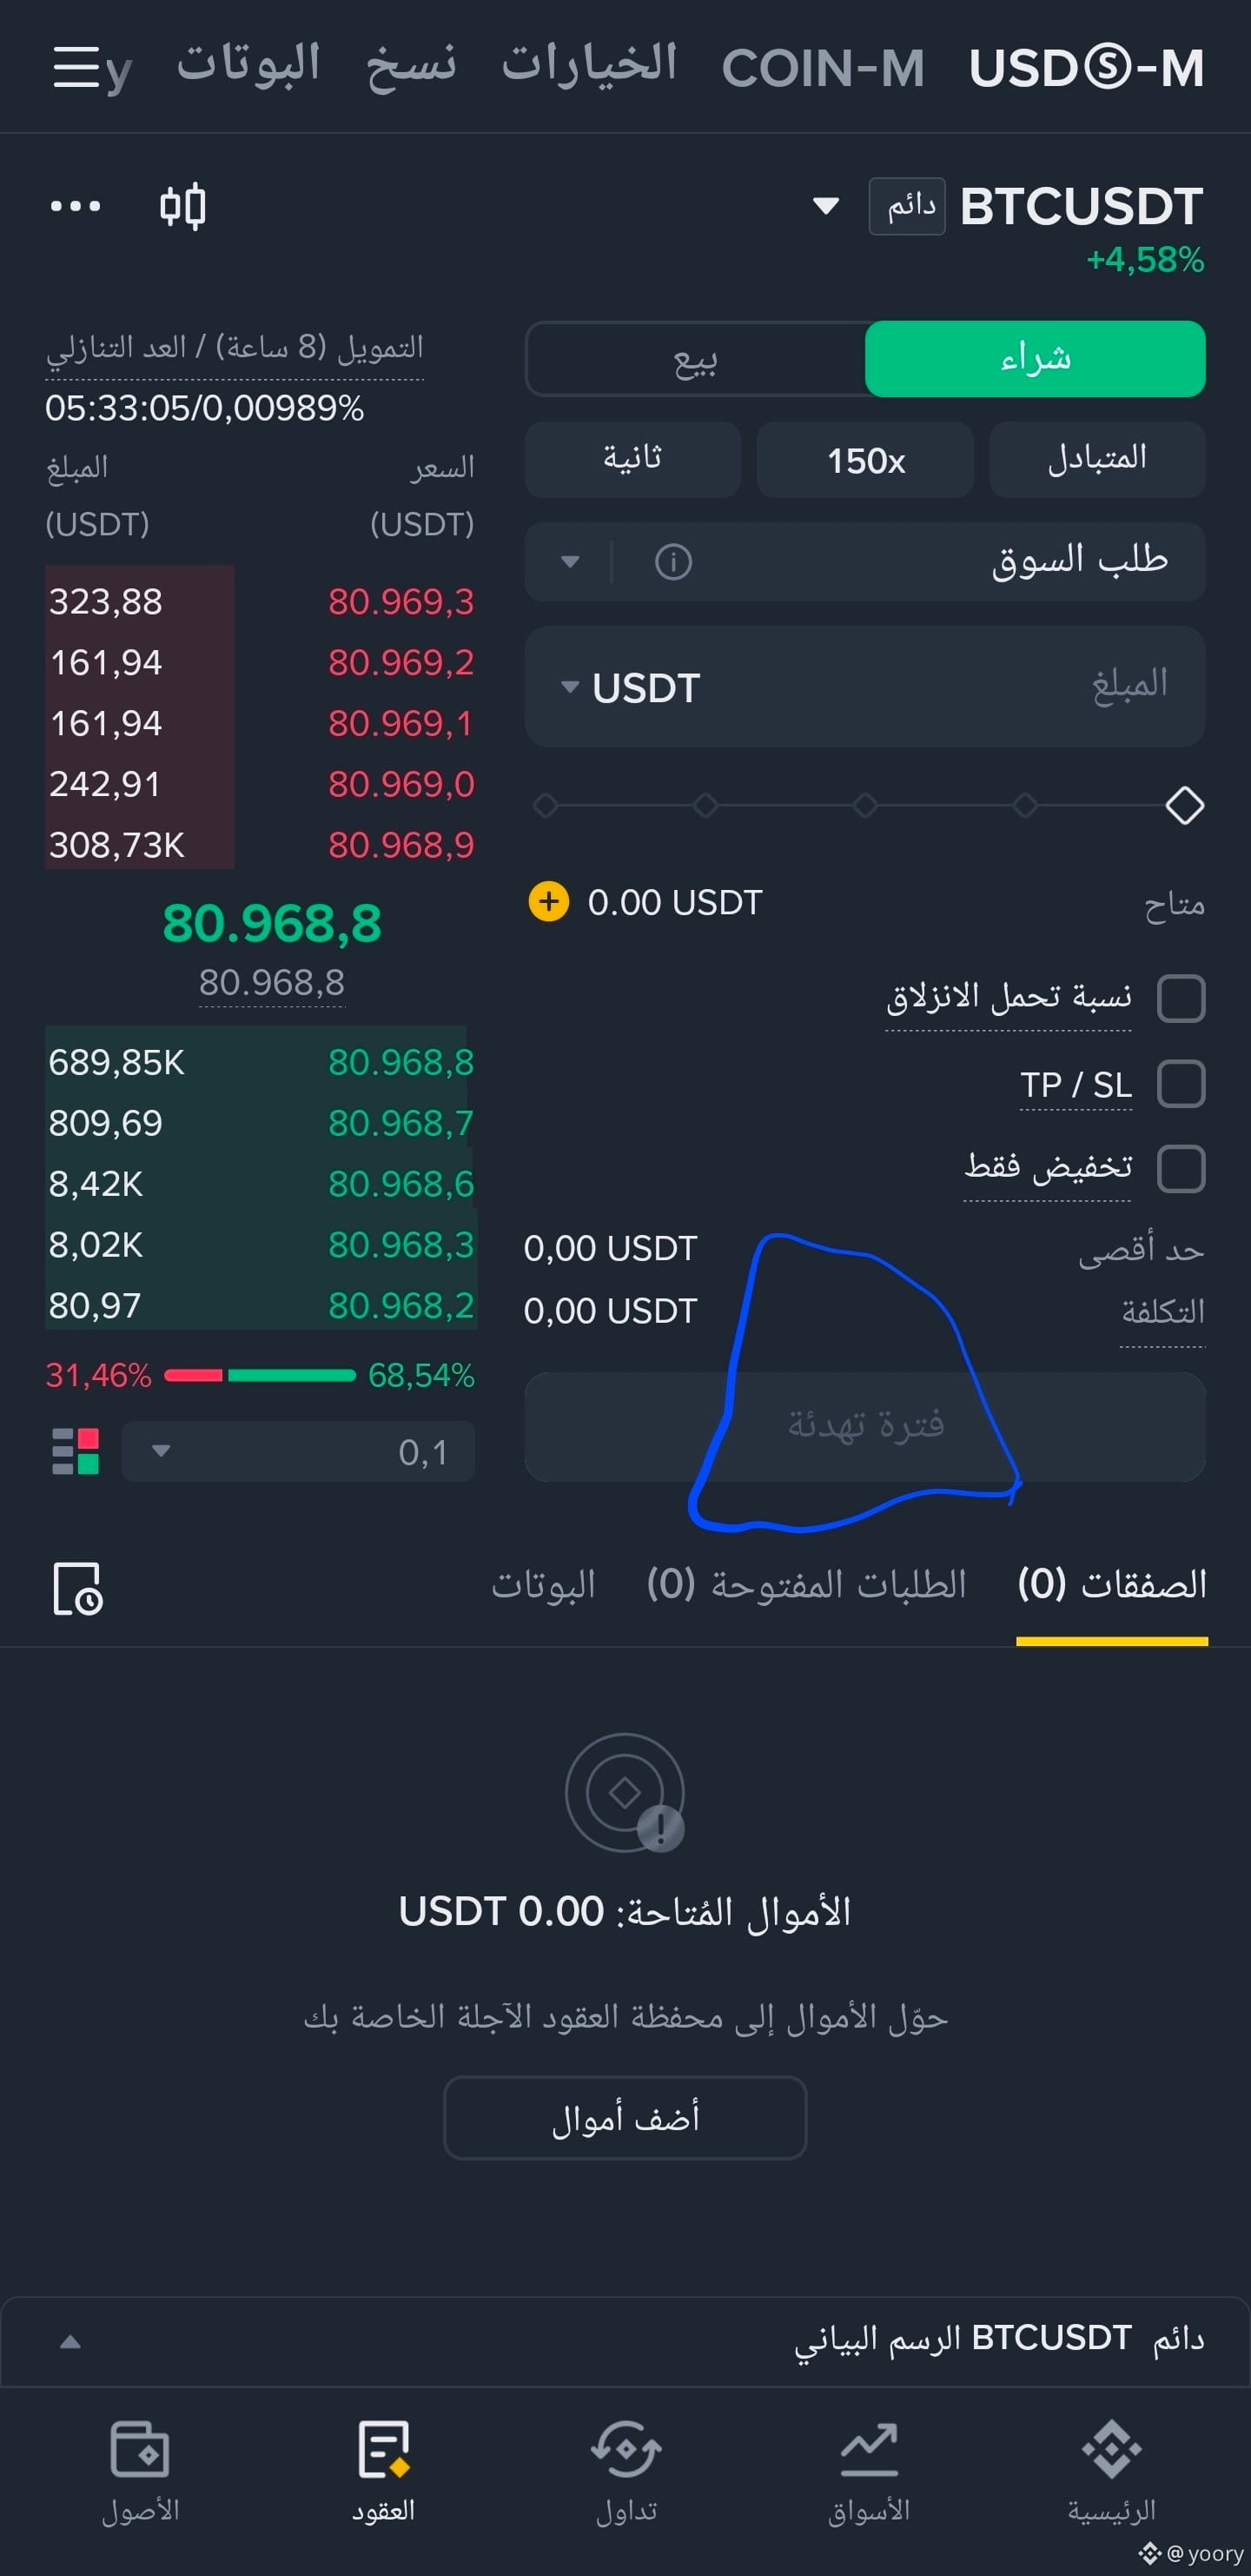
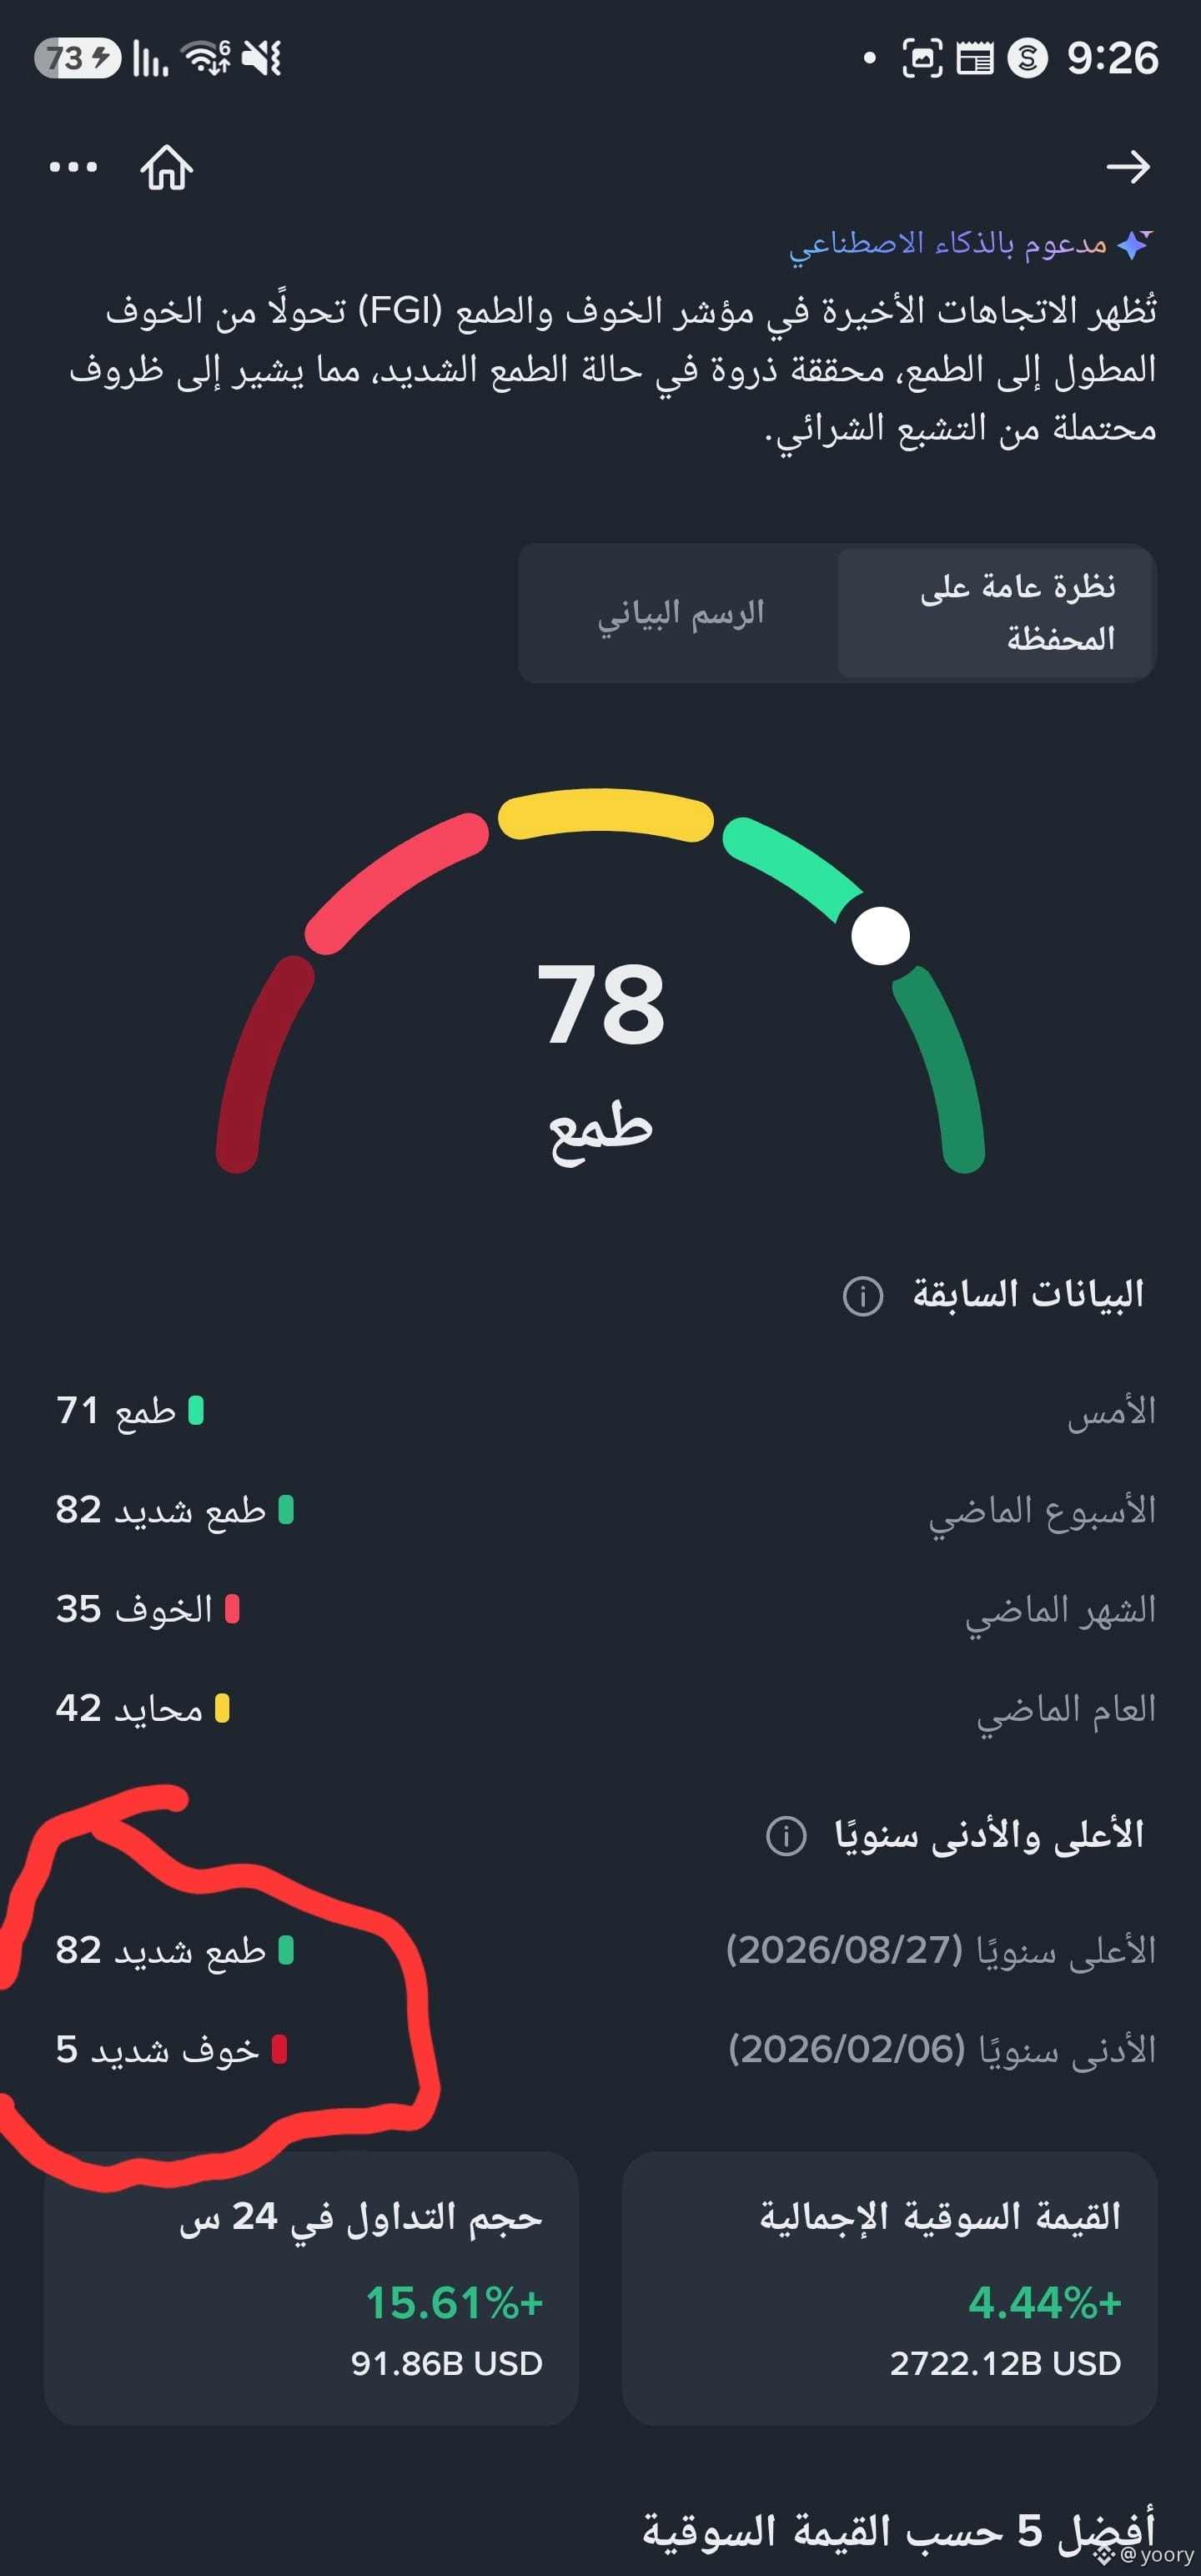
Is the market today or should I not? I will close everything; I will be a witness until Monday.
Is the market today or should I not? I will close everything; I will be a witness until Monday.
380
·
--
Bullish
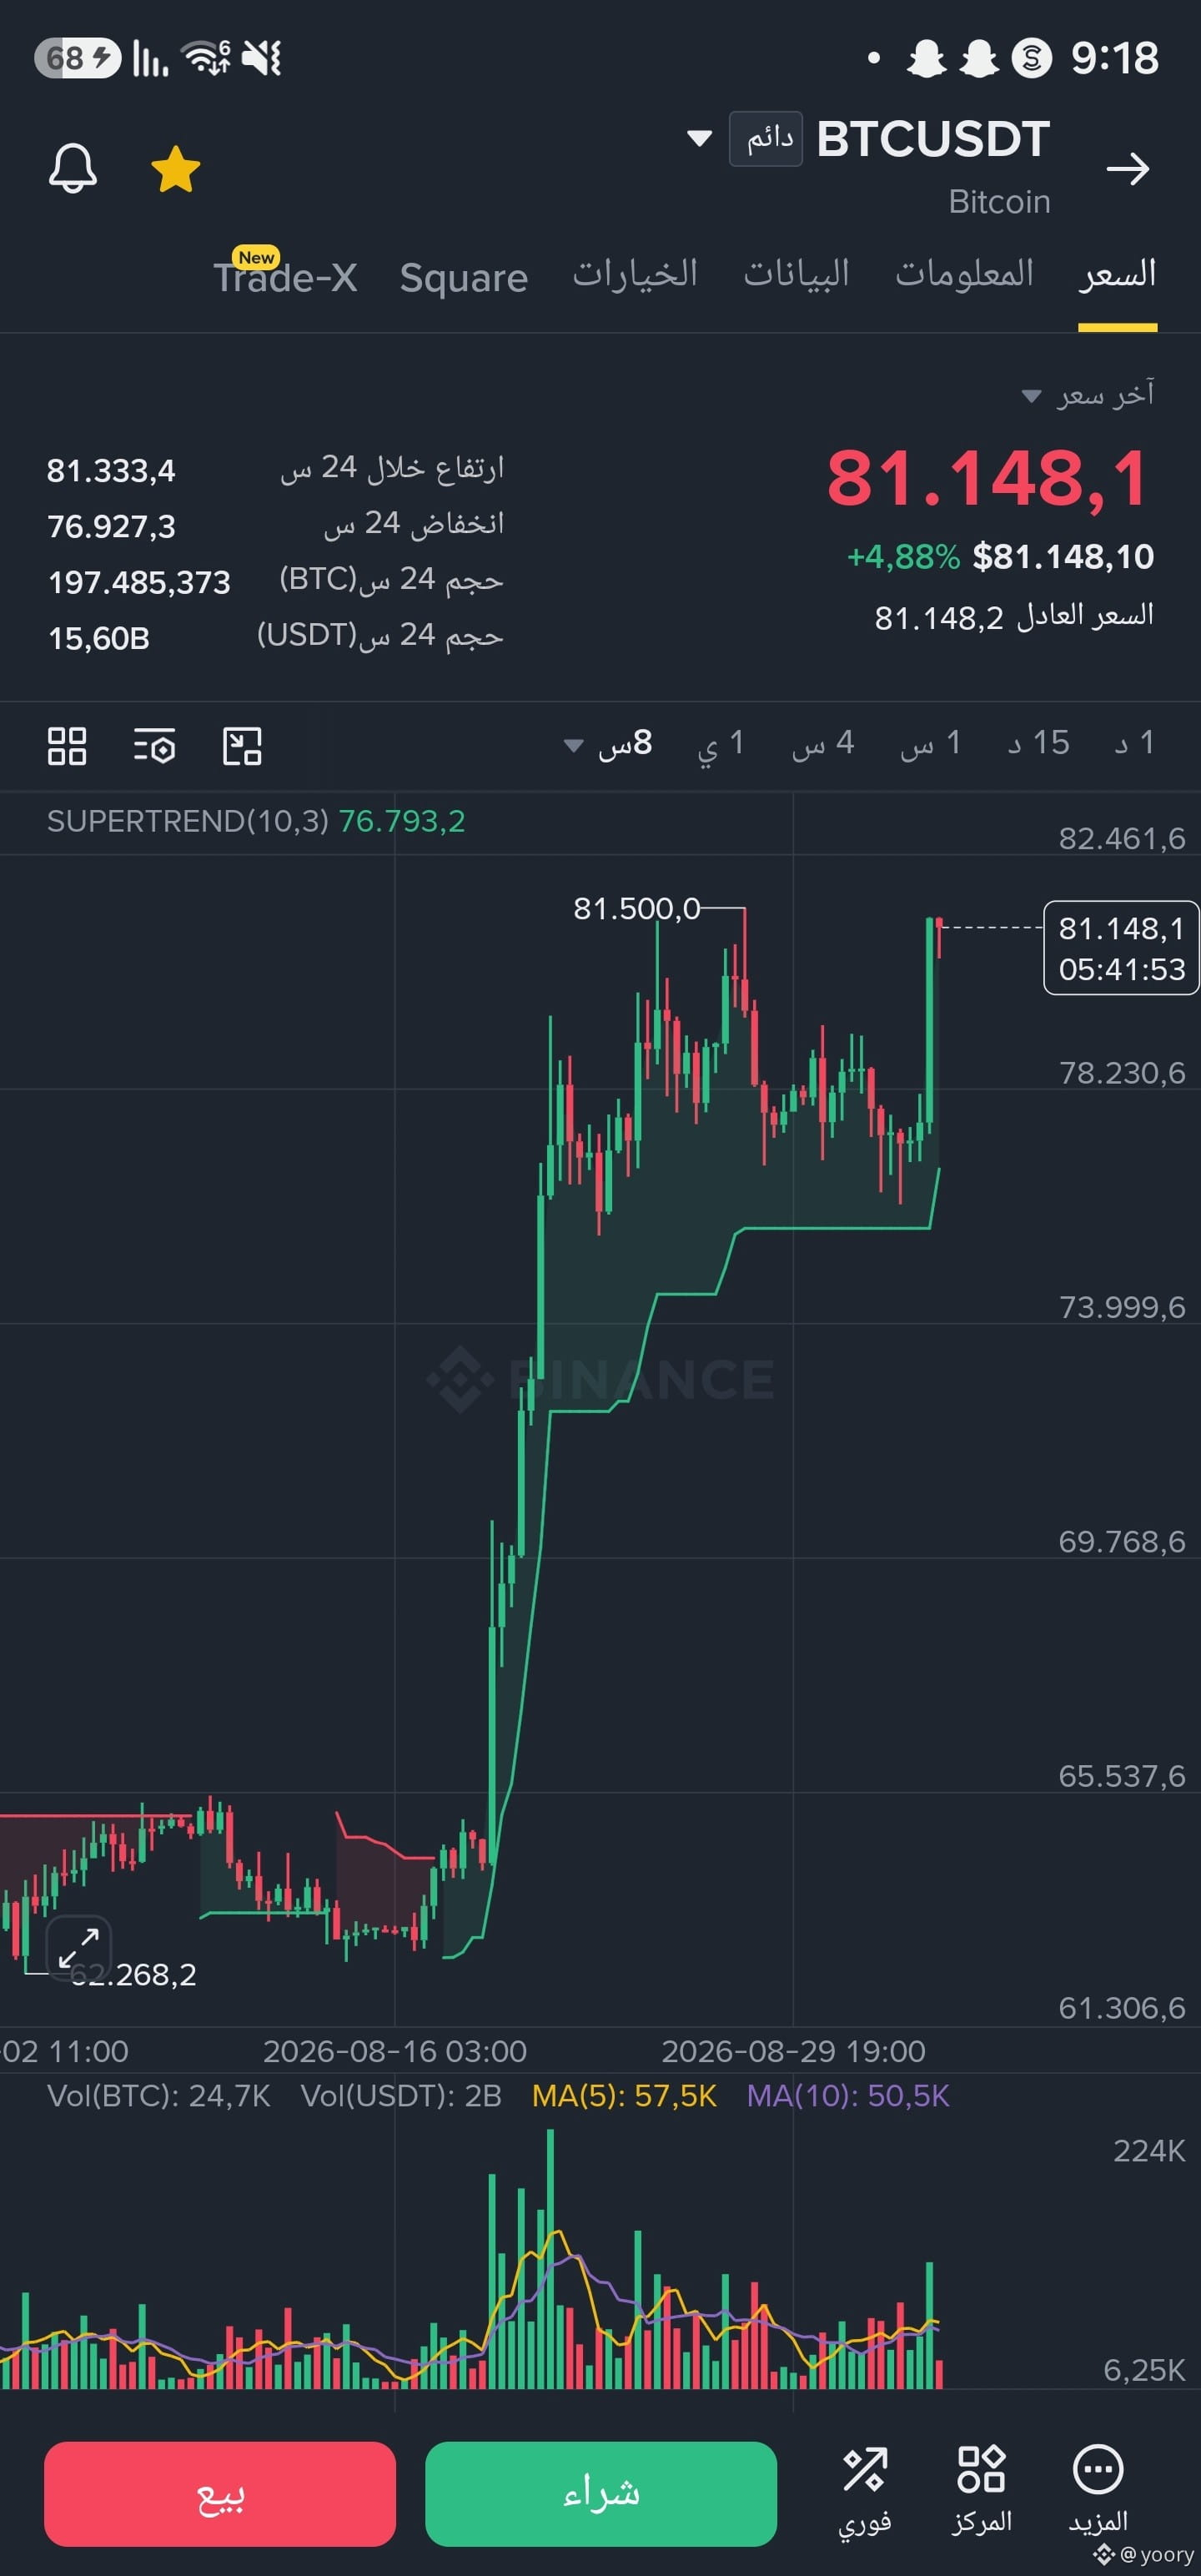
Based on the attached chart for the BTC/USDT pair on the 8-hour timeframe (8h), it shows a strong uptrend and a promising breakout above the previous high at 81,500.0.
Current readings:
Current price: 81,148.1 USDT
Breakout / nearby support level: 78,230.6 USDT
Supertrend level (main support): 76,793.2 USDT
Expected technical targets:
First target (testing and breaking the nearby high): 81,500 - 82,460 USDT (break the previous high and confirm momentum).
Second target (1.272 Fibonacci extension): 84,800 USDT
Third target (1.618 Fibonacci extension): 86,900 - 87,500 USDT
Protection and support levels:
Stop-Loss / profit protection: A break and close below 78,200 USDT cancels the short-term bullishness.
Main support: The Supertrend line at 76,793 USDT.
$BTC
136
Log in to explore more content
Join global crypto users on Binance Square
⚡️ Get latest and useful information about crypto.
💬 Trusted by the world’s largest crypto exchange.
👍 Discover real insights from verified creators.
Email / Phone number
Trending Topics
BinanceProcesses$4.65BWithdrawals
2,986 views
54 Discussing
Binance Processes $4.65 Billion in Withdrawals After Reopening, Net Outflow of $3.64 Billion Equals 2.1% of Its $171 Billion in Assets
Binance News
·30 Likes
·7k views
WithdrawalsBack: 15 networks live
4,435 views
100 Discussing
BinanceUpdatesProofofReservesAddresses
84,012 views
1,291 Discussing