

WorldOfMercek
28 Posts

WorldOfMercek
 Square Verified
Report
Block User
Alpha Content & Threads 🧵 Let's get lost together in this big Web3 space...

マクロ経済KOL
31 Following
1.0K+ Followers
374 Liked
1 Badges
Posts
PINNED
Verified

Article
Token Ownership Is Becoming a Time Series ← BUBBLEMAPSWe treat almost every important market variable as a time series:
- Price over time
- Volume over time
- Open interest over time
- Liquidity over time
Token ownership is weirdly still analyzed as a snapshot.
You open a tool like @bubblemaps look at the current wallet clusters and try to reconstruct how the supply ended up there.
The new Bubblemaps revamped version changes that.
You can now click directly on a historical candle and see the holder distribution at that point in time.
That sounds simple, but it creates a completely different way of investigating a token.
Imagine price starts running on Monday and a suspicious cluster is obvious by Friday.
The useful question isn't just whether those wallets are connected today.
I want to know what the map looked like before Monday.
Was the cluster already formed?
Did those wallets accumulate during the move?
Did concentration increase while price expanded, or did distribution actually become healthier?
Now you're comparing changes in ownership structure against changes in price instead of trying to infer everything from the final state.
Bubblemaps Score adds another layer by flagging things like insider clusters and bundled wallets, while professionally reviewed wallet labels give more context around what you're looking at.
The revamped platform also adds fresh/trending feeds across chains, customizable market filters, reviewed project socials and execution through the built-in swap.
But historical distribution is the part I'd spend some time with if you already use Bubblemaps.
A bubble map tells you how supply is connected.
A sequence of bubble maps can tell you how those connections evolved.
🔗 A much richer dataset is now available on v2.bubblemaps.io
Token Ownership Is Becoming a Time Series ← BUBBLEMAPS
We treat almost every important market variable as a time series:
- Price over time
- Volume over time
- Open interest over time
- Liquidity over time
Token ownership is weirdly still analyzed as a snapshot.
You open a tool like @Bubblemaps.io look at the current wallet clusters and try to reconstruct how the supply ended up there.
The new Bubblemaps revamped version changes that.
You can now click directly on a historical candle and see the holder distribution at that point in time.
That sounds simple, but it creates a completely different way of investigating a token.
Imagine price starts running on Monday and a suspicious cluster is obvious by Friday.
The useful question isn't just whether those wallets are connected today.
I want to know what the map looked like before Monday.
Was the cluster already formed?
Did those wallets accumulate during the move?
Did concentration increase while price expanded, or did distribution actually become healthier?
Now you're comparing changes in ownership structure against changes in price instead of trying to infer everything from the final state.
Bubblemaps Score adds another layer by flagging things like insider clusters and bundled wallets, while professionally reviewed wallet labels give more context around what you're looking at.
The revamped platform also adds fresh/trending feeds across chains, customizable market filters, reviewed project socials and execution through the built-in swap.
But historical distribution is the part I'd spend some time with if you already use Bubblemaps.
A bubble map tells you how supply is connected.
A sequence of bubble maps can tell you how those connections evolved.
🔗 A much richer dataset is now available on v2.bubblemaps.io
- Price over time
- Volume over time
- Open interest over time
- Liquidity over time
Token ownership is weirdly still analyzed as a snapshot.
You open a tool like @Bubblemaps.io look at the current wallet clusters and try to reconstruct how the supply ended up there.
The new Bubblemaps revamped version changes that.
You can now click directly on a historical candle and see the holder distribution at that point in time.
That sounds simple, but it creates a completely different way of investigating a token.
Imagine price starts running on Monday and a suspicious cluster is obvious by Friday.
The useful question isn't just whether those wallets are connected today.
I want to know what the map looked like before Monday.
Was the cluster already formed?
Did those wallets accumulate during the move?
Did concentration increase while price expanded, or did distribution actually become healthier?
Now you're comparing changes in ownership structure against changes in price instead of trying to infer everything from the final state.
Bubblemaps Score adds another layer by flagging things like insider clusters and bundled wallets, while professionally reviewed wallet labels give more context around what you're looking at.
The revamped platform also adds fresh/trending feeds across chains, customizable market filters, reviewed project socials and execution through the built-in swap.
But historical distribution is the part I'd spend some time with if you already use Bubblemaps.
A bubble map tells you how supply is connected.
A sequence of bubble maps can tell you how those connections evolved.
🔗 A much richer dataset is now available on v2.bubblemaps.io
12
9
25.4k
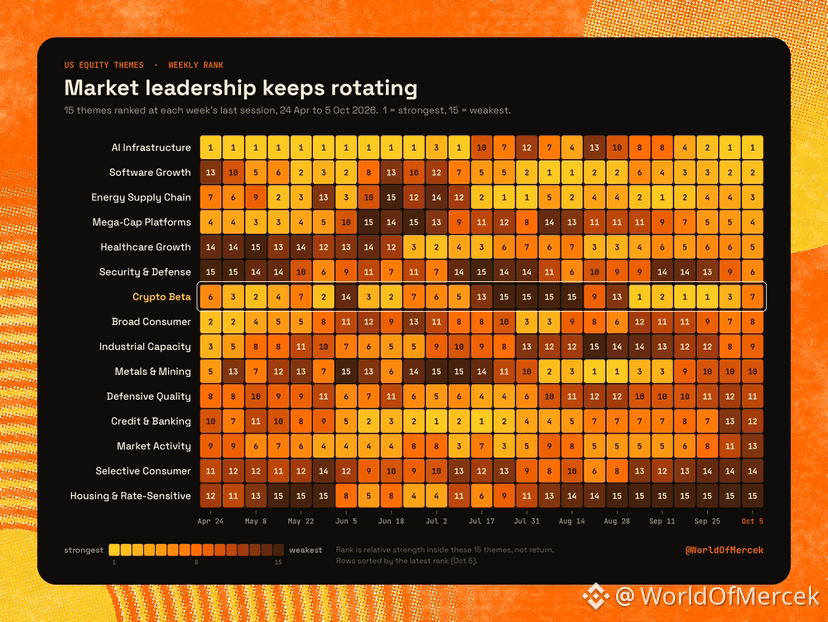
Six different themes have been #1 in US equities over the last six months. And since July nothing has held the top spot for more than 2 weeks in a row.
- AI infra was #1 for 10 straight weeks into late June, dropped as low as 13th in late August, and now it's back on top
- Software went from 13th in April to #1 in August and it's still sitting at 2nd
- Energy was all over the place early on but hasn't left the top 5 since mid July
Crypto beta (basically crypto stocks, not the coins) is the wild one here. It was dead last 4 weeks in a row from late July to mid August. Then it went from 13th to 1st in one week in early September. Held #1 for most of September, and as of Monday it's back to 7th, pretty much the same moment AI infra took the lead back.
So there's risk appetite, it's just not staying anywhere for long.
My take: I don't think crypto's September run is real leadership yet. Back in June it went from 2nd to 14th in a single week, so it can lose the spot as fast as it gets it. If it holds the top 3 for a month I'll look at it differently. Until then it's just money passing through to me.
Six different themes have been #1 in US equities over the last six months. And since July nothing has held the top spot for more than 2 weeks in a row.
- AI infra was #1 for 10 straight weeks into late June, dropped as low as 13th in late August, and now it's back on top
- Software went from 13th in April to #1 in August and it's still sitting at 2nd
- Energy was all over the place early on but hasn't left the top 5 since mid July
Crypto beta (basically crypto stocks, not the coins) is the wild one here. It was dead last 4 weeks in a row from late July to mid August. Then it went from 13th to 1st in one week in early September. Held #1 for most of September, and as of Monday it's back to 7th, pretty much the same moment AI infra took the lead back.
So there's risk appetite, it's just not staying anywhere for long.
My take: I don't think crypto's September run is real leadership yet. Back in June it went from 2nd to 14th in a single week, so it can lose the spot as fast as it gets it. If it holds the top 3 for a month I'll look at it differently. Until then it's just money passing through to me.
- AI infra was #1 for 10 straight weeks into late June, dropped as low as 13th in late August, and now it's back on top
- Software went from 13th in April to #1 in August and it's still sitting at 2nd
- Energy was all over the place early on but hasn't left the top 5 since mid July
Crypto beta (basically crypto stocks, not the coins) is the wild one here. It was dead last 4 weeks in a row from late July to mid August. Then it went from 13th to 1st in one week in early September. Held #1 for most of September, and as of Monday it's back to 7th, pretty much the same moment AI infra took the lead back.
So there's risk appetite, it's just not staying anywhere for long.
My take: I don't think crypto's September run is real leadership yet. Back in June it went from 2nd to 14th in a single week, so it can lose the spot as fast as it gets it. If it holds the top 3 for a month I'll look at it differently. Until then it's just money passing through to me.
1
298
Back on Sep 23 I shared a breadth framework on X but never posted it here, so let me put both parts together.
At the time, altcoin breadth was starting to improve. More coins were outperforming Bitcoin and the market looked less dependent on a tiny group of winners.
That was encouraging, but breadth expanding during a strong BTC rebound isn't new. We've seen it several times over the last 5–6 years. What usually failed was keeping that participation alive once Bitcoin stopped doing all the work.
So the real test was what happens while BTC consolidates. I wanted to see two things.
The number of altcoins beating Bitcoin should stay high.
And if you remove the strongest leaders, the rest of the market shouldn't fall straight back into negative territory.
If breadth collapses as soon as BTC loses momentum, it was probably just a strong relief move rather than a real change in market structure.
Here's where things stand now.
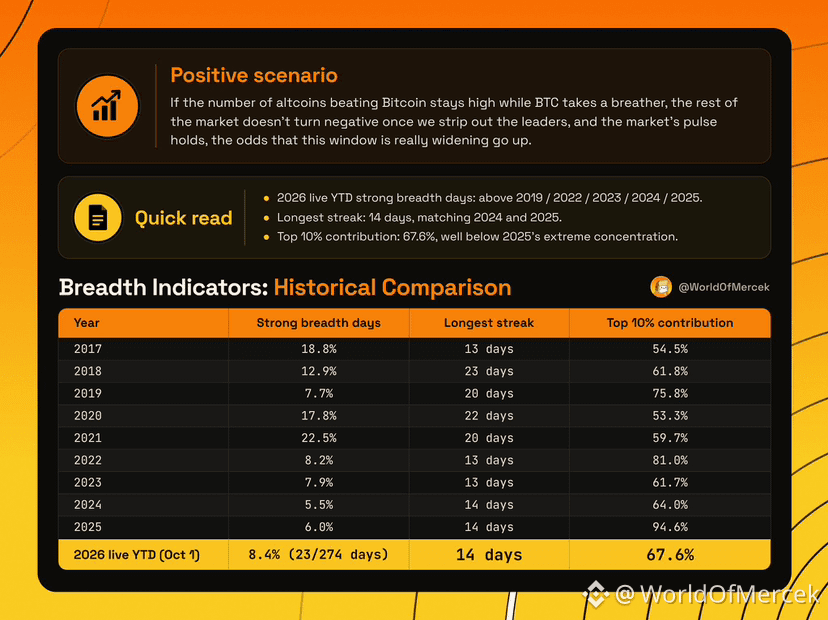
So far in 2026, 8.4% of days have shown strong breadth. That's the highest since 2021, and above 2019, 2022, 2023, 2024 and 2025.
The longest streak is 14 days, the same as 2024 and 2025.
The part I care about most is concentration. The top 10% of coins accounted for 67.6% of the total contribution. Last year that was 94.6%, which means the move was much more dependent on a handful of names. It's not exactly the second condition, but it points the same way: this move is leaning less on its leaders.
We're still well below the breadth we saw in 2017, 2018, 2020 and 2021, so I'm not calling this an altseason.
But for now, the picture is leaning toward the positive branch of that scenario tree.
Back on Sep 23 I shared a breadth framework on X but never posted it here, so let me put both parts together.
At the time, altcoin breadth was starting to improve. More coins were outperforming Bitcoin and the market looked less dependent on a tiny group of winners.
That was encouraging, but breadth expanding during a strong BTC rebound isn't new. We've seen it several times over the last 5–6 years. What usually failed was keeping that participation alive once Bitcoin stopped doing all the work.
So the real test was what happens while BTC consolidates. I wanted to see two things.
The number of altcoins beating Bitcoin should stay high.
And if you remove the strongest leaders, the rest of the market shouldn't fall straight back into negative territory.
If breadth collapses as soon as BTC loses momentum, it was probably just a strong relief move rather than a real change in market structure.
Here's where things stand now.
So far in 2026, 8.4% of days have shown strong breadth. That's the highest since 2021, and above 2019, 2022, 2023, 2024 and 2025.
The longest streak is 14 days, the same as 2024 and 2025.
The part I care about most is concentration. The top 10% of coins accounted for 67.6% of the total contribution. Last year that was 94.6%, which means the move was much more dependent on a handful of names. It's not exactly the second condition, but it points the same way: this move is leaning less on its leaders.
We're still well below the breadth we saw in 2017, 2018, 2020 and 2021, so I'm not calling this an altseason.
But for now, the picture is leaning toward the positive branch of that scenario tree.
At the time, altcoin breadth was starting to improve. More coins were outperforming Bitcoin and the market looked less dependent on a tiny group of winners.
That was encouraging, but breadth expanding during a strong BTC rebound isn't new. We've seen it several times over the last 5–6 years. What usually failed was keeping that participation alive once Bitcoin stopped doing all the work.
So the real test was what happens while BTC consolidates. I wanted to see two things.
The number of altcoins beating Bitcoin should stay high.
And if you remove the strongest leaders, the rest of the market shouldn't fall straight back into negative territory.
If breadth collapses as soon as BTC loses momentum, it was probably just a strong relief move rather than a real change in market structure.
Here's where things stand now.
So far in 2026, 8.4% of days have shown strong breadth. That's the highest since 2021, and above 2019, 2022, 2023, 2024 and 2025.
The longest streak is 14 days, the same as 2024 and 2025.
The part I care about most is concentration. The top 10% of coins accounted for 67.6% of the total contribution. Last year that was 94.6%, which means the move was much more dependent on a handful of names. It's not exactly the second condition, but it points the same way: this move is leaning less on its leaders.
We're still well below the breadth we saw in 2017, 2018, 2020 and 2021, so I'm not calling this an altseason.
But for now, the picture is leaning toward the positive branch of that scenario tree.
349
Verified
The Fed ended up doing the tightening itself.
That’s interesting because there was another way this could have played out.
Earlier this year, the policy rate was sitting still while inflation was moving higher. The result was easy to miss if you only watched the headline rate: monetary policy was becoming less restrictive in real terms.
I wrote about it in May because that dynamic couldn’t run forever.
The adjustment could come from either side.
Inflation pressure could ease enough to restore some of the Fed’s real restraint, or the Fed could eventually raise rates to do it directly.
Four months later, we’ve had some of both.
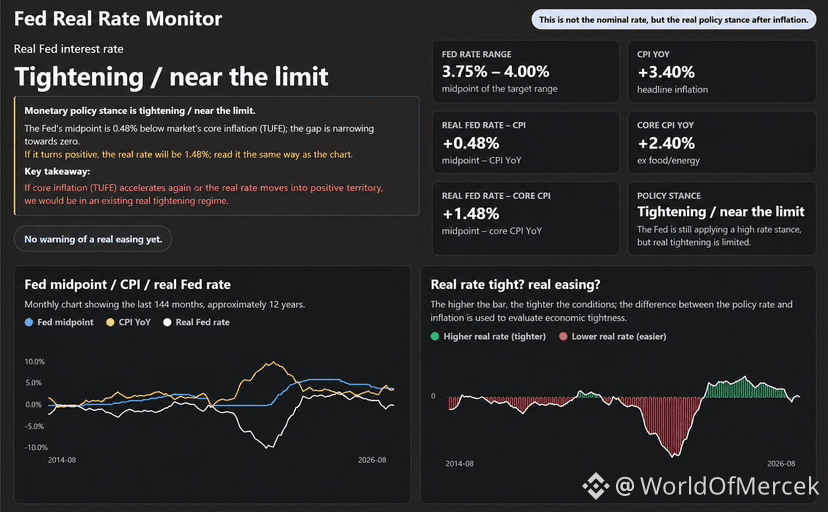
Inflation has pulled back from its recent highs, and yesterday the Fed raised the target range by 25 bps to 3.75–4.00%. The FOMC itself still describes inflation as elevated.
The real-rate compression I was watching earlier this year has now largely reversed.
But there’s a policy angle here that I think gets overlooked.
Trump has repeatedly wanted lower interest rates, but the conditions that make lower rates possible aren’t entirely outside the administration’s influence.
The White House can’t set the Fed funds rate. But trade policy, fiscal choices, energy conditions and geopolitical developments can affect the inflation environment the Fed has to navigate. Fed officials themselves have discussed tariffs and geopolitical/energy shocks as contributors to recent inflation, while also noting that some of those effects may now be fading.
So there are two very different ways to get toward lower rates.
Ask the Fed to tolerate more inflation.
Or help create an environment where inflation falls enough that the Fed actually has room to ease.
The second route requires less work from monetary policy.
For now, though, the adjustment came partly through the Fed.
The real easing I was worried about in May has largely disappeared.
And that’s a much more meaningful change than simply saying rates went up 25 bps.
The Fed ended up doing the tightening itself.
That’s interesting because there was another way this could have played out.
Earlier this year, the policy rate was sitting still while inflation was moving higher. The result was easy to miss if you only watched the headline rate: monetary policy was becoming less restrictive in real terms.
I wrote about it in May because that dynamic couldn’t run forever.
The adjustment could come from either side.
Inflation pressure could ease enough to restore some of the Fed’s real restraint, or the Fed could eventually raise rates to do it directly.
Four months later, we’ve had some of both.
Inflation has pulled back from its recent highs, and yesterday the Fed raised the target range by 25 bps to 3.75–4.00%. The FOMC itself still describes inflation as elevated.
The real-rate compression I was watching earlier this year has now largely reversed.
But there’s a policy angle here that I think gets overlooked.
Trump has repeatedly wanted lower interest rates, but the conditions that make lower rates possible aren’t entirely outside the administration’s influence.
The White House can’t set the Fed funds rate. But trade policy, fiscal choices, energy conditions and geopolitical developments can affect the inflation environment the Fed has to navigate. Fed officials themselves have discussed tariffs and geopolitical/energy shocks as contributors to recent inflation, while also noting that some of those effects may now be fading.
So there are two very different ways to get toward lower rates.
Ask the Fed to tolerate more inflation.
Or help create an environment where inflation falls enough that the Fed actually has room to ease.
The second route requires less work from monetary policy.
For now, though, the adjustment came partly through the Fed.
The real easing I was worried about in May has largely disappeared.
And that’s a much more meaningful change than simply saying rates went up 25 bps.
That’s interesting because there was another way this could have played out.
Earlier this year, the policy rate was sitting still while inflation was moving higher. The result was easy to miss if you only watched the headline rate: monetary policy was becoming less restrictive in real terms.
I wrote about it in May because that dynamic couldn’t run forever.
The adjustment could come from either side.
Inflation pressure could ease enough to restore some of the Fed’s real restraint, or the Fed could eventually raise rates to do it directly.
Four months later, we’ve had some of both.
Inflation has pulled back from its recent highs, and yesterday the Fed raised the target range by 25 bps to 3.75–4.00%. The FOMC itself still describes inflation as elevated.
The real-rate compression I was watching earlier this year has now largely reversed.
But there’s a policy angle here that I think gets overlooked.
Trump has repeatedly wanted lower interest rates, but the conditions that make lower rates possible aren’t entirely outside the administration’s influence.
The White House can’t set the Fed funds rate. But trade policy, fiscal choices, energy conditions and geopolitical developments can affect the inflation environment the Fed has to navigate. Fed officials themselves have discussed tariffs and geopolitical/energy shocks as contributors to recent inflation, while also noting that some of those effects may now be fading.
So there are two very different ways to get toward lower rates.
Ask the Fed to tolerate more inflation.
Or help create an environment where inflation falls enough that the Fed actually has room to ease.
The second route requires less work from monetary policy.
For now, though, the adjustment came partly through the Fed.
The real easing I was worried about in May has largely disappeared.
And that’s a much more meaningful change than simply saying rates went up 25 bps.
1
1
816
$ETH breaking its previous local high while $BTC hasn't looks important on a chart, but I'm not sure it's as meaningful as it seems.
The problem with comparing the two directly is that you're comparing assets with very different volatility right now.
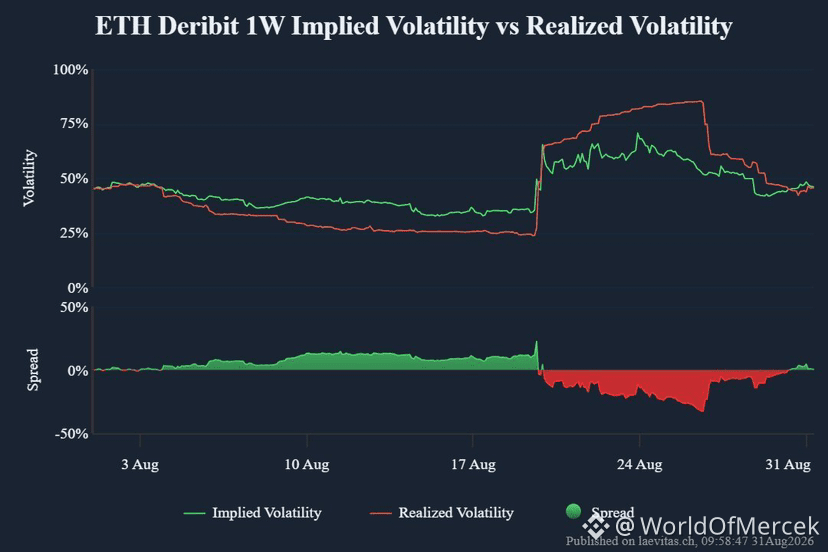
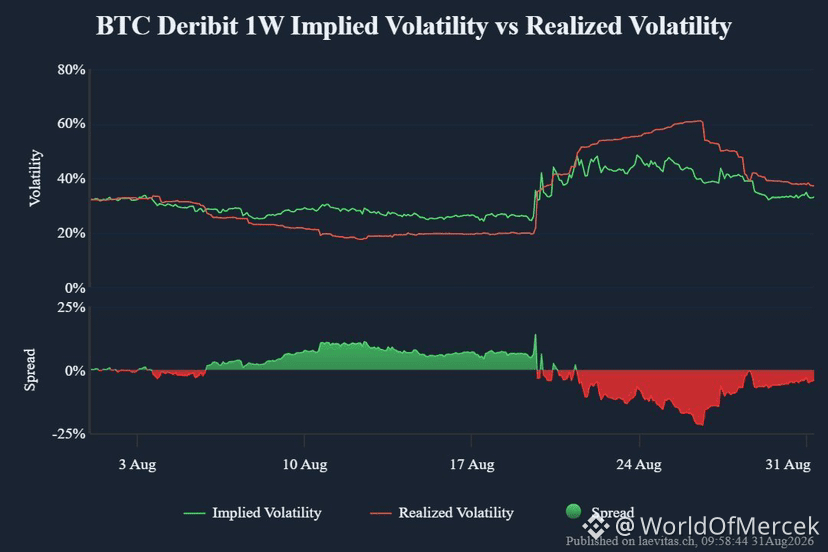
Just look at the 1-week numbers:
BTC
Realized vol: ~37%
Implied vol: ~32.5%
ETH
Realized vol: ~45.5%
Implied vol: ~45.5%
In other words, ETH has actually been moving about 1.23x as much as BTC:
45.5 / 37 ≈ 1.23
And traders in the options market are pricing an even bigger gap:
45.5 / 32.5 ≈ 1.40
So options are basically saying: expect considerably more movement from ETH.
That's why I'd be careful comparing their recent rallies purely from the chart.
BTC went roughly 23–25% from the $63–64K area. ETH did around 29–32%.
At first glance, ETH looks much stronger.
But once you remember that ETH is currently realizing ~23% more volatility and pricing ~40% more implied volatility, part of that outperformance is simply what you'd expect from the asset.
Another way I think about it:
If BTC makes a 10% move, an ETH move somewhere around 12–14% wouldn't immediately tell me something dramatically different is happening in ETH. That's roughly the kind of difference their volatility already suggests.
So yes, ETH taking its local high matters.
I just wouldn't use "ETH broke the high and BTC didn't" by itself as evidence that their structures have meaningfully diverged.
First normalize the moves for volatility.
Then see if ETH is actually outperforming what you'd expect from a higher-vol asset.
That's a much more useful comparison to me.
$ETH breaking its previous local high while $BTC hasn't looks important on a chart, but I'm not sure it's as meaningful as it seems.
The problem with comparing the two directly is that you're comparing assets with very different volatility right now.
Just look at the 1-week numbers:
BTC
Realized vol: ~37%
Implied vol: ~32.5%
ETH
Realized vol: ~45.5%
Implied vol: ~45.5%
In other words, ETH has actually been moving about 1.23x as much as BTC:
45.5 / 37 ≈ 1.23
And traders in the options market are pricing an even bigger gap:
45.5 / 32.5 ≈ 1.40
So options are basically saying: expect considerably more movement from ETH.
That's why I'd be careful comparing their recent rallies purely from the chart.
BTC went roughly 23–25% from the $63–64K area. ETH did around 29–32%.
At first glance, ETH looks much stronger.
But once you remember that ETH is currently realizing ~23% more volatility and pricing ~40% more implied volatility, part of that outperformance is simply what you'd expect from the asset.
Another way I think about it:
If BTC makes a 10% move, an ETH move somewhere around 12–14% wouldn't immediately tell me something dramatically different is happening in ETH. That's roughly the kind of difference their volatility already suggests.
So yes, ETH taking its local high matters.
I just wouldn't use "ETH broke the high and BTC didn't" by itself as evidence that their structures have meaningfully diverged.
First normalize the moves for volatility.
Then see if ETH is actually outperforming what you'd expect from a higher-vol asset.
That's a much more useful comparison to me.
The problem with comparing the two directly is that you're comparing assets with very different volatility right now.
Just look at the 1-week numbers:
BTC
Realized vol: ~37%
Implied vol: ~32.5%
ETH
Realized vol: ~45.5%
Implied vol: ~45.5%
In other words, ETH has actually been moving about 1.23x as much as BTC:
45.5 / 37 ≈ 1.23
And traders in the options market are pricing an even bigger gap:
45.5 / 32.5 ≈ 1.40
So options are basically saying: expect considerably more movement from ETH.
That's why I'd be careful comparing their recent rallies purely from the chart.
BTC went roughly 23–25% from the $63–64K area. ETH did around 29–32%.
At first glance, ETH looks much stronger.
But once you remember that ETH is currently realizing ~23% more volatility and pricing ~40% more implied volatility, part of that outperformance is simply what you'd expect from the asset.
Another way I think about it:
If BTC makes a 10% move, an ETH move somewhere around 12–14% wouldn't immediately tell me something dramatically different is happening in ETH. That's roughly the kind of difference their volatility already suggests.
So yes, ETH taking its local high matters.
I just wouldn't use "ETH broke the high and BTC didn't" by itself as evidence that their structures have meaningfully diverged.
First normalize the moves for volatility.
Then see if ETH is actually outperforming what you'd expect from a higher-vol asset.
That's a much more useful comparison to me.
367
Verified

Article
$DUSK: Privacy for Regulated FinanceBlockchains tend to treat privacy as binary.
Everything is public, or everything is hidden.
Regulated finance has never worked that way, and that’s exactly the thesis behind $DUSK 👇
A securities settlement system needs sensitive trade data to stay protected. It also needs a public state where that's useful, selective disclosure for authorized review, and settlement that's deterministic enough for an auditor to trust.
None of that fits the all-or-nothing privacy model most chains ship with.
@dusk_foundation built for the actual requirement instead: privacy-preserving smart contracts with disclosure that can be turned on for the right party, not switched off for everyone.
The infrastructure for this shipped as DuskEVM, the EVM-compatible layer that gives builders a familiar Solidity path into Dusk without asking them to learn a new execution environment first.
Confidential workflows run through Hedger, which combines homomorphic encryption with zero-knowledge proofs so transaction data stays opaque externally while remaining reviewable by an authorized regulator: a materially different design goal than a privacy coin.
The point is to make disclosure selective instead of universal.
#Dusk Trade is where this gets tested against real usage rather than a whitepaper.
It's structured as a neobroker layer for tokenized financial assets, regulated-asset workflows including onboarding, wallet connection, asset discovery, and settlement, aimed at MMFs, ETFs, bonds, and broader RWA categories under EU market rules.
The NPEX partnership is the concrete anchor here, NPEX is an AFM-regulated exchange licensed as an MTF, broker, and ECSP, and the plan is to bring a meaningful volume of European securities on-chain through Dusk's rails rather than a synthetic wrapper.
Chainlink strengthens the interoperability and data layer underneath that, which matters more for institutional counterparties than for retail users, but it's the kind of detail that tends to determine whether an integration actually gets used.
The distinction worth sitting with is tokenization vs native issuance.
Tokenization wraps something that already exists elsewhere; the real asset and its legal lifecycle still live off-chain, and the token is a representation.
Native issuance tries to move more of that lifecycle on-chain directly, issuance, transfer restrictions, settlement, servicing, review.
A harder problem and it's the one Dusk's infrastructure is actually built to carry, not just the easier wrap-and-list version most RWA projects settle for.
None of this is a claim that adoption has caught up to the infrastructure yet. TVL on Dusk has been thin relative to the scope of what's shipped, and NPEX bringing real, sustained volume on-chain is still the thing that has to happen before any of this moves from credible design to proven usage.
Regulated finance doesn't move fast, and a chain built specifically for regulated workflows inherits that same slow timeline.
The architecture is genuinely differentiated. Whether the institutional side actually shows up at scale is the open question that no amount of technical documentation answers on its own.
$DUSK: Privacy for Regulated Finance
Blockchains tend to treat privacy as binary.
Everything is public, or everything is hidden.
Regulated finance has never worked that way, and that’s exactly the thesis behind $DUSK 👇
A securities settlement system needs sensitive trade data to stay protected. It also needs a public state where that's useful, selective disclosure for authorized review, and settlement that's deterministic enough for an auditor to trust.
None of that fits the all-or-nothing privacy model most chains ship with.
@dusk_foundation built for the actual requirement instead: privacy-preserving smart contracts with disclosure that can be turned on for the right party, not switched off for everyone.
The infrastructure for this shipped as DuskEVM, the EVM-compatible layer that gives builders a familiar Solidity path into Dusk without asking them to learn a new execution environment first.
Confidential workflows run through Hedger, which combines homomorphic encryption with zero-knowledge proofs so transaction data stays opaque externally while remaining reviewable by an authorized regulator: a materially different design goal than a privacy coin.
The point is to make disclosure selective instead of universal.
#Dusk Trade is where this gets tested against real usage rather than a whitepaper.
It's structured as a neobroker layer for tokenized financial assets, regulated-asset workflows including onboarding, wallet connection, asset discovery, and settlement, aimed at MMFs, ETFs, bonds, and broader RWA categories under EU market rules.
The NPEX partnership is the concrete anchor here, NPEX is an AFM-regulated exchange licensed as an MTF, broker, and ECSP, and the plan is to bring a meaningful volume of European securities on-chain through Dusk's rails rather than a synthetic wrapper.
Chainlink strengthens the interoperability and data layer underneath that, which matters more for institutional counterparties than for retail users, but it's the kind of detail that tends to determine whether an integration actually gets used.
The distinction worth sitting with is tokenization vs native issuance.
Tokenization wraps something that already exists elsewhere; the real asset and its legal lifecycle still live off-chain, and the token is a representation.
Native issuance tries to move more of that lifecycle on-chain directly, issuance, transfer restrictions, settlement, servicing, review.
A harder problem and it's the one Dusk's infrastructure is actually built to carry, not just the easier wrap-and-list version most RWA projects settle for.
None of this is a claim that adoption has caught up to the infrastructure yet. TVL on Dusk has been thin relative to the scope of what's shipped, and NPEX bringing real, sustained volume on-chain is still the thing that has to happen before any of this moves from credible design to proven usage.
Regulated finance doesn't move fast, and a chain built specifically for regulated workflows inherits that same slow timeline.
The architecture is genuinely differentiated. Whether the institutional side actually shows up at scale is the open question that no amount of technical documentation answers on its own.
Everything is public, or everything is hidden.
Regulated finance has never worked that way, and that’s exactly the thesis behind $DUSK 👇
A securities settlement system needs sensitive trade data to stay protected. It also needs a public state where that's useful, selective disclosure for authorized review, and settlement that's deterministic enough for an auditor to trust.
None of that fits the all-or-nothing privacy model most chains ship with.
@dusk_foundation built for the actual requirement instead: privacy-preserving smart contracts with disclosure that can be turned on for the right party, not switched off for everyone.
The infrastructure for this shipped as DuskEVM, the EVM-compatible layer that gives builders a familiar Solidity path into Dusk without asking them to learn a new execution environment first.
Confidential workflows run through Hedger, which combines homomorphic encryption with zero-knowledge proofs so transaction data stays opaque externally while remaining reviewable by an authorized regulator: a materially different design goal than a privacy coin.
The point is to make disclosure selective instead of universal.
#Dusk Trade is where this gets tested against real usage rather than a whitepaper.
It's structured as a neobroker layer for tokenized financial assets, regulated-asset workflows including onboarding, wallet connection, asset discovery, and settlement, aimed at MMFs, ETFs, bonds, and broader RWA categories under EU market rules.
The NPEX partnership is the concrete anchor here, NPEX is an AFM-regulated exchange licensed as an MTF, broker, and ECSP, and the plan is to bring a meaningful volume of European securities on-chain through Dusk's rails rather than a synthetic wrapper.
Chainlink strengthens the interoperability and data layer underneath that, which matters more for institutional counterparties than for retail users, but it's the kind of detail that tends to determine whether an integration actually gets used.
The distinction worth sitting with is tokenization vs native issuance.
Tokenization wraps something that already exists elsewhere; the real asset and its legal lifecycle still live off-chain, and the token is a representation.
Native issuance tries to move more of that lifecycle on-chain directly, issuance, transfer restrictions, settlement, servicing, review.
A harder problem and it's the one Dusk's infrastructure is actually built to carry, not just the easier wrap-and-list version most RWA projects settle for.
None of this is a claim that adoption has caught up to the infrastructure yet. TVL on Dusk has been thin relative to the scope of what's shipped, and NPEX bringing real, sustained volume on-chain is still the thing that has to happen before any of this moves from credible design to proven usage.
Regulated finance doesn't move fast, and a chain built specifically for regulated workflows inherits that same slow timeline.
The architecture is genuinely differentiated. Whether the institutional side actually shows up at scale is the open question that no amount of technical documentation answers on its own.
3
10
6.2k
Added a little $DUSK around here.
Planning to keep this one short term and treat it as a quick trade.
NFA, DYOR.
Added a little $DUSK around here.
Planning to keep this one short term and treat it as a quick trade.
NFA, DYOR.
Planning to keep this one short term and treat it as a quick trade.
NFA, DYOR.
5
6
4.7k
BTC is at one of those levels where I wouldn't be in a rush to make a decision.
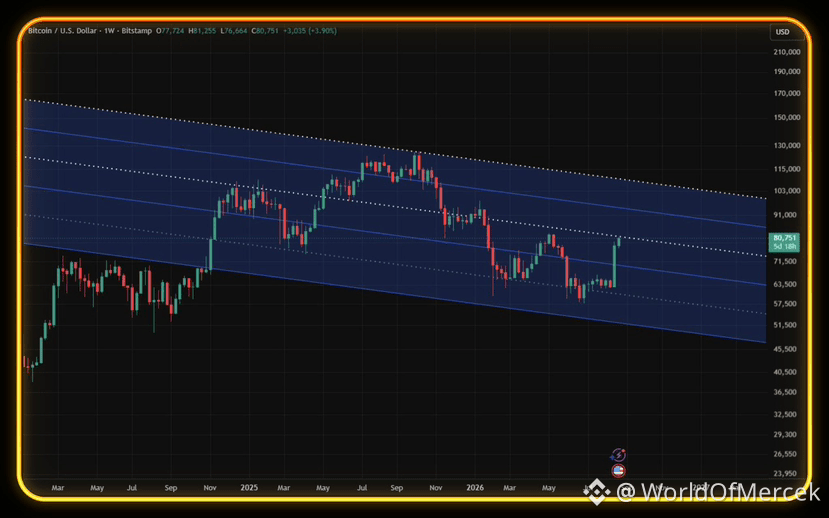
The move back toward $80K looks good, but the trendline that has been controlling this structure is sitting right around $80–81K.
For a new entry, I'd rather see BTC actually close above it on the weekly than trade above it for a few hours and call it a breakout.
Especially this week.
Nvidia earnings, Core PCE, the second estimate of Q2 GDP, then Warsh at Jackson Hole and the preliminary benchmark revision to US employment data on Friday.
That's a lot for the market to digest in just a few days.
And since we're already this close to month-end, waiting for the weekly confirmation basically puts the monthly close into play as well.
I think that's useful here because the question isn't really whether BTC can trade above $80–81K.
Of course it can.
The question is whether it can stay there after all of these catalysts are out of the way.
If it does, the structure starts looking much more interesting to me.
If it pushes through the trendline during the week and loses it again into the close, then you probably saved yourself from chasing another fakeout.
Sometimes waiting a few days costs you a slightly worse entry.
Sometimes it saves you from a much worse trade.
Around a level like this, with this kind of week ahead, I'm fine paying a little more for confirmation.
BTC is at one of those levels where I wouldn't be in a rush to make a decision.
The move back toward $80K looks good, but the trendline that has been controlling this structure is sitting right around $80–81K.
For a new entry, I'd rather see BTC actually close above it on the weekly than trade above it for a few hours and call it a breakout.
Especially this week.
Nvidia earnings, Core PCE, the second estimate of Q2 GDP, then Warsh at Jackson Hole and the preliminary benchmark revision to US employment data on Friday.
That's a lot for the market to digest in just a few days.
And since we're already this close to month-end, waiting for the weekly confirmation basically puts the monthly close into play as well.
I think that's useful here because the question isn't really whether BTC can trade above $80–81K.
Of course it can.
The question is whether it can stay there after all of these catalysts are out of the way.
If it does, the structure starts looking much more interesting to me.
If it pushes through the trendline during the week and loses it again into the close, then you probably saved yourself from chasing another fakeout.
Sometimes waiting a few days costs you a slightly worse entry.
Sometimes it saves you from a much worse trade.
Around a level like this, with this kind of week ahead, I'm fine paying a little more for confirmation.
The move back toward $80K looks good, but the trendline that has been controlling this structure is sitting right around $80–81K.
For a new entry, I'd rather see BTC actually close above it on the weekly than trade above it for a few hours and call it a breakout.
Especially this week.
Nvidia earnings, Core PCE, the second estimate of Q2 GDP, then Warsh at Jackson Hole and the preliminary benchmark revision to US employment data on Friday.
That's a lot for the market to digest in just a few days.
And since we're already this close to month-end, waiting for the weekly confirmation basically puts the monthly close into play as well.
I think that's useful here because the question isn't really whether BTC can trade above $80–81K.
Of course it can.
The question is whether it can stay there after all of these catalysts are out of the way.
If it does, the structure starts looking much more interesting to me.
If it pushes through the trendline during the week and loses it again into the close, then you probably saved yourself from chasing another fakeout.
Sometimes waiting a few days costs you a slightly worse entry.
Sometimes it saves you from a much worse trade.
Around a level like this, with this kind of week ahead, I'm fine paying a little more for confirmation.
3
3k
One of the easiest ways to misunderstand markets is to only watch what you already own.
Bitcoin doesn’t move because of Bitcoin alone.
Bonds move FX. Oil changes inflation expectations. Yields change equity valuations. Liquidity moves through all of them and eventually reaches crypto too.
The trade today might be debasement. Tomorrow it could be inflation, recession or a carry unwind.
You don’t need to catch every rotation.
But you should understand where the next one might come from.
I care much less about “bull or bear?” these days.
I’m more interested in one question:
What’s the next trade?
One of the easiest ways to misunderstand markets is to only watch what you already own.
Bitcoin doesn’t move because of Bitcoin alone.
Bonds move FX. Oil changes inflation expectations. Yields change equity valuations. Liquidity moves through all of them and eventually reaches crypto too.
The trade today might be debasement. Tomorrow it could be inflation, recession or a carry unwind.
You don’t need to catch every rotation.
But you should understand where the next one might come from.
I care much less about “bull or bear?” these days.
I’m more interested in one question:
What’s the next trade?
Bitcoin doesn’t move because of Bitcoin alone.
Bonds move FX. Oil changes inflation expectations. Yields change equity valuations. Liquidity moves through all of them and eventually reaches crypto too.
The trade today might be debasement. Tomorrow it could be inflation, recession or a carry unwind.
You don’t need to catch every rotation.
But you should understand where the next one might come from.
I care much less about “bull or bear?” these days.
I’m more interested in one question:
What’s the next trade?
2
599
Has $BTC already bottomed?
Looking only at price won't answer that.
Anyone claiming they know exactly where the bottom is... probably doesn't.
What we can analyze is investor behavior.
One of the clearest characteristics of every bear market is that speculative capital disappears, leaving the market increasingly in the hands of long-term holders.
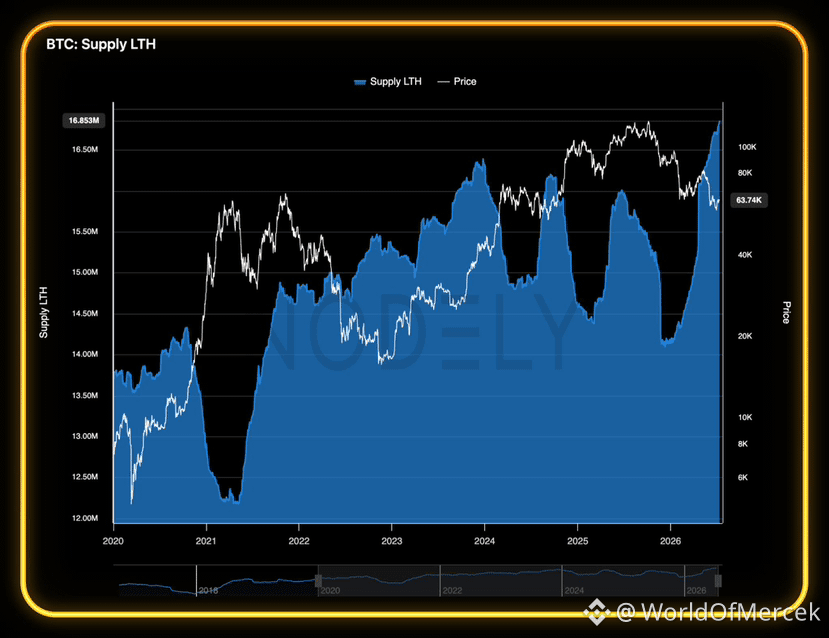
That's exactly what the first chart shows.
Long-term holder supply has climbed to a new all-time high.
In other words, more BTC than ever is sitting with investors who have shown little interest in selling despite everything that's happened over the past months.
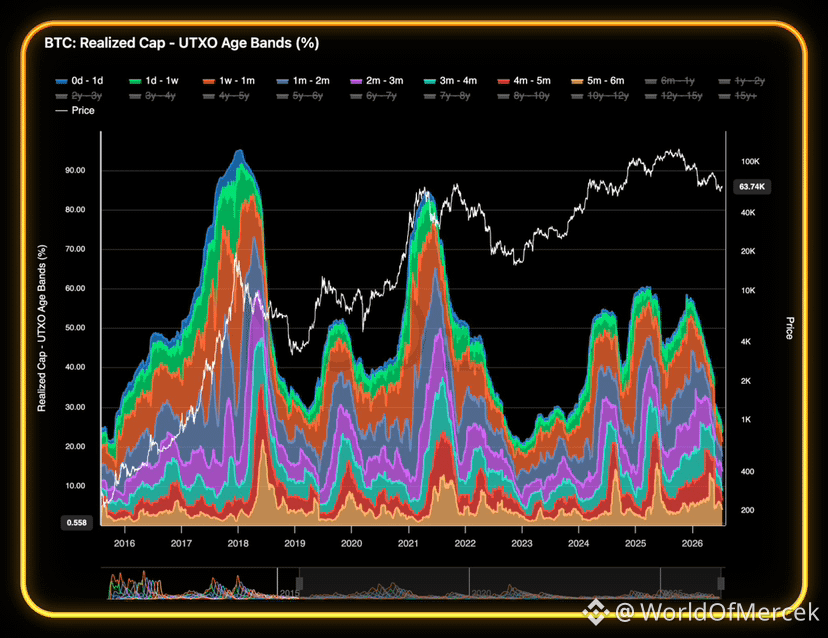
Now look at the second chart.
Instead of asking who's holding Bitcoin...
Ask who's still trading it.
Short-term activity has fallen dramatically.
We're now approaching levels last seen around the FTX collapse.
That doesn't guarantee price has already made its final low.
Those are two different questions.
Price can always go lower.
But behavior tells a different story.
The speculative money that usually dominates bull markets has largely disappeared, while long-term conviction continues to increase.
Historically, that's exactly what you would expect to see around a bear-market bottom.
What happens next depends on whether new demand shows up.
If regulatory clarity improves, liquidity conditions become more supportive, and capital starts flowing back into the space, this kind of holder structure becomes a much stronger foundation than most people realize.
Personally, I spend much less time trying to predict the exact bottom.
I'd rather watch who owns the coins.
Because behavior usually changes before price does.
Has $BTC already bottomed?
Looking only at price won't answer that.
Anyone claiming they know exactly where the bottom is... probably doesn't.
What we can analyze is investor behavior.
One of the clearest characteristics of every bear market is that speculative capital disappears, leaving the market increasingly in the hands of long-term holders.
That's exactly what the first chart shows.
Long-term holder supply has climbed to a new all-time high.
In other words, more BTC than ever is sitting with investors who have shown little interest in selling despite everything that's happened over the past months.
Now look at the second chart.
Instead of asking who's holding Bitcoin...
Ask who's still trading it.
Short-term activity has fallen dramatically.
We're now approaching levels last seen around the FTX collapse.
That doesn't guarantee price has already made its final low.
Those are two different questions.
Price can always go lower.
But behavior tells a different story.
The speculative money that usually dominates bull markets has largely disappeared, while long-term conviction continues to increase.
Historically, that's exactly what you would expect to see around a bear-market bottom.
What happens next depends on whether new demand shows up.
If regulatory clarity improves, liquidity conditions become more supportive, and capital starts flowing back into the space, this kind of holder structure becomes a much stronger foundation than most people realize.
Personally, I spend much less time trying to predict the exact bottom.
I'd rather watch who owns the coins.
Because behavior usually changes before price does.
Looking only at price won't answer that.
Anyone claiming they know exactly where the bottom is... probably doesn't.
What we can analyze is investor behavior.
One of the clearest characteristics of every bear market is that speculative capital disappears, leaving the market increasingly in the hands of long-term holders.
That's exactly what the first chart shows.
Long-term holder supply has climbed to a new all-time high.
In other words, more BTC than ever is sitting with investors who have shown little interest in selling despite everything that's happened over the past months.
Now look at the second chart.
Instead of asking who's holding Bitcoin...
Ask who's still trading it.
Short-term activity has fallen dramatically.
We're now approaching levels last seen around the FTX collapse.
That doesn't guarantee price has already made its final low.
Those are two different questions.
Price can always go lower.
But behavior tells a different story.
The speculative money that usually dominates bull markets has largely disappeared, while long-term conviction continues to increase.
Historically, that's exactly what you would expect to see around a bear-market bottom.
What happens next depends on whether new demand shows up.
If regulatory clarity improves, liquidity conditions become more supportive, and capital starts flowing back into the space, this kind of holder structure becomes a much stronger foundation than most people realize.
Personally, I spend much less time trying to predict the exact bottom.
I'd rather watch who owns the coins.
Because behavior usually changes before price does.
2
87
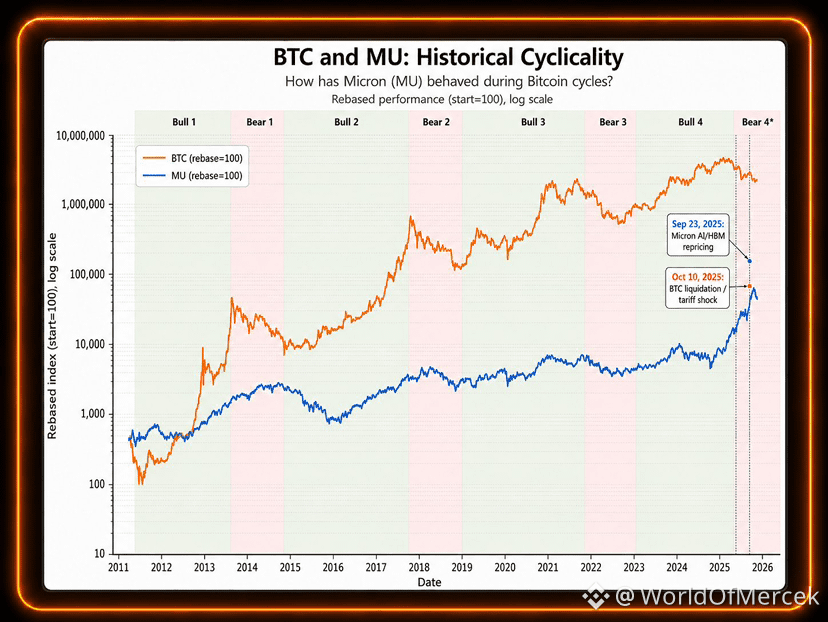
$MU has historically been one of the better cyclical signals to watch alongside $BTC.
But this cycle raises a different question.
If Bitcoin is forming a cyclical bottom, does Micron still need to bottom first?
Or is the divergence that started in late 2025 telling us that this cycle is being driven by a different set of forces?
$MU has historically been one of the better cyclical signals to watch alongside $BTC.
But this cycle raises a different question.
If Bitcoin is forming a cyclical bottom, does Micron still need to bottom first?
Or is the divergence that started in late 2025 telling us that this cycle is being driven by a different set of forces?
But this cycle raises a different question.
If Bitcoin is forming a cyclical bottom, does Micron still need to bottom first?
Or is the divergence that started in late 2025 telling us that this cycle is being driven by a different set of forces?
3
260
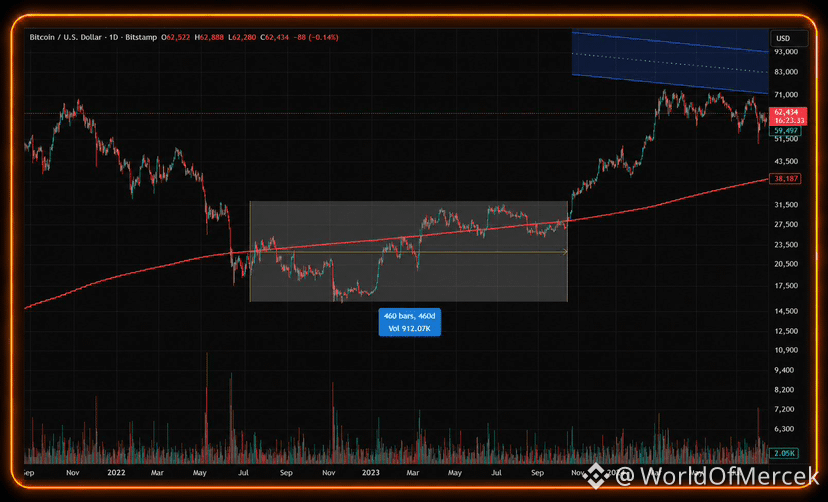
I think people are starting to take the 2022 comparison a little too literally.
I keep seeing:
"July 2022 looked like this, so July-August should play out the same way."
But if we're going to compare the two cycles, shouldn't we also acknowledge that prices from July-August 2022 were revisited around September-October 2023, roughly 15 months later?
History is useful.
Treating it like a script usually isn't.
I think people are starting to take the 2022 comparison a little too literally.
I keep seeing:
"July 2022 looked like this, so July-August should play out the same way."
But if we're going to compare the two cycles, shouldn't we also acknowledge that prices from July-August 2022 were revisited around September-October 2023, roughly 15 months later?
History is useful.
Treating it like a script usually isn't.
I keep seeing:
"July 2022 looked like this, so July-August should play out the same way."
But if we're going to compare the two cycles, shouldn't we also acknowledge that prices from July-August 2022 were revisited around September-October 2023, roughly 15 months later?
History is useful.
Treating it like a script usually isn't.
51
343
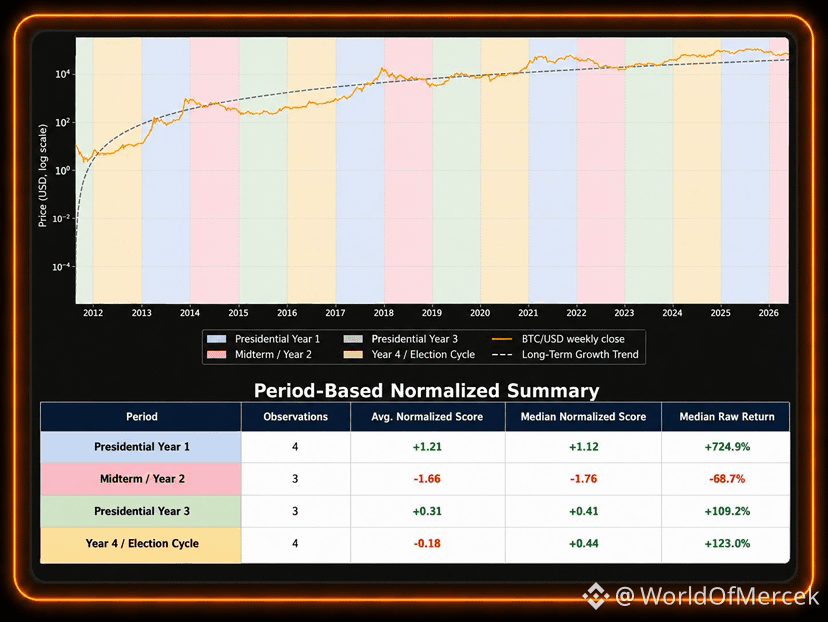
The U.S. presidential cycle obviously doesn't determine where Bitcoin goes next.
But it's one of those frameworks that becomes much more interesting when you look at it alongside liquidity, Fed policy and regulation.
If history rhymes again, we're about to move from the second year of the cycle into the third.
That doesn't guarantee higher prices.
It simply shifts my focus toward a few questions:
➜ Is liquidity starting to improve?
➜ Is the Fed becoming less restrictive?
➜ Is regulatory uncertainty beginning to fade?
➜ Is Bitcoin reclaiming its long-term growth trend?
➜ Does the political environment become more predictable after the midterms?
Markets rarely ring a bell at the bottom.
They usually leave plenty of clues before the bigger move begins.
The U.S. presidential cycle obviously doesn't determine where Bitcoin goes next.
But it's one of those frameworks that becomes much more interesting when you look at it alongside liquidity, Fed policy and regulation.
If history rhymes again, we're about to move from the second year of the cycle into the third.
That doesn't guarantee higher prices.
It simply shifts my focus toward a few questions:
➜ Is liquidity starting to improve?
➜ Is the Fed becoming less restrictive?
➜ Is regulatory uncertainty beginning to fade?
➜ Is Bitcoin reclaiming its long-term growth trend?
➜ Does the political environment become more predictable after the midterms?
Markets rarely ring a bell at the bottom.
They usually leave plenty of clues before the bigger move begins.
But it's one of those frameworks that becomes much more interesting when you look at it alongside liquidity, Fed policy and regulation.
If history rhymes again, we're about to move from the second year of the cycle into the third.
That doesn't guarantee higher prices.
It simply shifts my focus toward a few questions:
➜ Is liquidity starting to improve?
➜ Is the Fed becoming less restrictive?
➜ Is regulatory uncertainty beginning to fade?
➜ Is Bitcoin reclaiming its long-term growth trend?
➜ Does the political environment become more predictable after the midterms?
Markets rarely ring a bell at the bottom.
They usually leave plenty of clues before the bigger move begins.
1
23
314
The more time I spend looking at the data, the harder it becomes for me to stay structurally bearish on altcoins.
That doesn't mean the bottom is already in.
It doesn't mean we can't see another flush.
It simply means the market underneath the surface looks very different from the one most people are describing.
Over the past few weeks I've been watching capital flows, relative strength, dominance, liquidity and fundraising activity.
No single metric tells you where the exact bottom is.
But when they all start pointing in the same direction, I pay attention.
New projects are getting funded again.
Builders never really left.
Some sectors have already started outperforming even though sentiment still feels completely broken.
That's usually how new cycles begin.
Not with excitement, but with disbelief.
I'm not trying to catch the exact bottom anymore.
I'd rather spend this period deciding what I want to own before the narrative changes.
If we get another leg lower, I'll keep buying.
If we don't, I'll already be positioned.
The next few months aren't about predicting every move.
They're about being ready before everyone else realizes something has changed.
By the time the market finally agrees the opportunity was real, it usually isn't an opportunity anymore.
The more time I spend looking at the data, the harder it becomes for me to stay structurally bearish on altcoins.
That doesn't mean the bottom is already in.
It doesn't mean we can't see another flush.
It simply means the market underneath the surface looks very different from the one most people are describing.
Over the past few weeks I've been watching capital flows, relative strength, dominance, liquidity and fundraising activity.
No single metric tells you where the exact bottom is.
But when they all start pointing in the same direction, I pay attention.
New projects are getting funded again.
Builders never really left.
Some sectors have already started outperforming even though sentiment still feels completely broken.
That's usually how new cycles begin.
Not with excitement, but with disbelief.
I'm not trying to catch the exact bottom anymore.
I'd rather spend this period deciding what I want to own before the narrative changes.
If we get another leg lower, I'll keep buying.
If we don't, I'll already be positioned.
The next few months aren't about predicting every move.
They're about being ready before everyone else realizes something has changed.
By the time the market finally agrees the opportunity was real, it usually isn't an opportunity anymore.
That doesn't mean the bottom is already in.
It doesn't mean we can't see another flush.
It simply means the market underneath the surface looks very different from the one most people are describing.
Over the past few weeks I've been watching capital flows, relative strength, dominance, liquidity and fundraising activity.
No single metric tells you where the exact bottom is.
But when they all start pointing in the same direction, I pay attention.
New projects are getting funded again.
Builders never really left.
Some sectors have already started outperforming even though sentiment still feels completely broken.
That's usually how new cycles begin.
Not with excitement, but with disbelief.
I'm not trying to catch the exact bottom anymore.
I'd rather spend this period deciding what I want to own before the narrative changes.
If we get another leg lower, I'll keep buying.
If we don't, I'll already be positioned.
The next few months aren't about predicting every move.
They're about being ready before everyone else realizes something has changed.
By the time the market finally agrees the opportunity was real, it usually isn't an opportunity anymore.
2
20
174
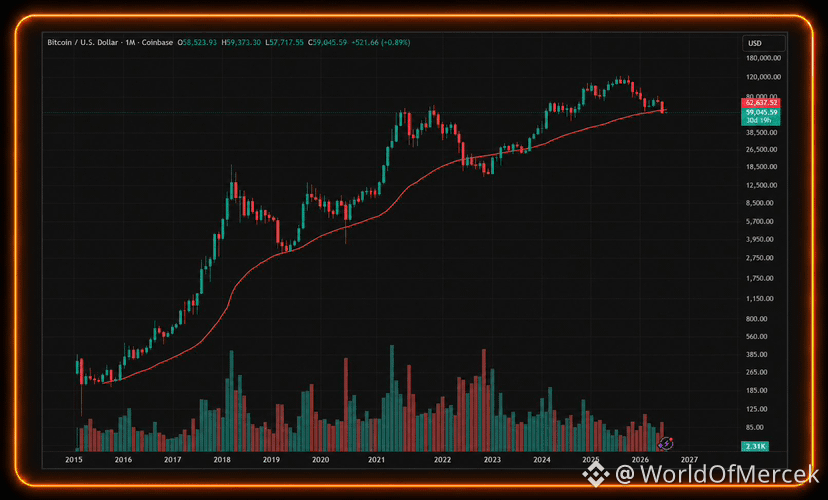
The monthly close below the 200 week moving average matters.
Not because $BTC has never done it before.
But because the last time it happened, the market spent months trying to recover from it.
Now combine that with one fact:
Historically, July has often been Bitcoin's strongest rebound month after a weak June.
That's why this month matters far more than the close itself.
If BTC quickly reclaims the 200 week moving average, this monthly close may end up being remembered as nothing more than another bear trap.
If it doesn't...
Then we should start treating this as a genuine structural change, not just another dip.
The monthly close below the 200 week moving average matters.
Not because $BTC has never done it before.
But because the last time it happened, the market spent months trying to recover from it.
Now combine that with one fact:
Historically, July has often been Bitcoin's strongest rebound month after a weak June.
That's why this month matters far more than the close itself.
If BTC quickly reclaims the 200 week moving average, this monthly close may end up being remembered as nothing more than another bear trap.
If it doesn't...
Then we should start treating this as a genuine structural change, not just another dip.
Not because $BTC has never done it before.
But because the last time it happened, the market spent months trying to recover from it.
Now combine that with one fact:
Historically, July has often been Bitcoin's strongest rebound month after a weak June.
That's why this month matters far more than the close itself.
If BTC quickly reclaims the 200 week moving average, this monthly close may end up being remembered as nothing more than another bear trap.
If it doesn't...
Then we should start treating this as a genuine structural change, not just another dip.
1
35
184
GM to everyone
You never fully leave crypto. So have fun!
GM to everyone
You never fully leave crypto. So have fun!
You never fully leave crypto. So have fun!

4
1
44
227
Log in to explore more content
Join global crypto users on Binance Square
⚡️ Get latest and useful information about crypto.
💬 Trusted by the world’s largest crypto exchange.
👍 Discover real insights from verified creators.
Email / Phone number
Trending Topics
FedMinutesFocusOnOctoberPause
130,404 views
1,167 Discussing
🚨 HIGH ALERT ‼️ PLEASE DON’T TRADE BLINDLY FOR THE NEXT HOUR 🚨
Guys, we have FOMC Minutes coming in less than 1 hour.
And after the kind of volatility we already saw today, I really don’t want anyone opening random high-leverage positions just before this release.
The biggest reaction I’m watching will be in Gold (XAU), Silver (XAG), BTC and ETH. Then coins like SOL and other highly leveraged mid/low-cap alts can exaggerate whatever move BTC makes.
Gold and Silver are especially sensitive tonight because the market is already reacting to the US dollar + Treasury yields, and both metals have been under heavy pressure ahead of the Fed minutes.
Briefly speaking
📉Hawkish Fed Minutes → Dollar/yields can push higher → pressure on BTC, crypto, Gold & silver
📈Dovish Fed Minutes → Dollar/yields can cool → BTC, Gold, Silver and risk assets can bounce hard.
And please remember the first candle can be a trap. We can get a pump, immediate dump, liquidations on both sides, and then the real direction.
So for now, protect your positions, reduce unnecessary leverage and don’t FOMO into the first move.
Tonight I’m watching $XAU , $XAG and $BTC first. These will tell us very quickly how the market is reading the Fed.
I will Update you guys on time
Follow @Panda Traders and Turn on Your notifications right now
#FedMinutesFocusOnOctoberPause
Panda Traders
·18 Likes
·3.5k views
BinanceLaunchesBinanceIntelligence
1.1M views
6,374 Discussing
EvernorthDelaysNasdaqDebutToOct12
9,365 views
245 Discussing