
Crypto Sniper Official
371 Posts

Crypto Sniper Official
Report
Block User
Crypto Market Analyst 📊 BTC & Altcoin Technical Analysis Trading Education | Market Insights Risk Management First
3 Following
79 Followers
48 Liked
Posts
All
Quotes
Videos
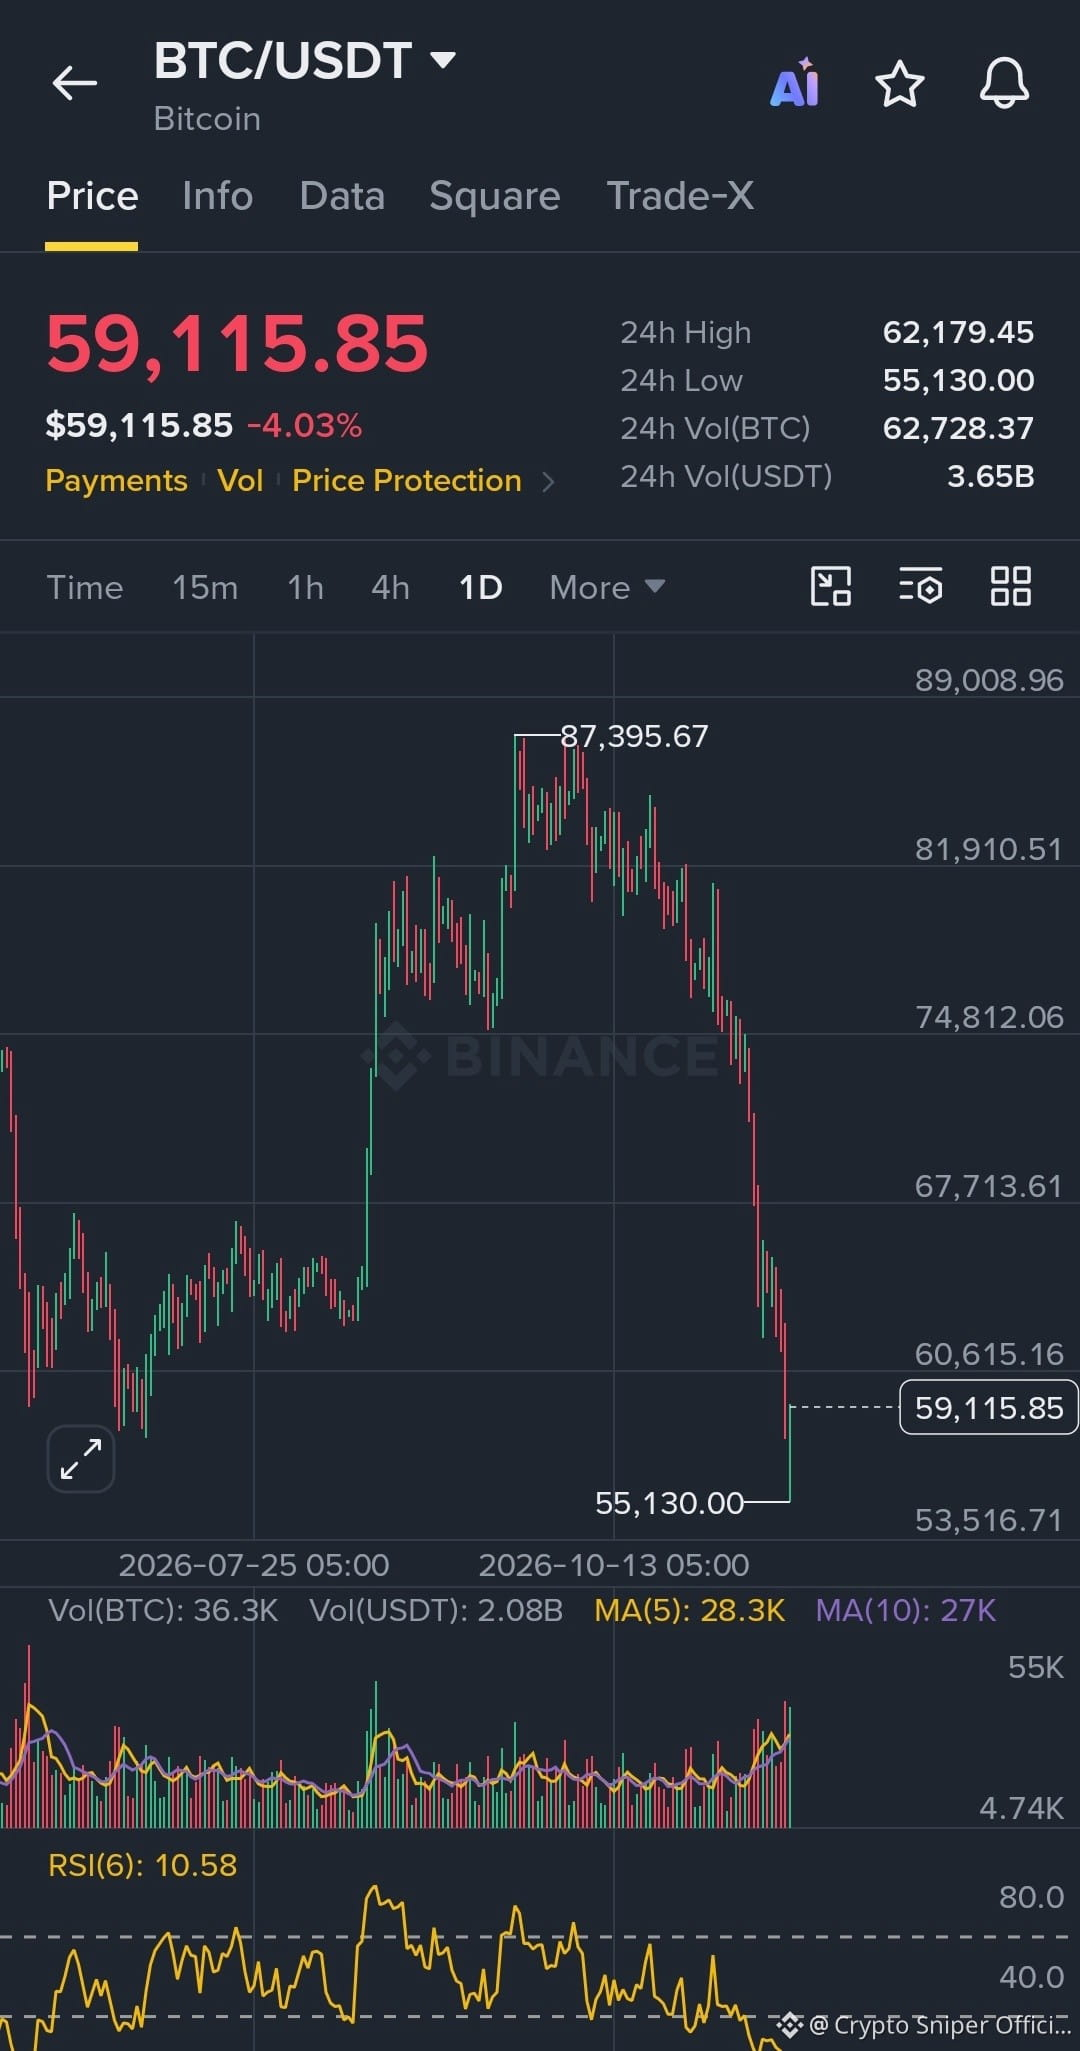
$BTC BTC/USDT — 1D timeframe
Price: $59,115
24H low: $55,130
RSI(6): 10.58 — extremely oversold
Trend: Strong bearish
Support: $55,130, then $53,500
Resistance: $60,615, then $62,179
Daily trend strongly bearish. RSI(6) at 10.58 shows extreme oversold conditions; a relief bounce is possible.
Bias: Bearish until BTC reclaims $62,179.
#CanBTCReboundAfterFallingBelow60K?
$BTC BTC/USDT — 1D timeframe
Price: $59,115
24H low: $55,130
RSI(6): 10.58 — extremely oversold
Trend: Strong bearish
Support: $55,130, then $53,500
Resistance: $60,615, then $62,179
Daily trend strongly bearish. RSI(6) at 10.58 shows extreme oversold conditions; a relief bounce is possible.
Bias: Bearish until BTC reclaims $62,179.
#CanBTCReboundAfterFallingBelow60K?
Price: $59,115
24H low: $55,130
RSI(6): 10.58 — extremely oversold
Trend: Strong bearish
Support: $55,130, then $53,500
Resistance: $60,615, then $62,179
Daily trend strongly bearish. RSI(6) at 10.58 shows extreme oversold conditions; a relief bounce is possible.
Bias: Bearish until BTC reclaims $62,179.
#CanBTCReboundAfterFallingBelow60K?
41
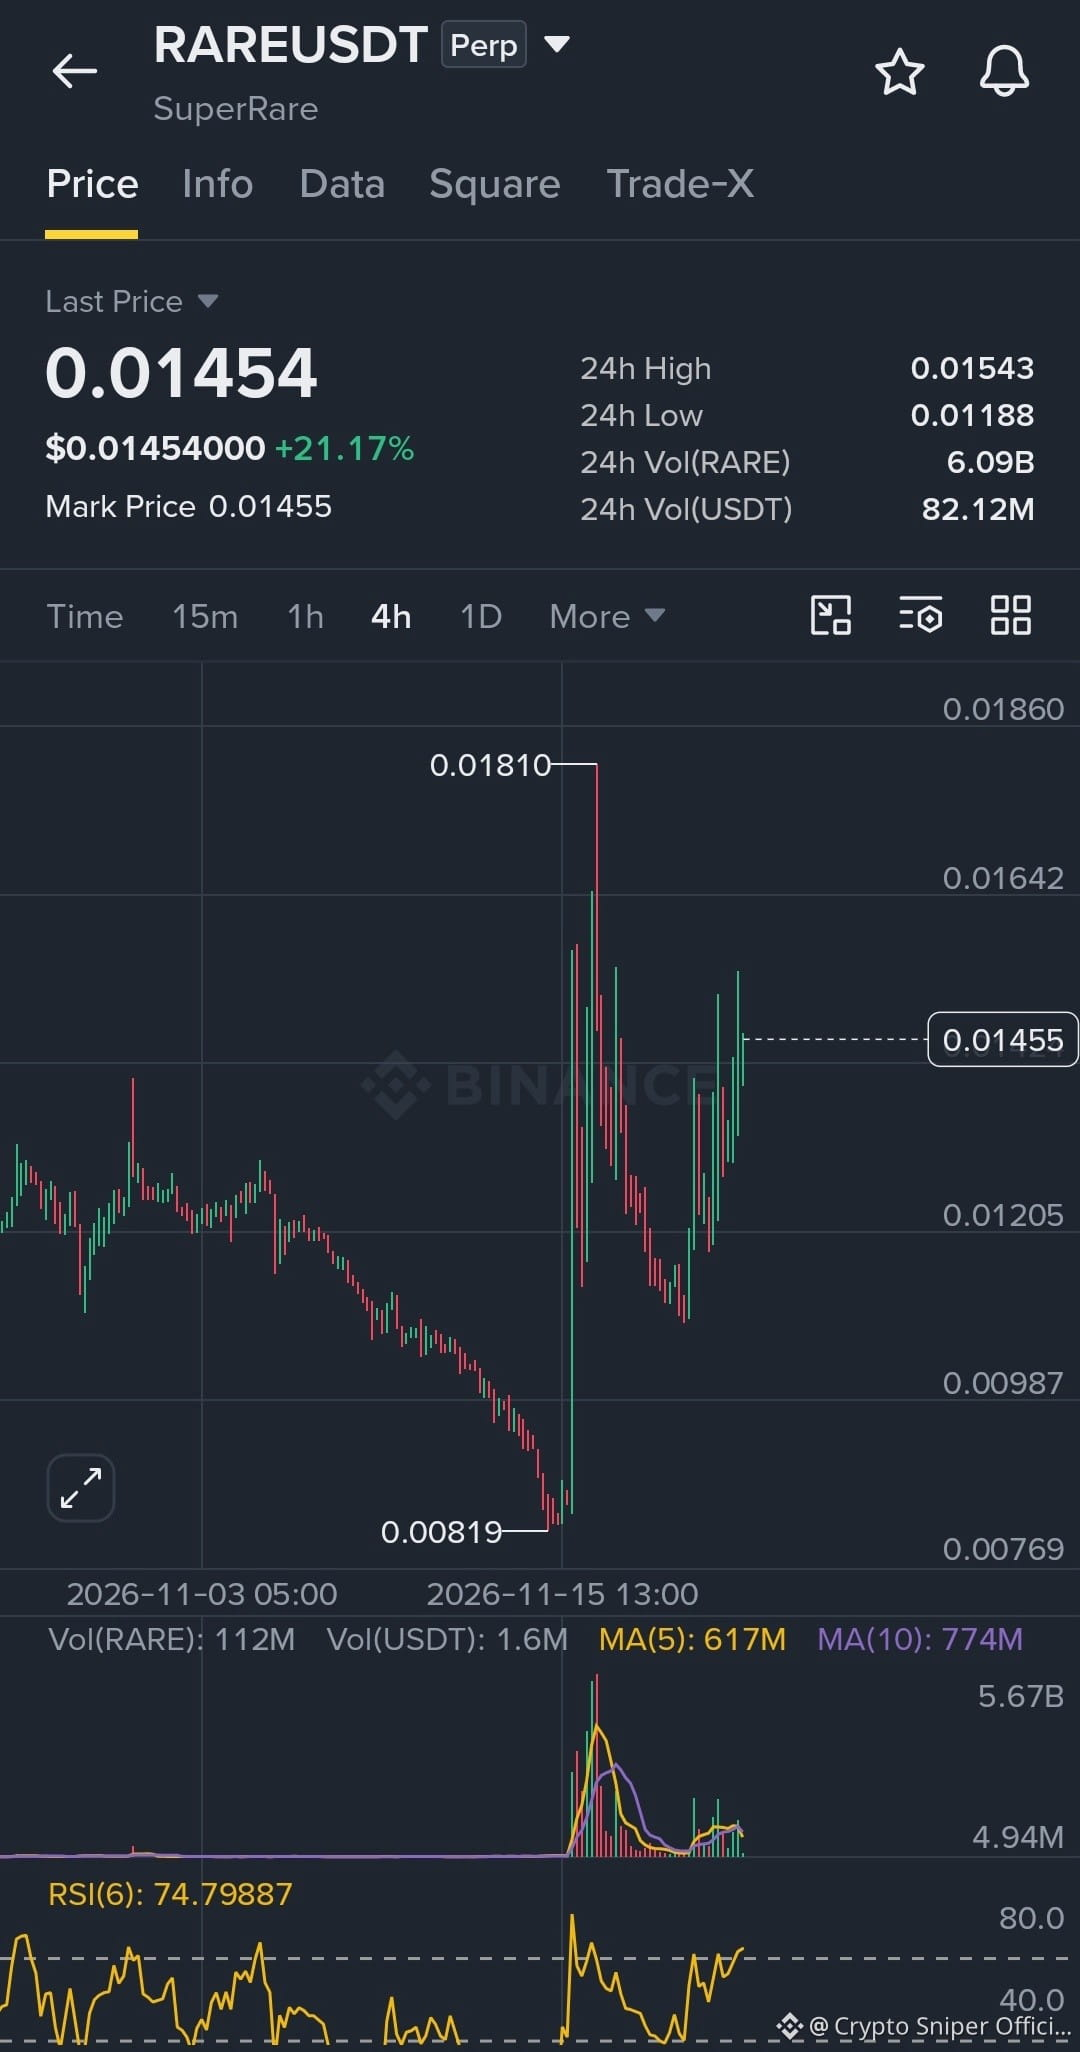
🚀 $RARE / USDT — LONG SETUP
⏱️ 4H Chart | Perpetual
🟢 Entry Zone: 0.01350 – 0.01400
🎯 TP1: 0.01540 🎯 TP2: 0.01640 🎯 TP3: 0.01810
🛑 SL: 0.01250
RARE is showing strong bullish recovery with increasing momentum. RSI(6) at 74.79 indicates overbought conditions. Wait for a pullback before entering. Don't chase the pump!
🚀 $RARE / USDT — LONG SETUP
⏱️ 4H Chart | Perpetual
🟢 Entry Zone: 0.01350 – 0.01400
🎯 TP1: 0.01540 🎯 TP2: 0.01640 🎯 TP3: 0.01810
🛑 SL: 0.01250
RARE is showing strong bullish recovery with increasing momentum. RSI(6) at 74.79 indicates overbought conditions. Wait for a pullback before entering. Don't chase the pump!
⏱️ 4H Chart | Perpetual
🟢 Entry Zone: 0.01350 – 0.01400
🎯 TP1: 0.01540 🎯 TP2: 0.01640 🎯 TP3: 0.01810
🛑 SL: 0.01250
RARE is showing strong bullish recovery with increasing momentum. RSI(6) at 74.79 indicates overbought conditions. Wait for a pullback before entering. Don't chase the pump!
32
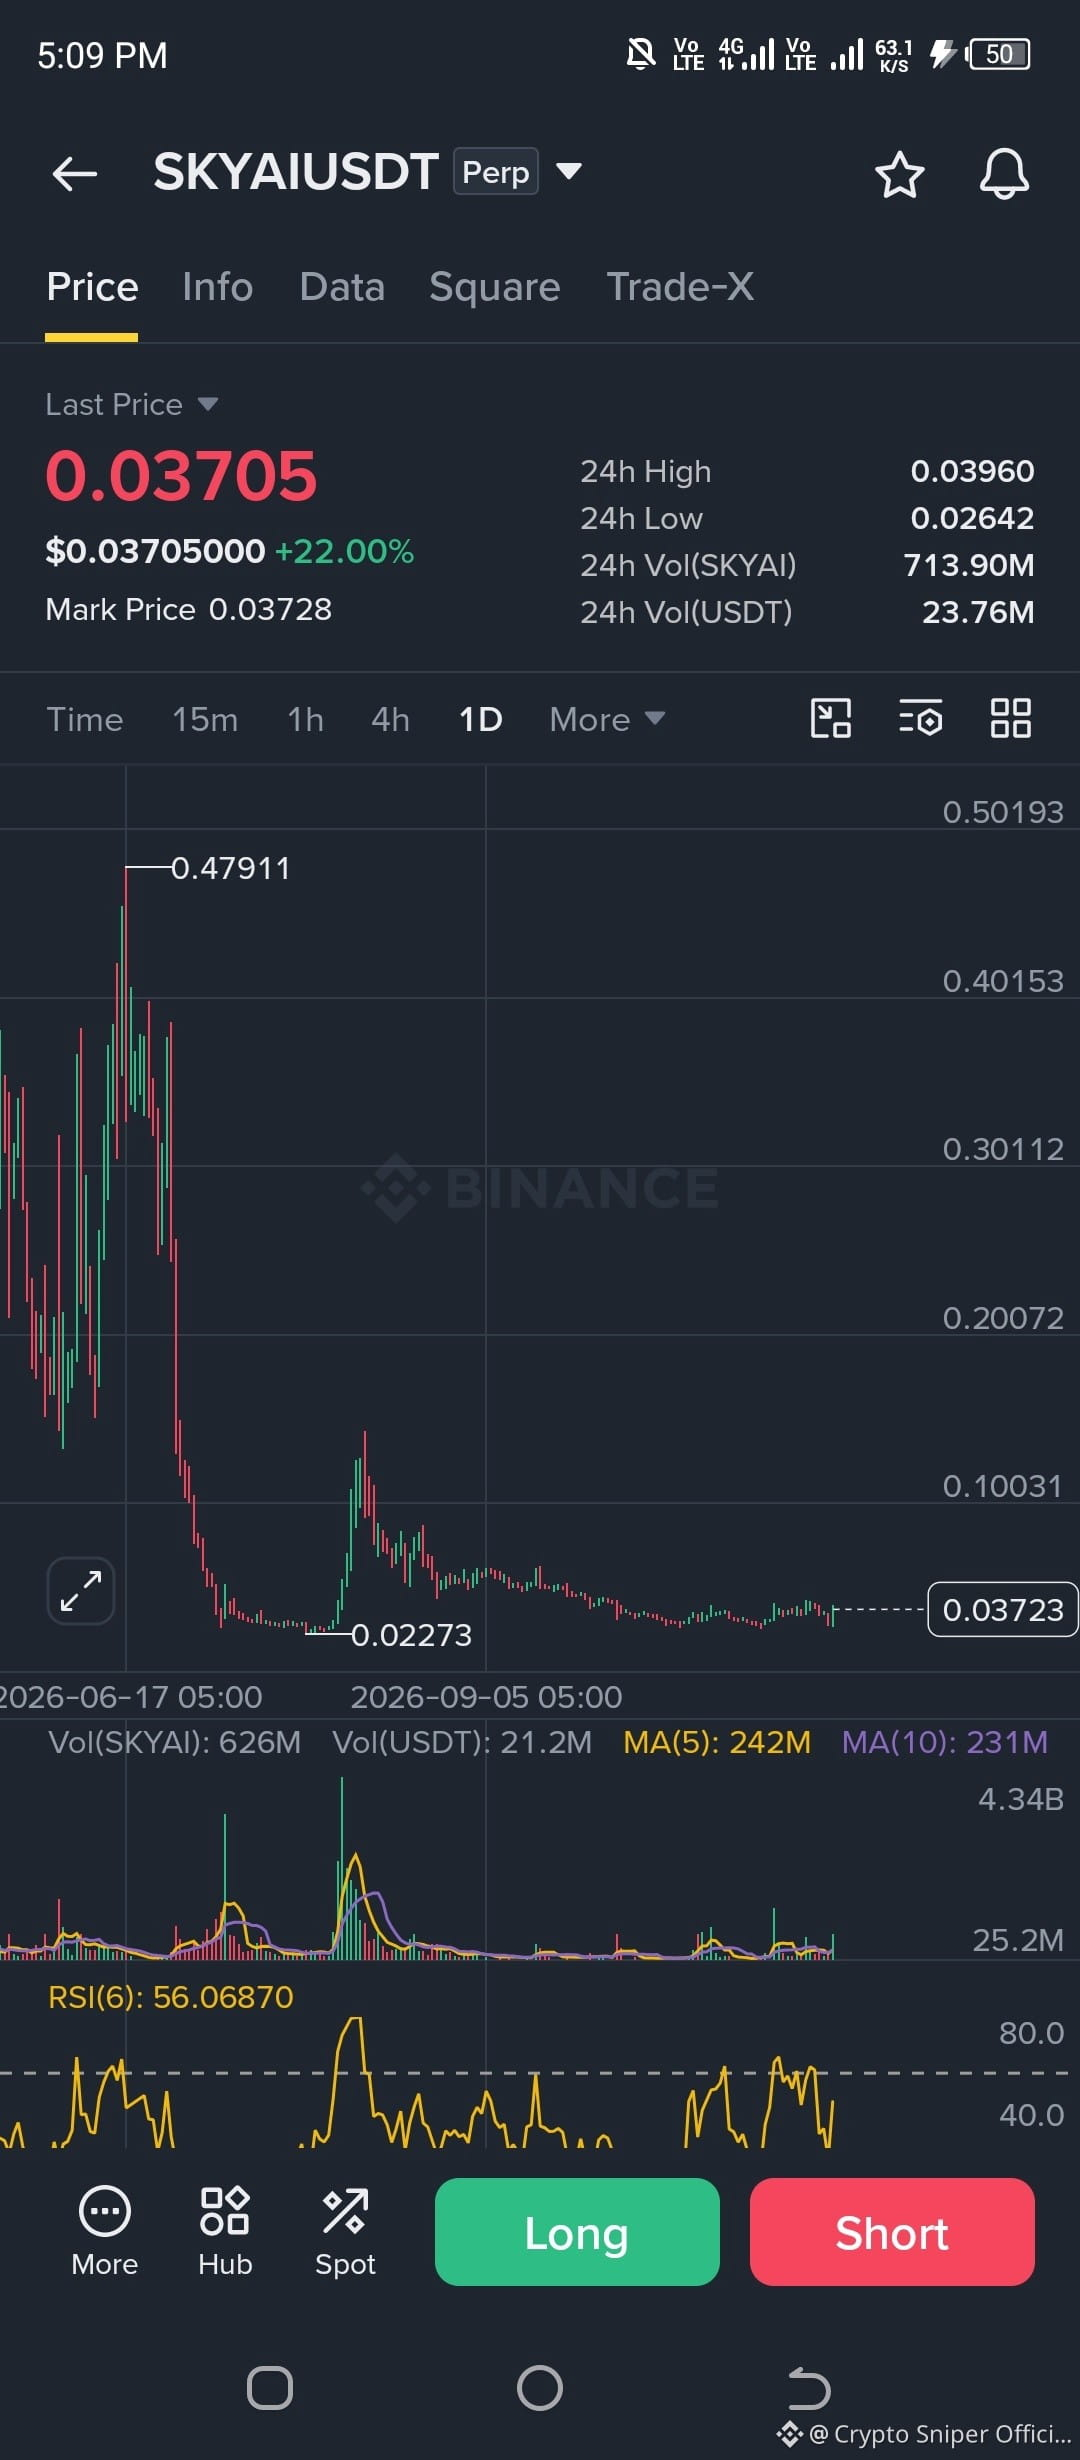
🚀 $SKYAI / USDT — LONG SETUP
⏱️ 1D Chart | Perpetual
🟢 Entry Zone: 0.0340 – 0.0360
🎯 TP1: 0.03960 🎯 TP2: 0.04500 🎯 TP3: 0.05200
🛑 SL: 0.03100
SKYAI is showing signs of recovery with improving momentum. RSI(6) at 56 suggests room for further upside. Watch for a breakout above 0.0396!
🚀 $SKYAI / USDT — LONG SETUP
⏱️ 1D Chart | Perpetual
🟢 Entry Zone: 0.0340 – 0.0360
🎯 TP1: 0.03960 🎯 TP2: 0.04500 🎯 TP3: 0.05200
🛑 SL: 0.03100
SKYAI is showing signs of recovery with improving momentum. RSI(6) at 56 suggests room for further upside. Watch for a breakout above 0.0396!
⏱️ 1D Chart | Perpetual
🟢 Entry Zone: 0.0340 – 0.0360
🎯 TP1: 0.03960 🎯 TP2: 0.04500 🎯 TP3: 0.05200
🛑 SL: 0.03100
SKYAI is showing signs of recovery with improving momentum. RSI(6) at 56 suggests room for further upside. Watch for a breakout above 0.0396!
134
📉 CRYPTO PRICES: 2021 vs 2026 (November)
$BTC : $59,700 → $59,000
$ETH : $4,410 → $1,620
$BNB : $605 → $540
$SOL : $220 → $69
$XRP : $1.10 → $0.9
0
while others are significantly lower.
5 YEARS LATER… ARE WE STILL IN THE SAME CYCLE? 👀
📉 CRYPTO PRICES: 2021 vs 2026 (November)
$BTC : $59,700 → $59,000
$ETH : $4,410 → $1,620
$BNB : $605 → $540
$SOL : $220 → $69
$XRP : $1.10 → $0.9
0
while others are significantly lower.
5 YEARS LATER… ARE WE STILL IN THE SAME CYCLE? 👀
$BTC : $59,700 → $59,000
$ETH : $4,410 → $1,620
$BNB : $605 → $540
$SOL : $220 → $69
$XRP : $1.10 → $0.9
0
while others are significantly lower.
5 YEARS LATER… ARE WE STILL IN THE SAME CYCLE? 👀

58
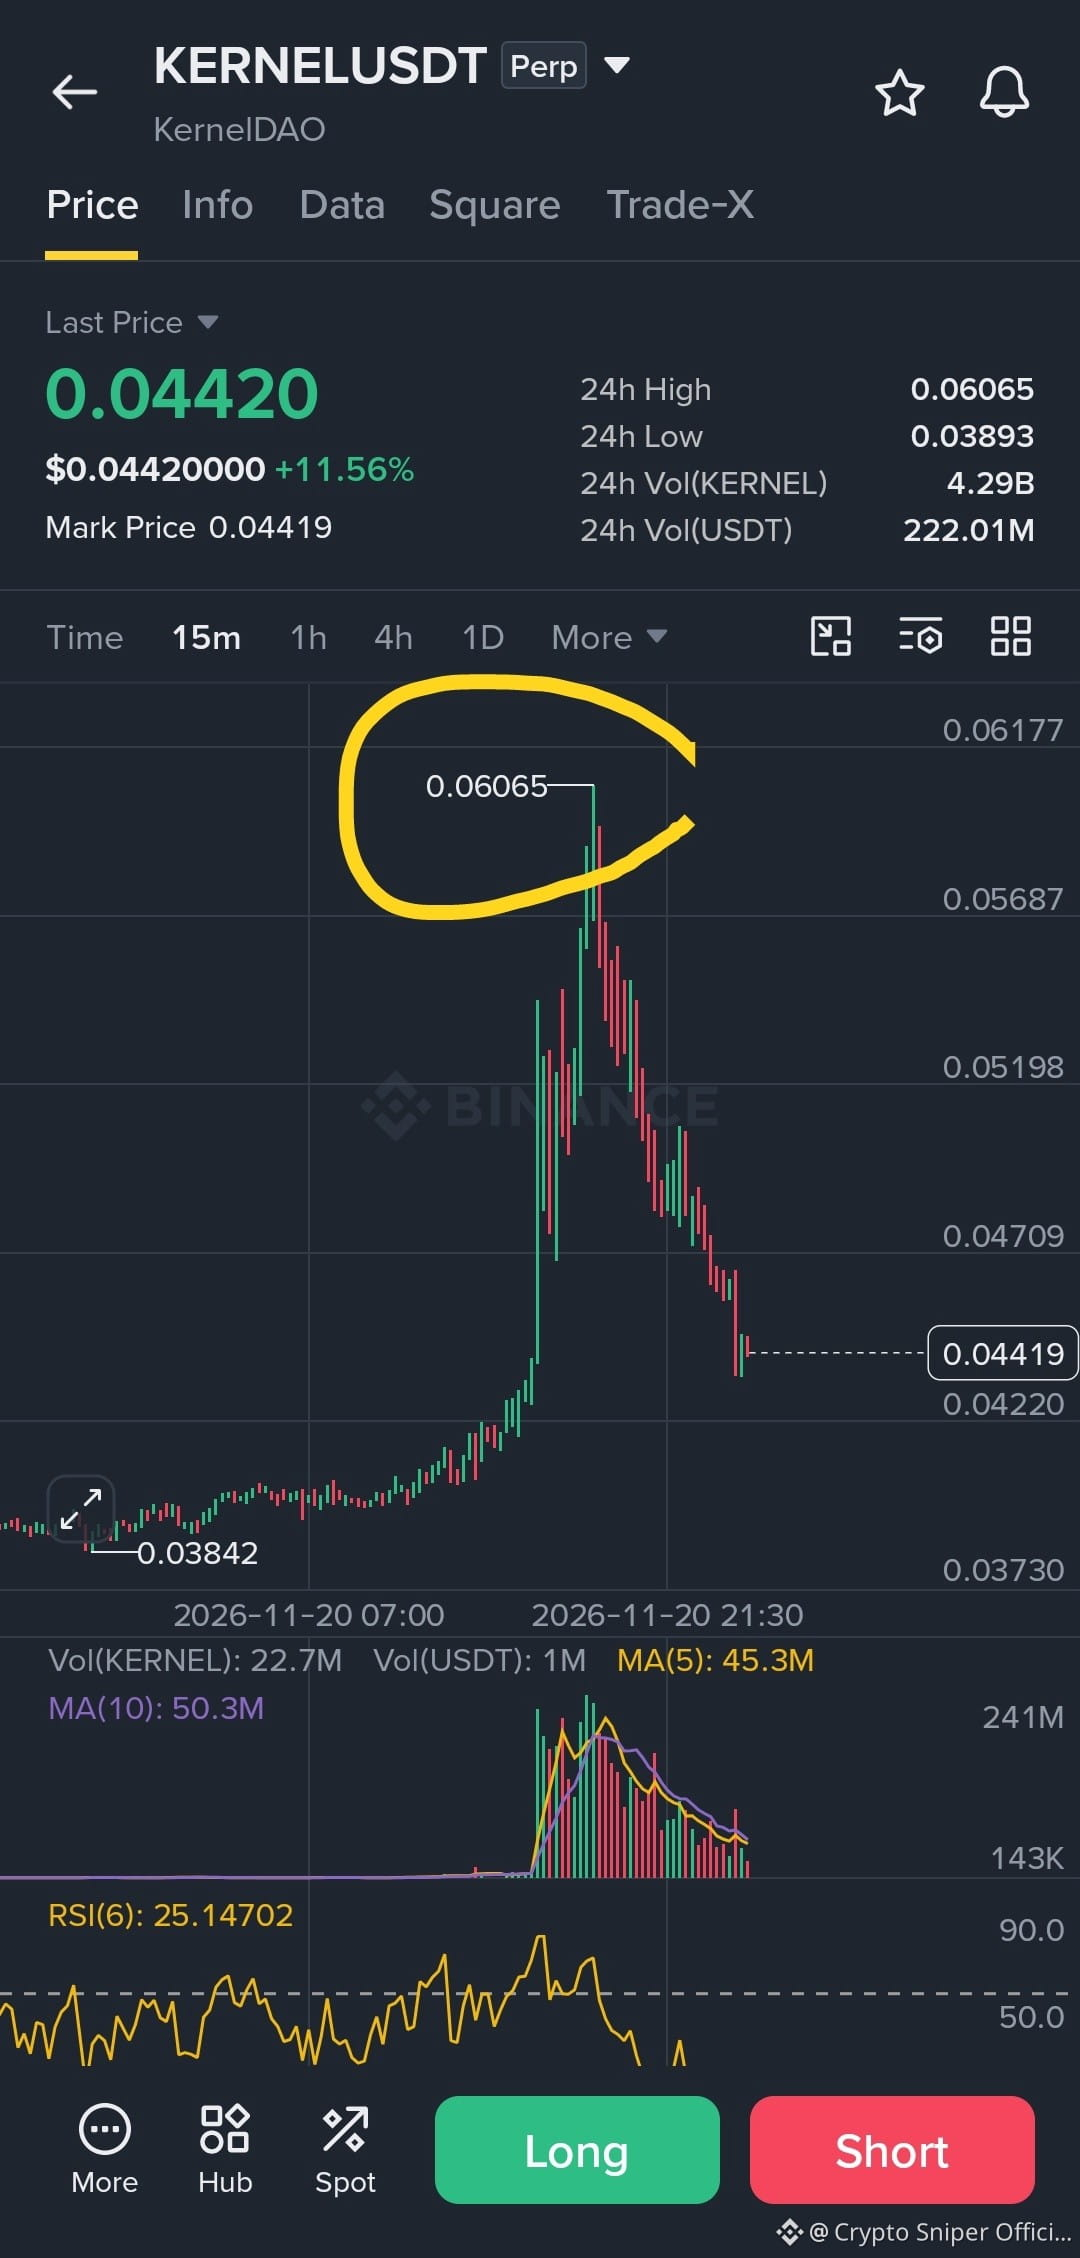
$KERNEL All TP3 Done ✅
Congratulations ❤
$KERNEL All TP3 Done ✅
Congratulations ❤
Congratulations ❤
Crypto Sniper Official
·
--
$KERNEL 🚀 USDT — LONG SETUP
⏱️ 4H Chart | Perpetual
🟢 Entry Zone: 0.0455 – 0.0475 (after confirmation)
🎯 TP1: 0.0544 🎯 TP2: 0.0588 🎯 TP3: 0.0620
🛑 SL: 0.0420
KERNEL is showing massive bullish momentum with a volume breakout. RSI(6) at 95 indicates extreme overbought conditions. Wait for a pullback before entering. Don't chase the pump!
⏱️ 4H Chart | Perpetual
🟢 Entry Zone: 0.0455 – 0.0475 (after confirmation)
🎯 TP1: 0.0544 🎯 TP2: 0.0588 🎯 TP3: 0.0620
🛑 SL: 0.0420
KERNEL is showing massive bullish momentum with a volume breakout. RSI(6) at 95 indicates extreme overbought conditions. Wait for a pullback before entering. Don't chase the pump!
150
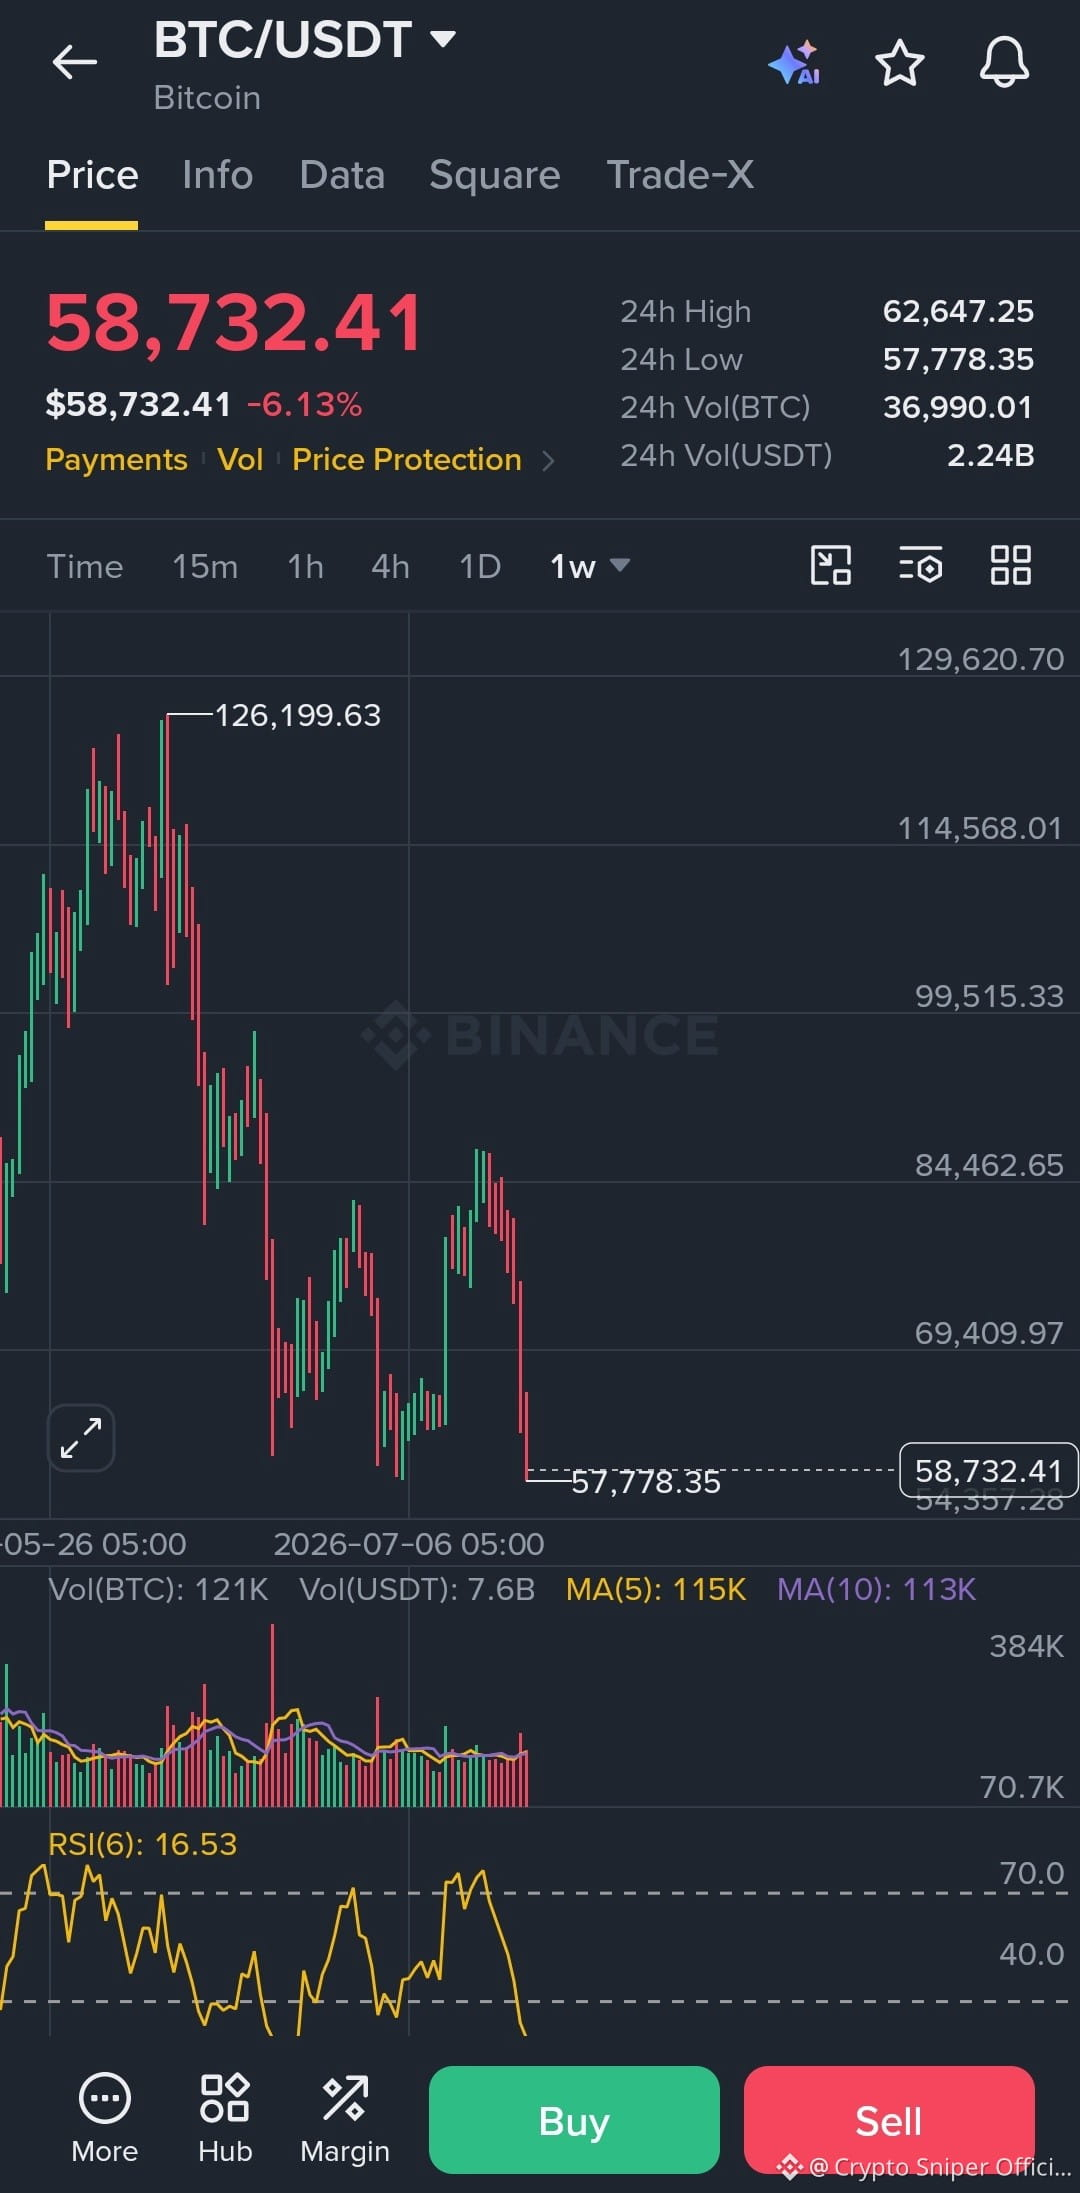
🚨 BITCOIN FLASH CRASH!
$BTC has plunged to $57,778 — its lowest level in over 2 years!
📉 A new cycle low has been recorded.
IS THIS THE BOTTOM, OR IS MORE PAIN AHEAD? 🩸
🚨 BITCOIN FLASH CRASH!
$BTC has plunged to $57,778 — its lowest level in over 2 years!
📉 A new cycle low has been recorded.
IS THIS THE BOTTOM, OR IS MORE PAIN AHEAD? 🩸
$BTC has plunged to $57,778 — its lowest level in over 2 years!
📉 A new cycle low has been recorded.
IS THIS THE BOTTOM, OR IS MORE PAIN AHEAD? 🩸
90
I've Told You 😭📉❗🔴
$BTC $ETH
I've Told You 😭📉❗🔴
$BTC $ETH
$BTC $ETH
Crypto Sniper Official
·
--
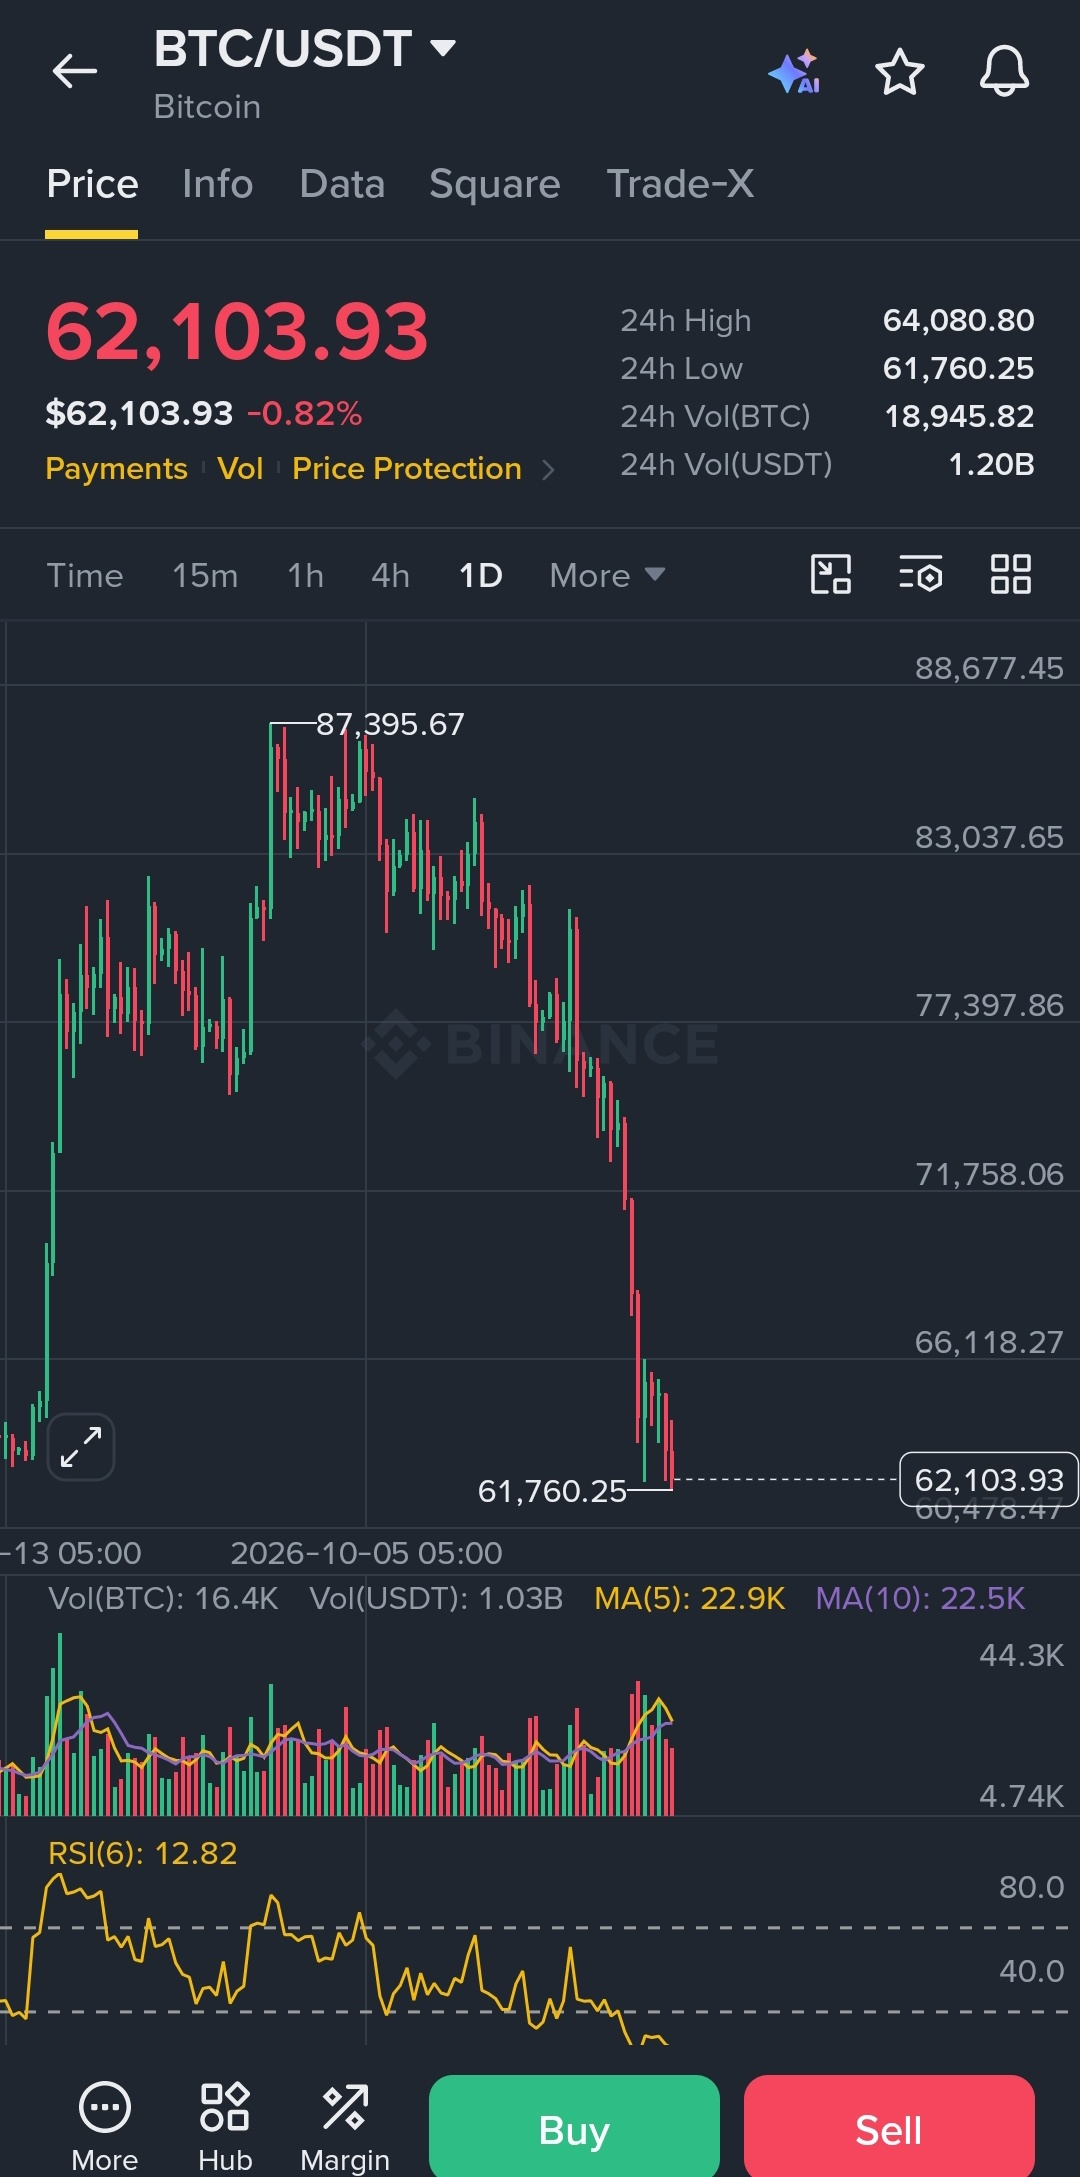
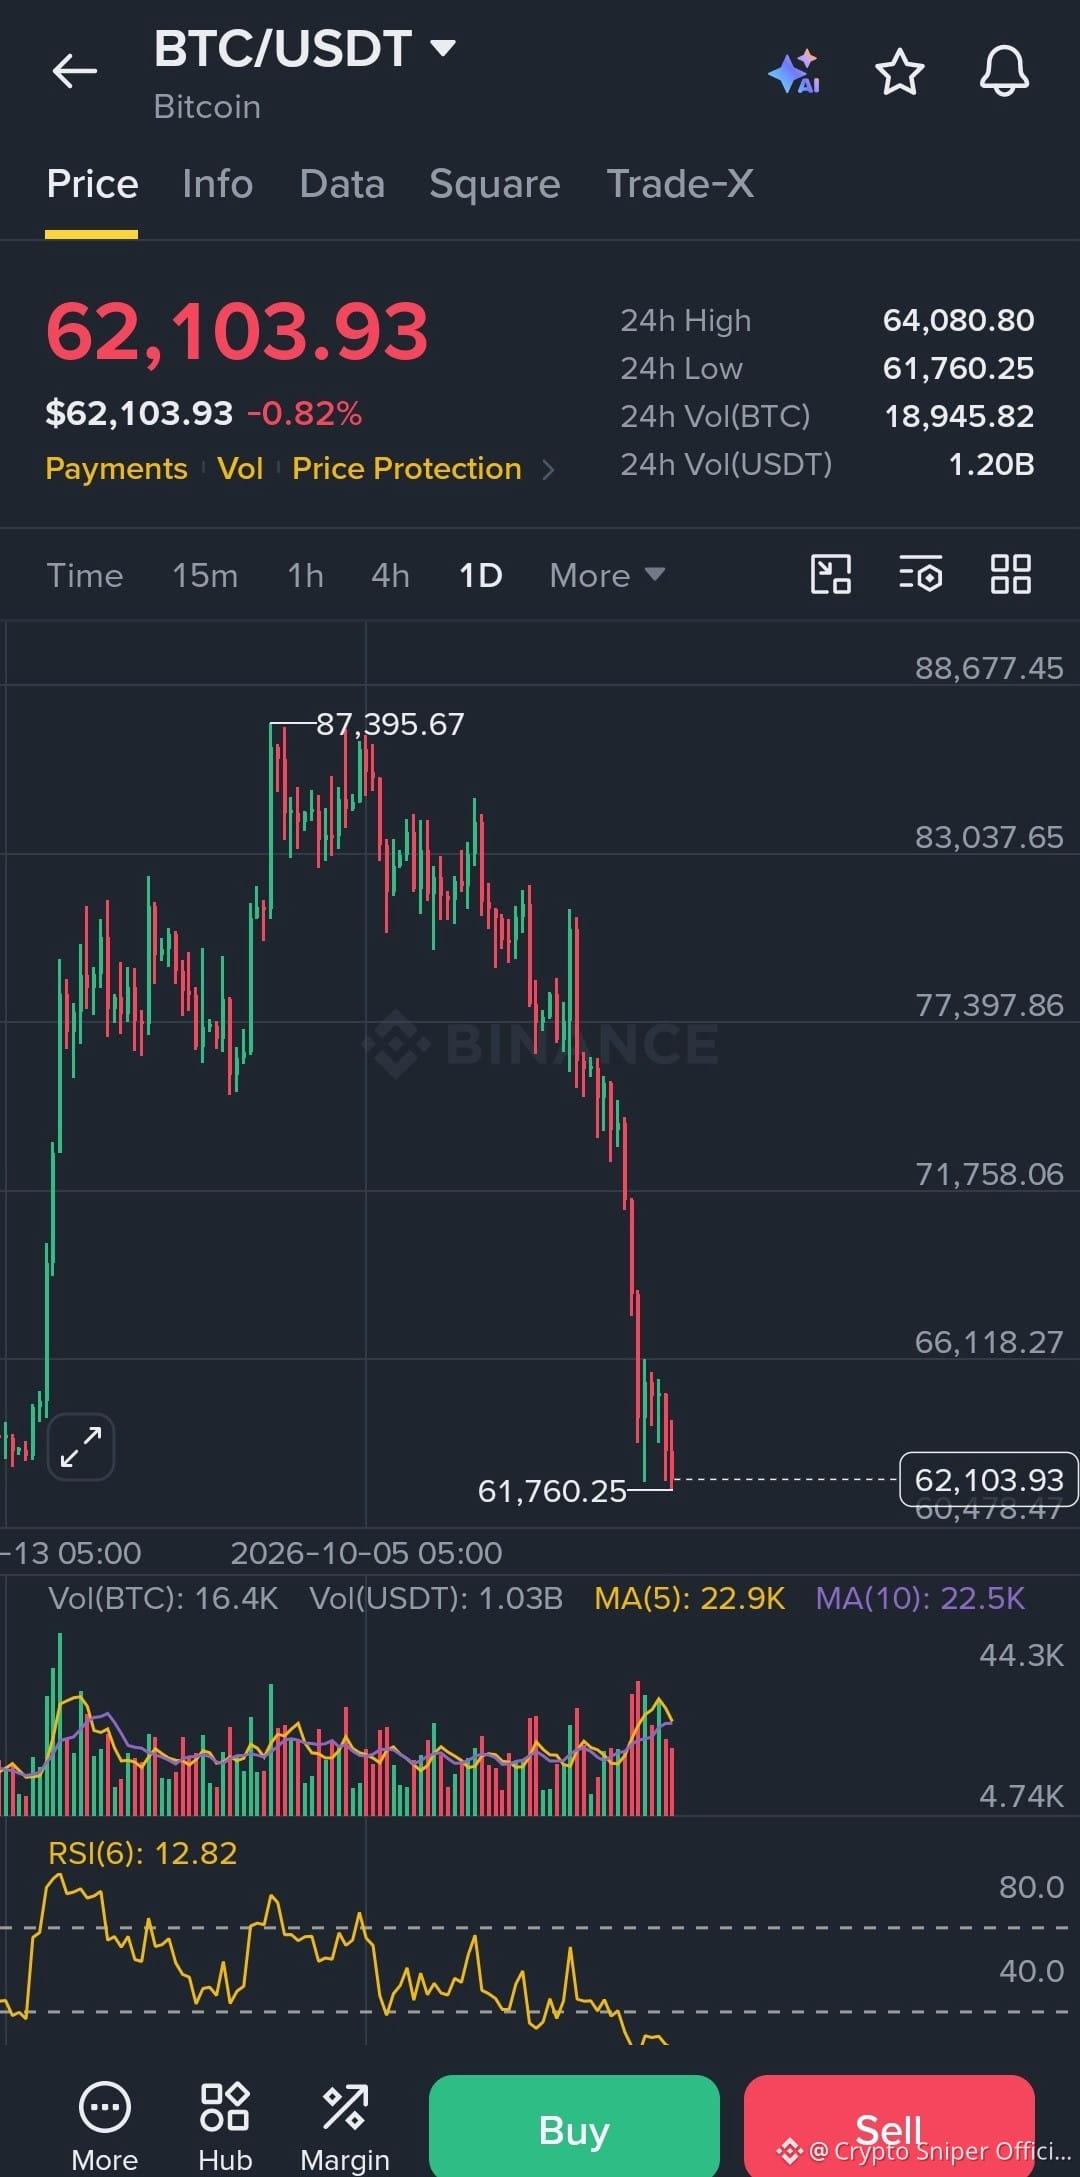
$BTC What The Fu*k 😰
Bitcoin Falls Under $62,000 📉
This Is Not Good Believe me
Bitcoin Falls Under $62,000 📉
This Is Not Good Believe me

20
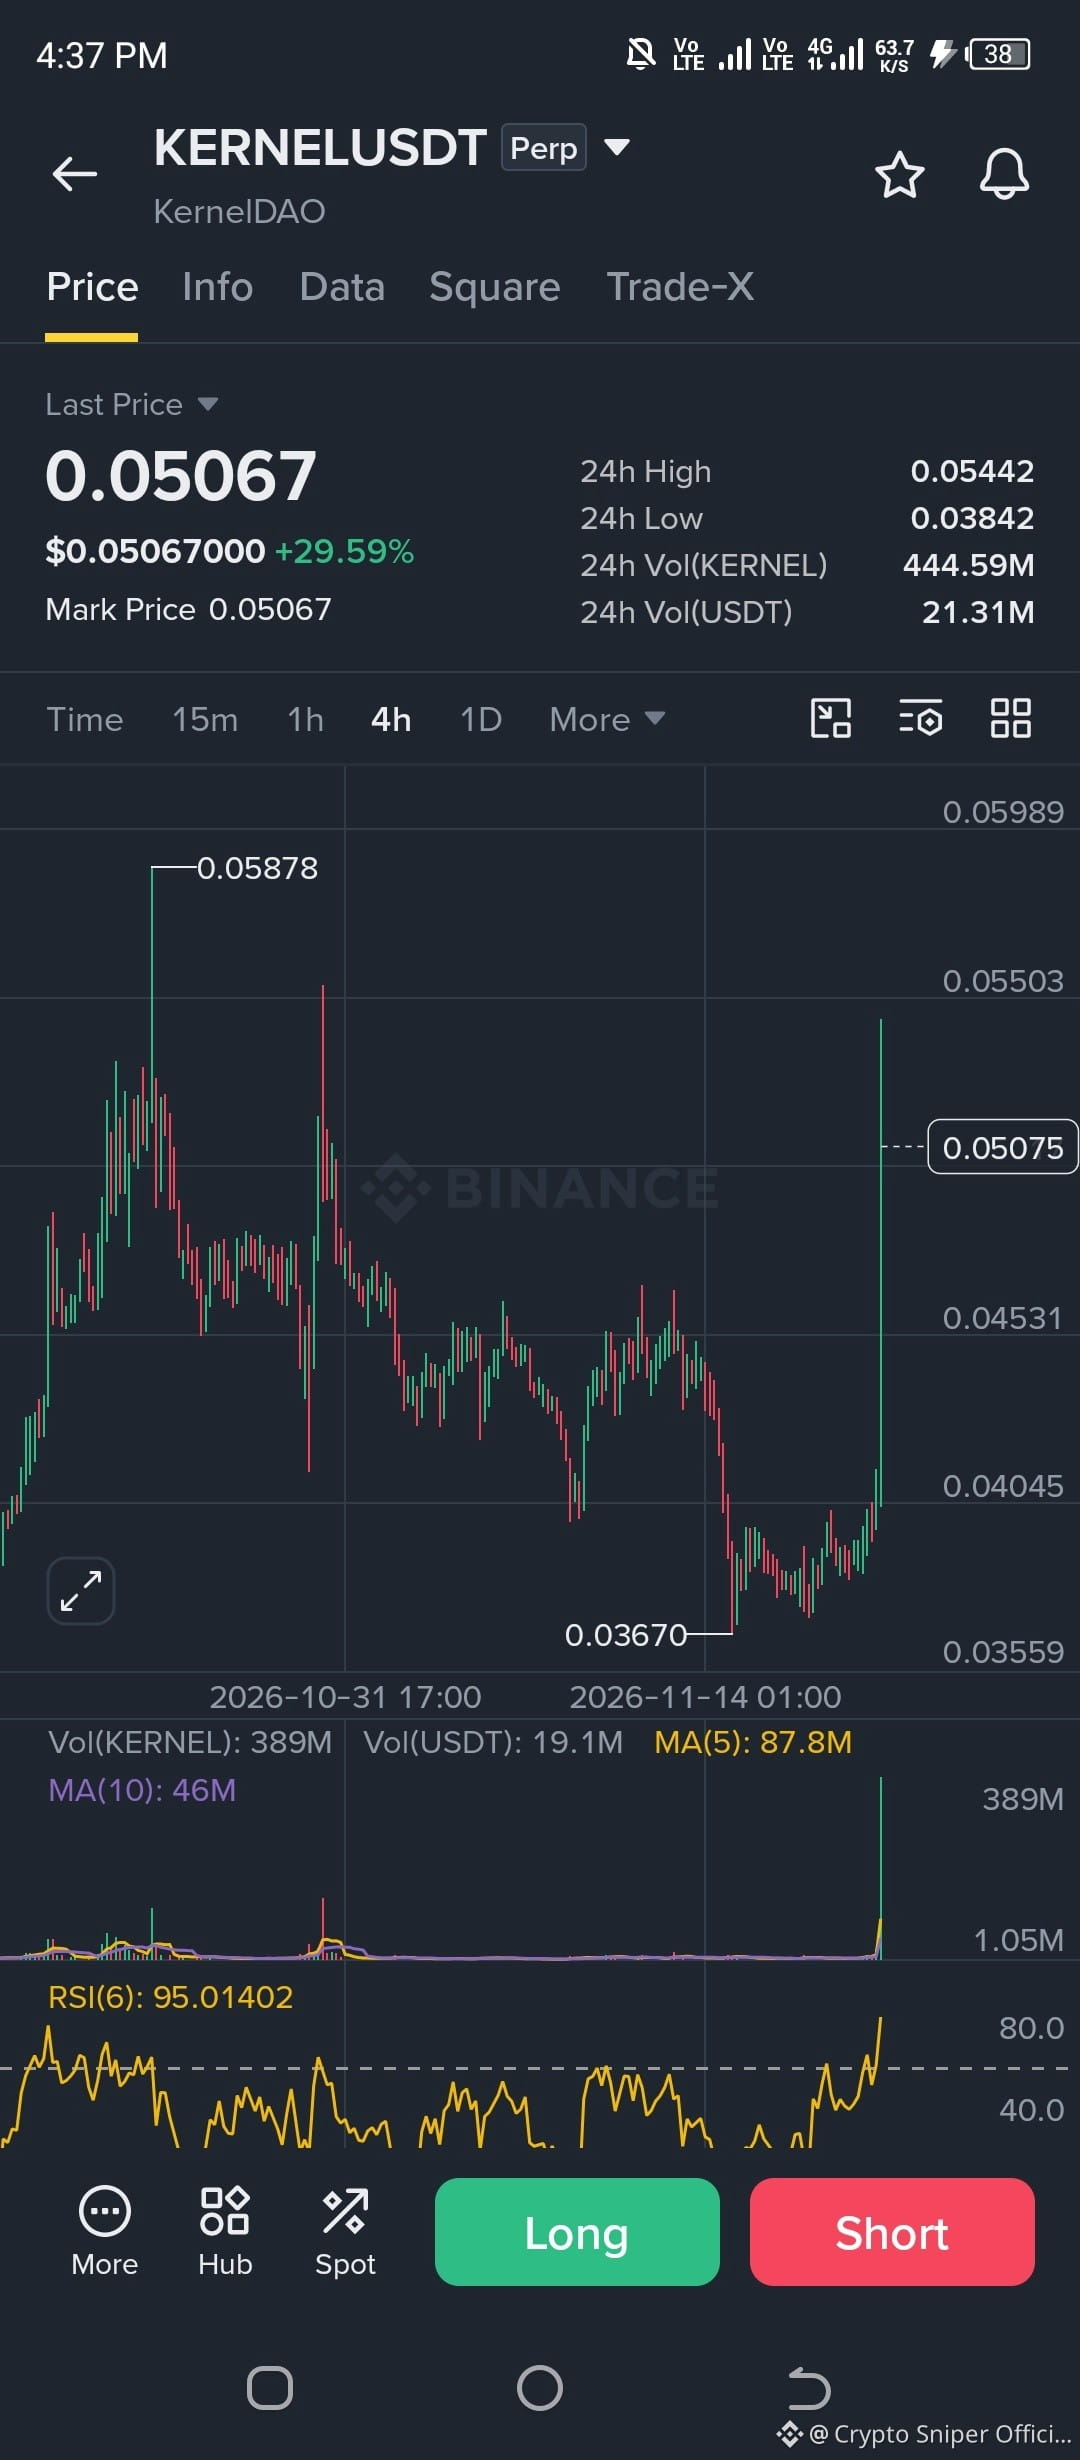
$KERNEL 🚀 USDT — LONG SETUP
⏱️ 4H Chart | Perpetual
🟢 Entry Zone: 0.0455 – 0.0475 (after confirmation)
🎯 TP1: 0.0544 🎯 TP2: 0.0588 🎯 TP3: 0.0620
🛑 SL: 0.0420
KERNEL is showing massive bullish momentum with a volume breakout. RSI(6) at 95 indicates extreme overbought conditions. Wait for a pullback before entering. Don't chase the pump!
$KERNEL 🚀 USDT — LONG SETUP
⏱️ 4H Chart | Perpetual
🟢 Entry Zone: 0.0455 – 0.0475 (after confirmation)
🎯 TP1: 0.0544 🎯 TP2: 0.0588 🎯 TP3: 0.0620
🛑 SL: 0.0420
KERNEL is showing massive bullish momentum with a volume breakout. RSI(6) at 95 indicates extreme overbought conditions. Wait for a pullback before entering. Don't chase the pump!
⏱️ 4H Chart | Perpetual
🟢 Entry Zone: 0.0455 – 0.0475 (after confirmation)
🎯 TP1: 0.0544 🎯 TP2: 0.0588 🎯 TP3: 0.0620
🛑 SL: 0.0420
KERNEL is showing massive bullish momentum with a volume breakout. RSI(6) at 95 indicates extreme overbought conditions. Wait for a pullback before entering. Don't chase the pump!
1
1
128
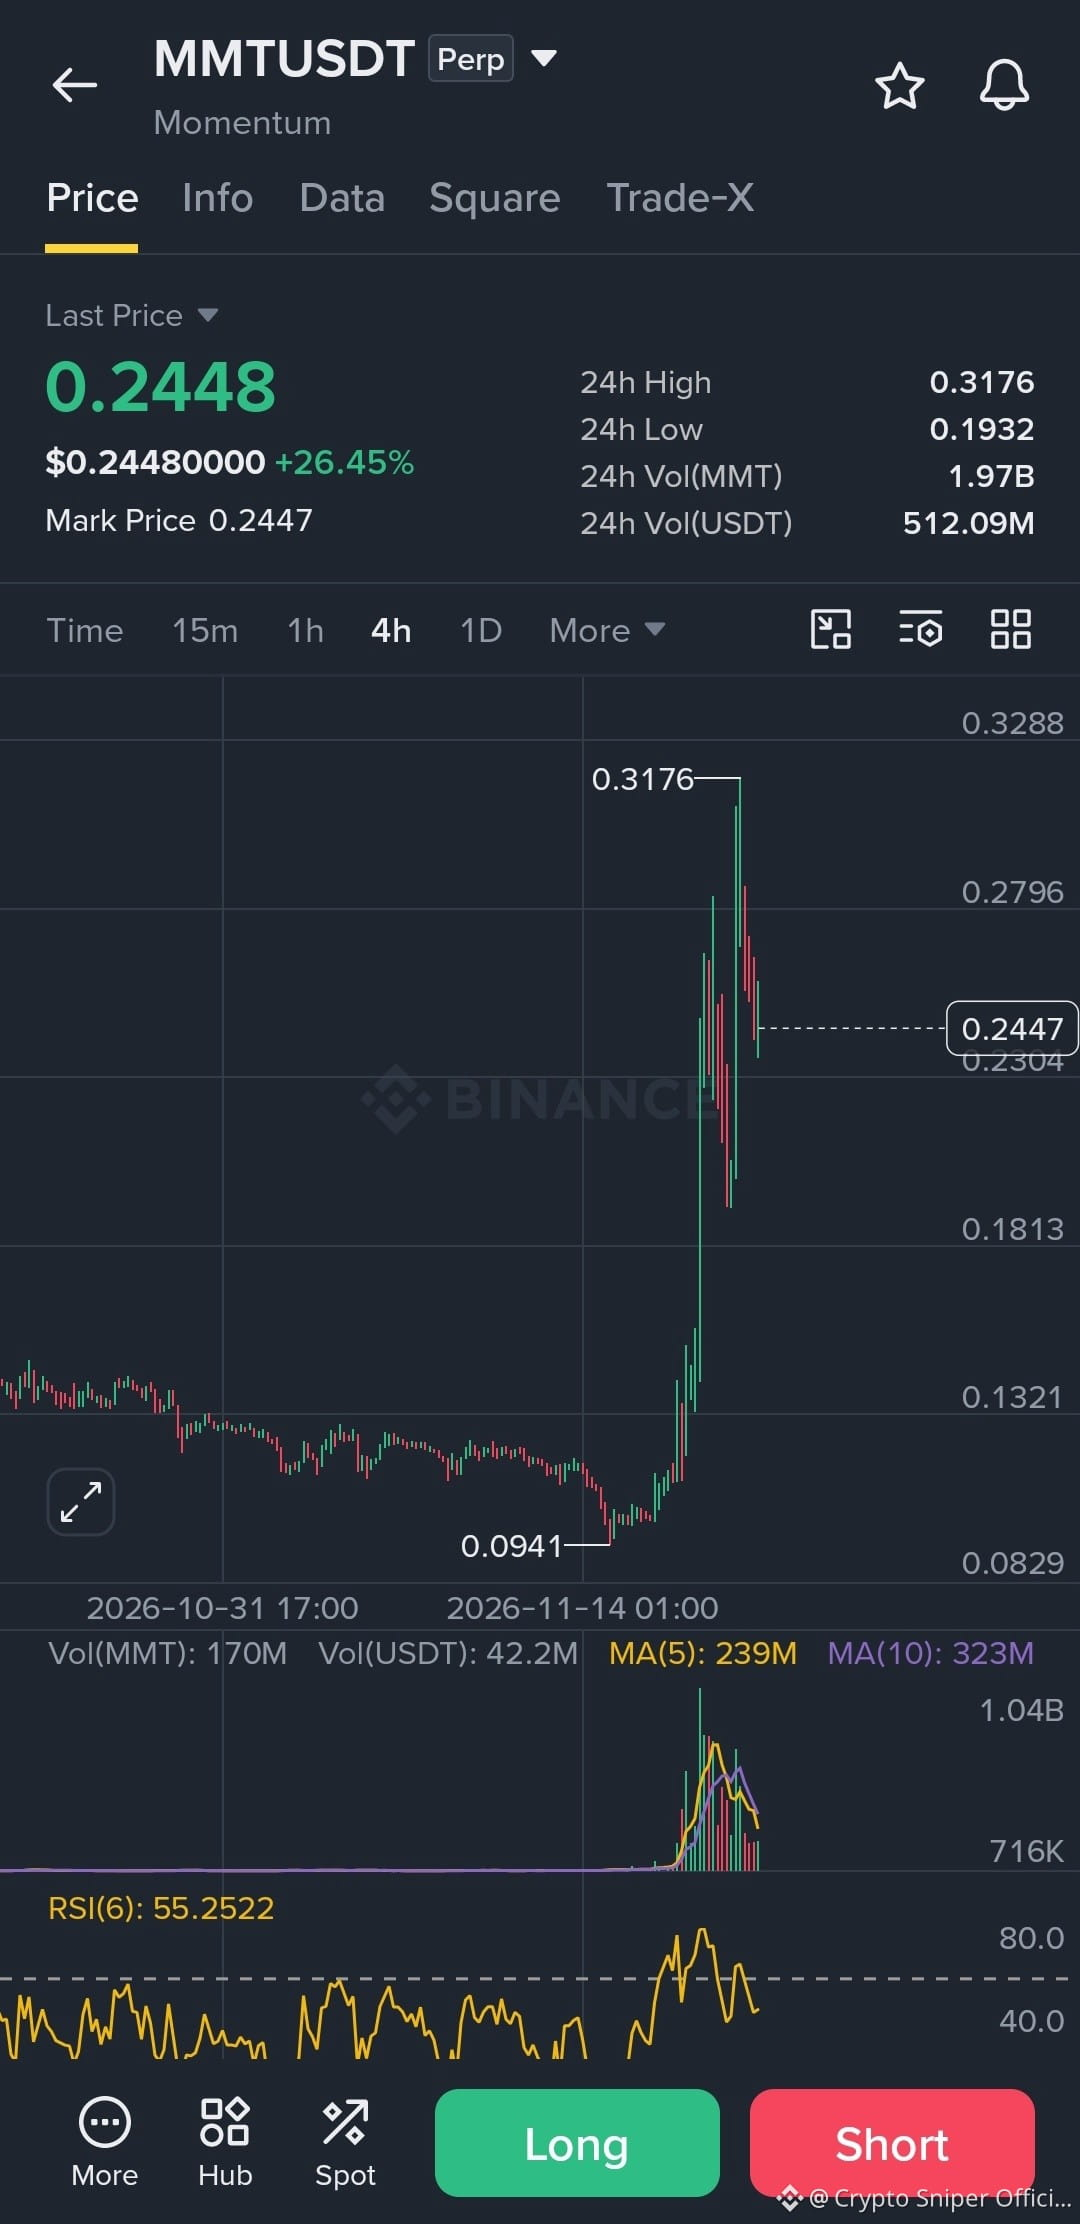
$MMT 🚀 / USDT — LONG SETUP
⏱️ 4H Chart | Perpetual
🟢 Entry Zone: 0.2250 – 0.2350 (after confirmation)
🎯 TP1: 0.2790 🎯 TP2: 0.3000 🎯 TP3: 0.3170
🛑 SL: 0.2050
MMT is cooling down after a massive breakout. RSI(6) at 55 suggests momentum is still recovering. Watch for support confirmation before entering.
$MMT 🚀 / USDT — LONG SETUP
⏱️ 4H Chart | Perpetual
🟢 Entry Zone: 0.2250 – 0.2350 (after confirmation)
🎯 TP1: 0.2790 🎯 TP2: 0.3000 🎯 TP3: 0.3170
🛑 SL: 0.2050
MMT is cooling down after a massive breakout. RSI(6) at 55 suggests momentum is still recovering. Watch for support confirmation before entering.
⏱️ 4H Chart | Perpetual
🟢 Entry Zone: 0.2250 – 0.2350 (after confirmation)
🎯 TP1: 0.2790 🎯 TP2: 0.3000 🎯 TP3: 0.3170
🛑 SL: 0.2050
MMT is cooling down after a massive breakout. RSI(6) at 55 suggests momentum is still recovering. Watch for support confirmation before entering.
178
$BTC What The Fu*k 😰
Bitcoin Falls Under $62,000 📉
This Is Not Good Believe me
$BTC What The Fu*k 😰
Bitcoin Falls Under $62,000 📉
This Is Not Good Believe me
Bitcoin Falls Under $62,000 📉
This Is Not Good Believe me

1
118
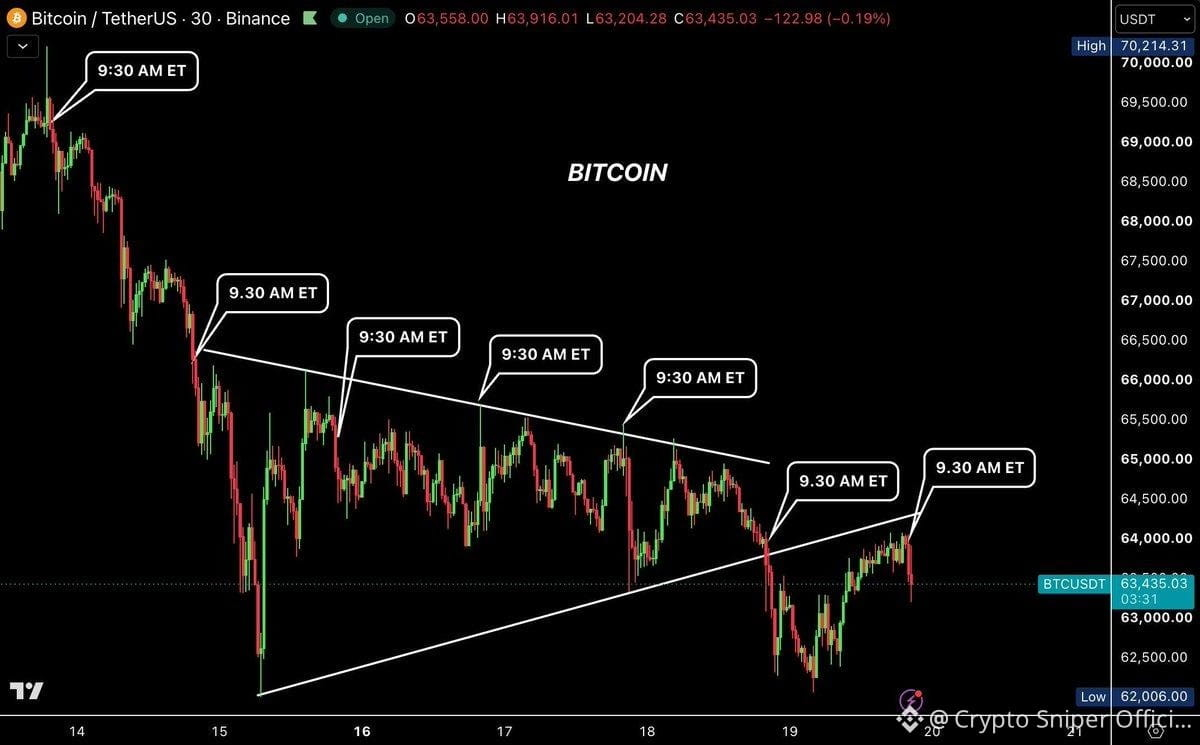
🚨 IS JANE STREET BACK?
$BTC has dumped 7 times in a row immediately after the US stock market opened.
👀 Another suspicious pattern or just market volatility?
This repeated selling pressure is raising serious questions.
THE MARKET NEEDS ANSWERS! 📉
🚨 IS JANE STREET BACK?
$BTC has dumped 7 times in a row immediately after the US stock market opened.
👀 Another suspicious pattern or just market volatility?
This repeated selling pressure is raising serious questions.
THE MARKET NEEDS ANSWERS! 📉
$BTC has dumped 7 times in a row immediately after the US stock market opened.
👀 Another suspicious pattern or just market volatility?
This repeated selling pressure is raising serious questions.
THE MARKET NEEDS ANSWERS! 📉
83
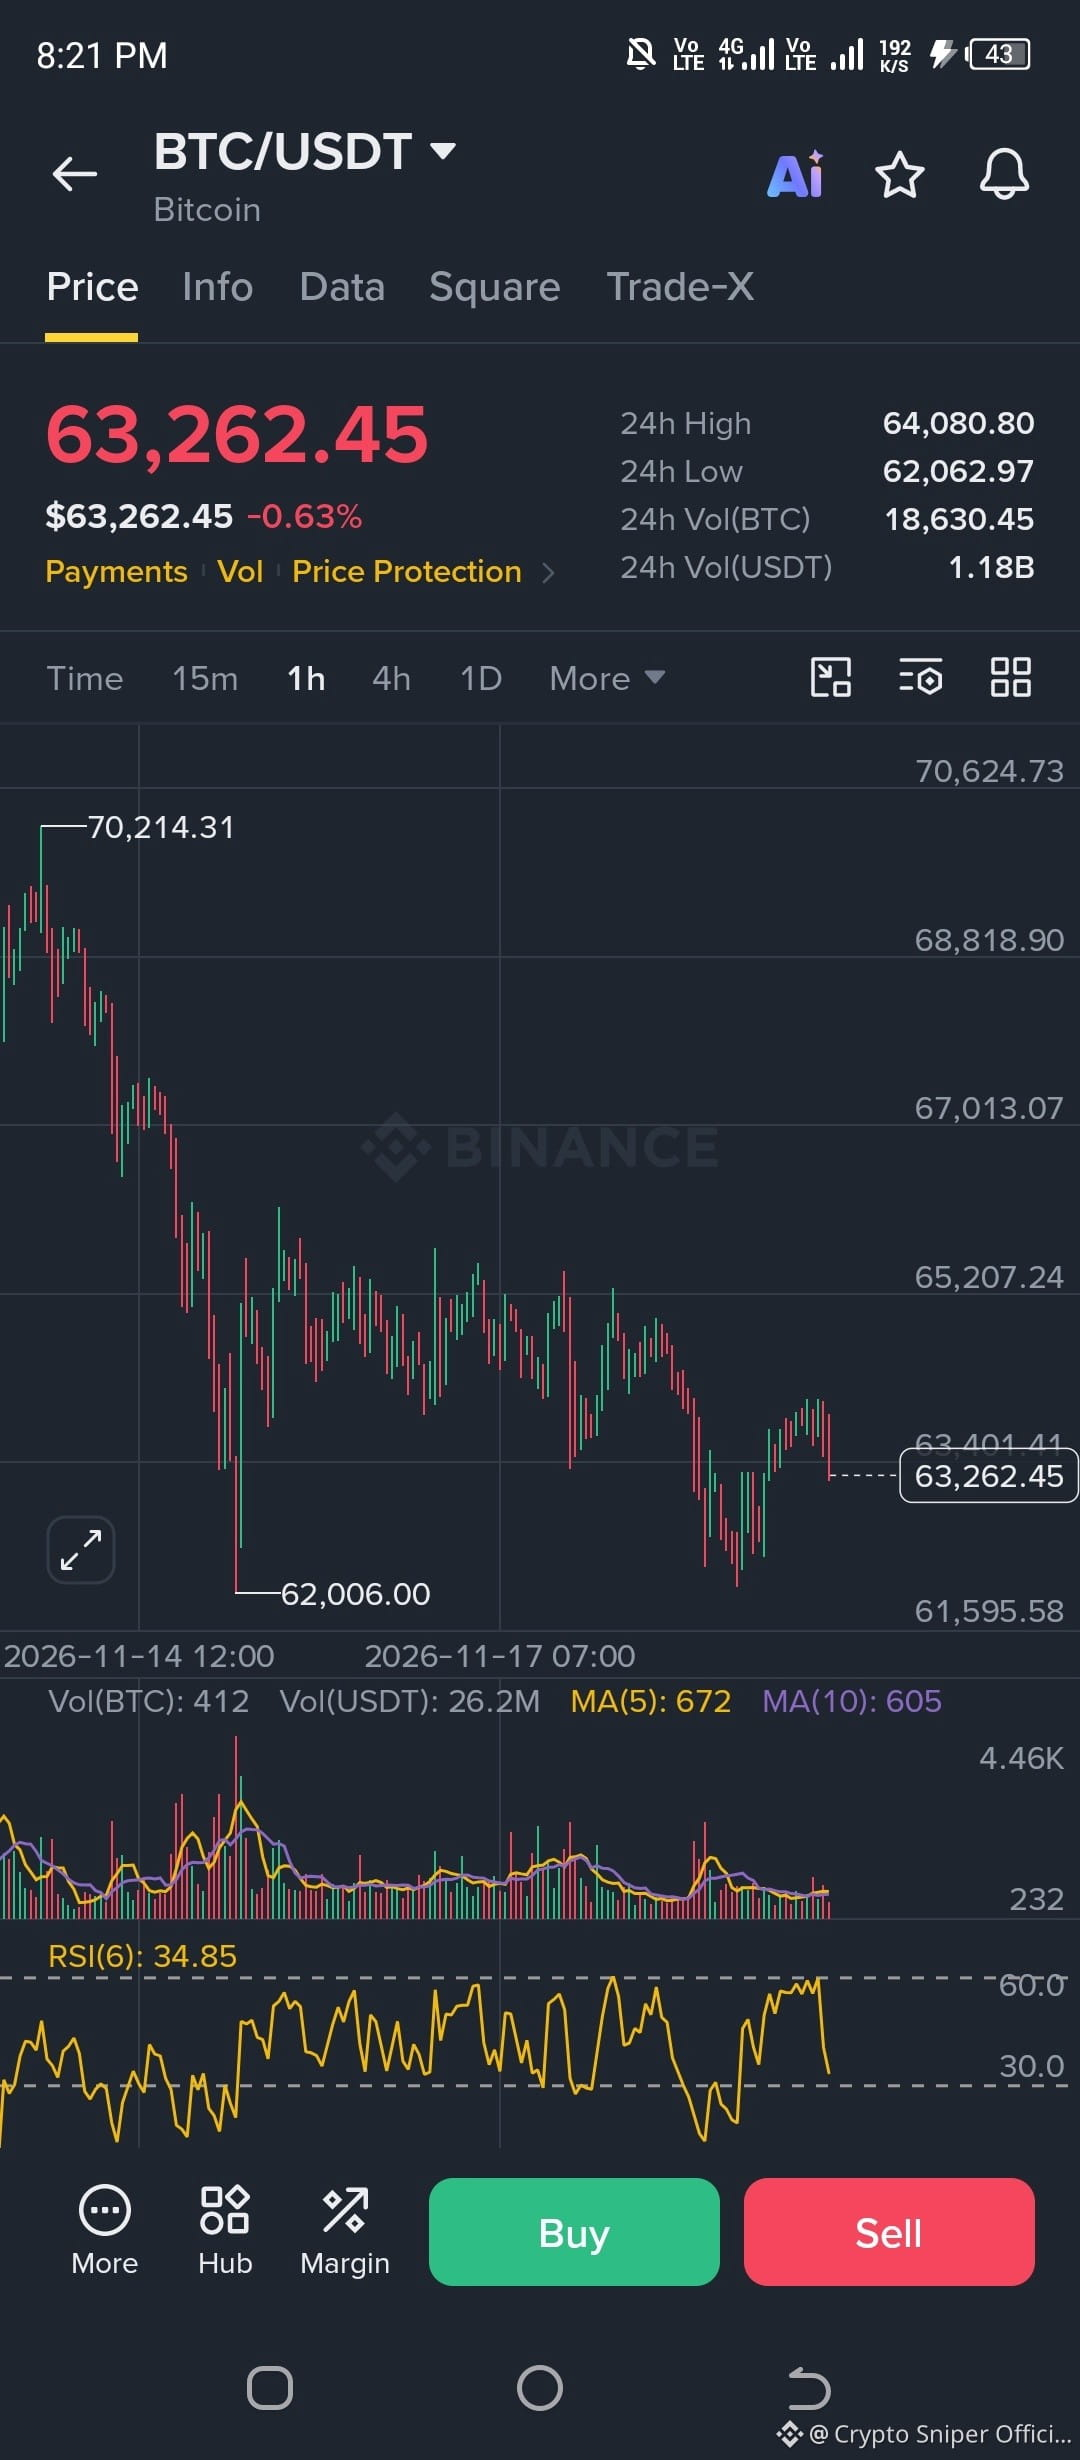
$BTC 🚨 BITCOIN WARNING: RECOVERY IS LOSING MOMENTUM!
$BTC is trading around $63,262 on the 1H chart.
After failing to hold its recent recovery, Bitcoin is showing renewed weakness.
📉 RSI(6) has dropped to 34.85.
Key levels I'm watching:
🔴 $64,080 — Immediate resistance
🔴 $65,207 — Major resistance
🟢 $62,060 — Immediate support
🟢 $62,006 — Previous swing low
My view: Bears remain in control unless BTC reclaims resistance. A breakdown below $62K could open the door to further downside.
Will Bitcoin defend $62K or break lower?
What's your BTC bias right now?
$BTC 🚨 BITCOIN WARNING: RECOVERY IS LOSING MOMENTUM!
$BTC is trading around $63,262 on the 1H chart.
After failing to hold its recent recovery, Bitcoin is showing renewed weakness.
📉 RSI(6) has dropped to 34.85.
Key levels I'm watching:
🔴 $64,080 — Immediate resistance
🔴 $65,207 — Major resistance
🟢 $62,060 — Immediate support
🟢 $62,006 — Previous swing low
My view: Bears remain in control unless BTC reclaims resistance. A breakdown below $62K could open the door to further downside.
Will Bitcoin defend $62K or break lower?
What's your BTC bias right now?
$BTC is trading around $63,262 on the 1H chart.
After failing to hold its recent recovery, Bitcoin is showing renewed weakness.
📉 RSI(6) has dropped to 34.85.
Key levels I'm watching:
🔴 $64,080 — Immediate resistance
🔴 $65,207 — Major resistance
🟢 $62,060 — Immediate support
🟢 $62,006 — Previous swing low
My view: Bears remain in control unless BTC reclaims resistance. A breakdown below $62K could open the door to further downside.
Will Bitcoin defend $62K or break lower?
What's your BTC bias right now?
75
$BTC
🐋 WHALE ALERT! 🚨
A whale has opened a $64 MILLION BTC LONG POSITION! ₿
📉 Currently down $405,000
⚠️ Liquidation Price: $60,983
Is this whale seeing something the market hasn't?
👀 SMART MONEY OR A RISKY BET?
$BTC
🐋 WHALE ALERT! 🚨
A whale has opened a $64 MILLION BTC LONG POSITION! ₿
📉 Currently down $405,000
⚠️ Liquidation Price: $60,983
Is this whale seeing something the market hasn't?
👀 SMART MONEY OR A RISKY BET?
🐋 WHALE ALERT! 🚨
A whale has opened a $64 MILLION BTC LONG POSITION! ₿
📉 Currently down $405,000
⚠️ Liquidation Price: $60,983
Is this whale seeing something the market hasn't?
👀 SMART MONEY OR A RISKY BET?
9
📚 A GREEN CANDLE DOESN'T MEAN A BULLISH TREND!
Many traders enter immediately after seeing a strong green candle.
But experienced traders look for more:
Breakout confirmation.
Volume expansion.
Successful retest.
Higher-high formation.
Patience can save more money than chasing every move.
Do you prefer entering breakouts or buying support?
📚 A GREEN CANDLE DOESN'T MEAN A BULLISH TREND!
Many traders enter immediately after seeing a strong green candle.
But experienced traders look for more:
Breakout confirmation.
Volume expansion.
Successful retest.
Higher-high formation.
Patience can save more money than chasing every move.
Do you prefer entering breakouts or buying support?
Many traders enter immediately after seeing a strong green candle.
But experienced traders look for more:
Breakout confirmation.
Volume expansion.
Successful retest.
Higher-high formation.
Patience can save more money than chasing every move.
Do you prefer entering breakouts or buying support?
58
HOLY SH*T. WHAT JUST HAPPENED?
$BTC just dumped to $63,200 and wiped out $250 MILLION longs in 24 hours!
99,000 traders wiped out.
Then it immediately pumped back above $64,900 and took out another $140 MILLION of shorts.
And look at the heatmap now.
The liquidity above at $65,000 - $67,000 is still sitting there.
And an even bigger cluster has now built up BELOW at $62,000 - $63,000.
Which side gets taken next? 👀
HOLY SH*T. WHAT JUST HAPPENED?
$BTC just dumped to $63,200 and wiped out $250 MILLION longs in 24 hours!
99,000 traders wiped out.
Then it immediately pumped back above $64,900 and took out another $140 MILLION of shorts.
And look at the heatmap now.
The liquidity above at $65,000 - $67,000 is still sitting there.
And an even bigger cluster has now built up BELOW at $62,000 - $63,000.
Which side gets taken next? 👀
$BTC just dumped to $63,200 and wiped out $250 MILLION longs in 24 hours!
99,000 traders wiped out.
Then it immediately pumped back above $64,900 and took out another $140 MILLION of shorts.
And look at the heatmap now.
The liquidity above at $65,000 - $67,000 is still sitting there.
And an even bigger cluster has now built up BELOW at $62,000 - $63,000.
Which side gets taken next? 👀
57
🚨 BITCOIN RECOVERY: BULLS ARE SHOWING UP!
$BTC is trading around $64,618 in the latest 1H chart.
After dropping to $62,006, Bitcoin has started showing signs of short-term recovery.
📊 RSI(6) has climbed from 32.30 to 51.49.
Key levels I'm watching:
🔴 Resistance: $65,447 – $67,000
🟢 Support: $63,336 – $62,006
My view: Momentum is improving, but bulls still need to reclaim $65,447 to strengthen the recovery.
I want to see confirmation before taking a position.
What's next for Bitcoin?
🎯 $67K recovery or another rejection?
Share your analysis below.
🚨 BITCOIN RECOVERY: BULLS ARE SHOWING UP!
$BTC is trading around $64,618 in the latest 1H chart.
After dropping to $62,006, Bitcoin has started showing signs of short-term recovery.
📊 RSI(6) has climbed from 32.30 to 51.49.
Key levels I'm watching:
🔴 Resistance: $65,447 – $67,000
🟢 Support: $63,336 – $62,006
My view: Momentum is improving, but bulls still need to reclaim $65,447 to strengthen the recovery.
I want to see confirmation before taking a position.
What's next for Bitcoin?
🎯 $67K recovery or another rejection?
Share your analysis below.
$BTC is trading around $64,618 in the latest 1H chart.
After dropping to $62,006, Bitcoin has started showing signs of short-term recovery.
📊 RSI(6) has climbed from 32.30 to 51.49.
Key levels I'm watching:
🔴 Resistance: $65,447 – $67,000
🟢 Support: $63,336 – $62,006
My view: Momentum is improving, but bulls still need to reclaim $65,447 to strengthen the recovery.
I want to see confirmation before taking a position.
What's next for Bitcoin?
🎯 $67K recovery or another rejection?
Share your analysis below.
131
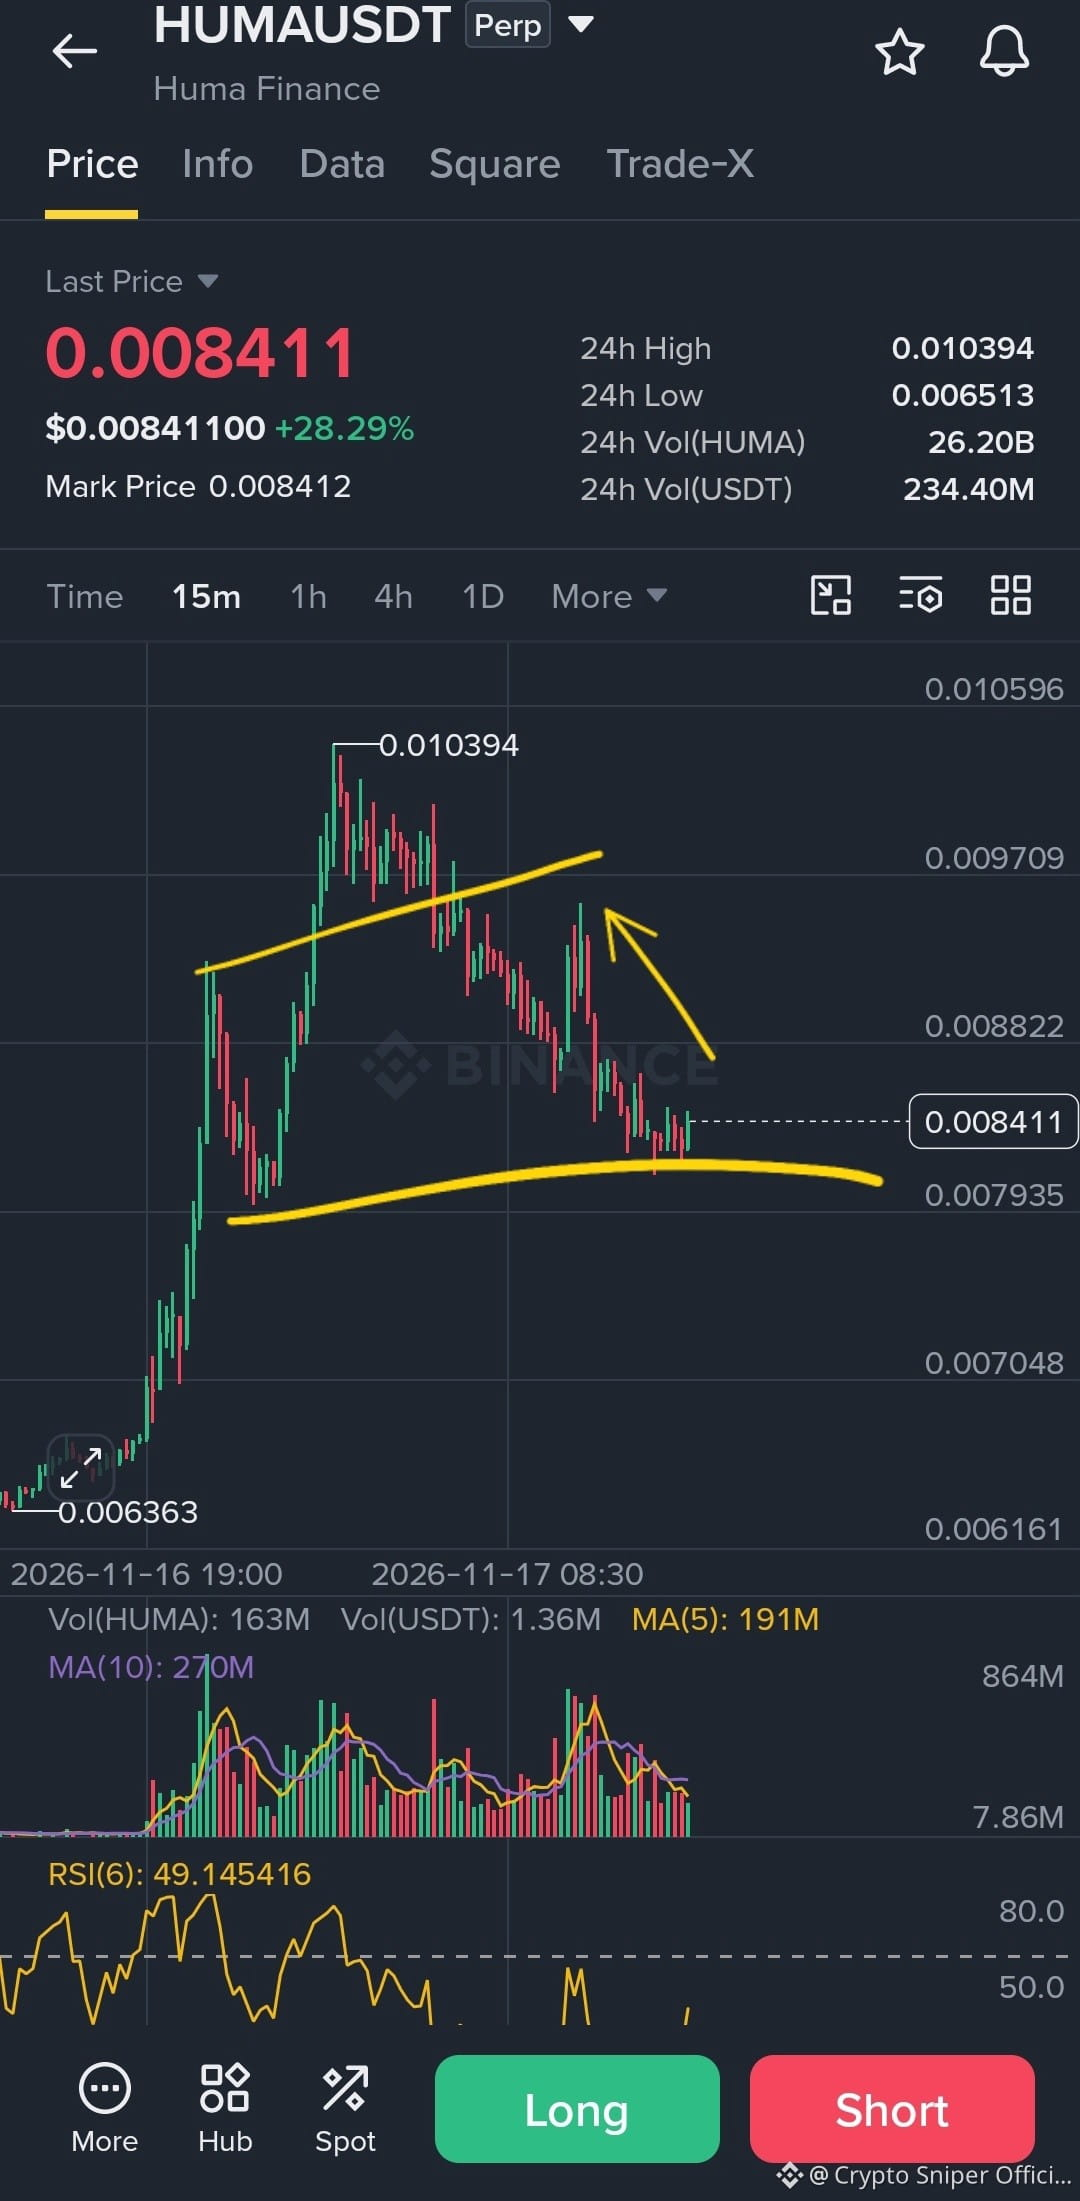
$HUMA
Maybe 0.0092 Coming...
MY SL : 0.0078
DYOR NFA
$HUMA
Maybe 0.0092 Coming...
MY SL : 0.0078
DYOR NFA
Maybe 0.0092 Coming...
MY SL : 0.0078
DYOR NFA
Crypto Sniper Official
·
--
$HUMA IS SHOWING SIGNS OF A STRONG COMEBACK! 🚀
HUMA is up 28.29%, with an impressive $234.40M in 24-hour trading volume on Binance.
📊 Current Price: $0.008411
🔥 24H High: $0.010394
📈 Strong volume signals renewed market interest.
Can HUMA reclaim $0.0100 and push higher? Watch the next move closely! 👀
HUMA is up 28.29%, with an impressive $234.40M in 24-hour trading volume on Binance.
📊 Current Price: $0.008411
🔥 24H High: $0.010394
📈 Strong volume signals renewed market interest.
Can HUMA reclaim $0.0100 and push higher? Watch the next move closely! 👀
75
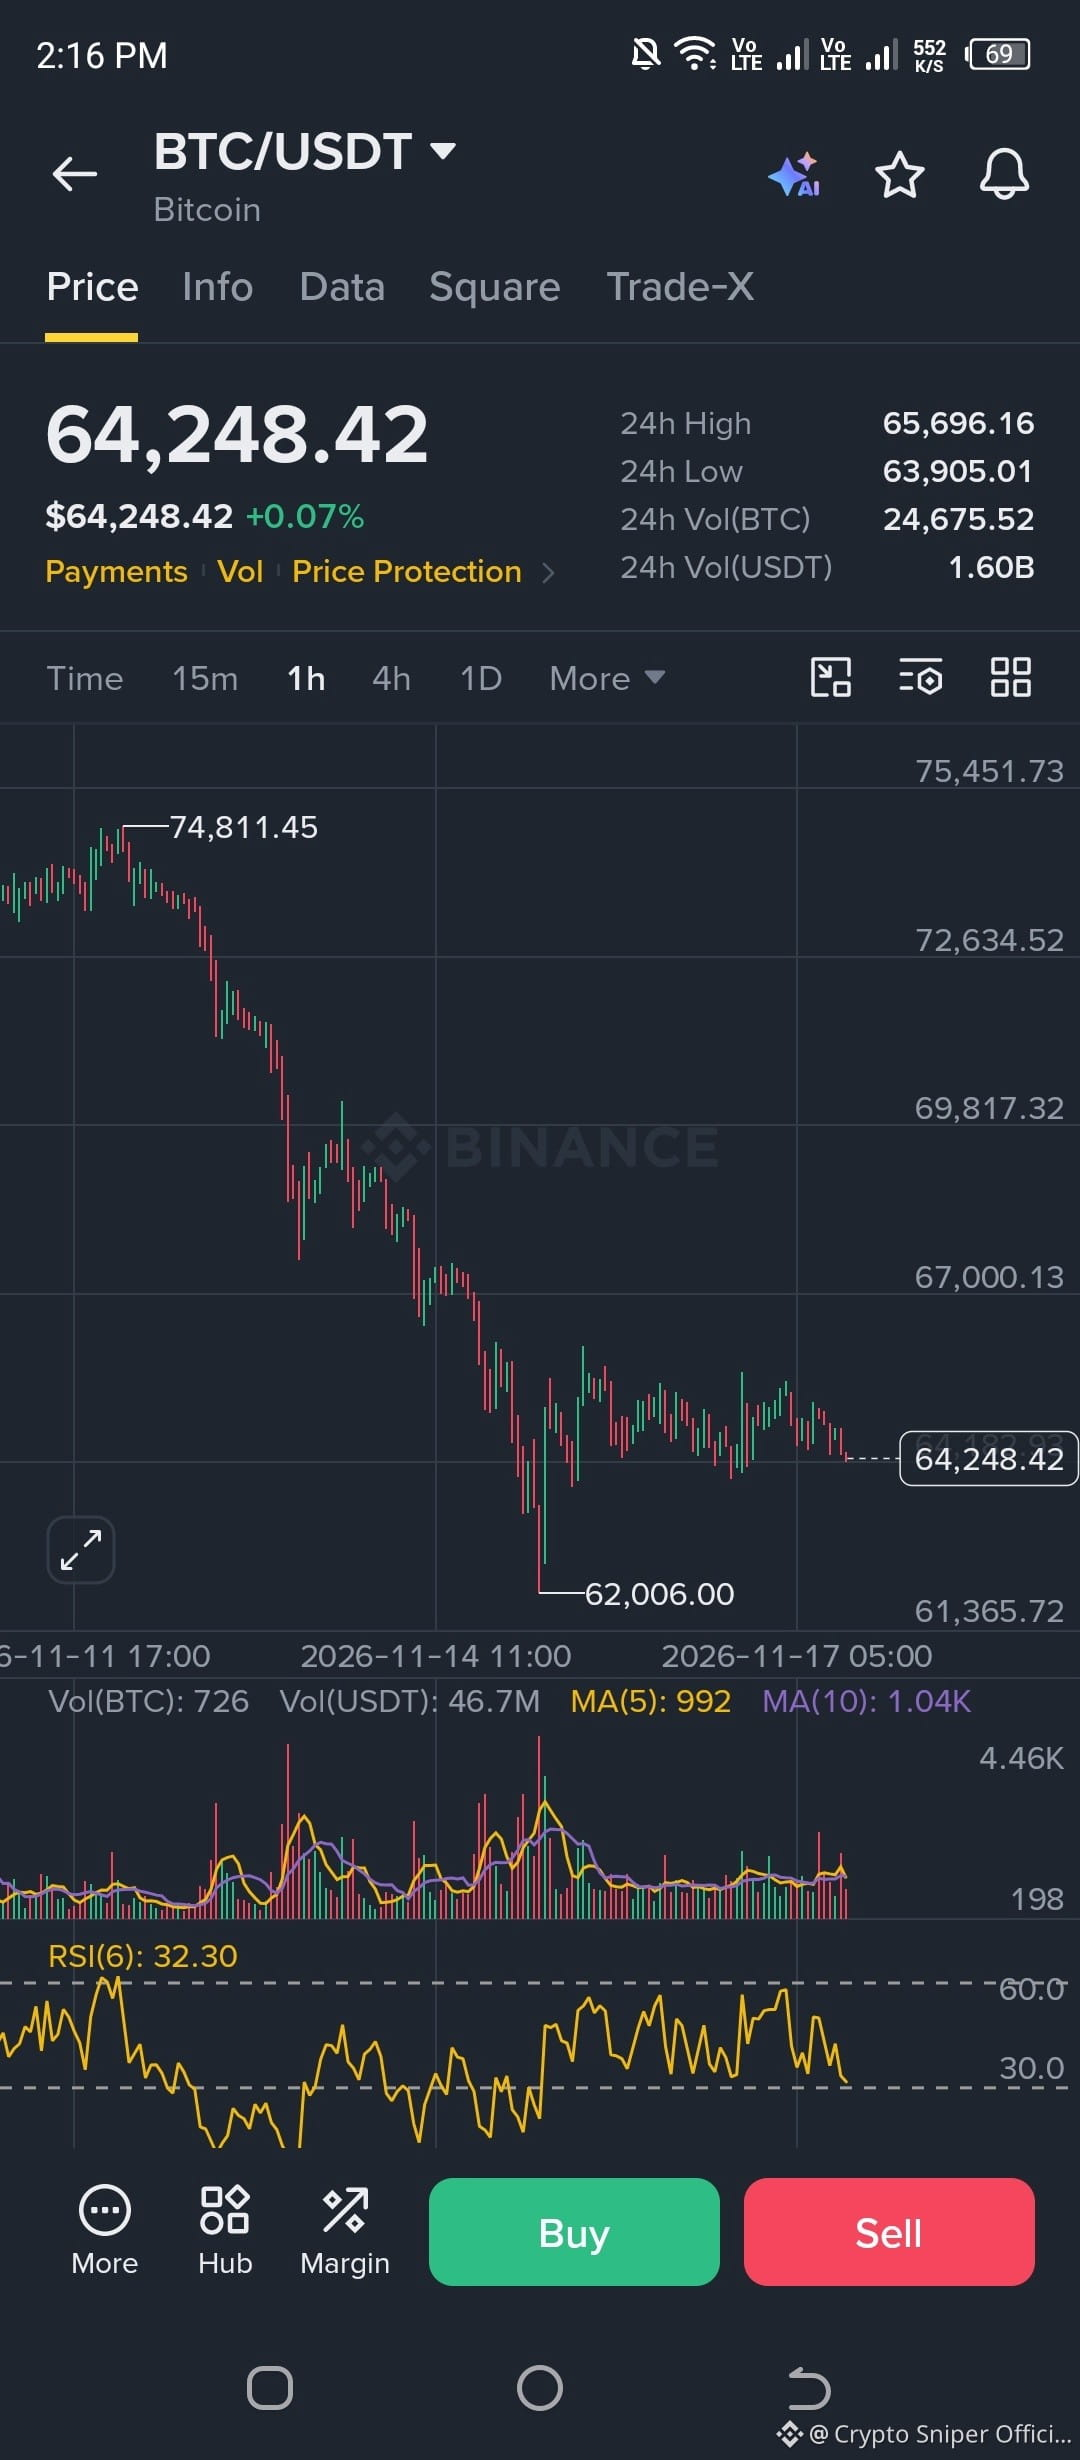
$BTC 🚨 BITCOIN: BEARS STILL IN CONTROL?
$BTC is trading around $64,248 in the shared 1H chart.
After dropping from $74,811 to $62,006, Bitcoin is now consolidating near $64K.
Here are the levels I'm watching:
🔴 Resistance: $65,600 – $67,000
🟢 Support: $63,900 – $62,006
📊 RSI(6): 32.30
My view: Bulls need to reclaim $65,600 and hold above it to improve short-term momentum.
Until then, I'm not rushing into long positions.
What's your next BTC target: $67K or $62K?
$BTC 🚨 BITCOIN: BEARS STILL IN CONTROL?
$BTC is trading around $64,248 in the shared 1H chart.
After dropping from $74,811 to $62,006, Bitcoin is now consolidating near $64K.
Here are the levels I'm watching:
🔴 Resistance: $65,600 – $67,000
🟢 Support: $63,900 – $62,006
📊 RSI(6): 32.30
My view: Bulls need to reclaim $65,600 and hold above it to improve short-term momentum.
Until then, I'm not rushing into long positions.
What's your next BTC target: $67K or $62K?
$BTC is trading around $64,248 in the shared 1H chart.
After dropping from $74,811 to $62,006, Bitcoin is now consolidating near $64K.
Here are the levels I'm watching:
🔴 Resistance: $65,600 – $67,000
🟢 Support: $63,900 – $62,006
📊 RSI(6): 32.30
My view: Bulls need to reclaim $65,600 and hold above it to improve short-term momentum.
Until then, I'm not rushing into long positions.
What's your next BTC target: $67K or $62K?

6
Log in to explore more content
Join global crypto users on Binance Square
⚡️ Get latest and useful information about crypto.
💬 Trusted by the world’s largest crypto exchange.
👍 Discover real insights from verified creators.
Email / Phone number
Trending Topics
NvidiaLoses$2.7TrillionInMonthAndAHalf
16,477 views
114 Discussing
Nvidia’s $2.7 Trillion Wipeout: When Narrative Overrides Numbers 📉
Crypto With Faisal
·7 Likes
·5.1k views
CanBTCReboundAfterFallingBelow60K?
732,977 views
2,941 Discussing
GlobalStocksFaceLongestLosingStreakSince2023
265,205 views
1,972 Discussing