
B中心
243 Posts

B中心
Report
Block User
2 Following
107 Followers
437 Liked
Posts
All
Quotes
Videos
·
--
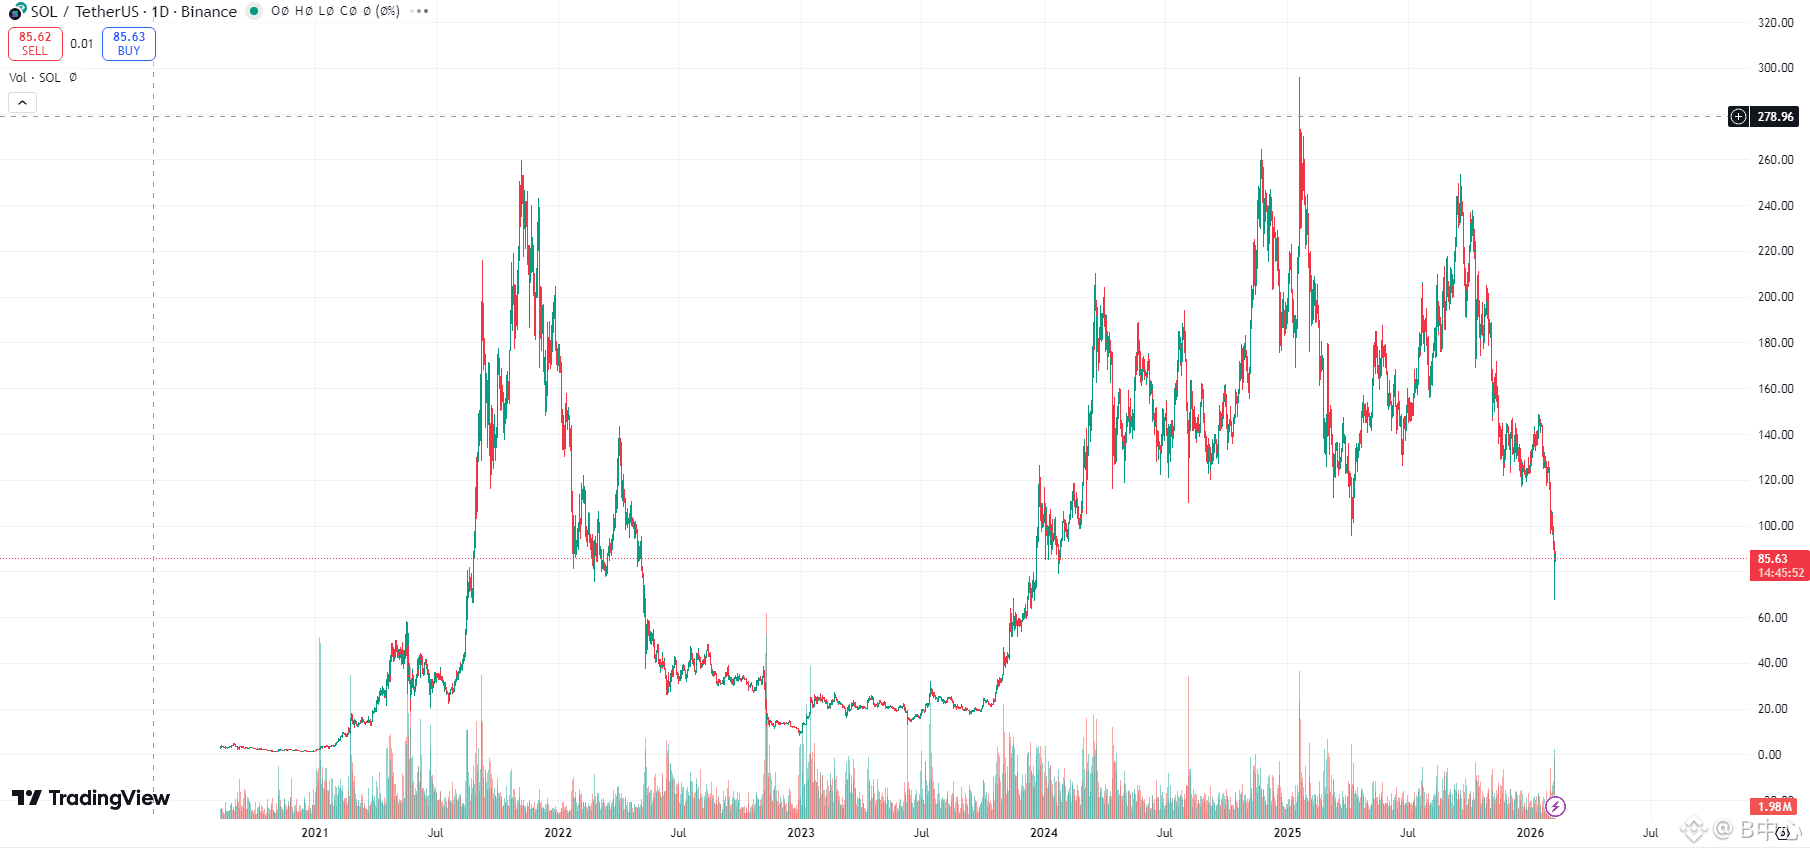
Solana (SOLUSDT | Daily Level) Technical Analysis | 2026.02.07
From the daily structure, SOL formed a clear historical high around $280 and has entered a typical pattern of wide fluctuations at high levels—shifting the center of gravity downward—followed by a breakout with increased volume. The current price has quickly retraced to around $85, which is precisely the key area of dense trading before the last bull market started, and also the dividing line for the long-term trend.
The rhythm of the current decline is significantly faster than the previous adjustment, representing an accelerated downward phase after the completion of high-level distribution. From the characteristics of the trend, it is not merely dragged down by the overall market, but rather SOL itself is undergoing deep repricing of its valuation and chip structure after a substantial prior increase. Previous rebounds have repeatedly stopped below the descending trend line, indicating a complete shift in dominance to the bears.
The current major issue is: the price has fallen below the $120 central platform and the rebound is without volume, which means the previous main upward trend has been confirmed to have ended, and the market has officially entered a medium-term—longer cycle adjustment.
Key level judgment:
$85–$80 range: Core support at the daily level. If it cannot stabilize and show a rebound with volume, the price is likely to test $70 / $60, corresponding to the starting range of the last complete bull market and the long-term cost zone.
$110–$120: First resistance zone. Only by regaining this range and consolidating can the downward trend be alleviated.
Above $150: The dividing line for medium-term bullish and bearish trends. Below this level, all rebounds should be viewed as corrective movements in the downward process.
Rhythm judgment:
It is more likely to follow the path of "sharp decline + long-term horizontal digestion," completing the reconstruction of chips through time instead of a quick V-shaped reversal.
Summary in one sentence:
SOL has entered the deep waters of medium-term adjustment, with $85 being the critical defense line. Until it returns to $120, the overall strategy should remain focused on defense and position control.
Solana (SOLUSDT | Daily Level) Technical Analysis | 2026.02.07
From the daily structure, SOL formed a clear historical high around $280 and has entered a typical pattern of wide fluctuations at high levels—shifting the center of gravity downward—followed by a breakout with increased volume. The current price has quickly retraced to around $85, which is precisely the key area of dense trading before the last bull market started, and also the dividing line for the long-term trend.
The rhythm of the current decline is significantly faster than the previous adjustment, representing an accelerated downward phase after the completion of high-level distribution. From the characteristics of the trend, it is not merely dragged down by the overall market, but rather SOL itself is undergoing deep repricing of its valuation and chip structure after a substantial prior increase. Previous rebounds have repeatedly stopped below the descending trend line, indicating a complete shift in dominance to the bears.
The current major issue is: the price has fallen below the $120 central platform and the rebound is without volume, which means the previous main upward trend has been confirmed to have ended, and the market has officially entered a medium-term—longer cycle adjustment.
Key level judgment:
$85–$80 range: Core support at the daily level. If it cannot stabilize and show a rebound with volume, the price is likely to test $70 / $60, corresponding to the starting range of the last complete bull market and the long-term cost zone.
$110–$120: First resistance zone. Only by regaining this range and consolidating can the downward trend be alleviated.
Above $150: The dividing line for medium-term bullish and bearish trends. Below this level, all rebounds should be viewed as corrective movements in the downward process.
Rhythm judgment:
It is more likely to follow the path of "sharp decline + long-term horizontal digestion," completing the reconstruction of chips through time instead of a quick V-shaped reversal.
Summary in one sentence:
SOL has entered the deep waters of medium-term adjustment, with $85 being the critical defense line. Until it returns to $120, the overall strategy should remain focused on defense and position control.
From the daily structure, SOL formed a clear historical high around $280 and has entered a typical pattern of wide fluctuations at high levels—shifting the center of gravity downward—followed by a breakout with increased volume. The current price has quickly retraced to around $85, which is precisely the key area of dense trading before the last bull market started, and also the dividing line for the long-term trend.
The rhythm of the current decline is significantly faster than the previous adjustment, representing an accelerated downward phase after the completion of high-level distribution. From the characteristics of the trend, it is not merely dragged down by the overall market, but rather SOL itself is undergoing deep repricing of its valuation and chip structure after a substantial prior increase. Previous rebounds have repeatedly stopped below the descending trend line, indicating a complete shift in dominance to the bears.
The current major issue is: the price has fallen below the $120 central platform and the rebound is without volume, which means the previous main upward trend has been confirmed to have ended, and the market has officially entered a medium-term—longer cycle adjustment.
Key level judgment:
$85–$80 range: Core support at the daily level. If it cannot stabilize and show a rebound with volume, the price is likely to test $70 / $60, corresponding to the starting range of the last complete bull market and the long-term cost zone.
$110–$120: First resistance zone. Only by regaining this range and consolidating can the downward trend be alleviated.
Above $150: The dividing line for medium-term bullish and bearish trends. Below this level, all rebounds should be viewed as corrective movements in the downward process.
Rhythm judgment:
It is more likely to follow the path of "sharp decline + long-term horizontal digestion," completing the reconstruction of chips through time instead of a quick V-shaped reversal.
Summary in one sentence:
SOL has entered the deep waters of medium-term adjustment, with $85 being the critical defense line. Until it returns to $120, the overall strategy should remain focused on defense and position control.
1
595
·
--
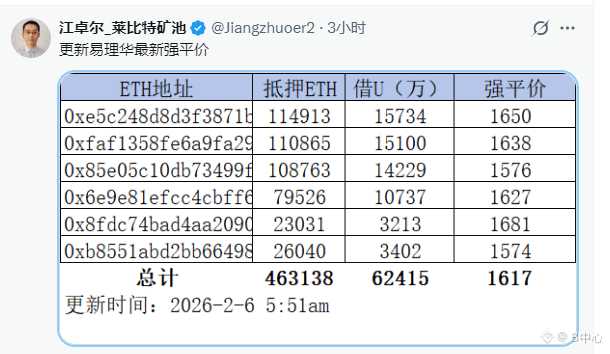
Easy Li Hua latest forced liquidation price $1617 $ETH
Easy Li Hua latest forced liquidation price $1617 $ETH
1
409
·
--
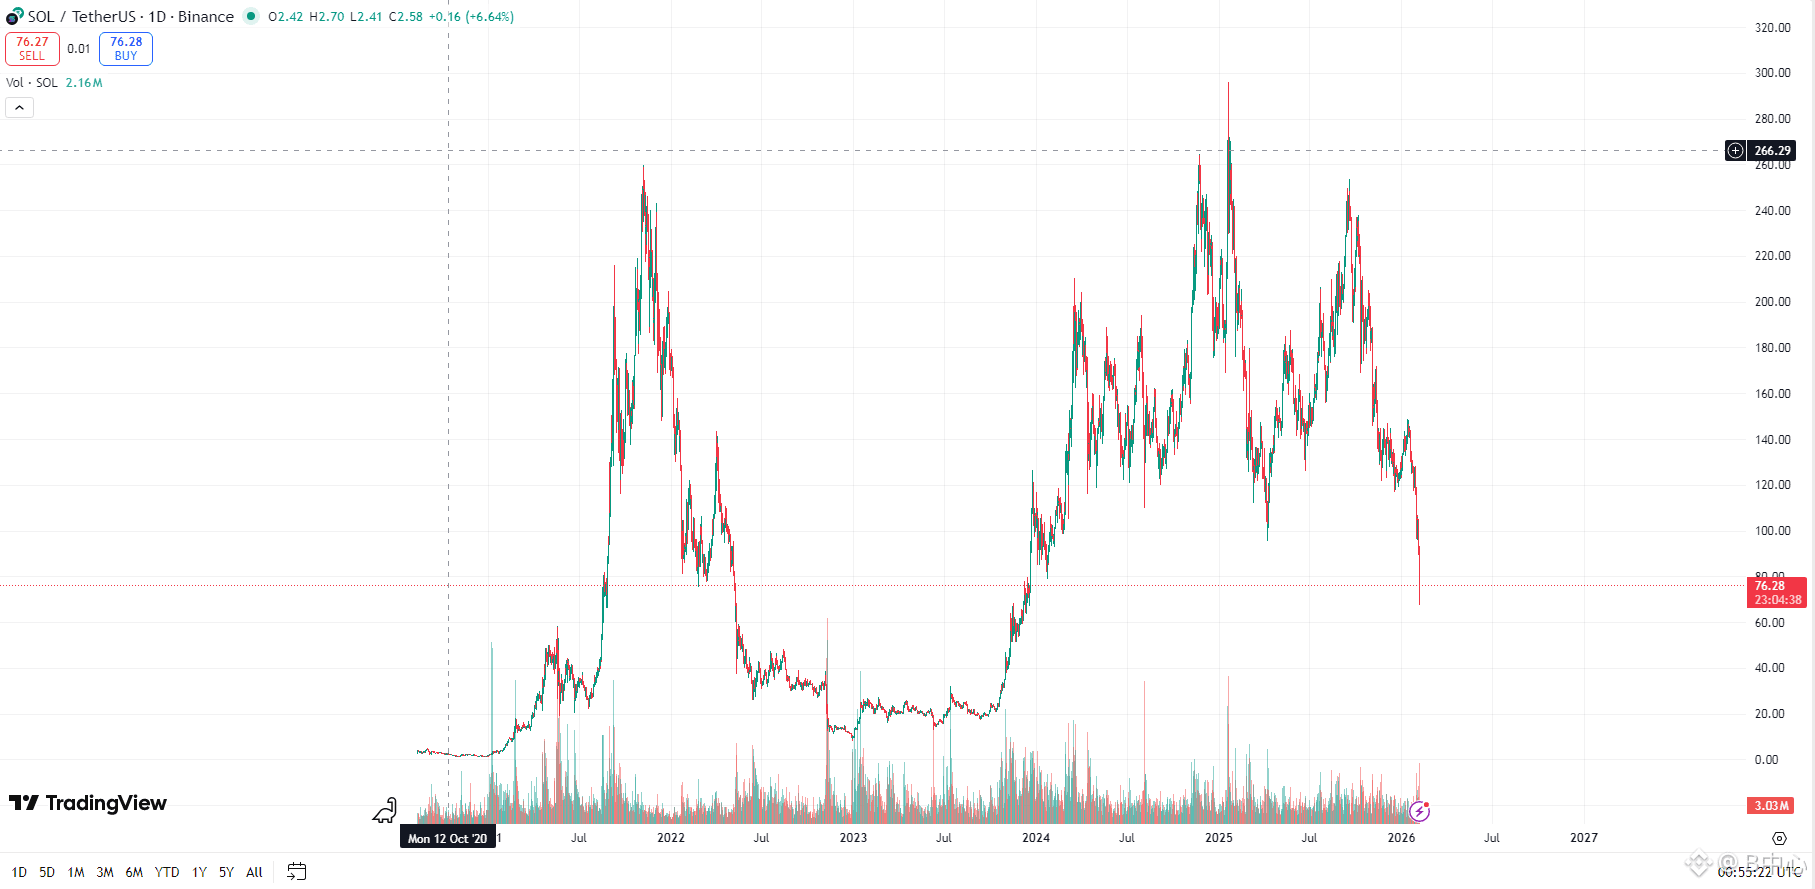
From a macro perspective, SOL has confirmed its entry into a deep retracement phase. The peak area in 2025 is between $260 and $300, and the current price has fallen back to around $80, essentially retracing more than 60% of the previous major upward wave, with the trend officially switching from 'high-level fluctuations' to the bottom-seeking phase of a downtrend.
Structurally:
Daily highs continue to decline, with lows being consistently breached, indicating a systematic failure of the bullish defense line.
The most recent long bearish candle with high volume broke through previous horizontal support (around $100–110), which is a signal of trend acceleration.
Key positions:
First support: $70–75 (current range, short-term speculation level)
Strong support zone: $55–60 (previous bull market starting zone + dense trading area)
Extreme defense: $40–45 (2023 platform area, bull-bear boundary)
Resistance level:
$90–95 (resistance after the breakdown)
$120 (medium-term resistance that cannot be surpassed before trend reversal)
Operational thoughts (considering your 40% position, average price 165):
It is not recommended to blindly add positions around $80.
If it bounces back to $90–100, consider reducing pressure or hedging.
The area truly worth adding positions for the medium to long term is around $60±5.
After breaking below $55, prepare psychologically and financially for the $40 range.
In summary:
SOL is currently still in the bottom-seeking phase of a downtrend. $80 is not a safe bottom; below $60 is the real value speculation zone in the medium term.
From a macro perspective, SOL has confirmed its entry into a deep retracement phase. The peak area in 2025 is between $260 and $300, and the current price has fallen back to around $80, essentially retracing more than 60% of the previous major upward wave, with the trend officially switching from 'high-level fluctuations' to the bottom-seeking phase of a downtrend.
Structurally:
Daily highs continue to decline, with lows being consistently breached, indicating a systematic failure of the bullish defense line.
The most recent long bearish candle with high volume broke through previous horizontal support (around $100–110), which is a signal of trend acceleration.
Key positions:
First support: $70–75 (current range, short-term speculation level)
Strong support zone: $55–60 (previous bull market starting zone + dense trading area)
Extreme defense: $40–45 (2023 platform area, bull-bear boundary)
Resistance level:
$90–95 (resistance after the breakdown)
$120 (medium-term resistance that cannot be surpassed before trend reversal)
Operational thoughts (considering your 40% position, average price 165):
It is not recommended to blindly add positions around $80.
If it bounces back to $90–100, consider reducing pressure or hedging.
The area truly worth adding positions for the medium to long term is around $60±5.
After breaking below $55, prepare psychologically and financially for the $40 range.
In summary:
SOL is currently still in the bottom-seeking phase of a downtrend. $80 is not a safe bottom; below $60 is the real value speculation zone in the medium term.
Structurally:
Daily highs continue to decline, with lows being consistently breached, indicating a systematic failure of the bullish defense line.
The most recent long bearish candle with high volume broke through previous horizontal support (around $100–110), which is a signal of trend acceleration.
Key positions:
First support: $70–75 (current range, short-term speculation level)
Strong support zone: $55–60 (previous bull market starting zone + dense trading area)
Extreme defense: $40–45 (2023 platform area, bull-bear boundary)
Resistance level:
$90–95 (resistance after the breakdown)
$120 (medium-term resistance that cannot be surpassed before trend reversal)
Operational thoughts (considering your 40% position, average price 165):
It is not recommended to blindly add positions around $80.
If it bounces back to $90–100, consider reducing pressure or hedging.
The area truly worth adding positions for the medium to long term is around $60±5.
After breaking below $55, prepare psychologically and financially for the $40 range.
In summary:
SOL is currently still in the bottom-seeking phase of a downtrend. $80 is not a safe bottom; below $60 is the real value speculation zone in the medium term.
516
·
--
Ethereum (ETHUSD|Daily) Technical Analysis|2026.02.06
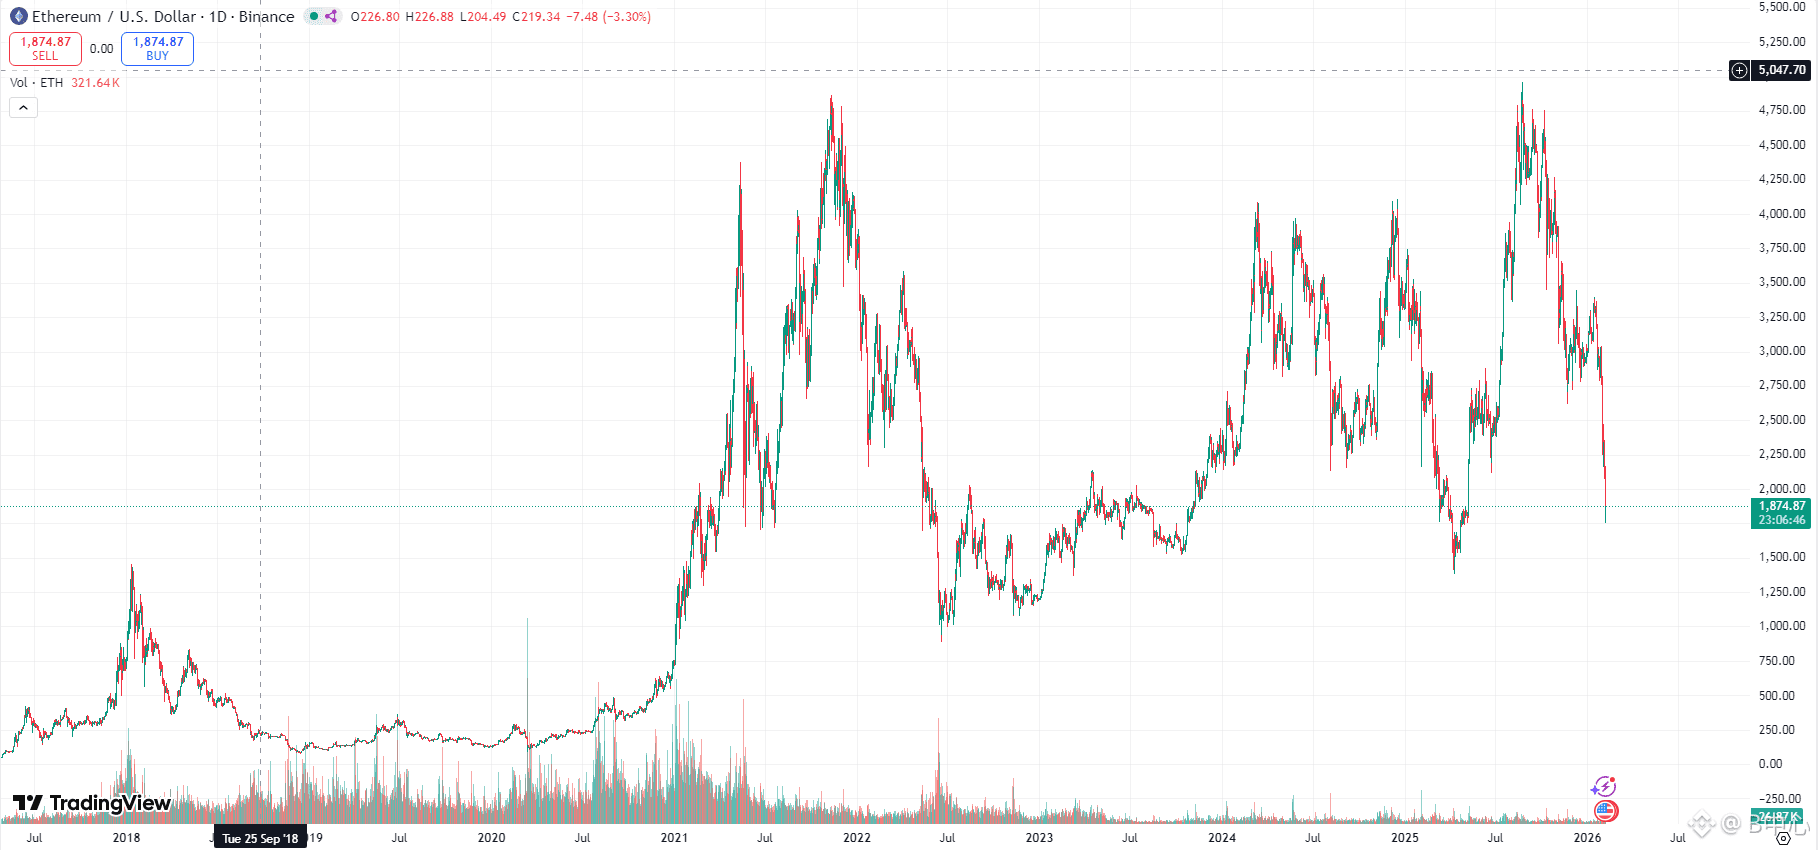
From the daily structure, ETH's current trend is weaker than BTC, with clear signals of a deteriorating trend. The price has currently retraced to around $1,870, which is a very critical position as it corresponds to the central region of oscillation that has repeatedly occurred over the past year, and is also the 'cost zone' for long-term bulls and bears.
First, looking at the structure:
After ETH peaked above $5,000 in 2025, it formed a typical head-and-shoulders pattern, with subsequent highs continuously declining (5000 → 4200 → 3500), and lows also moving downwards in sync, indicating that the daily line has entered a descending channel. Recently, this wave of decline has broken below the $2,000 integer level with increased volume, and the close did not quickly recover, indicating that it is not a simple washout, but rather that capital is actively retreating.
Key technical level assessment:
$2,000: Has turned from support to the first resistance level, with a high probability of encountering obstacles when rebounding to this level.
$1,850–$1,800: Current short-term support area, determining whether to enter an accelerated decline.
$1,500: Once $1,800 is breached, this is the core target for mid-term retracement.
$2,400–$2,600: Only if it stands back and consolidates, the trend could possibly repair.
In terms of rhythm, ETH's decline lags behind BTC, but the catch-up is more severe, which usually occurs when:
The market enters a mid to late-stage adjustment period, where capital prioritizes retreating from assets with higher β.
From an operational perspective, it is not suitable to emotionally bottom-fish here; a more reasonable strategy is:
Wait to see if there is 'stop decline + reduced volume + structural reconstruction' near $1,800; otherwise, it is better to remain in cash and wait.
In summary:
ETH has turned bearish after breaking below $2,000, with $1,800 being the lifeline for bulls. Before stabilizing, the focus should be on defense.
Ethereum (ETHUSD|Daily) Technical Analysis|2026.02.06
From the daily structure, ETH's current trend is weaker than BTC, with clear signals of a deteriorating trend. The price has currently retraced to around $1,870, which is a very critical position as it corresponds to the central region of oscillation that has repeatedly occurred over the past year, and is also the 'cost zone' for long-term bulls and bears.
First, looking at the structure:
After ETH peaked above $5,000 in 2025, it formed a typical head-and-shoulders pattern, with subsequent highs continuously declining (5000 → 4200 → 3500), and lows also moving downwards in sync, indicating that the daily line has entered a descending channel. Recently, this wave of decline has broken below the $2,000 integer level with increased volume, and the close did not quickly recover, indicating that it is not a simple washout, but rather that capital is actively retreating.
Key technical level assessment:
$2,000: Has turned from support to the first resistance level, with a high probability of encountering obstacles when rebounding to this level.
$1,850–$1,800: Current short-term support area, determining whether to enter an accelerated decline.
$1,500: Once $1,800 is breached, this is the core target for mid-term retracement.
$2,400–$2,600: Only if it stands back and consolidates, the trend could possibly repair.
In terms of rhythm, ETH's decline lags behind BTC, but the catch-up is more severe, which usually occurs when:
The market enters a mid to late-stage adjustment period, where capital prioritizes retreating from assets with higher β.
From an operational perspective, it is not suitable to emotionally bottom-fish here; a more reasonable strategy is:
Wait to see if there is 'stop decline + reduced volume + structural reconstruction' near $1,800; otherwise, it is better to remain in cash and wait.
In summary:
ETH has turned bearish after breaking below $2,000, with $1,800 being the lifeline for bulls. Before stabilizing, the focus should be on defense.
From the daily structure, ETH's current trend is weaker than BTC, with clear signals of a deteriorating trend. The price has currently retraced to around $1,870, which is a very critical position as it corresponds to the central region of oscillation that has repeatedly occurred over the past year, and is also the 'cost zone' for long-term bulls and bears.
First, looking at the structure:
After ETH peaked above $5,000 in 2025, it formed a typical head-and-shoulders pattern, with subsequent highs continuously declining (5000 → 4200 → 3500), and lows also moving downwards in sync, indicating that the daily line has entered a descending channel. Recently, this wave of decline has broken below the $2,000 integer level with increased volume, and the close did not quickly recover, indicating that it is not a simple washout, but rather that capital is actively retreating.
Key technical level assessment:
$2,000: Has turned from support to the first resistance level, with a high probability of encountering obstacles when rebounding to this level.
$1,850–$1,800: Current short-term support area, determining whether to enter an accelerated decline.
$1,500: Once $1,800 is breached, this is the core target for mid-term retracement.
$2,400–$2,600: Only if it stands back and consolidates, the trend could possibly repair.
In terms of rhythm, ETH's decline lags behind BTC, but the catch-up is more severe, which usually occurs when:
The market enters a mid to late-stage adjustment period, where capital prioritizes retreating from assets with higher β.
From an operational perspective, it is not suitable to emotionally bottom-fish here; a more reasonable strategy is:
Wait to see if there is 'stop decline + reduced volume + structural reconstruction' near $1,800; otherwise, it is better to remain in cash and wait.
In summary:
ETH has turned bearish after breaking below $2,000, with $1,800 being the lifeline for bulls. Before stabilizing, the focus should be on defense.
743
·
--
Bitcoin (BTCUSD | Daily) Technical Analysis | 2026.02.06
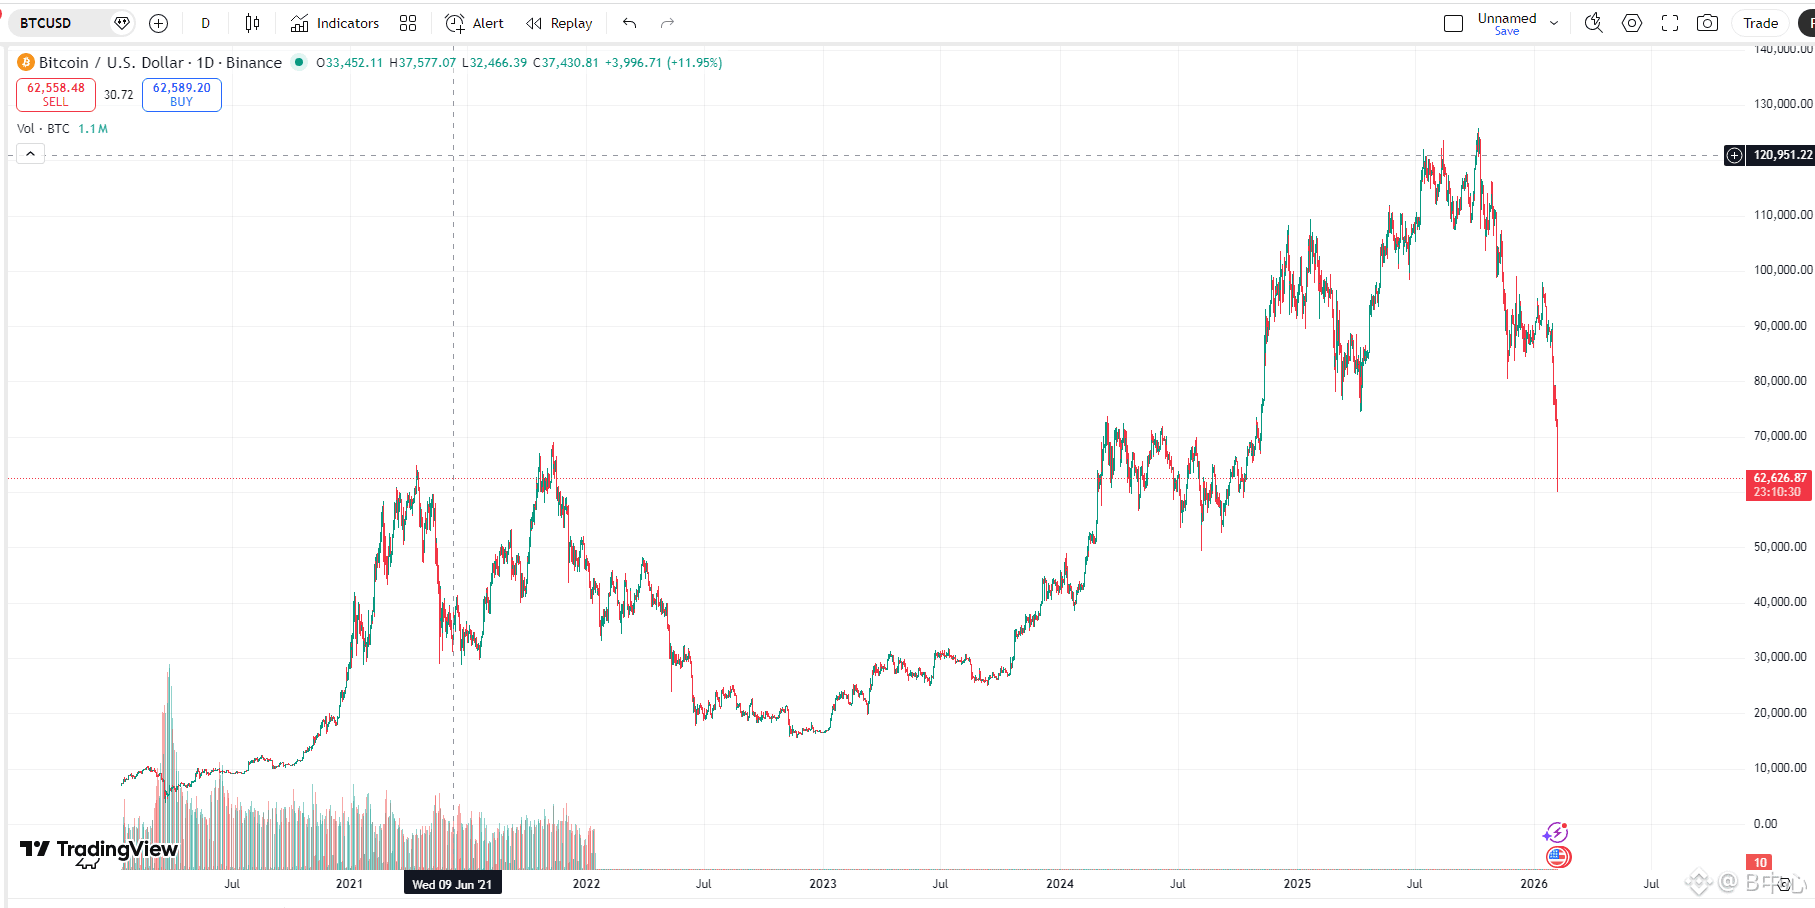
From this updated daily chart, BTC has shown a very critical signal change: the price has effectively broken below the support level of $65,000, dipping to around $62,600. This step means that the medium-term adjustment has upgraded from a 'high-level pullback' to a 'trend breakdown'.
Structurally, $65,000 was originally:
An important sideways area before the main upward wave starting in 2024
Also a 'continuation platform' in the previous round of increase
Now it has been directly pierced by a larger solid daily bearish candle, and the close could not pull back, which technically constitutes an effective break, not a false breakdown.
From a rhythm perspective, this is not an emotional one-shot kill, but rather more like:
High-level distribution completed → Trend turns bearish → The first phase of the main downward wave unfolds.
Next, even if a rebound occurs, it is more likely to be a technical pullback, rather than a new round of main upward movement.
Key points summary:
$65,000: has turned into the first resistance level, a rebound here is likely to face resistance again
$60,000: psychological barrier + previous structural support, a must-contend point between bulls and bears in the short term
$55,000–$52,000: once $60k is lost, medium-term pullback target range
Above $80,000: only by regaining and consolidating can we talk about trend restoration
In terms of operational thinking, it is more suitable to reduce positions and control risks, rather than aggressively trying to catch the bottom on the left side. What is truly worth paying attention to is whether $60,000 can hold and form a new daily structure.
In summary:
$65,000 has been broken, BTC enters the medium-term downward phase, $60,000 is the last defense line for bulls, and it is not advisable to act aggressively before it is reclaimed.
Bitcoin (BTCUSD | Daily) Technical Analysis | 2026.02.06
From this updated daily chart, BTC has shown a very critical signal change: the price has effectively broken below the support level of $65,000, dipping to around $62,600. This step means that the medium-term adjustment has upgraded from a 'high-level pullback' to a 'trend breakdown'.
Structurally, $65,000 was originally:
An important sideways area before the main upward wave starting in 2024
Also a 'continuation platform' in the previous round of increase
Now it has been directly pierced by a larger solid daily bearish candle, and the close could not pull back, which technically constitutes an effective break, not a false breakdown.
From a rhythm perspective, this is not an emotional one-shot kill, but rather more like:
High-level distribution completed → Trend turns bearish → The first phase of the main downward wave unfolds.
Next, even if a rebound occurs, it is more likely to be a technical pullback, rather than a new round of main upward movement.
Key points summary:
$65,000: has turned into the first resistance level, a rebound here is likely to face resistance again
$60,000: psychological barrier + previous structural support, a must-contend point between bulls and bears in the short term
$55,000–$52,000: once $60k is lost, medium-term pullback target range
Above $80,000: only by regaining and consolidating can we talk about trend restoration
In terms of operational thinking, it is more suitable to reduce positions and control risks, rather than aggressively trying to catch the bottom on the left side. What is truly worth paying attention to is whether $60,000 can hold and form a new daily structure.
In summary:
$65,000 has been broken, BTC enters the medium-term downward phase, $60,000 is the last defense line for bulls, and it is not advisable to act aggressively before it is reclaimed.
From this updated daily chart, BTC has shown a very critical signal change: the price has effectively broken below the support level of $65,000, dipping to around $62,600. This step means that the medium-term adjustment has upgraded from a 'high-level pullback' to a 'trend breakdown'.
Structurally, $65,000 was originally:
An important sideways area before the main upward wave starting in 2024
Also a 'continuation platform' in the previous round of increase
Now it has been directly pierced by a larger solid daily bearish candle, and the close could not pull back, which technically constitutes an effective break, not a false breakdown.
From a rhythm perspective, this is not an emotional one-shot kill, but rather more like:
High-level distribution completed → Trend turns bearish → The first phase of the main downward wave unfolds.
Next, even if a rebound occurs, it is more likely to be a technical pullback, rather than a new round of main upward movement.
Key points summary:
$65,000: has turned into the first resistance level, a rebound here is likely to face resistance again
$60,000: psychological barrier + previous structural support, a must-contend point between bulls and bears in the short term
$55,000–$52,000: once $60k is lost, medium-term pullback target range
Above $80,000: only by regaining and consolidating can we talk about trend restoration
In terms of operational thinking, it is more suitable to reduce positions and control risks, rather than aggressively trying to catch the bottom on the left side. What is truly worth paying attention to is whether $60,000 can hold and form a new daily structure.
In summary:
$65,000 has been broken, BTC enters the medium-term downward phase, $60,000 is the last defense line for bulls, and it is not advisable to act aggressively before it is reclaimed.
1
159
·
--
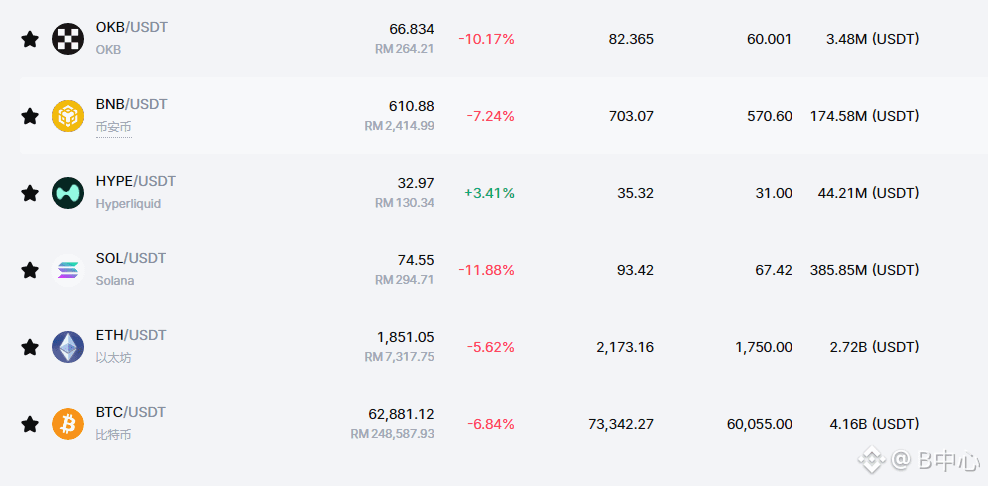
2026.02.06 Simple Record
$btc 62800 $ETH 1851 $SOL
{spot}(SOLUSDT)
2026.02.06 Simple Record
$btc 62800 $ETH 1851 $SOL
$btc 62800 $ETH 1851 $SOL
400
·
--
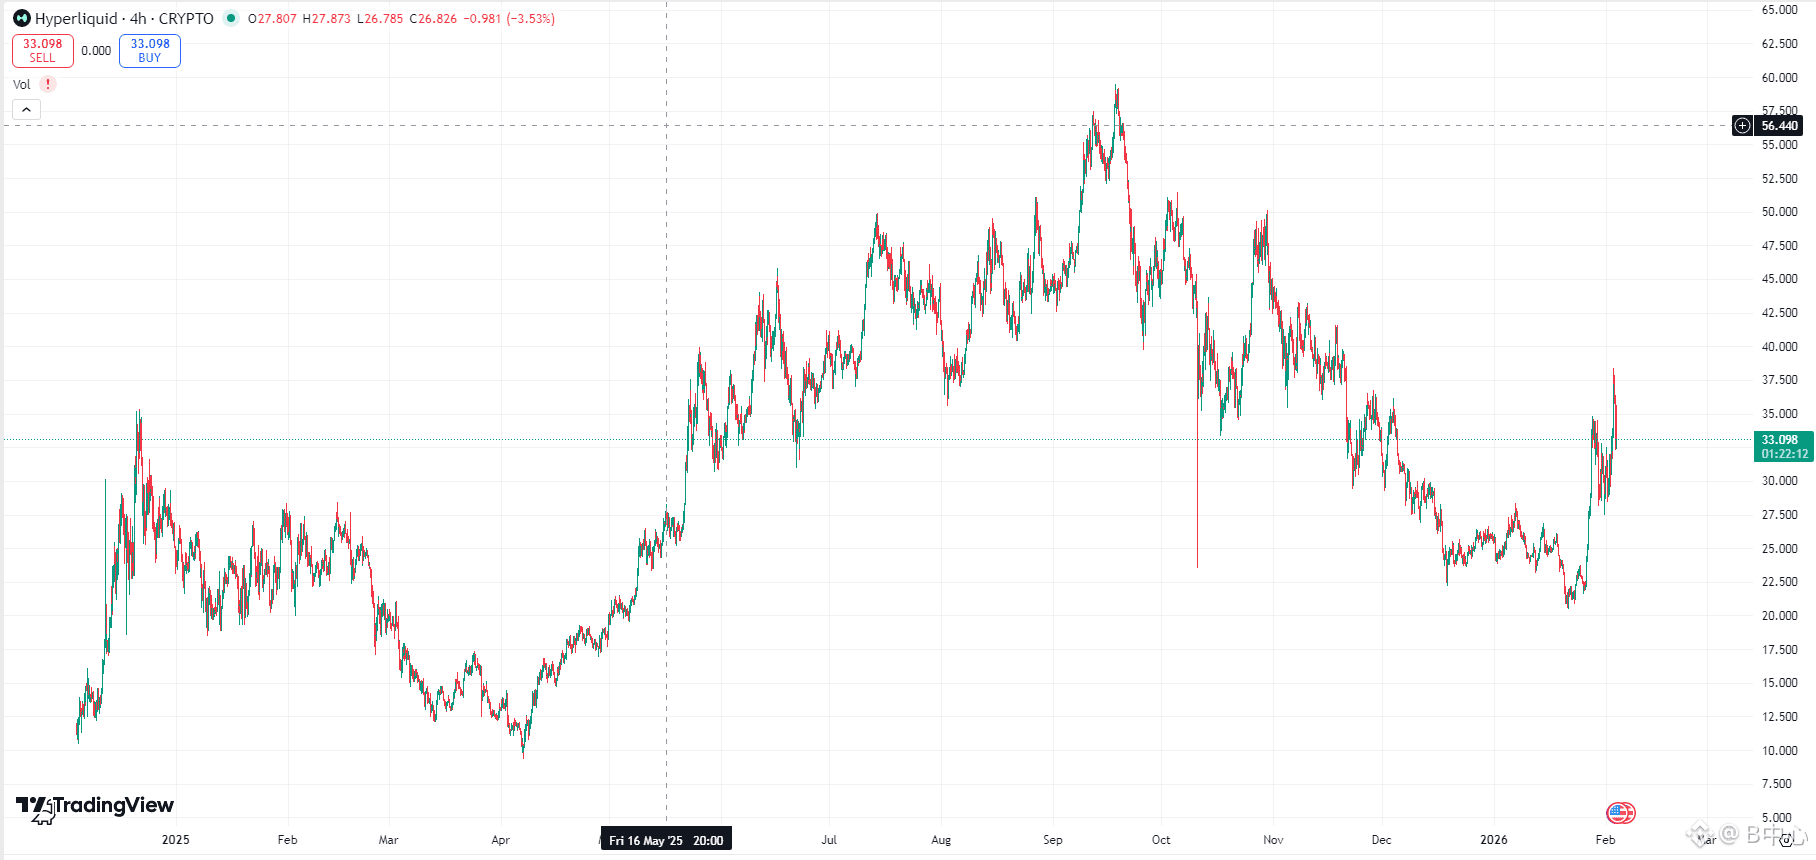
HYPE (Hyperliquid | 4H Level) Technical Analysis | 2026.02.04
From the 4-hour structure perspective, this round of HYPE belongs to a typical high-level trend reversal followed by a pullback. An obvious phase top was formed in the 56–58 USD range, followed by a continuous lower high + lower low downward structure, indicating a trend shift from bullish to bearish. The current price has rebounded to around 33 USD, which coincides with the overlapping resistance area of the previous consolidation platform and the midline of the downward channel, making the position unsafe.
Upon detailed examination of the structure, this 4H level rebound looks more like a technical pullback driven by short covering, rather than a trend reversal:
The rebound slope is relatively steep, but the trading volume has not significantly increased
The high has yet to break through the previous rebound high
The moving average system still shows a bearish arrangement (price is below the medium to long-term moving averages)
At key positions, 33–35 USD is a short-term bull-bear dividing line:
If it repeatedly faces resistance in this area, with a significant long upper shadow or consecutive bearish candles, the market is likely to weaken again.
The primary support below is at 30 USD; if it breaks down, it can easily retest the previous low area of 27 / 25 USD.
Only if it effectively holds above 36 USD and consolidates can there be a possibility of a structure change to "reversal rather than pullback."
Overall rhythm judgment: HYPE is still in the rebound phase within a medium-term downward trend, which is more suitable for a defensive mindset rather than chasing high-risk trades.
Key points:
Resistance levels: 35 / 38
Support levels: 30 / 27
In summary: HYPE is currently in a pullback after a decline; if it does not break 33–35, it remains bearish, and caution is needed if it falls back below 30 for a potential second bottom test.
HYPE (Hyperliquid | 4H Level) Technical Analysis | 2026.02.04
From the 4-hour structure perspective, this round of HYPE belongs to a typical high-level trend reversal followed by a pullback. An obvious phase top was formed in the 56–58 USD range, followed by a continuous lower high + lower low downward structure, indicating a trend shift from bullish to bearish. The current price has rebounded to around 33 USD, which coincides with the overlapping resistance area of the previous consolidation platform and the midline of the downward channel, making the position unsafe.
Upon detailed examination of the structure, this 4H level rebound looks more like a technical pullback driven by short covering, rather than a trend reversal:
The rebound slope is relatively steep, but the trading volume has not significantly increased
The high has yet to break through the previous rebound high
The moving average system still shows a bearish arrangement (price is below the medium to long-term moving averages)
At key positions, 33–35 USD is a short-term bull-bear dividing line:
If it repeatedly faces resistance in this area, with a significant long upper shadow or consecutive bearish candles, the market is likely to weaken again.
The primary support below is at 30 USD; if it breaks down, it can easily retest the previous low area of 27 / 25 USD.
Only if it effectively holds above 36 USD and consolidates can there be a possibility of a structure change to "reversal rather than pullback."
Overall rhythm judgment: HYPE is still in the rebound phase within a medium-term downward trend, which is more suitable for a defensive mindset rather than chasing high-risk trades.
Key points:
Resistance levels: 35 / 38
Support levels: 30 / 27
In summary: HYPE is currently in a pullback after a decline; if it does not break 33–35, it remains bearish, and caution is needed if it falls back below 30 for a potential second bottom test.
From the 4-hour structure perspective, this round of HYPE belongs to a typical high-level trend reversal followed by a pullback. An obvious phase top was formed in the 56–58 USD range, followed by a continuous lower high + lower low downward structure, indicating a trend shift from bullish to bearish. The current price has rebounded to around 33 USD, which coincides with the overlapping resistance area of the previous consolidation platform and the midline of the downward channel, making the position unsafe.
Upon detailed examination of the structure, this 4H level rebound looks more like a technical pullback driven by short covering, rather than a trend reversal:
The rebound slope is relatively steep, but the trading volume has not significantly increased
The high has yet to break through the previous rebound high
The moving average system still shows a bearish arrangement (price is below the medium to long-term moving averages)
At key positions, 33–35 USD is a short-term bull-bear dividing line:
If it repeatedly faces resistance in this area, with a significant long upper shadow or consecutive bearish candles, the market is likely to weaken again.
The primary support below is at 30 USD; if it breaks down, it can easily retest the previous low area of 27 / 25 USD.
Only if it effectively holds above 36 USD and consolidates can there be a possibility of a structure change to "reversal rather than pullback."
Overall rhythm judgment: HYPE is still in the rebound phase within a medium-term downward trend, which is more suitable for a defensive mindset rather than chasing high-risk trades.
Key points:
Resistance levels: 35 / 38
Support levels: 30 / 27
In summary: HYPE is currently in a pullback after a decline; if it does not break 33–35, it remains bearish, and caution is needed if it falls back below 30 for a potential second bottom test.
116
·
--
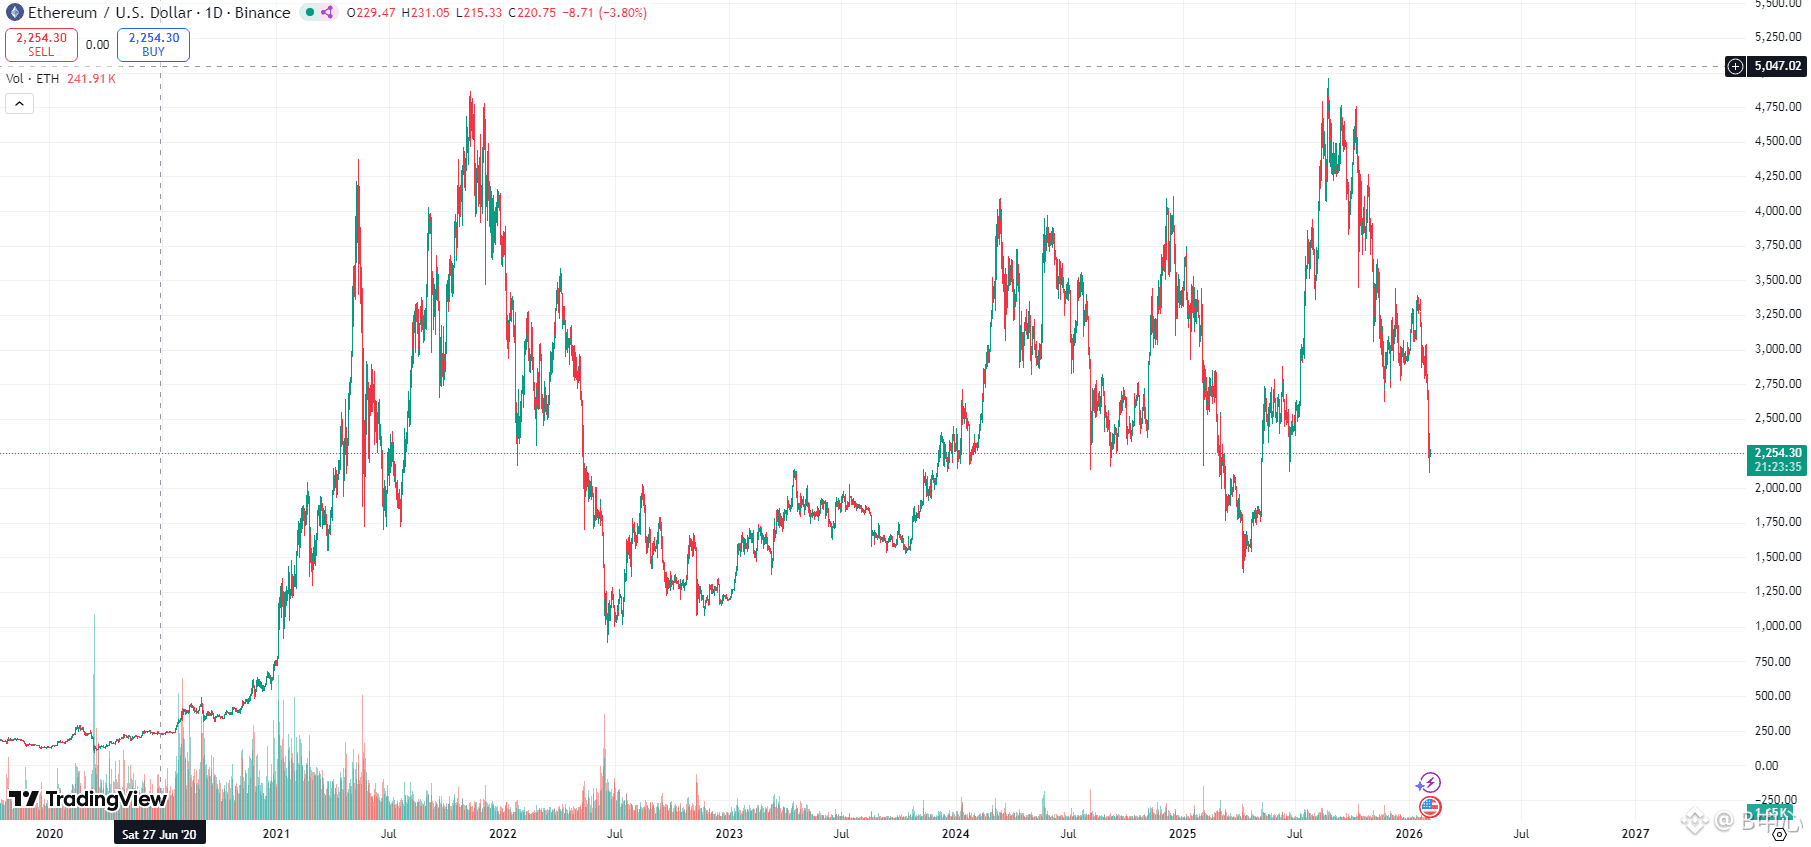
Ethereum (ETHUSDT | Daily Level) Technical Analysis | 2026.02.04
From the daily structure, ETH's current trend is significantly weaker than Bitcoin, which is a typical characteristic of a secondary asset with 'insufficient rebound and deeper retracement.' The previous high formed a clear top in the 4,800–5,000 USD range, and the subsequent decline has seen the height of rebounds gradually decrease. The current price has retreated to around 2,250 USD, sitting at the middle-lower edge of the medium-term downward channel.
From a key structural perspective, 2,400–2,500 USD was originally an important platform support but has been effectively broken, now converting to the first resistance zone. Operating below this range indicates that the market's risk appetite for ETH is clearly insufficient, and funds are primarily focused on reducing positions rather than bottom-fishing. The short-term support below is at 2,200 USD; if the daily line continues to break down with increased volume, it is likely to probe 1,900–2,000 USD, which is the central point of the previous round of fluctuations and also the last line of defense for the medium-term bulls.
In terms of rhythm, ETH is currently still in a phase of trend-based decline, without typical panic volume spikes or rapid recovery candlesticks, indicating that the decline is not yet fully over. It is more likely to complete the bottoming process through 'gradual decline + weak rebound.' Only by stabilizing above 2,600 USD and forming a series of increasing bullish candlesticks will there be a possibility of structural strengthening.
Key Levels:
Support Levels: 2,200 / 2,000
Resistance Levels: 2,500 / 2,600
Summary: Ethereum's medium-term structure is weak. If 2,200 is lost, it will continue to fall towards 2,000. No trend reversal is expected before returning to 2,600.
Ethereum (ETHUSDT | Daily Level) Technical Analysis | 2026.02.04
From the daily structure, ETH's current trend is significantly weaker than Bitcoin, which is a typical characteristic of a secondary asset with 'insufficient rebound and deeper retracement.' The previous high formed a clear top in the 4,800–5,000 USD range, and the subsequent decline has seen the height of rebounds gradually decrease. The current price has retreated to around 2,250 USD, sitting at the middle-lower edge of the medium-term downward channel.
From a key structural perspective, 2,400–2,500 USD was originally an important platform support but has been effectively broken, now converting to the first resistance zone. Operating below this range indicates that the market's risk appetite for ETH is clearly insufficient, and funds are primarily focused on reducing positions rather than bottom-fishing. The short-term support below is at 2,200 USD; if the daily line continues to break down with increased volume, it is likely to probe 1,900–2,000 USD, which is the central point of the previous round of fluctuations and also the last line of defense for the medium-term bulls.
In terms of rhythm, ETH is currently still in a phase of trend-based decline, without typical panic volume spikes or rapid recovery candlesticks, indicating that the decline is not yet fully over. It is more likely to complete the bottoming process through 'gradual decline + weak rebound.' Only by stabilizing above 2,600 USD and forming a series of increasing bullish candlesticks will there be a possibility of structural strengthening.
Key Levels:
Support Levels: 2,200 / 2,000
Resistance Levels: 2,500 / 2,600
Summary: Ethereum's medium-term structure is weak. If 2,200 is lost, it will continue to fall towards 2,000. No trend reversal is expected before returning to 2,600.
From the daily structure, ETH's current trend is significantly weaker than Bitcoin, which is a typical characteristic of a secondary asset with 'insufficient rebound and deeper retracement.' The previous high formed a clear top in the 4,800–5,000 USD range, and the subsequent decline has seen the height of rebounds gradually decrease. The current price has retreated to around 2,250 USD, sitting at the middle-lower edge of the medium-term downward channel.
From a key structural perspective, 2,400–2,500 USD was originally an important platform support but has been effectively broken, now converting to the first resistance zone. Operating below this range indicates that the market's risk appetite for ETH is clearly insufficient, and funds are primarily focused on reducing positions rather than bottom-fishing. The short-term support below is at 2,200 USD; if the daily line continues to break down with increased volume, it is likely to probe 1,900–2,000 USD, which is the central point of the previous round of fluctuations and also the last line of defense for the medium-term bulls.
In terms of rhythm, ETH is currently still in a phase of trend-based decline, without typical panic volume spikes or rapid recovery candlesticks, indicating that the decline is not yet fully over. It is more likely to complete the bottoming process through 'gradual decline + weak rebound.' Only by stabilizing above 2,600 USD and forming a series of increasing bullish candlesticks will there be a possibility of structural strengthening.
Key Levels:
Support Levels: 2,200 / 2,000
Resistance Levels: 2,500 / 2,600
Summary: Ethereum's medium-term structure is weak. If 2,200 is lost, it will continue to fall towards 2,000. No trend reversal is expected before returning to 2,600.
245
·
--
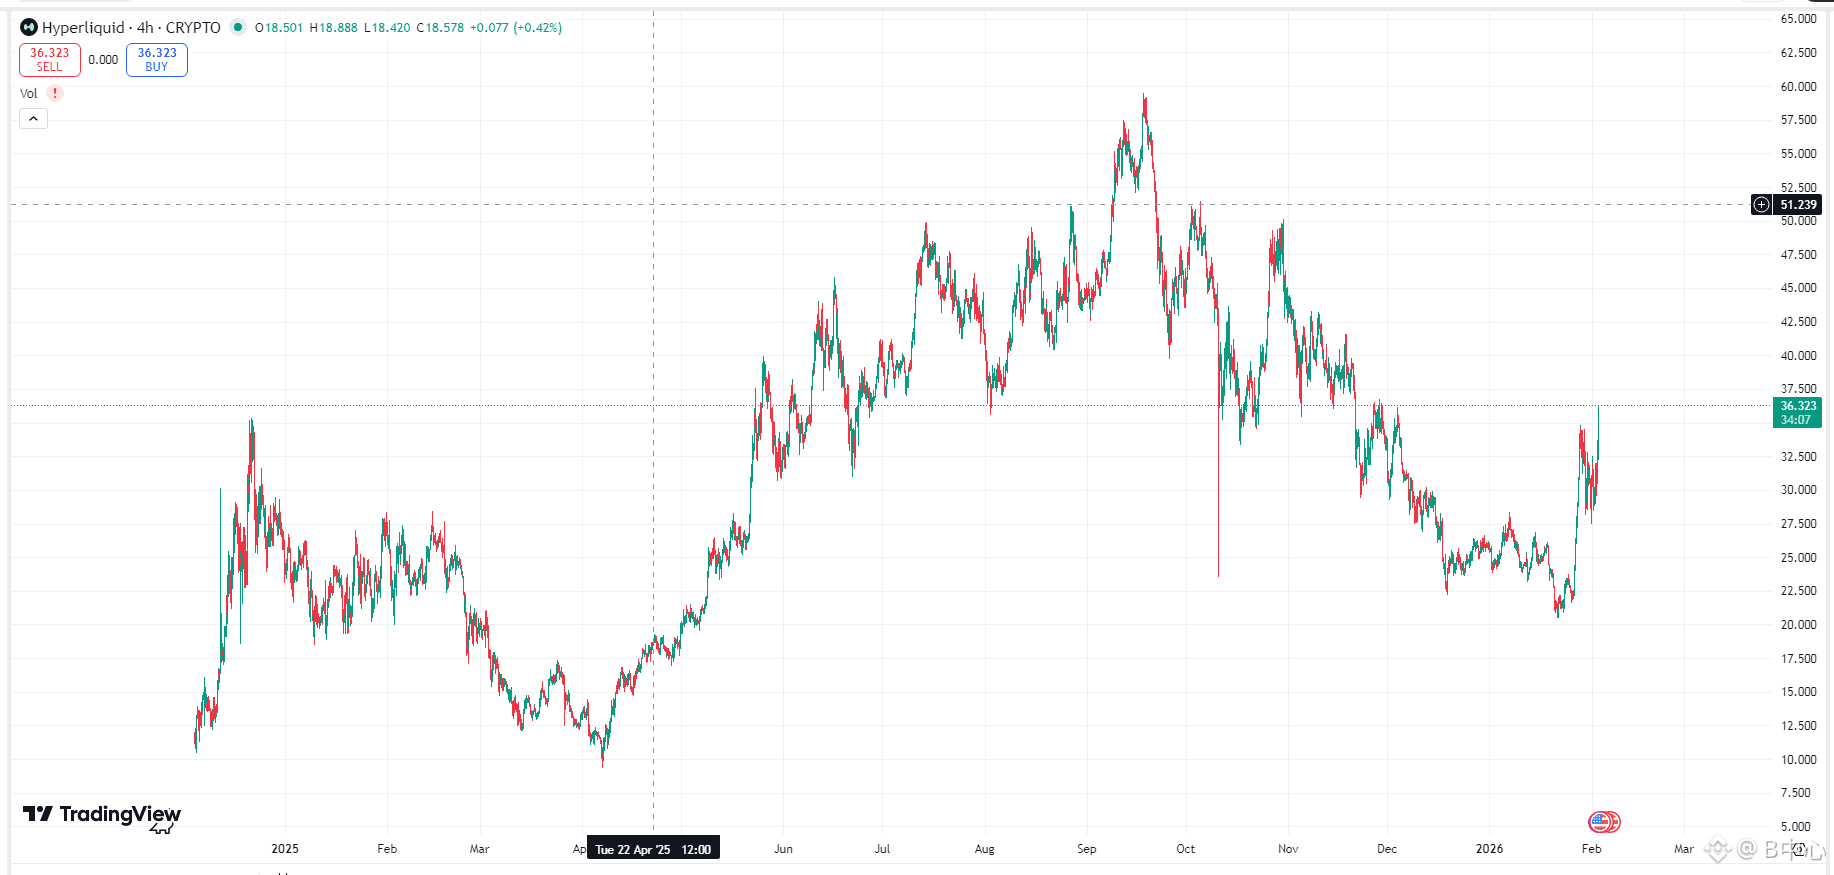
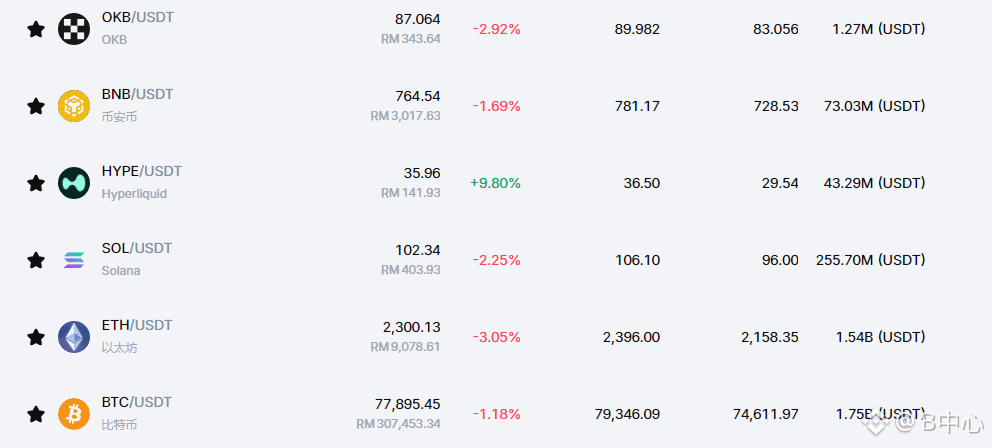
HYPE (Hyperliquid | 4-Hour Level) Technical Analysis | 2026.02.03
From the 4H structure, HYPE peaked around 60 USD and has overall entered a high-level pullback → medium-term downtrend. The core characteristics of the current trend are: high points continuously decreasing, rebound heights progressively lowering, a typical descending channel structure. Recently, a rapid rebound occurred around 22–24 USD, indicating that there is temporary capital support below, but this is more of a technical rebound rather than a trend reversal.
The current price has rebounded to around 36 USD, which is a very critical position:
On one hand, it corresponds to a strong resistance zone that has seen multiple consolidations and breakouts in the past; on the other hand, it is also a common rebound endpoint for short positions to cover during a downtrend. If the trading volume cannot continue to expand and the candlestick cannot effectively hold above 38–40 USD on the 4H level, then this rebound is likely to end with a "high pullback."
Looking downwards, 32–30 USD is the first short-term support; once breached, there is still a risk of retracing to 26–24 USD or even testing the previous low of 22 USD again; looking upwards, only a volume breakout and stabilization above 40 USD can reverse the structure and open up the space to test 46 / 52 USD.
Key levels:
Support levels: 32 / 30 / 24
Resistance levels: 38–40 / 46 / 52
Summary in one sentence: HYPE is currently still in the rebound phase of a downtrend, with 36–40 being the dividing line between bulls and bears; it is not advisable to have overly high expectations for a trend reversal before breaking through.
HYPE (Hyperliquid | 4-Hour Level) Technical Analysis | 2026.02.03
From the 4H structure, HYPE peaked around 60 USD and has overall entered a high-level pullback → medium-term downtrend. The core characteristics of the current trend are: high points continuously decreasing, rebound heights progressively lowering, a typical descending channel structure. Recently, a rapid rebound occurred around 22–24 USD, indicating that there is temporary capital support below, but this is more of a technical rebound rather than a trend reversal.
The current price has rebounded to around 36 USD, which is a very critical position:
On one hand, it corresponds to a strong resistance zone that has seen multiple consolidations and breakouts in the past; on the other hand, it is also a common rebound endpoint for short positions to cover during a downtrend. If the trading volume cannot continue to expand and the candlestick cannot effectively hold above 38–40 USD on the 4H level, then this rebound is likely to end with a "high pullback."
Looking downwards, 32–30 USD is the first short-term support; once breached, there is still a risk of retracing to 26–24 USD or even testing the previous low of 22 USD again; looking upwards, only a volume breakout and stabilization above 40 USD can reverse the structure and open up the space to test 46 / 52 USD.
Key levels:
Support levels: 32 / 30 / 24
Resistance levels: 38–40 / 46 / 52
Summary in one sentence: HYPE is currently still in the rebound phase of a downtrend, with 36–40 being the dividing line between bulls and bears; it is not advisable to have overly high expectations for a trend reversal before breaking through.
From the 4H structure, HYPE peaked around 60 USD and has overall entered a high-level pullback → medium-term downtrend. The core characteristics of the current trend are: high points continuously decreasing, rebound heights progressively lowering, a typical descending channel structure. Recently, a rapid rebound occurred around 22–24 USD, indicating that there is temporary capital support below, but this is more of a technical rebound rather than a trend reversal.
The current price has rebounded to around 36 USD, which is a very critical position:
On one hand, it corresponds to a strong resistance zone that has seen multiple consolidations and breakouts in the past; on the other hand, it is also a common rebound endpoint for short positions to cover during a downtrend. If the trading volume cannot continue to expand and the candlestick cannot effectively hold above 38–40 USD on the 4H level, then this rebound is likely to end with a "high pullback."
Looking downwards, 32–30 USD is the first short-term support; once breached, there is still a risk of retracing to 26–24 USD or even testing the previous low of 22 USD again; looking upwards, only a volume breakout and stabilization above 40 USD can reverse the structure and open up the space to test 46 / 52 USD.
Key levels:
Support levels: 32 / 30 / 24
Resistance levels: 38–40 / 46 / 52
Summary in one sentence: HYPE is currently still in the rebound phase of a downtrend, with 36–40 being the dividing line between bulls and bears; it is not advisable to have overly high expectations for a trend reversal before breaking through.
205
·
--
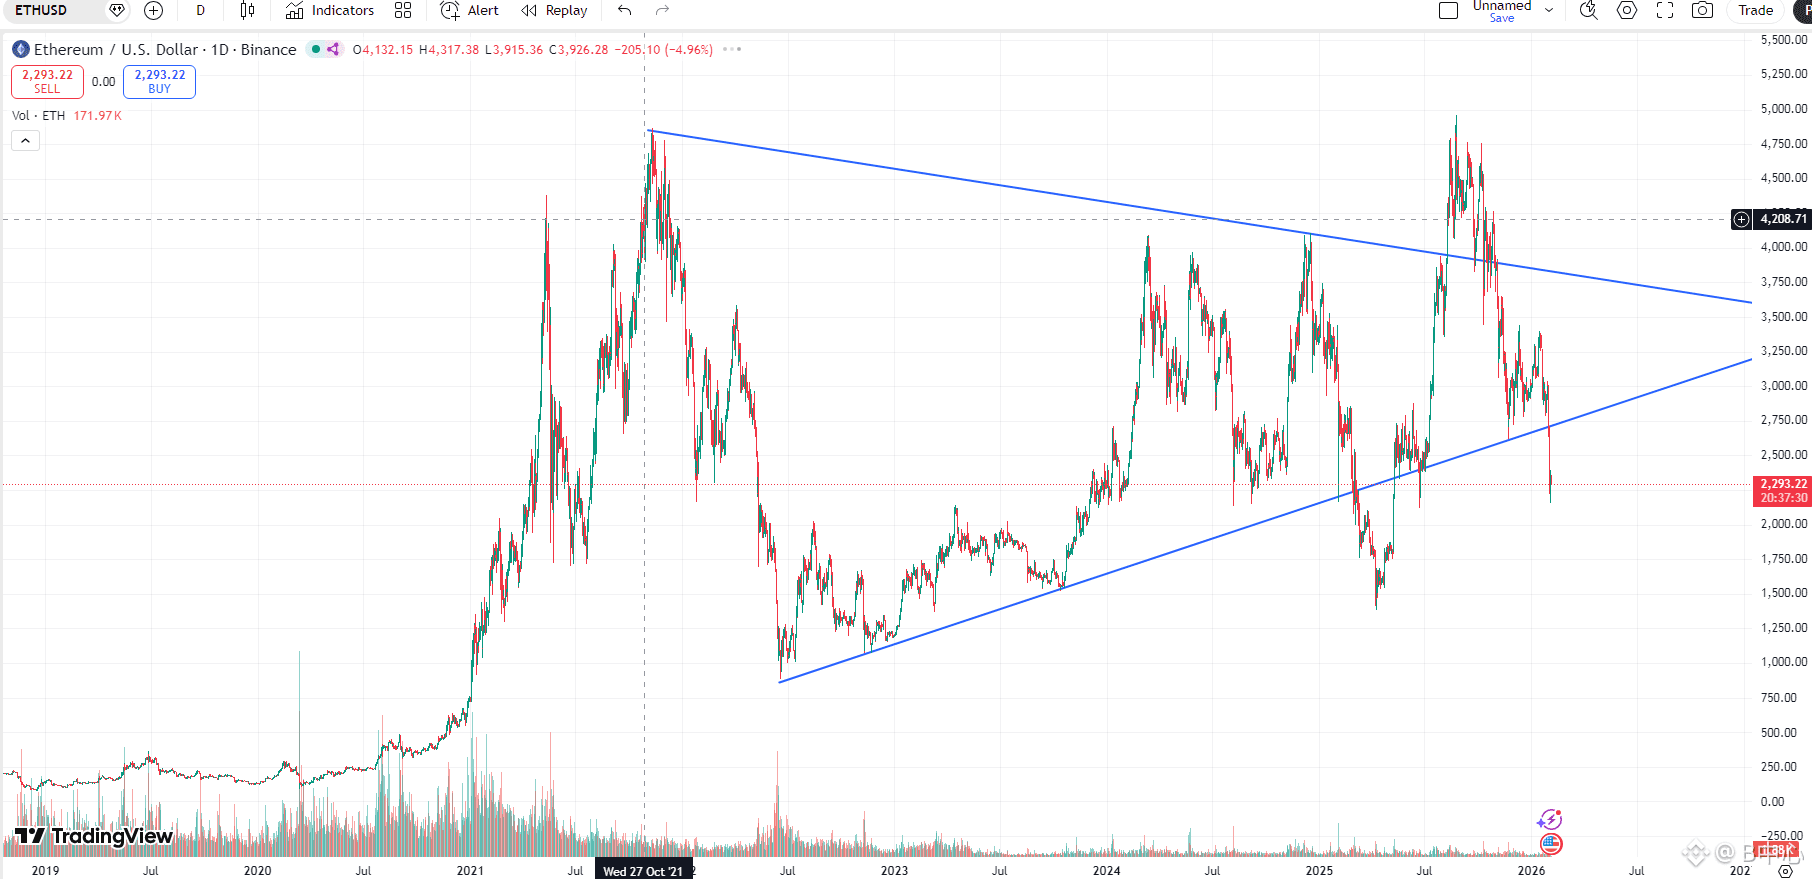
ETH (Daily Level) Technical Analysis | 2026.02.03
From the daily structure perspective, Ethereum has entered a high-level convergence—breakdown process after peaking around 4800 USD. The chart clearly shows a long-term ascending triangle/converging wedge structure. Currently, the price has broken down the lower trend line and quickly retreated to the 2300 USD level, indicating that the medium-term trend has shifted from strong to weak, and the structure has changed.
Currently, the 2300 USD corresponds to an important fluctuation center for 2023–2024, and it is also a densely traded area, providing technical support in the short term. However, it is necessary to be vigilant as the volume of this round of decline has expanded, and the rebounds are weak, indicating that this is not a simple washout, but more like a trend-level readjustment. If the price cannot quickly recover to the 2600–2700 USD range, ETH is likely to enter a longer period of fluctuating downward.
Looking downward, if 2300 USD is effectively broken, the next key support level is at the integer level of 2000 USD, and below that is 1750–1800 USD (previous low points multiple times). Looking upward, only by standing firmly above 3000 USD can it be confirmed as a false breakdown and return to the medium-term bullish structure.
Key Levels:
Support Levels: 2300 / 2000 / 1800
Resistance Levels: 2700 / 3000 / 3600
Summary in One Sentence: Ethereum has broken below the long-term convergence structure, with 2300 below being the line of life and death for bulls and bears; failing to hold will enter a medium-term adjustment cycle.
ETH (Daily Level) Technical Analysis | 2026.02.03
From the daily structure perspective, Ethereum has entered a high-level convergence—breakdown process after peaking around 4800 USD. The chart clearly shows a long-term ascending triangle/converging wedge structure. Currently, the price has broken down the lower trend line and quickly retreated to the 2300 USD level, indicating that the medium-term trend has shifted from strong to weak, and the structure has changed.
Currently, the 2300 USD corresponds to an important fluctuation center for 2023–2024, and it is also a densely traded area, providing technical support in the short term. However, it is necessary to be vigilant as the volume of this round of decline has expanded, and the rebounds are weak, indicating that this is not a simple washout, but more like a trend-level readjustment. If the price cannot quickly recover to the 2600–2700 USD range, ETH is likely to enter a longer period of fluctuating downward.
Looking downward, if 2300 USD is effectively broken, the next key support level is at the integer level of 2000 USD, and below that is 1750–1800 USD (previous low points multiple times). Looking upward, only by standing firmly above 3000 USD can it be confirmed as a false breakdown and return to the medium-term bullish structure.
Key Levels:
Support Levels: 2300 / 2000 / 1800
Resistance Levels: 2700 / 3000 / 3600
Summary in One Sentence: Ethereum has broken below the long-term convergence structure, with 2300 below being the line of life and death for bulls and bears; failing to hold will enter a medium-term adjustment cycle.
From the daily structure perspective, Ethereum has entered a high-level convergence—breakdown process after peaking around 4800 USD. The chart clearly shows a long-term ascending triangle/converging wedge structure. Currently, the price has broken down the lower trend line and quickly retreated to the 2300 USD level, indicating that the medium-term trend has shifted from strong to weak, and the structure has changed.
Currently, the 2300 USD corresponds to an important fluctuation center for 2023–2024, and it is also a densely traded area, providing technical support in the short term. However, it is necessary to be vigilant as the volume of this round of decline has expanded, and the rebounds are weak, indicating that this is not a simple washout, but more like a trend-level readjustment. If the price cannot quickly recover to the 2600–2700 USD range, ETH is likely to enter a longer period of fluctuating downward.
Looking downward, if 2300 USD is effectively broken, the next key support level is at the integer level of 2000 USD, and below that is 1750–1800 USD (previous low points multiple times). Looking upward, only by standing firmly above 3000 USD can it be confirmed as a false breakdown and return to the medium-term bullish structure.
Key Levels:
Support Levels: 2300 / 2000 / 1800
Resistance Levels: 2700 / 3000 / 3600
Summary in One Sentence: Ethereum has broken below the long-term convergence structure, with 2300 below being the line of life and death for bulls and bears; failing to hold will enter a medium-term adjustment cycle.
279
·
--
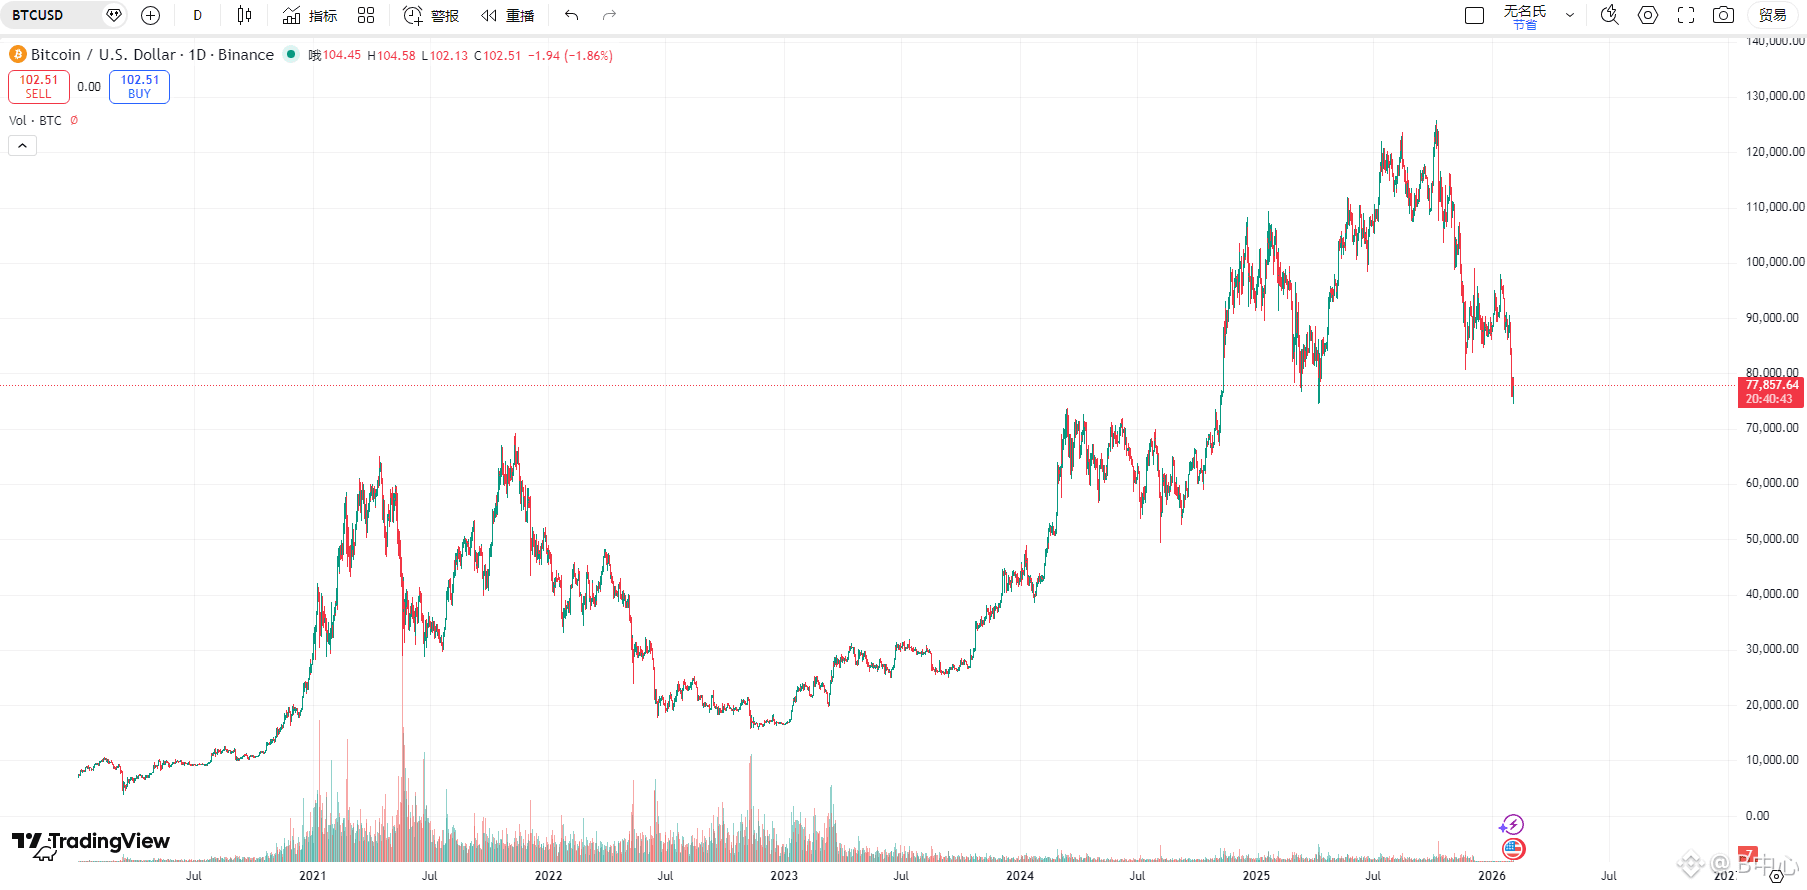
BTC (Daily Level) Technical Analysis | 2026.02.03
From the daily structure, Bitcoin has formed a phase top above $120,000, and the trend has switched from a one-sided rise to a high-level wide pullback structure. The current price has fallen to around $78,000, which is the launch area of the previous main upward wave and also an important mid-term bull-bear dividing line. The recent continuous pullback and weak rebounds indicate that high-level chips are loosening, and the market is undergoing a trend-level repricing.
Structurally, BTC has broken below the lower edge of the previous rising channel, and the short-term moving averages are turning downward, with the daily rhythm leaning bearish. However, it is important to note that the $75,000–$78,000 area corresponds to the major breakthrough platform in 2024, with dense historical trading. If it stops falling here and moves into a low-volume sideways range, there is still a chance to construct a mid-term consolidation platform, rather than directly entering a bear market.
If it effectively breaks below $75,000 subsequently, it will quickly point to the structural support area of $68,000 / $62,000; conversely, if it can regain above $85,000, the market will turn into a volatile repair, with further rebound targets looking at $95,000–$100,000.
Key Levels:
Support: $75,000 / $68,000
Resistance: $85,000 / $100,000
In summary: Bitcoin is currently in a critical support area after a high-level pullback. Holding above $75,000 indicates strong consolidation, while losing it will enter a mid-term adjustment.
BTC (Daily Level) Technical Analysis | 2026.02.03
From the daily structure, Bitcoin has formed a phase top above $120,000, and the trend has switched from a one-sided rise to a high-level wide pullback structure. The current price has fallen to around $78,000, which is the launch area of the previous main upward wave and also an important mid-term bull-bear dividing line. The recent continuous pullback and weak rebounds indicate that high-level chips are loosening, and the market is undergoing a trend-level repricing.
Structurally, BTC has broken below the lower edge of the previous rising channel, and the short-term moving averages are turning downward, with the daily rhythm leaning bearish. However, it is important to note that the $75,000–$78,000 area corresponds to the major breakthrough platform in 2024, with dense historical trading. If it stops falling here and moves into a low-volume sideways range, there is still a chance to construct a mid-term consolidation platform, rather than directly entering a bear market.
If it effectively breaks below $75,000 subsequently, it will quickly point to the structural support area of $68,000 / $62,000; conversely, if it can regain above $85,000, the market will turn into a volatile repair, with further rebound targets looking at $95,000–$100,000.
Key Levels:
Support: $75,000 / $68,000
Resistance: $85,000 / $100,000
In summary: Bitcoin is currently in a critical support area after a high-level pullback. Holding above $75,000 indicates strong consolidation, while losing it will enter a mid-term adjustment.
From the daily structure, Bitcoin has formed a phase top above $120,000, and the trend has switched from a one-sided rise to a high-level wide pullback structure. The current price has fallen to around $78,000, which is the launch area of the previous main upward wave and also an important mid-term bull-bear dividing line. The recent continuous pullback and weak rebounds indicate that high-level chips are loosening, and the market is undergoing a trend-level repricing.
Structurally, BTC has broken below the lower edge of the previous rising channel, and the short-term moving averages are turning downward, with the daily rhythm leaning bearish. However, it is important to note that the $75,000–$78,000 area corresponds to the major breakthrough platform in 2024, with dense historical trading. If it stops falling here and moves into a low-volume sideways range, there is still a chance to construct a mid-term consolidation platform, rather than directly entering a bear market.
If it effectively breaks below $75,000 subsequently, it will quickly point to the structural support area of $68,000 / $62,000; conversely, if it can regain above $85,000, the market will turn into a volatile repair, with further rebound targets looking at $95,000–$100,000.
Key Levels:
Support: $75,000 / $68,000
Resistance: $85,000 / $100,000
In summary: Bitcoin is currently in a critical support area after a high-level pullback. Holding above $75,000 indicates strong consolidation, while losing it will enter a mid-term adjustment.
141
·
--
The reasons for the significant drop in gold prices on January 30, 2026, mainly include the following points:
1. Profit-taking and technical correction
From 2025 to early 2026, gold prices increased by more than 70%, accumulating substantial profit. When prices reached high levels above $5500 per ounce, investors tended to lock in profits, leading to concentrated selling. Technical indicators such as RSI showed overbought conditions, indicating a demand for correction, further exacerbating the price decline.
2. Shift in Federal Reserve policy expectations
The Federal Reserve maintained interest rates in the January meeting and hinted at a decreased probability of rate cuts in the first half of the year, breaking the market's previous strong expectations for significant rate cuts. As a non-interest-bearing asset, gold's appeal weakened due to rising holding costs, causing funds to shift towards interest-bearing assets such as U.S. Treasury bonds and the dollar, suppressing gold prices.
3. Dollar index rebound
Influenced by expectations of a hawkish Federal Reserve policy, the dollar index rebounded, making gold priced in dollars more expensive for non-dollar investors, leading to decreased demand and subsequently pushing prices down.
4. Easing geopolitical tensions
U.S. President Trump reached an agreement with Senate Democrats to avoid a government shutdown, and the announcement of ceasefire arrangements related to the Russia-Ukraine conflict reduced market risk aversion, decreasing the demand for gold as a safe-haven asset.
These factors combined led to the significant drop in gold prices on January 30, 2026.
The reasons for the significant drop in gold prices on January 30, 2026, mainly include the following points:
1. Profit-taking and technical correction
From 2025 to early 2026, gold prices increased by more than 70%, accumulating substantial profit. When prices reached high levels above $5500 per ounce, investors tended to lock in profits, leading to concentrated selling. Technical indicators such as RSI showed overbought conditions, indicating a demand for correction, further exacerbating the price decline.
2. Shift in Federal Reserve policy expectations
The Federal Reserve maintained interest rates in the January meeting and hinted at a decreased probability of rate cuts in the first half of the year, breaking the market's previous strong expectations for significant rate cuts. As a non-interest-bearing asset, gold's appeal weakened due to rising holding costs, causing funds to shift towards interest-bearing assets such as U.S. Treasury bonds and the dollar, suppressing gold prices.
3. Dollar index rebound
Influenced by expectations of a hawkish Federal Reserve policy, the dollar index rebounded, making gold priced in dollars more expensive for non-dollar investors, leading to decreased demand and subsequently pushing prices down.
4. Easing geopolitical tensions
U.S. President Trump reached an agreement with Senate Democrats to avoid a government shutdown, and the announcement of ceasefire arrangements related to the Russia-Ukraine conflict reduced market risk aversion, decreasing the demand for gold as a safe-haven asset.
These factors combined led to the significant drop in gold prices on January 30, 2026.
1. Profit-taking and technical correction
From 2025 to early 2026, gold prices increased by more than 70%, accumulating substantial profit. When prices reached high levels above $5500 per ounce, investors tended to lock in profits, leading to concentrated selling. Technical indicators such as RSI showed overbought conditions, indicating a demand for correction, further exacerbating the price decline.
2. Shift in Federal Reserve policy expectations
The Federal Reserve maintained interest rates in the January meeting and hinted at a decreased probability of rate cuts in the first half of the year, breaking the market's previous strong expectations for significant rate cuts. As a non-interest-bearing asset, gold's appeal weakened due to rising holding costs, causing funds to shift towards interest-bearing assets such as U.S. Treasury bonds and the dollar, suppressing gold prices.
3. Dollar index rebound
Influenced by expectations of a hawkish Federal Reserve policy, the dollar index rebounded, making gold priced in dollars more expensive for non-dollar investors, leading to decreased demand and subsequently pushing prices down.
4. Easing geopolitical tensions
U.S. President Trump reached an agreement with Senate Democrats to avoid a government shutdown, and the announcement of ceasefire arrangements related to the Russia-Ukraine conflict reduced market risk aversion, decreasing the demand for gold as a safe-haven asset.
These factors combined led to the significant drop in gold prices on January 30, 2026.
316
·
--
Gold, silver, and stocks are rising, while cryptocurrencies are "losing heat". This is not a coincidence, but a typical risk preference switch. When the market starts discussing "interest rate cut expectations", "weaker dollar", and "fiscal and geopolitical uncertainty", the first reaction of capital is never to gamble on volatility, but to seek certainty that can be accepted by the majority.
Gold breaking through the 5000 dollar mark is essentially not about optimism for the economy, but a repricing of the monetary system and credit structure; the stock market's simultaneous rise is also more about "asset inflation" driven by liquidity rather than a comprehensive reversal in fundamentals. In contrast, Bitcoin being marginalized at this time does not signify the end of the narrative, but rather its trading attributes being reclassified—high volatility, strong emotions, requiring clear catalysts.
What is truly noteworthy is the change in retail investors' behavior: shifting from chasing "potential doubling" to embracing "not likely to have issues". This indicates that the market has transitioned from the risk-taking phase to a defensive and reallocation phase. In this environment, those with the highest volatility are the first to be neglected.
When no one is optimistic, it might be time to pay attention!
Gold, silver, and stocks are rising, while cryptocurrencies are "losing heat". This is not a coincidence, but a typical risk preference switch. When the market starts discussing "interest rate cut expectations", "weaker dollar", and "fiscal and geopolitical uncertainty", the first reaction of capital is never to gamble on volatility, but to seek certainty that can be accepted by the majority.
Gold breaking through the 5000 dollar mark is essentially not about optimism for the economy, but a repricing of the monetary system and credit structure; the stock market's simultaneous rise is also more about "asset inflation" driven by liquidity rather than a comprehensive reversal in fundamentals. In contrast, Bitcoin being marginalized at this time does not signify the end of the narrative, but rather its trading attributes being reclassified—high volatility, strong emotions, requiring clear catalysts.
What is truly noteworthy is the change in retail investors' behavior: shifting from chasing "potential doubling" to embracing "not likely to have issues". This indicates that the market has transitioned from the risk-taking phase to a defensive and reallocation phase. In this environment, those with the highest volatility are the first to be neglected.
When no one is optimistic, it might be time to pay attention!
Gold breaking through the 5000 dollar mark is essentially not about optimism for the economy, but a repricing of the monetary system and credit structure; the stock market's simultaneous rise is also more about "asset inflation" driven by liquidity rather than a comprehensive reversal in fundamentals. In contrast, Bitcoin being marginalized at this time does not signify the end of the narrative, but rather its trading attributes being reclassified—high volatility, strong emotions, requiring clear catalysts.
What is truly noteworthy is the change in retail investors' behavior: shifting from chasing "potential doubling" to embracing "not likely to have issues". This indicates that the market has transitioned from the risk-taking phase to a defensive and reallocation phase. In this environment, those with the highest volatility are the first to be neglected.
When no one is optimistic, it might be time to pay attention!

1
896
·
--
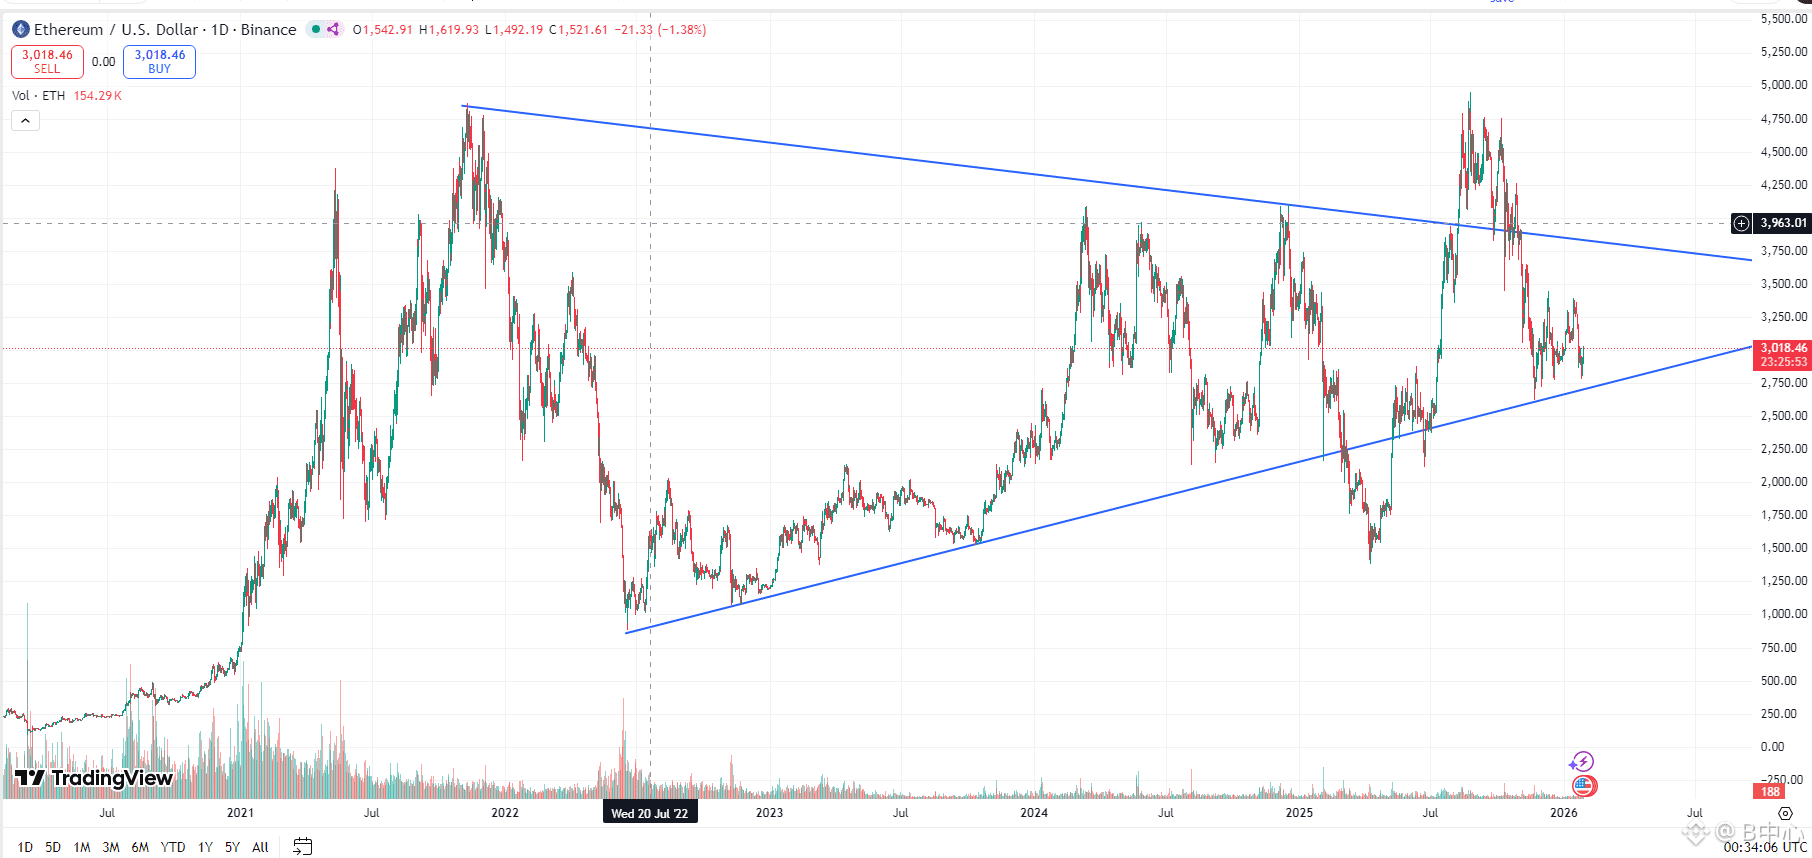
ETH (Ethereum) Daily Technical Analysis | 2026.01.28
From the daily chart you provided, Ethereum is currently at the terminal area of a large converging triangle. The upper trend line comes from the long-term downward trend line since the 2021 peak, while the lower trend line is formed by the upward trend line created by the low points of the 2022 bear market. The price is repeatedly compressing within the triangle, and both time and space are approaching the critical point for choosing a direction.
In the short term, after failing to rally above $4,000, ETH quickly retreated, indicating that the long-term downward trend line's pressure is still effective. The current price is consolidating around $3,000, which is a typical "pre-direction accumulation" range, rather than an emotional crash. Structurally, the pullback has not violated the higher low points since 2024, and the bullish structure has not been broken.
The key lies in the $2,800–$2,900 area, which is the resonance support of the triangle's lower edge and the previous dense trading area. If it effectively breaks below, ETH may look for mid-term support at $2,400–$2,500; conversely, as long as this area is held and it rises back above $3,300–$3,400, it conditions to challenge the long-term pressure zone of $3,900–$4,100 again.
Key levels:
Support levels: $2,900 / $2,500
Resistance levels: $3,400 / $4,100
In summary: Ethereum is at the end of a long-term triangular convergence, $3,000 is the watershed for bulls and bears, and it will trend either up or down.
ETH (Ethereum) Daily Technical Analysis | 2026.01.28
From the daily chart you provided, Ethereum is currently at the terminal area of a large converging triangle. The upper trend line comes from the long-term downward trend line since the 2021 peak, while the lower trend line is formed by the upward trend line created by the low points of the 2022 bear market. The price is repeatedly compressing within the triangle, and both time and space are approaching the critical point for choosing a direction.
In the short term, after failing to rally above $4,000, ETH quickly retreated, indicating that the long-term downward trend line's pressure is still effective. The current price is consolidating around $3,000, which is a typical "pre-direction accumulation" range, rather than an emotional crash. Structurally, the pullback has not violated the higher low points since 2024, and the bullish structure has not been broken.
The key lies in the $2,800–$2,900 area, which is the resonance support of the triangle's lower edge and the previous dense trading area. If it effectively breaks below, ETH may look for mid-term support at $2,400–$2,500; conversely, as long as this area is held and it rises back above $3,300–$3,400, it conditions to challenge the long-term pressure zone of $3,900–$4,100 again.
Key levels:
Support levels: $2,900 / $2,500
Resistance levels: $3,400 / $4,100
In summary: Ethereum is at the end of a long-term triangular convergence, $3,000 is the watershed for bulls and bears, and it will trend either up or down.
From the daily chart you provided, Ethereum is currently at the terminal area of a large converging triangle. The upper trend line comes from the long-term downward trend line since the 2021 peak, while the lower trend line is formed by the upward trend line created by the low points of the 2022 bear market. The price is repeatedly compressing within the triangle, and both time and space are approaching the critical point for choosing a direction.
In the short term, after failing to rally above $4,000, ETH quickly retreated, indicating that the long-term downward trend line's pressure is still effective. The current price is consolidating around $3,000, which is a typical "pre-direction accumulation" range, rather than an emotional crash. Structurally, the pullback has not violated the higher low points since 2024, and the bullish structure has not been broken.
The key lies in the $2,800–$2,900 area, which is the resonance support of the triangle's lower edge and the previous dense trading area. If it effectively breaks below, ETH may look for mid-term support at $2,400–$2,500; conversely, as long as this area is held and it rises back above $3,300–$3,400, it conditions to challenge the long-term pressure zone of $3,900–$4,100 again.
Key levels:
Support levels: $2,900 / $2,500
Resistance levels: $3,400 / $4,100
In summary: Ethereum is at the end of a long-term triangular convergence, $3,000 is the watershed for bulls and bears, and it will trend either up or down.
1
85
·
--
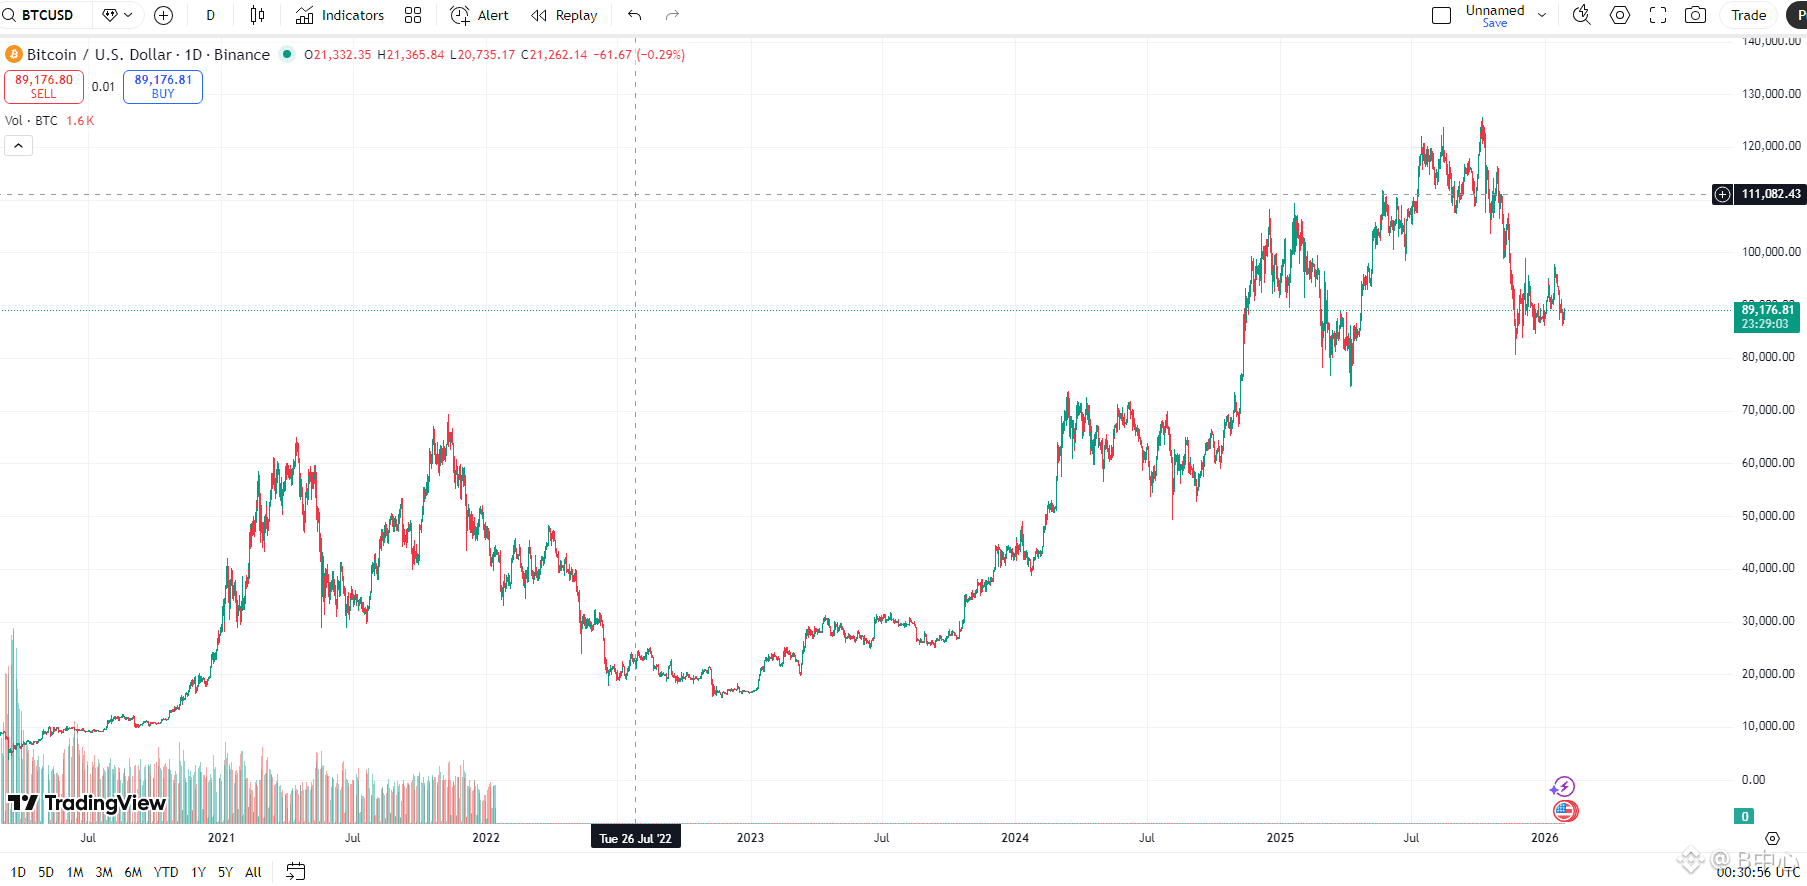
BTC (Bitcoin) Daily Technical Analysis | 2026.01.28
From the daily structure, Bitcoin is still in the high-level adjustment phase of the bull market's main trend. The previous main upward wave that started from 36,000 formed a temporary top around the 118,000–120,000 range and then entered a noticeable pullback and wide fluctuations. Currently, the price is running around 89,000, which is a mid-term correction of the previous main upward wave rather than a trend reversal.
Structurally, the current low has not effectively broken below the key support area of 82,000–80,000, which is both the breakout platform from earlier and an important defensive position for the mid-term bulls, indicating that long-term capital is still observing in the market. At the same time, the rebound high continues to be constrained by the 98,000–100,000 pressure, indicating that short-term bullish momentum is insufficient, and the market still needs time to digest the high-level chips.
If the daily line subsequently breaks below 80,000, the market may expand the adjustment space towards 72,000–70,000; conversely, if it can stabilize above 100,000 again, there is hope to test the previous high area above 115,000.
Key Levels:
Support: 82,000 / 80,000
Resistance: 100,000 / 112,000
Summary in One Sentence: Bitcoin is still oscillating within the structure of the bull market, with 80,000 being the bullish bottom line. As long as it is not broken, it should be viewed as an adjustment rather than a reversal.
BTC (Bitcoin) Daily Technical Analysis | 2026.01.28
From the daily structure, Bitcoin is still in the high-level adjustment phase of the bull market's main trend. The previous main upward wave that started from 36,000 formed a temporary top around the 118,000–120,000 range and then entered a noticeable pullback and wide fluctuations. Currently, the price is running around 89,000, which is a mid-term correction of the previous main upward wave rather than a trend reversal.
Structurally, the current low has not effectively broken below the key support area of 82,000–80,000, which is both the breakout platform from earlier and an important defensive position for the mid-term bulls, indicating that long-term capital is still observing in the market. At the same time, the rebound high continues to be constrained by the 98,000–100,000 pressure, indicating that short-term bullish momentum is insufficient, and the market still needs time to digest the high-level chips.
If the daily line subsequently breaks below 80,000, the market may expand the adjustment space towards 72,000–70,000; conversely, if it can stabilize above 100,000 again, there is hope to test the previous high area above 115,000.
Key Levels:
Support: 82,000 / 80,000
Resistance: 100,000 / 112,000
Summary in One Sentence: Bitcoin is still oscillating within the structure of the bull market, with 80,000 being the bullish bottom line. As long as it is not broken, it should be viewed as an adjustment rather than a reversal.
From the daily structure, Bitcoin is still in the high-level adjustment phase of the bull market's main trend. The previous main upward wave that started from 36,000 formed a temporary top around the 118,000–120,000 range and then entered a noticeable pullback and wide fluctuations. Currently, the price is running around 89,000, which is a mid-term correction of the previous main upward wave rather than a trend reversal.
Structurally, the current low has not effectively broken below the key support area of 82,000–80,000, which is both the breakout platform from earlier and an important defensive position for the mid-term bulls, indicating that long-term capital is still observing in the market. At the same time, the rebound high continues to be constrained by the 98,000–100,000 pressure, indicating that short-term bullish momentum is insufficient, and the market still needs time to digest the high-level chips.
If the daily line subsequently breaks below 80,000, the market may expand the adjustment space towards 72,000–70,000; conversely, if it can stabilize above 100,000 again, there is hope to test the previous high area above 115,000.
Key Levels:
Support: 82,000 / 80,000
Resistance: 100,000 / 112,000
Summary in One Sentence: Bitcoin is still oscillating within the structure of the bull market, with 80,000 being the bullish bottom line. As long as it is not broken, it should be viewed as an adjustment rather than a reversal.
70
·
--
The reason this image is so striking is not due to exaggeration, but because it is brutally real: the same Samsung 16G DDR5 memory stick, within a year, has seen its price jump from 758 yuan to 5500 yuan, with an increase not at the inflation level, but at the financial asset level. You thought you were buying computer components, but what you actually hold is 'hardware futures'.
On the surface, this is the result of supply and demand imbalance, capacity allocation, and AI servers occupying production lines; but looking deeper, it is a reflection of the recalibration of physical resources in the era of computing power. Memory is no longer just an accessory of consumer electronics, but the core consumable of the computing power system—AI does not consume emotions, does not tell stories, it only consumes video memory and RAM, and it consumes tons of it.
Ironically, most people are completely unprepared for this change. In the past, wealth was measured by real estate, gold, and stocks; now it may require an additional criterion: do you have computing power hard currency in hand? When capital, models, and data can all be virtualized, what truly becomes a bottleneck are these seemingly 'most ordinary' industrial components.
Thus, the absurdity of this screenshot does not stem from the price, but from the cognitive gap: the old world is still discussing consumption upgrades, while the new world is already pricing the future with memory sticks.
In summary: when memory sticks start to be priced like gold, what is truly scarce is no longer money, but access to computing power.
The reason this image is so striking is not due to exaggeration, but because it is brutally real: the same Samsung 16G DDR5 memory stick, within a year, has seen its price jump from 758 yuan to 5500 yuan, with an increase not at the inflation level, but at the financial asset level. You thought you were buying computer components, but what you actually hold is 'hardware futures'.
On the surface, this is the result of supply and demand imbalance, capacity allocation, and AI servers occupying production lines; but looking deeper, it is a reflection of the recalibration of physical resources in the era of computing power. Memory is no longer just an accessory of consumer electronics, but the core consumable of the computing power system—AI does not consume emotions, does not tell stories, it only consumes video memory and RAM, and it consumes tons of it.
Ironically, most people are completely unprepared for this change. In the past, wealth was measured by real estate, gold, and stocks; now it may require an additional criterion: do you have computing power hard currency in hand? When capital, models, and data can all be virtualized, what truly becomes a bottleneck are these seemingly 'most ordinary' industrial components.
Thus, the absurdity of this screenshot does not stem from the price, but from the cognitive gap: the old world is still discussing consumption upgrades, while the new world is already pricing the future with memory sticks.
In summary: when memory sticks start to be priced like gold, what is truly scarce is no longer money, but access to computing power.
On the surface, this is the result of supply and demand imbalance, capacity allocation, and AI servers occupying production lines; but looking deeper, it is a reflection of the recalibration of physical resources in the era of computing power. Memory is no longer just an accessory of consumer electronics, but the core consumable of the computing power system—AI does not consume emotions, does not tell stories, it only consumes video memory and RAM, and it consumes tons of it.
Ironically, most people are completely unprepared for this change. In the past, wealth was measured by real estate, gold, and stocks; now it may require an additional criterion: do you have computing power hard currency in hand? When capital, models, and data can all be virtualized, what truly becomes a bottleneck are these seemingly 'most ordinary' industrial components.
Thus, the absurdity of this screenshot does not stem from the price, but from the cognitive gap: the old world is still discussing consumption upgrades, while the new world is already pricing the future with memory sticks.
In summary: when memory sticks start to be priced like gold, what is truly scarce is no longer money, but access to computing power.

1
1
276
·
--
The phrase "turtleneck sweaters are uncomfortable" essentially exposes a long-ignored misconception: many people think that discomfort is just being picky; in reality, it is the body sounding an alarm.
The "suffocating feeling" caused by turtleneck clothing is not a psychological effect, but a real response from the carotid sinus, a delicate and intricate physiological switch that is continuously stimulated. Once compressed, it leads to a slowed heart rate, decreased blood pressure, and reduced blood supply to the brain, resulting in mild symptoms like dizziness and nausea, or in severe cases, fainting—this is not something that can simply be tolerated with a little discomfort; it is a neurological reflex intervening forcefully.
What is even more concerning is that this risk is not evenly distributed. The elderly, those with cardiovascular diseases, children, and people with allergies are all high-risk groups affected by turtlenecks. However, in reality, the logic of keeping warm is often simplistic and crude: the tighter the fit, the warmer it is; the more covered up, the safer it seems. The result is that the body has to pay an additional price to maintain basic stability.
This also reminds us of a larger issue: modern people are too accustomed to ignoring the subtleties of their body's signals. Dizziness, nausea, irritation are easily attributed to "ill-fitting clothes" or "being too sensitive," rather than stopping to reassess whether the way we dress contradicts physiological principles.
The phrase "turtleneck sweaters are uncomfortable" essentially exposes a long-ignored misconception: many people think that discomfort is just being picky; in reality, it is the body sounding an alarm.
The "suffocating feeling" caused by turtleneck clothing is not a psychological effect, but a real response from the carotid sinus, a delicate and intricate physiological switch that is continuously stimulated. Once compressed, it leads to a slowed heart rate, decreased blood pressure, and reduced blood supply to the brain, resulting in mild symptoms like dizziness and nausea, or in severe cases, fainting—this is not something that can simply be tolerated with a little discomfort; it is a neurological reflex intervening forcefully.
What is even more concerning is that this risk is not evenly distributed. The elderly, those with cardiovascular diseases, children, and people with allergies are all high-risk groups affected by turtlenecks. However, in reality, the logic of keeping warm is often simplistic and crude: the tighter the fit, the warmer it is; the more covered up, the safer it seems. The result is that the body has to pay an additional price to maintain basic stability.
This also reminds us of a larger issue: modern people are too accustomed to ignoring the subtleties of their body's signals. Dizziness, nausea, irritation are easily attributed to "ill-fitting clothes" or "being too sensitive," rather than stopping to reassess whether the way we dress contradicts physiological principles.
The "suffocating feeling" caused by turtleneck clothing is not a psychological effect, but a real response from the carotid sinus, a delicate and intricate physiological switch that is continuously stimulated. Once compressed, it leads to a slowed heart rate, decreased blood pressure, and reduced blood supply to the brain, resulting in mild symptoms like dizziness and nausea, or in severe cases, fainting—this is not something that can simply be tolerated with a little discomfort; it is a neurological reflex intervening forcefully.
What is even more concerning is that this risk is not evenly distributed. The elderly, those with cardiovascular diseases, children, and people with allergies are all high-risk groups affected by turtlenecks. However, in reality, the logic of keeping warm is often simplistic and crude: the tighter the fit, the warmer it is; the more covered up, the safer it seems. The result is that the body has to pay an additional price to maintain basic stability.
This also reminds us of a larger issue: modern people are too accustomed to ignoring the subtleties of their body's signals. Dizziness, nausea, irritation are easily attributed to "ill-fitting clothes" or "being too sensitive," rather than stopping to reassess whether the way we dress contradicts physiological principles.

27
Log in to explore more content
Join global crypto users on Binance Square
⚡️ Get latest and useful information about crypto.
💬 Trusted by the world’s largest crypto exchange.
👍 Discover real insights from verified creators.
Email / Phone number
Trending Topics
SaylorHintsStrategyBitcoinBuy
2.2M views
11,092 Discussing
If you’re still treating every Saylor hint as an automatic buy signal, stop now.
The expensive mistake is confusing a company’s long-term treasury strategy with your own risk tolerance. Strategy can sit through brutal drawdowns, while FOMO buyers often panic-sell $BTC after one ugly candle.
Saylor’s latest signals feel familiar because Strategy has repeatedly used weakness to build its Bitcoin position, turning volatility into accumulation. But the market is different now: spot demand, macro liquidity, and competing corporate treasury plays all influence price instead of one loud buyer dominating the narrative.
With Fear & Greed at 75, the crowd is already leaning greedy. That makes the comparison with past Bitcoin rallies uncomfortable: strong conviction can fuel upside, but crowded conviction can also create the exit liquidity nobody wants to discuss. Even traders rotating through $USDT or watching $ONDO are asking the same question: is this accumulation, or just narrative chasing?
Is Saylor’s approach still the smartest Bitcoin treasury strategy, or are investors overestimating how much one buyer can move this market? #SaylorHintsStrategyBitcoinBuy #BitcoinHolds #BitcoinUp23
minamium
·1 Likes
·85 views
BOJRaisesRatesTo31YearHigh
164,500 views
2,512 Discussing
BuffettStepsDownAsBerkshireChairman
79,155 views
1,287 Discussing